A Comprehensive Guide to Sample Preparation for PARP-1 Cleavage Detection in Neuronal Cells: From Foundational Principles to Advanced Validation
This article provides a detailed methodological framework for the detection of PARP-1 cleavage, a critical biomarker of apoptosis and other cell death pathways, in neuronal cells.
A Comprehensive Guide to Sample Preparation for PARP-1 Cleavage Detection in Neuronal Cells: From Foundational Principles to Advanced Validation
Abstract
This article provides a detailed methodological framework for the detection of PARP-1 cleavage, a critical biomarker of apoptosis and other cell death pathways, in neuronal cells. Tailored for researchers, scientists, and drug development professionals in neuroscience and oncology, the content spans from foundational biology to advanced technical validation. We cover the significance of the characteristic 89 kDa and 24 kDa PARP-1 fragments, offer step-by-step protocols for sample preparation from neuronal cultures, address common troubleshooting scenarios, and outline rigorous validation techniques. This guide aims to ensure accurate and reproducible detection of PARP-1 cleavage to support research in neurodegeneration, neurotoxicity, and the evaluation of PARP-targeted therapeutics.
Understanding PARP-1 Biology and Cleavage Significance in Neuronal Contexts
Poly(ADP-ribose) polymerase-1 (PARP-1), also known as ARTD1, is a ubiquitous nuclear enzyme that functions as a crucial molecular switch in cellular stress responses [1]. As a DNA damage sensor, PARP-1 plays a pivotal role in maintaining genomic integrity through its involvement in DNA repair processes [2]. However, under conditions of severe genotoxic stress, this protective guardian undergoes dramatic functional conversion to become a promoter of cell death pathways [3] [2]. This dualistic nature positions PARP-1 at the critical juncture between cell survival and death, making it a protein of considerable interest in neuronal cell research and therapeutic development. The proper detection of PARP-1 and its cleavage fragments is therefore essential for accurately interpreting cellular responses to stress in experimental models, particularly in the vulnerable context of neuronal cells.
PARP-1's functions are intimately connected to cellular energy metabolism through its consumption of NAD+ during catalysis. When activated by DNA strand breaks, PARP-1 catalyzes the transfer of ADP-ribose units from NAD+ to target proteins, including itself, in a process known as poly(ADP-ribosyl)ation (PARylation) [3]. This post-translational modification facilitates DNA repair by recruiting repair machinery and promoting chromatin relaxation. However, under conditions of excessive DNA damage, PARP-1 overactivation can lead to catastrophic NAD+ and ATP depletion, triggering energy failure and cell death [3]. Additionally, PARP-1 undergoes specific proteolytic cleavage during apoptosis, generating signature fragments that serve as important biomarkers for distinguishing between different cell death modalities in neuronal research.
PARP-1 Structure and Cleavage Fragments
Domain Architecture and Cleavage Sites
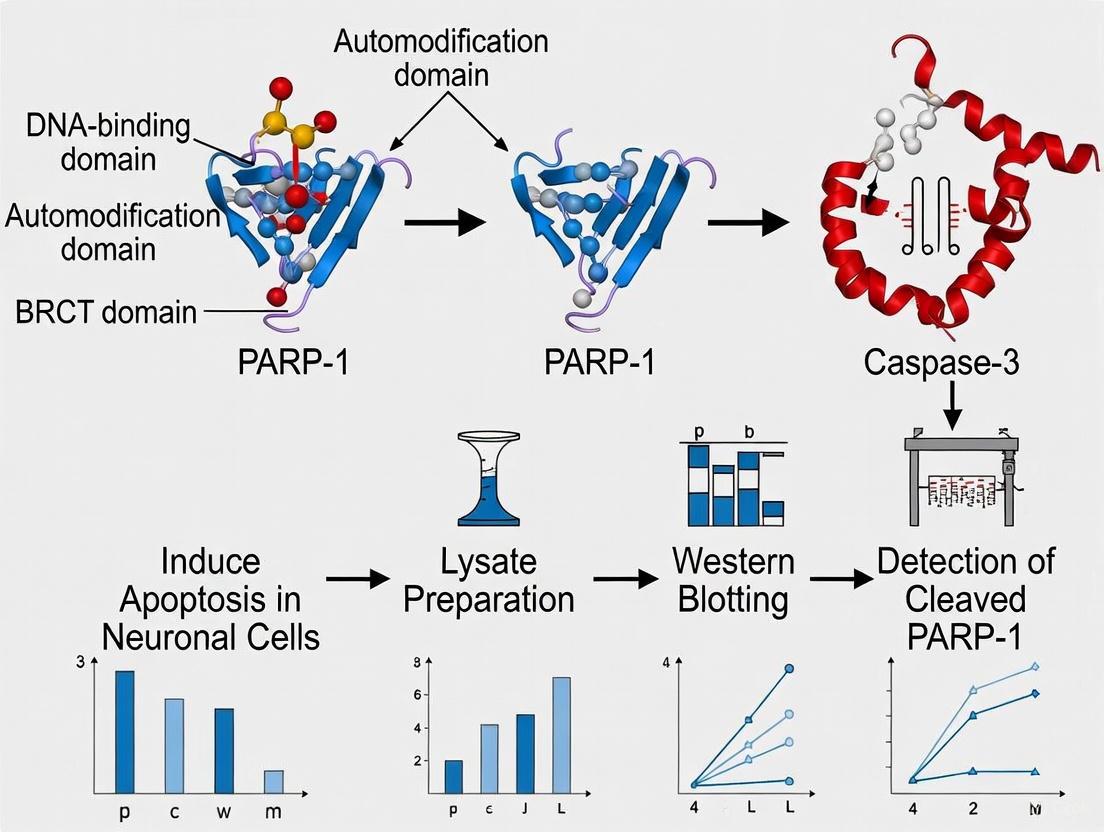
PARP-1 is a modular protein comprising several functional domains that dictate its activity and fate during cellular stress. The N-terminal region contains three zinc finger motifs (ZnF1, ZnF2, ZnF3) that facilitate DNA damage recognition, followed by a nuclear localization signal (NLS) and a caspase cleavage site (DEVD214) [4]. The central automodification domain regulates PARP-1 activity through self-PARylation, while the C-terminal region houses the catalytic domain responsible for PAR polymer formation [4]. During apoptosis, activated caspase-3 and caspase-7 cleave PARP-1 at the conserved DEVD214 site, separating the N-terminal DNA-binding domain (24 kDa) from the C-terminal catalytic domain (89 kDa) [5] [6]. This proteolytic event serves as a hallmark of apoptosis and has significant functional consequences for cell death execution.
Table 1: PARP-1 Domains and Cleavage Products
| Domain/Region | Molecular Weight | Function | Location in Protein |
|---|---|---|---|
| Zinc Finger 1 & 2 | - | DNA damage recognition | N-terminal (aa 1-214) |
| Caspase Cleavage Site | - | DEVD214 motif targeted by caspase-3/7 | Between ZnF2 and ZnF3 |
| 24 kDa Fragment | 24 kDa | DNA-binding; remains nuclear after cleavage | N-terminal (aa 1-214) |
| Zinc Finger 3 | - | DNA binding | - |
| BRCT Domain | - | Protein-protein interactions | - |
| WGR Domain | - | DNA binding and oligomerization | - |
| Catalytic Domain | - | PAR polymer formation | C-terminal |
| 89 kDa Fragment | 89 kDa | Contains catalytic activity; translocates to cytoplasm | C-terminal (aa 215-1014) |
Consequences of PARP-1 Cleavage
The caspase-mediated cleavage of PARP-1 serves two primary biological functions. First, it inactivates PARP-1's DNA repair capacity by separating the DNA-binding domains from the catalytic domain, thereby preventing excessive NAD+ consumption and preserving cellular energy stores during apoptosis [4] [6]. Second, the cleavage generates fragments with distinct subcellular localizations and novel functions. While the 24 kDa fragment remains nuclear due to its nuclear localization sequence, the 89 kDa truncated PARP-1 (tPARP1) translocates to the cytoplasm where it can engage in non-canonical signaling pathways [7]. Recent research has revealed that tPARP1 retains catalytic activity and can mono-ADP-ribosylate cytoplasmic targets, including components of the RNA polymerase III complex, potentially amplifying apoptotic signaling and immune responses [7].
PARP-1 Signaling Pathways in Cell Fate Decisions
The decision between DNA repair and cell death initiation depends on the intensity and duration of the stress signal, with PARP-1 acting as a critical molecular interpreter.
Survival Pathway: DNA Repair and Cell Protection
Under conditions of mild genotoxic stress, PARP-1 functions as a survival factor by detecting DNA strand breaks and initiating the DNA damage response. Upon binding to DNA lesions, PARP-1 undergoes rapid activation and synthesizes PAR chains on itself and other nuclear proteins, including histones [3] [1]. This PARylation serves as a recruitment signal for DNA repair enzymes and promotes chromatin relaxation, facilitating efficient DNA repair. In neuronal cells, PARP-1 activity has been shown to promote sleep states that enhance DNA repair capacity, highlighting its neuroprotective functions [8]. The automodification of PARP-1 also regulates its own dissociation from DNA, allowing repair machinery access to damage sites while preventing excessive PARP-1 activation.
Cell Death Pathways: Apoptosis and Beyond
When DNA damage exceeds repair capacity, PARP-1 initiates cell death through multiple interconnected pathways. Extensive PARP-1 activation depletes cellular NAD+ and ATP pools, leading to energy failure and necrotic cell death [3]. Concurrently, PARP-1 cleavage by activated caspases serves as both a marker and mediator of apoptotic commitment. The 89 kDa tPARP1 fragment translocates to the cytoplasm where it can engage novel substrates, including the RNA polymerase III complex, potentially linking apoptosis to innate immune activation through interferon-β production [7]. PARP-1 also promotes apoptosis through regulation of apoptosis-inducing factor (AIF), which translocates from mitochondria to the nucleus upon PARP-1 activation, triggering caspase-independent chromatin condensation and DNA fragmentation [3]. In neuronal cells, this cell death promotion must be carefully balanced against survival signaling, with cleavage events serving as critical indicators of pathway commitment.
Detection of PARP-1 Cleavage in Neuronal Cells
Antibody-Based Detection Methods
Western blotting remains the gold standard for detecting PARP-1 cleavage in neuronal cell extracts. The characteristic shift from full-length PARP-1 (116 kDa) to the 89 kDa cleavage fragment provides a definitive apoptotic marker. Researchers can employ either general PARP-1 antibodies that recognize both full-length and cleaved forms, or cleavage-specific antibodies that exclusively detect the 89 kDa fragment.
Table 2: Antibodies for PARP-1 Cleavage Detection
| Antibody Specificity | Target Epitope | Recognized Bands | Applications | Example Products |
|---|---|---|---|---|
| Total PARP-1 | C-terminal region | 116 kDa (full-length) and 89 kDa (cleaved) | Western Blot, Simple Western | Cell Signaling #9542 [5] |
| Cleaved PARP-1 (specific) | N-terminus of cleavage site (Asp214) | 89 kDa fragment only | Western Blot | Abcam ab4830 [6] |
| PAR polymer | Poly(ADP-ribose) chains | Poly(ADP-ribosyl)ated proteins | Western Blot, Immunofluorescence | Biomol International [3] |
The Cell Signaling Technology PARP Antibody #9542 detects endogenous levels of both full-length PARP1 (116 kDa) and the large fragment (89 kDa) resulting from caspase cleavage, making it suitable for assessing the cleavage ratio [5]. For specific detection of the apoptotic fragment, the Anti-Cleaved PARP1 antibody (ab4830) from Abcam recognizes the 85-89 kDa fragment created by cleavage at Asp214 and does not cross-react with full-length PARP1, providing higher specificity for apoptosis assessment [6].
Subcellular Localization Assessment
Beyond Western blotting, immunofluorescence microscopy enables researchers to visualize the subcellular redistribution of PARP-1 and its cleavage fragments during apoptosis. In healthy neuronal cells, PARP-1 exhibits predominantly nuclear localization. During apoptosis, the 89 kDa tPARP1 fragment translocates to the cytoplasm while the 24 kDa fragment remains nuclear [7]. This redistribution can be visualized using antibodies targeting different PARP-1 domains combined with nuclear counterstains. Additionally, the cytoplasmic accumulation of other PARP-1-related proteins, such as HuR (which is regulated by PAR-binding), provides complementary information about apoptotic progression [9].
Detailed Protocols for PARP-1 Cleavage Analysis
Sample Preparation from Neuronal Cells
Proper sample preparation is critical for accurate PARP-1 cleavage detection. For primary neuronal cultures or neuronal cell lines, the following protocol ensures preservation of cleavage fragments:
Materials:
- RIPA lysis buffer: 50 mM Tris-HCl (pH 7.4), 150 mM NaCl, 1% NP-40, 0.5% sodium deoxycholate, 0.1% SDS
- Protease inhibitor cocktail
- Caspase inhibitors (for prevention of artifactual cleavage during preparation)
- Phosphatase inhibitors
- BCA protein assay kit
Procedure:
- Wash neuronal cells twice with ice-cold PBS.
- Lyse cells in RIPA buffer supplemented with protease inhibitors (1:100 dilution), phosphatase inhibitors (1:100 dilution), and if appropriate, caspase inhibitors (20 µM) to prevent post-lysis cleavage.
- Incubate on ice for 15 minutes with occasional vortexing.
- Centrifuge at 14,000 × g for 15 minutes at 4°C to pellet insoluble material.
- Transfer supernatant to a fresh tube and determine protein concentration using BCA assay.
- Mix samples with 4× Laemmli buffer, boil at 95-100°C for 5 minutes, and store at -80°C until use.
For subcellular fractionation to assess PARP-1 fragment localization:
- Harvest cells and resuspend in hypotonic buffer (10 mM HEPES, 1.5 mM MgCl2, 10 mM KCl, protease inhibitors).
- Incubate on ice for 15 minutes, then homogenize with 20-30 strokes in a Dounce homogenizer.
- Centrifuge at 1,000 × g for 10 minutes to collect nuclear fraction.
- Centrifuge supernatant at 100,000 × g for 30 minutes to obtain cytosolic fraction.
- Extract nuclear proteins with high-salt buffer (20 mM HEPES, 1.5 mM MgCl2, 420 mM NaCl, 25% glycerol, protease inhibitors).
Western Blot Protocol for PARP-1 Cleavage Detection
Materials:
- SDS-PAGE gel: 8-10% acrylamide for optimal separation of 116 kDa and 89 kDa fragments
- Transfer apparatus for wet or semi-dry transfer
- PVDF or nitrocellulose membrane
- Primary antibodies against PARP-1 and loading controls (β-actin, GAPDH, histone H3 for nuclear fractions)
- HRP-conjugated secondary antibodies
- Enhanced chemiluminescence (ECL) detection reagents
Procedure:
- Load 20-40 µg of protein per lane alongside pre-stained protein molecular weight markers.
- Separate proteins by SDS-PAGE at 100-120 V for 1-2 hours.
- Transfer to PVDF membrane at 100 V for 1 hour or 25 V overnight at 4°C.
- Block membrane with 5% non-fat milk in TBST for 1 hour at room temperature.
- Incubate with primary antibody diluted in blocking buffer overnight at 4°C:
- Anti-PARP-1 (total): 1:1000 dilution
- Anti-cleaved PARP-1: 1:1000 dilution
- Loading control: 1:2000-1:5000 dilution
- Wash membrane 3× with TBST for 10 minutes each.
- Incubate with appropriate HRP-conjugated secondary antibody (1:2000-1:5000) for 1 hour at room temperature.
- Wash membrane 3× with TBST for 10 minutes each.
- Develop with ECL reagent and image using chemiluminescence detection system.
Data Interpretation and Quantification
When analyzing results, calculate the ratio of cleaved PARP-1 (89 kDa) to full-length PARP-1 (116 kDa) to assess the extent of apoptosis. Neuronal cultures typically show increased basal PARP-1 expression compared to other cell types, so appropriate loading controls and normalization are essential. Include both positive controls (e.g., neuronal cells treated with 1 µM staurosporine for 3-6 hours) and negative controls (caspase inhibitor pretreatment) to validate assay performance.
Research Reagent Solutions for PARP-1 Studies
Table 3: Essential Reagents for PARP-1 Cleavage Research
| Reagent Category | Specific Examples | Function/Application | Considerations for Neuronal Cells |
|---|---|---|---|
| PARP-1 Antibodies | CST #9542, Abcam ab4830 | Detection of full-length and cleaved PARP-1 | Validate cross-reactivity for specific model organisms |
| Caspase Inhibitors | z-VAD-fmk (pan-caspase) | Prevent artifactual cleavage during processing | Use fresh preparations; optimize concentration |
| Apoptosis Inducers | Staurosporine, Etoposide | Positive controls for PARP-1 cleavage | Titrate for neuronal-specific response |
| PARP Inhibitors | PJ-34, Olaparib | Investigate PARP-1 function in cell death | Consider effects on neuronal viability |
| Protein Extraction | RIPA buffer, NE-PER kits | Prepare samples for Western blotting | Include protease inhibitors, especially for primary neurons |
| Detection Reagents | ECL substrates, fluorescent secondaries | Visualize PARP-1 bands | Optimize for sensitivity and linear range |
| Loading Controls | β-actin, GAPDH, Histone H3 | Normalize protein loading | Use nuclear-specific controls for fractionation studies |
Troubleshooting and Technical Considerations
Common Challenges in PARP-1 Cleavage Detection
Several technical challenges may arise when studying PARP-1 cleavage in neuronal cells. Incomplete separation of the 116 kDa and 89 kDa bands can be addressed by optimizing gel percentage (8-10% acrylamide) and electrophoresis conditions. High background on Western blots may require increased blocking time or alternative blocking agents. Neuronal-specific considerations include higher basal PARP-1 expression and potential interference from neuronal-specific proteins; these can be mitigated through appropriate controls and antibody validation.
For primary neuronal cultures, which are particularly sensitive to stress-induced apoptosis, researchers should include caspase inhibitors during sample preparation unless specifically measuring apoptotic progression. Additionally, the timing of analysis is critical, as PARP-1 cleavage represents a mid-to-late apoptotic event that may occur after other biochemical changes. Combining PARP-1 cleavage analysis with additional apoptosis markers (caspase-3 activation, Annexin V staining) provides a more comprehensive assessment of cell death status.
PARP-1's transition from DNA repair guardian to cell death signal represents a critical decision point in cellular stress response pathways. In neuronal research, the detection of PARP-1 cleavage provides invaluable insight into apoptotic commitment and cellular viability. The protocols and reagents outlined in this application note provide researchers with robust methods for assessing this key molecular event, facilitating accurate interpretation of experimental outcomes in neuronal cell models. As research continues to unveil the complex roles of PARP-1 cleavage fragments in signaling pathways, proper detection methodologies remain fundamental to advancing our understanding of cell fate decisions in neurological health and disease.
Poly(ADP-ribose) polymerase 1 (PARP-1) is a nuclear enzyme with a fundamental role in maintaining genomic stability through its involvement in the routine repair of DNA damage [10]. As a DNA damage sensor, PARP-1 catalyzes the transfer of ADP-ribose units from NAD+ to target proteins, a process known as poly(ADP-ribosyl)ation, which facilitates the recruitment of DNA repair machinery to lesion sites [11] [12]. The full-length PARP-1 protein has a molecular weight of 116-kDa and consists of three primary domains: an N-terminal DNA-binding domain (DBD) containing two zinc finger motifs, a central automodification domain (AMD), and a C-terminal catalytic domain (CD) [11] [10].
PARP-1 is a preferred substrate for several proteases, often termed 'suicidal' proteases, including caspases, calpains, cathepsins, granzymes, and matrix metalloproteinases (MMPs) [10]. The proteolytic cleavage of PARP-1 by these enzymes produces specific fragments that serve as recognizable biomarkers for particular protease activities and cell death pathways [10]. Among these, the most extensively characterized cleavage occurs during caspase-dependent apoptosis, where caspases-3 and -7 cleave PARP-1 at the DEVD214 site located within a nuclear localization signal near the DNA-binding domain [11] [4]. This proteolytic event generates two signature fragments: a 24-kDa fragment containing the DNA-binding domain and a 89-kDa fragment containing the automodification and catalytic domains [11] [13]. The appearance of these fragments is widely considered a biochemical hallmark of apoptosis and serves as a critical proteolytic signature in cellular stress responses [10] [13].
Biological Significance of the 89 kDa and 24 kDa Fragments
Distinct Cellular Roles and Fates
The 24-kDa and 89-kDa PARP-1 fragments exhibit distinct subcellular localization and biological functions following cleavage. The 24-kDa fragment, which contains the DNA-binding motif and nuclear localization signal, remains associated with DNA lesions in the nucleus where it acts as a trans-dominant inhibitor of active PARP-1 [11] [10]. This irreversible binding to strand breaks effectively suppresses DNA repair processes, thereby facilitating caspase-mediated DNA fragmentation during apoptosis [11].
In contrast, the 89-kDa fragment is translocated from the nucleus to the cytoplasm [11] [12]. This fragment contains the automodification and catalytic domains and can carry covalently attached poly(ADP-ribose) (PAR) polymers to the cytoplasmic compartment [12]. Once in the cytoplasm, the PAR polymers attached to the 89-kDa fragment facilitate apoptosis-inducing factor (AIF) release from mitochondria by binding to AIF, which subsequently translocates to the nucleus and induces large-scale DNA fragmentation [11] [12]. Thus, the 89-kDa PARP-1 fragment serves as a critical PAR carrier from the nucleus to the cytoplasm, connecting caspase activation to AIF-mediated cell death pathways [12].
Opposing Effects on Cell Viability and Inflammation
Research using in vitro models of ischemia has demonstrated that the PARP-1 cleavage fragments exert opposing effects on cellular viability and inflammatory responses. Expression of the 24-kDa fragment or an uncleavable PARP-1 mutant (PARP-1UNCL) confers protection from oxygen/glucose deprivation (OGD) damage in neuronal cells, whereas expression of the 89-kDa fragment is consistently cytotoxic [4] [14]. These differential effects on cell survival occur without significant changes in cellular PAR or NAD+ levels, suggesting mechanisms independent of energy depletion [4].
PARP-1 is a known cofactor for NF-κB, and its cleavage fragments differentially modulate inflammatory signaling pathways. Expression of the cytotoxic 89-kDa fragment induces significantly higher NF-κB activity and NF-κB-dependent iNOS promoter binding activity compared to wild-type PARP-1 [4] [14]. This enhanced inflammatory signaling is accompanied by increased protein expression of COX-2 and iNOS, along with decreased expression of the anti-apoptotic protein Bcl-xL [4] [14]. Conversely, the cytoprotective 24-kDa fragment and uncleavable PARP-1 reduce iNOS and COX-2 expression while increasing Bcl-xL levels [14]. These findings establish that PARP-1 cleavage products differentially regulate cellular viability and inflammatory responses during ischemic stress, with the 89-kDa fragment promoting cell death and inflammation while the 24-kDa fragment exerts protective effects [4] [14].
Table 1: Characteristics and Functions of PARP-1 Cleavage Fragments
| Fragment | Molecular Weight | Domains Contained | Subcellular Localization | Primary Functions |
|---|---|---|---|---|
| 24-kDa | 24 kDa | DNA-binding domain (DBD) with zinc finger motifs | Nuclear | Trans-dominant inhibitor of DNA repair; cytoprotective in ischemia; modulates NF-κB signaling |
| 89-kDa | 89 kDa | Automodification domain (AMD) and catalytic domain (CD) | Cytoplasmic (after translocation) | PAR carrier to cytoplasm; induces AIF release from mitochondria; cytotoxic; enhances NF-κB and iNOS activity |
PARP-1 Cleavage in Neurodegenerative Contexts
In the central nervous system, PARP-1 cleavage fragments play significant roles in the pathophysiology of various neurodegenerative conditions. PARP inhibition attenuates neuronal injury in cerebral ischemia, trauma, and excitotoxicity, demonstrating the central role of PARP-1 in these pathologies [10]. Cleavage of PARP-1 by caspase-3 has been specifically implicated in several neurological diseases including Alzheimer's disease, multiple sclerosis, Parkinson's disease, traumatic brain injury, and NMDA-mediated excitotoxicity [10].
The presence of specific PARP-1 cleavage fragments serves as a signature for particular protease activities in unique cell death programs operational in neurodegenerative disorders [10]. Beyond caspase-mediated cleavage, other proteases including calpains, cathepsins, and granzymes can process PARP-1 into distinct fragments ranging from 42-89 kDa, providing a molecular fingerprint of the specific cell death pathways activated in different pathological contexts [10] [13]. This understanding of PARP-1 cleavage as a proteolytic signature has significant implications for developing targeted therapeutic strategies for neurodegenerative diseases.
Experimental Protocols for Detecting PARP-1 Cleavage
Sample Preparation for PARP-1 Cleavage Detection
Proper sample preparation is critical for accurate detection of PARP-1 cleavage fragments in neuronal cells. The following protocol is optimized for primary cortical neurons or neuronal cell lines such as SH-SY5Y:
Cell Culture and Treatment:
- Culture SH-SY5Y cells in Dulbecco's modified Eagle's medium (DMEM) supplemented with 10% heat-inactivated fetal bovine serum, 100 U/ml penicillin, and 100 mg/ml streptomycin at 37°C in 5% CO₂ [4].
- For primary cortical neurons, isolate neurons from Sprague-Dawley rats at postnatal day 2 (P2) and culture in Neurobasal Medium-A supplemented with B27 [4].
- Induce apoptosis using 1 μM staurosporine for 3-4 hours or subject cells to oxygen/glucose deprivation (OGD) for 6 hours followed by restoration of oxygen and glucose (ROG) for 15 hours to simulate ischemic conditions [4] [15] [16].
Cell Lysis:
Inhibition Controls:
- Include control samples treated with caspase inhibitors (e.g., zVAD-fmk, 20-50 μM) or PARP inhibitors (e.g., PJ34, ABT888, 10-20 μM) to validate the specificity of cleavage detection [11].
Immunoblotting Protocol for PARP-1 Cleavage Fragments
Western blotting remains the most widely used method for detecting PARP-1 cleavage fragments:
Gel Electrophoresis:
- Load 20-40 μg of total protein per lane on 4-12% Bis-Tris polyacrylamide gels.
- Perform electrophoresis at 120-150 V for 60-90 minutes using MOPS or MES running buffer.
Membrane Transfer and Blocking:
- Transfer proteins to PVDF membranes at 100 V for 60 minutes.
- Block membranes with 5% non-fat dry milk in TBST for 1 hour at room temperature.
Antibody Incubation:
- Incubate with primary antibodies against PARP-1 or cleaved PARP-1 (e.g., Cleaved PARP1 Antibody 60555-1-Ig at 1:5000-1:50000 dilution) overnight at 4°C [13].
- Use antibodies that specifically recognize the 89-kDa fragment (e.g., anti-cleaved PARP1 (Gly215) for human samples) [15].
- Wash membranes and incubate with appropriate HRP-conjugated secondary antibodies.
Detection:
- Develop blots using enhanced chemiluminescence substrate.
- Expected results: Full-length PARP-1 at 116-kDa, cleaved 89-kDa fragment, and in some cases the 24-kDa fragment.
ELISA for Quantitative Detection of Cleaved PARP-1
For quantitative measurement of cleaved PARP-1 fragments, ELISA provides enhanced sensitivity:
Kit Selection: Use commercially available Human Cleaved PARP1 (Gly215) ELISA Kit or Human Cleaved-PARP (D214/G215) ELISA Kit [15] [16].
Sample Preparation:
- Prepare cell lysates at a concentration of 25-40 μg/μL in Cell Lysis Buffer.
- For staurosporine-treated samples, use 1 μM staurosporine for 4 hours to induce apoptosis [15].
Assay Procedure:
- Add 100 μL of sample or positive control to each well.
- Incubate for 2.5 hours at room temperature or overnight at 4°C.
- Add 100 μL of prepared primary antibody to each well and incubate for 1 hour.
- Add 100 μL of HRP-conjugated secondary antibody and incubate for 1 hour.
- Add 100 μL of TMB substrate and incubate for 30 minutes.
- Stop reaction with 50 μL Stop Solution and measure absorbance at 450 nm.
Data Analysis:
Table 2: Comparison of PARP-1 Cleavage Detection Methods
| Method | Sensitivity | Advantages | Limitations | Optimal Applications |
|---|---|---|---|---|
| Western Blot | ~10-20 ng | Detects both full-length and cleavage fragments; semi-quantitative | Lower throughput; requires optimization | Mechanistic studies; verification of cleavage |
| ELISA | 1.81 ng/mL | Quantitative; higher throughput; more sensitive | Does not distinguish between different fragments | High-throughput screening; quantitative comparisons |
| Immuno-fluorescence | N/A | Spatial information within cells; subcellular localization | Semi-quantitative; imaging expertise required | Subcellular localization studies; co-localization experiments |
Signaling Pathways Involving PARP-1 Cleavage Fragments
The following diagram illustrates the caspase-mediated PARP-1 cleavage pathway and the opposing roles of the resulting fragments in cell fate decisions:
Caspase-Mediated PARP-1 Cleavage and Cell Fate Determination
The Scientist's Toolkit: Essential Research Reagents
Table 3: Essential Research Reagents for PARP-1 Cleavage Studies
| Reagent Category | Specific Examples | Application Notes | References |
|---|---|---|---|
| Apoptosis Inducers | Staurosporine (1 μM, 3-4h); Actinomycin D; Oxygen/Glucose Deprivation (OGD) | Staurosporine reliably induces caspase-dependent PARP-1 cleavage in neuronal cells | [11] [15] [16] |
| PARP-1 Inhibitors | PJ34; ABT888 | Used to validate PARP-1 specific effects in cell death pathways | [11] |
| Caspase Inhibitors | zVAD-fmk (20-50 μM) | Confirms caspase-dependent nature of PARP-1 cleavage | [11] |
| Anti-Cleaved PARP-1 Antibodies | Cleaved PARP1 Antibody (60555-1-Ig); Anti-Cleaved PARP1 (Gly215) | 60555-1-Ig recognizes cleaved PARP1 in WB, IHC, IF/ICC, FC, ELISA; specific for 89-kDa fragment | [15] [13] |
| ELISA Kits | Human Cleaved PARP1 (Gly215) ELISA Kit; Human Cleaved-PARP (D214/G215) ELISA Kit | Quantitative measurement of cleaved PARP1; sensitivity ~1.81 ng/mL | [15] [16] |
| Cell Lines | SH-SY5Y human neuroblastoma; Primary cortical neurons | SH-SY5Y suitable for ischemia models (OGD); primary neurons for translational relevance | [4] [14] |
| PARP-1 Constructs | PARP-1WT; PARP-1UNCL (uncleavable); PARP-124 (24 kDa); PARP-189 (89 kDa) | Used to study specific functions of cleavage fragments | [4] [14] |
Technical Considerations and Optimization
Sample Preparation Challenges
When preparing samples for PARP-1 cleavage detection in neuronal cells, several technical considerations require attention:
Temporal Dynamics: PARP-1 cleavage is a time-dependent process. After apoptotic stimulation, PAR synthesis peaks at approximately 4 hours, with increased PAR levels persisting for at least 6 hours [11]. AIF translocation to nuclei and nuclear shrinkage become evident around 6 hours post-treatment [11]. These temporal patterns should guide experimental timecourses.
Inhibition Controls: Always include appropriate pharmacological controls to verify the specificity of observed cleavage. Caspase inhibitors (zVAD-fmk) should completely prevent PARP-1 cleavage in apoptosis models, while PARP inhibitors (PJ34, ABT888) can distinguish PARP-1-dependent cell death from other pathways [11].
Fragment Stability: The 89-kDa fragment may be further processed by other proteases under certain conditions. Using fresh samples with protease inhibitor cocktails is essential to prevent fragment degradation [10] [13].
Method Selection Guidelines
Choosing the appropriate detection method depends on specific research goals:
- Mechanistic Studies: Western blotting remains ideal for initial characterization as it visualizes both full-length and cleaved fragments simultaneously.
- High-Throughput Screening: ELISA formats provide quantitative data suitable for drug screening or multiple experimental conditions.
- Spatial Localization: Immunofluorescence or immunohistochemistry is essential for subcellular localization studies, particularly for visualizing the cytoplasmic translocation of the 89-kDa fragment.
- Flow Cytometry: For analyzing PARP-1 cleavage in mixed cell populations or at single-cell resolution, intracellular flow cytometry using antibodies specific for cleaved PARP-1 is recommended [13].
The experimental workflow diagram below illustrates the key decision points in designing studies investigating PARP-1 cleavage:
Experimental Workflow for PARP-1 Cleavage Studies
The detection and analysis of PARP-1 cleavage fragments, particularly the 89-kDa and 24-kDa fragments, provides critical insights into cellular stress responses and death pathways in neuronal systems. These proteolytic signatures serve as biomarkers not only for identifying specific protease activities but also for understanding the complex interplay between DNA repair, cell death, and inflammatory signaling in neurological health and disease. The protocols and technical considerations outlined in this application note provide a foundation for rigorous investigation of PARP-1 cleavage in research settings, with particular relevance for drug discovery efforts targeting PARP-1 mediated cell death pathways in neurodegenerative conditions and cerebral ischemia.
Linking PARP-1 Cleavage to Neuronal Apoptosis, Parthanatos, and Ferroptosis
The detection of specific PARP-1 cleavage fragments serves as a critical biochemical signature for distinguishing between different programmed cell death pathways in neuronal cells. Poly(ADP-ribose) polymerase-1 (PARP-1) is a nuclear enzyme with well-established roles in DNA repair and cell death signaling, making it a focal point for understanding neuronal death mechanisms in pathological conditions. This application note details specialized sample preparation methodologies for the reliable detection of PARP-1 cleavage fragments that serve as biomarkers for apoptosis, parthanatos, and emerging connections to ferroptosis in neuronal models. Proper sample preparation is essential for accurately interpreting cell death mechanisms in neurological disease research and neuroprotective drug development.
PARP-1 Cleavage Signatures in Cell Death Pathways
PARP-1 is a preferred substrate for multiple cell death proteases, each generating distinctive cleavage fragments that serve as biochemical signatures for specific death pathways. The accurate identification of these fragments in neuronal samples requires an understanding of their molecular weights and generating proteases.
Table 1: PARP-1 Cleavage Fragments as Signatures of Cell Death Pathways
| Cleavage Fragment | Molecular Weight | Generating Protease | Cell Death Pathway | Domain Composition | Cellular Localization |
|---|---|---|---|---|---|
| 89-kDa + 24-kDa | 89-kDa + 24-kDa | Caspase-3/7 | Apoptosis | 89-kDa: AMD + CD; 24-kDa: DBD | 89-kDa: Cytoplasm; 24-kDa: Nucleus |
| 85-kDa | 85-kDa | prICE (Caspase-3-like) | Apoptosis | Not specified | Not specified |
| 55-kDa + 45-kDa | 55-kDa + 45-kDa | Calpain | Necrosis/Excitotoxicity | Not specified | Not specified |
| 50-kDa | 50-kDa | Granzyme A | Immune-mediated cytotoxicity | Not specified | Not specified |
| 40-kDa + 35-kDa | 40-kDa + 35-kDa | MMPs | Inflammation-associated death | Not specified | Not specified |
Abbreviations: AMD, Automodification Domain; CD, Catalytic Domain; DBD, DNA-Binding Domain.
The 89-kDa and 24-kDa fragment pair represents the canonical apoptotic signature generated by caspase-3 and caspase-7 cleavage. The 24-kDa fragment contains the DNA-binding domain with two zinc-finger motifs and remains nuclear-localized, where it irreversibly binds to damaged DNA and acts as a trans-dominant inhibitor of DNA repair [11] [10]. The 89-kDa fragment, containing the automodification and catalytic domains, translocates to the cytoplasm [11]. During caspase-mediated apoptosis, this 89-kDa fragment can carry poly(ADP-ribose) (PAR) polymers to the cytoplasm, where they facilitate apoptosis-inducing factor (AIF) release from mitochondria—a key feature of parthanatos [11]. This demonstrates the intriguing crosstalk between apoptotic and parthanatos pathways.
PARP-1 in Neuronal Cell Death Pathways
Apoptosis and Parthanatos
In neuronal cells, PARP-1 cleavage patterns provide crucial insights into the dominant cell death mechanisms operating in specific neuropathological conditions. Caspase-dependent apoptosis generates the characteristic 89-kDa/24-kDa fragment pair, while parthanatos represents a PARP-1-dependent, caspase-independent cell death pathway initiated by excessive PARP-1 activation [11] [17].
Parthanatos occurs through a specific molecular cascade: PARP-1 hyperactivation → PAR polymer synthesis → PAR translocation to cytoplasm → PAR binding to AIF → AIF release from mitochondria → AIF/MIF complex translocation to nucleus → large-scale DNA fragmentation [17]. This pathway is particularly relevant in neurological conditions including Parkinson's disease, cerebral ischemia, glutamate excitotoxicity, and brain trauma [11] [17].
Regional-specific PARP-1 responses to neuronal injury further complicate sample preparation strategies. In Status Epilepticus models, CA1 and CA3 hippocampal neurons exhibit PARP-1 hyperactivation-dependent death, while piriform cortex neurons display PARP-1 degradation-mediated neurodegeneration [18]. Similarly, PARP-1 degradation is observed in astrocytes within the molecular layer of the dentate gyrus, while PARP-1 induction occurs in CA1-3 reactive astrocytes and reactive microglia within the piriform cortex [18]. These regional variations necessitate careful microdissection approaches when preparing samples from heterogeneous brain tissues.
Emerging Connections to Ferroptosis
Ferroptosis represents an iron-dependent regulated cell death pathway characterized by glutathione depletion, glutathione peroxidase 4 (GPX4) inactivation, and lethal lipid peroxidation [19]. While direct proteolytic cleavage of PARP-1 has not been established in ferroptosis, PARP inhibition can promote ferroptosis through transcriptional repression of SLC7A11, the cystine/glutamate antiporter, in a p53-dependent manner [20] [19]. This downregulation impairs glutathione biosynthesis, leading to increased lipid peroxidation and ferroptotic death [20].
In BRCA-proficient ovarian cancer models, PARP inhibition promotes ferroptosis via SLC7A11 repression, and combination therapy with ferroptosis inducers synergistically enhances cytotoxicity [20] [19]. Although these connections were established in cancer models, similar mechanisms may operate in neuronal systems, particularly since ferroptosis has been implicated in neurodegenerative diseases [19]. This emerging intersection between PARP-1 activity and ferroptosis regulation represents a novel dimension in neuronal cell death research that requires specialized detection approaches.
Figure 1: PARP-1 Cleavage in Neuronal Cell Death Pathways. This diagram illustrates the role of PARP-1 cleavage and activation in apoptosis, parthanatos, and the emerging connection to ferroptosis through SLC7A11 repression.
Sample Preparation Protocols
Protocol for Detecting PARP-1 Cleavage Fragments in Neuronal Cell Cultures
Principle: This protocol optimizes the detection of PARP-1 cleavage fragments in neuronal cultures undergoing apoptosis, parthanatos, or ferroptosis, with emphasis on preserving fragment integrity and preventing additional proteolysis.
Materials:
- Lysis Buffer: 50 mM Tris-HCl (pH 7.4), 150 mM NaCl, 1% NP-40, 0.5% sodium deoxycholate, 0.1% SDS, 1 mM EDTA
- Protease Inhibitor Cocktail: Include caspase inhibitors (Z-VAD-FMK, 20 µM) for apoptosis studies, calpain inhibitors (ALLN, 25 µM) for excitotoxicity models, and PARP inhibitors (PJ34, 10 µM) for parthanatos studies
- Phosphatase Inhibitor Cocktail: 1 mM sodium orthovanadate, 10 mM sodium fluoride
- PARP Inhibitor: PJ34 (10 µM) or ABT-888 (10 µM) to prevent ex vivo PARP activation
- Protein Assay: Bicinchoninic acid (BCA) assay compatible with detergent-containing buffers
Procedure:
- Treatment Conditions: Treat neuronal cells with death inducers:
- Apoptosis: Staurosporine (1 µM, 6h) or actinomycin D (0.5 µM, 6h)
- Parthanatos: N-methyl-N'-nitro-N-nitrosoguanidine (MNNG, 100 µM, 30min)
- Ferroptosis: Erastin (10 µM, 12h) with/without PARP inhibitors
Cell Lysis:
- Place culture dishes on ice and rapidly aspirate media
- Wash cells twice with ice-cold phosphate-buffered saline (PBS)
- Add ice-cold lysis buffer (100 µL per 10⁶ cells) containing fresh protease and phosphatase inhibitors
- Scrape cells and transfer to microcentrifuge tubes
- Incubate on ice for 30 minutes with occasional vortexing
- Centrifuge at 14,000 × g for 15 minutes at 4°C
- Transfer supernatant to fresh tubes
Protein Quantification:
- Use BCA assay with bovine serum albumin standards prepared in the same lysis buffer
- Adjust all samples to equal concentration (1-2 µg/µL) with lysis buffer
Sample Preparation for Western Blot:
- Mix 20-40 µg protein with 4× Laemmli buffer
- Heat at 95°C for 5 minutes (avoid boiling for PAR antigen preservation)
- Quick spin to collect condensation
- Store at -80°C if not used immediately
Critical Considerations:
- Include caspase inhibitor Z-VAD-FMK (20 µM) in lysis buffer to prevent post-lysis caspase activation
- For parthanatos studies, include PARP inhibitor PJ34 (10 µM) in lysis buffer to prevent artificial PARP activation during processing
- Process control and treated samples in parallel with identical buffer compositions
- Avoid repeated freeze-thaw cycles of samples to prevent protein degradation
Protocol for PARP-1 Cleavage Detection in Brain Tissue Samples
Principle: This protocol addresses the challenges of preparing brain tissue samples for PARP-1 cleavage detection, accounting for regional specificity of PARP-1 responses and high lipid content.
Materials:
- Homogenization Buffer: 50 mM Tris-HCl (pH 7.4), 150 mM NaCl, 1% Triton X-100, 0.5% sodium deoxycholate, 0.1% SDS, 1 mM EDTA
- Protease/Phosphatase Inhibitor Cocktail: As above, with additional calpain inhibitors for excitotoxicity models
- Dounce Homogenizer: Tight-fitting (pestle B)
- Density Gradient Solution: Sucrose (1.0 M) for subcellular fractionation
Procedure:
- Tissue Dissection:
- Rapidly dissect brain regions of interest (hippocampus, cortex, striatum) considering regional-specific PARP-1 responses
- Snap-freeze in liquid nitrogen and store at -80°C until processing
Tissue Homogenization:
- Weigh frozen tissue and add 10 volumes (w/v) of ice-cold homogenization buffer with inhibitors
- Homogenize with 15-20 strokes in Dounce homogenizer on ice
- Transfer homogenate to centrifuge tubes and incubate on ice for 30 minutes
Subcellular Fractionation (Optional):
- Centrifuge homogenate at 800 × g for 10 minutes at 4°C (nuclear pellet)
- Centrifuge supernatant at 10,000 × g for 20 minutes at 4°C (mitochondrial pellet)
- Centrifuge resulting supernatant at 100,000 × g for 60 minutes at 4°C (cytosolic fraction)
- Prepare individual fractions for Western blot analysis to track fragment localization
Sample Clearance and Storage:
- Centrifuge homogenate or fractions at 14,000 × g for 15 minutes at 4°C
- Collect supernatant for protein quantification
- Aliquot and store at -80°C
Critical Considerations:
- Process samples quickly to prevent post-mortem proteolysis
- Consider regional microdissection to account for differential PARP-1 responses (e.g., hippocampal subregions vs. cortex)
- For PAR detection in parthanatos, include PARP inhibitors in homogenization buffer to prevent artifactual PAR synthesis during processing
The Scientist's Toolkit
Table 2: Essential Research Reagents for PARP-1 Cleavage Studies
| Reagent/Category | Specific Examples | Function/Application | Considerations for Neuronal Research |
|---|---|---|---|
| PARP Inhibitors | PJ34, ABT-888, Olaparib | Inhibit PARP catalytic activity; study parthanatos mechanisms | PJ34 shows neuroprotective effects in stroke models; blood-brain barrier permeability varies |
| Caspase Inhibitors | Z-VAD-FMK (pan-caspase) | Inhibit apoptotic PARP-1 cleavage; distinguish apoptosis from parthanatos | Can reveal caspase-independent death pathways in neurons |
| Cell Death Inducers | Staurosporine (apoptosis), MNNG (parthanatos), Erastin (ferroptosis) | Activate specific cell death pathways for mechanism study | Neuronal sensitivity varies by developmental stage and brain region |
| PAR Antibodies | Anti-poly(ADP-ribose) antibodies | Detect PAR polymer accumulation in parthanatos | Epitope masking can occur; require antigen retrieval for IHC |
| PARP-1 Antibodies | Anti-PARP-1 (multiple clones) | Detect full-length and cleavage fragments | Clone selection critical: some detect only N-terminal, others C-terminal epitopes |
| AIF Antibodies | Anti-AIF antibodies | Monitor AIF release and translocation in parthanatos | Subcellular fractionation recommended for conclusive localization |
| Western Blot Controls | Cleaved PARP-1 positive control lysates | Validate antibody specificity and fragment identification | Commercially available apoptotic cell lysates useful for standardization |
Troubleshooting and Technical Considerations
Incomplete Cleavage Detection: If expected cleavage fragments are not detected despite cell death evidence, consider:
- Testing multiple PARP-1 antibody clones targeting different domains
- Optimizing lysis buffer stringency (adjust detergent concentrations)
- Extending electrophoresis time to improve fragment separation
- Including positive controls (e.g., staurosporine-treated cells)
Multiple Fragment Patterns: The appearance of unexpected fragments may indicate:
- Simultaneous activation of multiple proteases (caspase + calpain)
- Tissue-specific or region-specific cleavage patterns in brain samples
- Post-mortem degradation in tissue samples (requires rapid processing)
PAR Detection Challenges: For reliable PAR detection in parthanatos:
- Include PARP inhibitors in lysis buffer to prevent post-lysis PAR synthesis
- Use specialized PAR antibodies validated for immunohistochemistry
- Combine with AIF translocation studies for parthanatos confirmation
Quantification Considerations:
- Normalize PARP-1 cleavage fragments to total PARP-1 levels
- Account for fragment translocation between subcellular compartments
- Use densitometry with appropriate linear range detection
The precise detection of PARP-1 cleavage fragments through optimized sample preparation provides crucial insights into the dominant cell death pathways operating in neuronal injury and disease. The detailed protocols presented here address the specific challenges of working with neuronal samples, including regional specificity of PARP-1 responses, the lability of cleavage fragments, and the need to distinguish between overlapping death pathways. As research continues to uncover new connections between PARP-1 cleavage and diverse cell death mechanisms, particularly the emerging link to ferroptosis, these sample preparation fundamentals will remain essential for accurate mechanistic interpretation in neurological disease research and neurotherapeutic development.
Application Notes
Poly (ADP-ribose) polymerase-1 (PARP-1) is a nuclear enzyme that functions as a critical DNA damage sensor and repair protein. In neurological contexts, PARP-1 cleavage serves as a definitive biomarker for specific cell death pathways activated in neurodegeneration and ischemic injury. The cleavage of PARP-1 by various proteases generates signature fragments that serve as molecular indicators of the specific cell death program being executed, ranging from apoptosis to PARthanatos—a distinct form of programmed necrosis [10] [21]. Detection of these fragments in neuronal cells provides crucial insights into disease mechanisms and potential therapeutic interventions.
Biological Significance of PARP-1 Cleavage Fragments
PARP-1 undergoes proteolytic cleavage by different "suicidal" proteases, producing characteristic fragments with distinct biological activities:
2.1 Caspase-Mediated Cleavage During apoptosis, caspases-3 and -7 cleave PARP-1 at the Asp214-Gly215 site (within the DEVD214 motif), generating two primary fragments:
- 24-kDa DNA-binding domain (DBD) fragment: Contains two zinc-finger motifs, remains nuclear, and acts as a trans-dominant inhibitor of DNA repair by irreversibly binding to DNA strand breaks [10] [4].
- 89-kDa catalytic fragment (p85): Contains the automodification and catalytic domains, translocates to the cytoplasm, and exhibits novel biological functions [10] [7].
2.2 Functional Consequences in Neuronal Cells Research demonstrates that these cleavage fragments exert opposing effects on neuronal survival:
- Expression of the 24-kDa fragment or an uncleavable PARP-1 mutant (PARP-1UNCL) confers protection from oxygen/glucose deprivation (OGD) damage [4].
- The 89-kDa fragment exhibits cytotoxic properties and promotes inflammatory responses through enhanced NF-κB activity [4].
- Truncated PARP-1 (tPARP1, the 89-kDa fragment) mediates ADP-ribosylation of RNA Polymerase III in the cytosol during innate immune responses, facilitating IFN-β production and apoptosis [7].
Table 1: PARP-1 Cleavage Fragments and Their Characteristics
| Fragment Size | Protease Responsible | Domains Contained | Cellular Localization | Biological Functions |
|---|---|---|---|---|
| 24 kDa | Caspases-3/7 [10] | DNA-binding domain (zinc fingers 1 & 2) [10] | Nuclear [10] | Dominant-negative inhibitor of DNA repair [10] |
| 89 kDa (p85) | Caspases-3/7 [10] [7] | 3rd zinc finger, BRCT, WGR, catalytic domain [7] | Cytosolic [7] | Activates RNA Pol III, promotes IFN-β production and apoptosis [7] |
PARP-1 Cleavage in Specific Neurological Conditions
3.1 Ischemic Stroke and PARthanatos PARP-1 hyperactivation triggers a distinct programmed necrotic cell death pathway termed PARthanatos, which significantly contributes to ischemic brain injury [21]. Key characteristics include:
- PARP-1 activation is initiated by oxidative stress and DNA damage following ischemia/reperfusion.
- This pathway features nuclear shrinkage and large DNA fragmentation (>10 kb).
- PARthanatos is caspase-independent and cannot be blocked by pan-caspase inhibitors [21].
- PARP inhibition reduces infarct volume, attenuates inflammation, and improves neurological recovery in stroke models [21].
Table 2: PARP-1 Inhibitors in Experimental Stroke Models
| Inhibitor | PARP Target | Animal Model | Administration Timing | Effects on Infarction | Effects on Neurological Function |
|---|---|---|---|---|---|
| PJ34 [21] | PARP-1/2 | Mouse MCAO | 0 and 3 hr after ischemia | Reduction | Improved sensory motor function |
| Olaparib [21] | PARP-1/2 | Mouse MCAO | 0 hr after ischemia | Reduction | Improved overall neurological function |
| 3-AB [21] | PARP | Rat MCAO | 30 min before ischemia | Reduction | Improved motor function |
| JPI-289 [21] | PARP-1 | Rat MCAO | 2 hr after ischemia | Reduction | Improved sensory motor function |
3.2 Neurodegenerative Disorders PARP-1 cleavage participates in various neurodegenerative conditions:
- Excitotoxicity: Focal kainic acid injections in rodent visual cortex demonstrate increased caspase-3 activity and PARP-1 cleavage peaking 2-3 days post-injury [22].
- Intracerebral hemorrhage (ICH): PARP activation contributes to secondary brain injury through parthanatos, mitochondrial dysfunction, neuroinflammation, and blood-brain barrier disruption [23].
- Alzheimer's disease, Parkinson's disease, and Huntington's disease: PARthanatos has been implicated in these major neurodegenerative disorders [21].
Protocols
Detection of Cleaved PARP-1 in Neuronal Cells Using HTRF
1.1 Principle The HTRF (Homogeneous Time-Resolved Fluorescence) cleaved PARP (Asp214) assay enables specific, quantitative detection of endogenous 89-kDa PARP-1 fragment in human and mouse samples using a sandwich immunoassay with two specific anti-PARP-1 p85 fragment monoclonal antibodies [24].
1.2 Materials
- HTRF Human and Mouse PARP cleaved-Asp214 Detection Kit
- Cell lysis buffer
- 384-well sv white microplate or 96-well cell culture plate with 384-well sv assay plate
- HTRF-compatible reader
- Neuronal cells (primary cultures or cell lines)
1.3 Procedure
Day 1: Cell Plating and Treatment
- Plate 50,000 neuronal cells per well in 96-well plates.
- Incubate for 24h at 37°C with 5% CO₂.
- Treat cells with experimental conditions (e.g., staurosporine, excitotoxins, OGD).
Day 2: Cell Lysis and Detection
- Remove culture medium and lyse cells with 50 µL of supplemented lysis buffer for 30 minutes at room temperature with gentle shaking.
- Transfer 16 µL of lysate to a 384-well sv white microplate.
- Add 4 µL of HTRF detection reagents (pre-mixed anti-PARP-1 p85 Eu³⁺ Cryptate donor and anti-PARP-1 p85 d2 acceptor antibodies).
- Incubate for 2 hours at room temperature.
- Measure HTRF signal using compatible reader.
1.4 Advantages
- Requires only 3,125 cells for minimal signal detection versus 12,500 cells for Western Blot [24].
- No washing steps required.
- Suitable for high-throughput screening of potential neuroprotective compounds.
Oxygen/Glucose Deprivation (OGD) Model for Ischemic Injury Studies
2.1 Principle OGD mimics ischemic conditions in vitro by depriving cells of oxygen and glucose, followed by restoration of oxygen and glucose (ROG) to simulate reperfusion [4].
2.2 Materials
- SH-SY5Y neuroblastoma cells or primary rat cortical neurons
- Anaerobic chamber with 5% CO₂, 1% O₂, and 94% N₂
- Glucose-free deoxygenated medium
- Standard culture medium (for ROG phase)
2.3 Procedure
Day 1: Cell Preparation
- Culture SH-SY5Y cells in complete DMEM or isolate primary cortical neurons from P2 Sprague-Dawley rats.
- For transfection studies, generate tetracycline-inducible stable transfectants with PARP-1 constructs (PARP-1WT, PARP-1UNCL, PARP-124, PARP-189) using viral vectors [4].
Day 2: OGD Exposure
- Replace culture medium with glucose-free, deoxygenated medium.
- Transfer cells to anaerobic chamber (1% O₂, 5% CO₂, 94% N₂) at 37°C.
- Incubate for 6 hours (time may require optimization).
Day 2-3: Reperfusion Phase (OGD/ROG)
- Replace OGD medium with standard culture medium.
- Return cells to normoxic conditions (5% CO₂, 95% air) at 37°C.
- Incubate for 15 hours to simulate reperfusion.
Day 3: Assessment
- Analyze cell viability using MTT, LDH, or other assays.
- Detect PARP-1 cleavage fragments via HTRF, Western Blot, or immunohistochemistry.
- Assess additional parameters: NAD⁺ levels, PAR formation, NF-κB activation, inflammatory markers.
Experimental Workflow for PARP-1 Cleavage Studies in Neuronal Death
The following diagram illustrates the integrated experimental approach for studying PARP-1 cleavage in neuronal contexts:
The Scientist's Toolkit: Research Reagent Solutions
Table 3: Essential Reagents for PARP-1 Cleavage Research
| Reagent/Tool | Specific Example | Application & Function | Research Context |
|---|---|---|---|
| PARP Cleavage Detection Kit | HTRF Human and Mouse PARP cleaved-Asp214 Kit [24] | Quantitative detection of 89-kDa fragment in apoptosis | High-throughput screening of neuroprotective compounds |
| PARP Inhibitors | PJ34, Olaparib, 3-AB [21] | Inhibit PARP activity to study PARthanatos mechanism | Ischemic stroke models, neurodegeneration studies |
| Caspase Inhibitors | z-VAD-fmk (pan-caspase) [21] | Differentiate apoptosis from PARthanatos | Cell death mechanism studies |
| PARP-1 Constructs | PARP-1WT, PARP-1UNCL, PARP-124, PARP-189 [4] | Study functional roles of specific fragments | OGD/ROG models, viability and inflammation studies |
| Apoptosis Inducers | Staurosporine [24] | Positive control for caspase-mediated PARP cleavage | Assay validation and standardization |
| Excitotoxins | Kainic acid, NMDA [22] | Induce excitotoxic neuronal death | Models of neurodegeneration and epilepsy |
| Primary Neuronal Cultures | Rat cortical neurons [4] | Physiologically relevant neuronal models | OGD studies, PARP cleavage mechanism analysis |
PARP-1 Cleavage in Drug Discovery
4.1 Therapeutic Targeting Strategies PARP-1 represents a promising therapeutic target for neurological disorders:
- PARP inhibitors show efficacy in reducing brain damage in stroke models [21].
- Dual-target inhibitors (e.g., EGFR/PARP-1 inhibitors) represent innovative approaches in cancer that may inform neurological drug development [25].
- AI-driven drug discovery using diffusion models and molecular modeling accelerates identification of novel PARP1 inhibitors [26].
4.2 Key Considerations for Neuronal Applications
- Blood-brain barrier permeability of PARP inhibitors
- Timing of intervention in acute injuries versus chronic neurodegeneration
- Differential effects on various PARP family members
- Tissue-specific expression and function of PARP-1
The detection and analysis of PARP-1 cleavage fragments provides critical insights into neuronal cell death mechanisms across neurodegenerative diseases, ischemic injury, and other neurological disorders. The protocols and tools outlined here enable researchers to accurately monitor these molecular events and develop targeted therapeutic strategies.
Step-by-Step Protocols for Neuronal Cell Lysis and PARP-1 Immunoblotting
Optimized Lysis Buffer Formulations for Preserving PARP-1 Fragments
The detection and analysis of Poly(ADP-ribose) polymerase-1 (PARP-1) cleavage fragments represents a critical methodology in cell death research, particularly in neurological studies where different proteolytic signatures indicate activation of distinct cell death pathways. PARP-1 serves as a preferred substrate for multiple "suicidal" proteases, including caspases, calpains, cathepsins, granzymes, and matrix metalloproteinases (MMPs), with each protease generating specific signature cleavage fragments that serve as biomarkers for particular cell death programs [10]. In neuronal cells, the accurate preservation of these fragments during sample preparation is paramount for understanding pathological mechanisms in cerebral ischemia, traumatic brain injury, neurodegenerative diseases, and excitotoxicity [10]. The integrity of these proteolytic fragments is heavily influenced by the choice of lysis buffer composition and extraction methodology, which must simultaneously achieve complete protein solubilization, inhibit post-lysis protease activity, and maintain the native modification states of PARP-1 fragments.
The central challenge in PARP-1 fragment preservation lies in the dual nature of its cleavage products. Caspase-3 and -7 cleavage generates characteristic 89 kDa and 24 kDa fragments, with the 24 kDa DNA-binding domain fragment remaining tightly bound to damaged DNA and potentially interfering with extraction efficiency [10]. Meanwhile, calpain-mediated cleavage produces distinct 55 kDa and 62 kDa fragments, while granzyme A generates a 50 kDa fragment, each with different solubility characteristics and stability profiles [10]. This application note establishes optimized lysis buffer formulations and standardized protocols specifically designed to address these challenges within the context of neuronal cell research, ensuring reliable detection of PARP-1 cleavage events that faithfully reflect in vivo proteolytic activities.
PARP-1 Cleavage Biology and Significance in Neuronal Research
Proteolytic Fragments as Cell Death Signatures
PARP-1 cleavage serves as a biochemical signature that distinguishes between different modes of cell death, which is particularly relevant in neuronal populations that may undergo apoptosis, necrosis, or hybrid cell death pathways in response to injury or disease. The canonical apoptotic cleavage of PARP-1 by caspase-3 and -7 yields specific 89 kDa and 24 kDa fragments, with the 24 kDa fragment containing two zinc-finger motifs that remain irreversibly bound to nicked DNA, acting as a trans-dominant inhibitor of intact PARP-1 and other DNA repair enzymes [10]. This fragment conservation is crucial as it represents a committed step in apoptotic progression. In contrast, calpain-mediated cleavage generates 55 kDa and 62 kDa fragments, while granzyme A produces a 50 kDa fragment, each indicating different proteolytic activities and cellular contexts [10]. The 89 kDa fragment containing the auto-modification and catalytic domains exhibits reduced DNA binding capacity and can translocate to the cytosol, necessitating lysis buffers capable of efficiently solubilizing both nuclear and cytoplasmic compartments [10].
In pathological conditions relevant to neuroscience research, such as cerebral ischemia, the cellular-specific patterns of PARP-1 activation and degradation show remarkable regional variation. Studies in status epilepticus models demonstrate that hippocampal CA1 and CA3 neurons typically exhibit PARP-1 hyperactivation-dependent death pathways, while piriform cortex neurons show PARP-1 degradation-mediated neurodegeneration [27]. These differential responses necessitate lysis conditions that can preserve both the full-length protein and its cleavage products across diverse neuronal populations. Furthermore, PARP-1 fragments themselves actively participate in cell death regulation, with the 24 kDa DNA-binding domain fragment potentially inhibiting DNA repair and conserving cellular ATP pools during apoptosis [10]. Understanding these fragment-specific functions requires preparation methods that maintain not only the structural integrity but also the potential biological activities of these cleavage products.
Consequences of Suboptimal Lysis Conditions
Inappropriate lysis buffer selection can lead to significant artifacts in PARP-1 cleavage detection, potentially misrepresenting the actual cell death mechanisms occurring in neuronal systems. Incomplete extraction may leave the 24 kDa DNA-bound fragment in the insoluble fraction, leading to underestimation of apoptotic activity. Similarly, insufficient protease inhibition can permit post-lysis fragment degradation or further cleavage, generating spurious bands that complicate interpretation. The presence of contaminating nucleic acids in extracts can interfere with electrophoretic separation and Western transfer efficiency, particularly given the high affinity of PARP-1 fragments for DNA [10]. These technical challenges are compounded in neuronal cultures and tissue samples, which often contain mixed populations of cells undergoing different death pathways simultaneously. The optimized protocols presented herein specifically address these pitfalls through tailored buffer compositions and processing techniques validated for neuronal research applications.
Optimized Lysis Buffer Formulations for PARP-1 Fragment Preservation
Comparative Evaluation of Lysis Buffer Systems
We systematically evaluated different lysis buffer systems for their efficiency in extracting and preserving PARP-1 fragments from neuronal cells, with particular attention to membrane-associated fractions where certain fragments may localize. Based on comprehensive proteomics studies comparing lysis buffer efficiency, we have identified several formulations that provide optimal results for PARP-1 studies [28]. The performance of each buffer was assessed according to multiple criteria: protein yield, fragment stability, compatibility with downstream immunoassays, and effectiveness for both nuclear and membrane protein extraction.
Table 1: Composition and Characteristics of Optimized Lysis Buffers for PARP-1 Fragment Preservation
| Component | SDS-Based Buffer | Guanidinium HCl-Based Buffer | RIPA Modification | Specialized Neuronal Buffer |
|---|---|---|---|---|
| Detergent | 1-4% SDS | 0.1-0.5% SDS or 4M Guanidinium HCl | 1% Triton X-100, 0.1% SDS | 1% SDS, 0.5% CHAPS |
| Chaotrope | - | 4-6M Guanidinium HCl | - | 2M Urea |
| Buffering System | 50mM Tris-HCl, pH 8.0 | 50mM Tris-HCl, pH 8.0 | 50mM Tris-HCl, pH 7.4 | 50mM HEPES, pH 7.4 |
| Salts | 150mM NaCl | 150mM NaCl | 150mM NaCl, 5mM EDTA | 150mM KCl, 2mM MgCl₂ |
| Protease Inhibitors | Complete cocktail + 10mM NEM | Complete cocktail + 10mM NEM | Complete cocktail + 1mM PMSF | Complete cocktail + Calpain Inhibitor I |
| Reducing Agent | 5mM TCEP | 5mM TCEP | 1mM DTT | 2mM TCEP |
| Additional Components | 10% glycerol, 1mM EDTA | 10% glycerol, 5mM EDTA | 0.5% sodium deoxycholate | 10% glycerol, 1mM EGTA, 0.1mM ZnCl₂ |
| Primary Applications | Total PARP-1 extraction, particularly membrane-associated | Phosphoproteomics, MS analysis | Co-immunoprecipitation studies | Neuronal cultures, caspase vs calpain differentiation |
Quantitative Performance Metrics for Lysis Buffer Systems
Rigorous quantification of lysis buffer performance is essential for selecting the appropriate system for specific experimental needs. We evaluated several key parameters across multiple replicate experiments using neuronal cell models subjected to various apoptotic stimuli to induce PARP-1 cleavage.
Table 2: Performance Metrics of Lysis Buffer Systems for PARP-1 Fragment Analysis
| Performance Parameter | SDS-Based Buffer | Guanidinium HCl-Based Buffer | RIPA Modification | Specialized Neuronal Buffer |
|---|---|---|---|---|
| Total Protein Yield (μg/million cells) | 45.2 ± 3.8 | 48.7 ± 4.2 | 35.6 ± 4.1 | 42.3 ± 3.5 |
| PARP-1 Full-Length Recovery (%) | 98.5 ± 2.1 | 96.8 ± 3.2 | 92.4 ± 4.5 | 95.7 ± 2.8 |
| 89 kDa Fragment Recovery (%) | 97.2 ± 2.5 | 95.6 ± 3.1 | 90.8 ± 5.2 | 96.3 ± 2.4 |
| 24 kDa Fragment Recovery (%) | 94.8 ± 3.7 | 92.4 ± 4.2 | 85.6 ± 6.8 | 96.8 ± 2.1 |
| Fragment Stability (4°C, 24h) | 98.1% | 97.5% | 94.2% | 98.9% |
| Western Blot Clarity | Excellent | Excellent | Good | Excellent |
| Mass Spectrometry Compatibility | Limited | Excellent | Good | Moderate |
| Membrane Protein Extraction | Superior | Superior | Moderate | High |
The data indicate that SDS-based and specialized neuronal buffers provide optimal recovery of both full-length PARP-1 and its proteolytic fragments, with the specialized neuronal buffer showing particular advantage in preserving the challenging 24 kDa DNA-binding fragment. Guanidinium HCl-based buffers offer excellent performance with superior compatibility for mass spectrometry applications, while RIPA-based modifications, though slightly less efficient in fragment recovery, provide better compatibility for co-immunoprecipitation studies [28].
Detailed Experimental Protocols for PARP-1 Fragment Analysis
Standardized Protocol for Neuronal Cell Lysis and PARP-1 Fragment Preservation
The following step-by-step protocol has been optimized specifically for neuronal cells and tissue samples to ensure maximal preservation of PARP-1 fragments while maintaining biological relevance:
Preparation of Lysis Buffer: Prepare fresh specialized neuronal lysis buffer containing 50mM HEPES (pH 7.4), 150mM KCl, 2mM MgCl₂, 1% SDS, 0.5% CHAPS, 2M urea, 10% glycerol, 1mM EGTA, 0.1mM ZnCl₂, 2mM TCEP, and complete protease inhibitor cocktail. Add calpain inhibitor I (10μM) immediately before use to preserve calpain-specific cleavage patterns.
Cell Collection and Washing:
- For neuronal cultures: Rapidly aspirate culture medium and place culture vessels on ice.
- Gently rinse cells with ice-cold phosphate-buffered saline (PBS) containing 1mM EDTA to inhibit metalloproteases.
- Completely remove wash solution before proceeding to lysis.
Cell Lysis:
- Add appropriate volume of lysis buffer (100-200μL for a 35mm culture dish, 500μL for a 60mm dish).
- For adherent neuronal cultures: Use a cell scraper to dislodge cells and transfer the suspension to a pre-chilled microcentrifuge tube.
- Vortex samples vigorously for 10-15 seconds to ensure complete homogenization.
Incubation and Shearing:
- Incubate samples on ice for 20 minutes with occasional vortexing.
- Pass lysate through a 25-gauge needle 5-10 times to shear DNA and reduce viscosity, which significantly improves the extraction of the DNA-bound 24 kDa fragment.
Clearing Lysates:
- Centrifuge at 16,000 × g for 15 minutes at 4°C to remove insoluble material.
- Transfer supernatant to a fresh pre-chilled microcentrifuge tube.
Protein Quantification and Storage:
- Determine protein concentration using a compatible assay (e.g., BCA assay with SDS-compatible standards).
- Aliquot samples to avoid repeated freeze-thaw cycles and store at -80°C for long-term preservation.
Troubleshooting Guide for PARP-1 Fragment Analysis
Common challenges in PARP-1 fragment analysis and their solutions include:
Incomplete 24 kDa Fragment Extraction: If the 24 kDa fragment is consistently under-represented, increase the duration and vigor of the needle shearing step or include a brief sonication (3 × 5-second pulses at 20% amplitude) to more effectively disrupt DNA-protein complexes.
Fragment Degradation: If additional bands appear below the expected fragments, ensure protease inhibitors are fresh and used at correct concentrations. Consider adding 10mM N-ethylmaleimide to inhibit cysteine proteases and 1mM PMSF for serine proteases.
Poor Western Blot Transfer: Due to the high DNA content in PARP-1 samples, extend transfer times for Western blots or include a brief DNase I treatment (15 minutes at room temperature) after electrophoresis but before transfer.
Inconsistent Results Between Samples: Standardize the number of cells and protein loading across samples. Normalize to 20-30μg total protein per lane for optimal PARP-1 detection.
Research Reagent Solutions for PARP-1 Studies
A carefully selected toolkit of reagents is essential for successful PARP-1 cleavage studies in neuronal systems. The following table outlines critical components and their specific functions in preserving and detecting PARP-1 fragments:
Table 3: Essential Research Reagents for PARP-1 Cleavage Studies
| Reagent Category | Specific Examples | Function in PARP-1 Studies | Considerations for Neuronal Cells |
|---|---|---|---|
| Primary Detergents | SDS, CHAPS, Triton X-100 | Solubilize full-length PARP-1 and fragments from different cellular compartments | SDS concentrations of 1-4% optimal for complete extraction; CHAPS preserves protein complexes |
| Chaotropic Agents | Guanidinium HCl, Urea | Denature proteins and inhibit proteases; improve extraction efficiency | 4-6M Guanidinium HCl effective but requires cleanup; 2M urea milder alternative |
| Protease Inhibitors | Calpain Inhibitor I, Caspase Inhibitors (Z-VAD-FMK), PMSF, N-ethylmaleimide | Preserve specific cleavage patterns by inhibiting active proteases | Cell-type specific; calpain inhibition crucial for neuronal apoptosis models |
| Reducing Agents | TCEP, DTT | Maintain reduced cysteine residues; prevent artificial crosslinking | TCEP more stable than DTT; essential for zinc finger domain integrity in 24kDa fragment |
| Chelating Agents | EDTA, EGTA | Inhibit metalloproteases; regulate zinc-dependent DNA binding | EGTA preferential for calcium-dependent proteases; EDTA for general metalloproteases |
| Phosphatase Inhibitors | Sodium fluoride, Sodium orthovanadate | Preserve phosphorylation states that may regulate PARP-1 cleavage | Particularly important for signaling studies involving PARP-1 regulation |
| Nuclease Agents | DNase I, Benzonase | Reduce viscosity from genomic DNA; improve fragment resolution | Critical for efficient extraction of DNA-bound 24kDa fragment |
PARP-1 Signaling and Cleavage Pathways in Neuronal Cells
The following diagram illustrates the key proteolytic pathways that generate specific PARP-1 cleavage fragments in neuronal cells, and their functional consequences:
Experimental Workflow for PARP-1 Fragment Preservation and Detection
The comprehensive workflow below outlines the complete experimental process from sample preparation to data interpretation for PARP-1 cleavage studies:
The optimized lysis buffer formulations and standardized protocols presented in this application note provide researchers with validated methods for preserving PARP-1 cleavage fragments in neuronal cell systems. The specialized neuronal lysis buffer, containing a balanced combination of SDS and CHAPS detergents with urea and specific protease inhibitors, demonstrates superior performance in preserving the challenging 24 kDa DNA-binding fragment while maintaining the integrity of other proteolytic products. The quantitative comparison of buffer systems offers clear guidance for selecting appropriate lysis conditions based on specific research objectives, whether focused on canonical apoptosis detection, differentiation between cell death pathways, or comprehensive mass spectrometry-based analyses.
As research on PARP-1 biology continues to evolve, particularly in the context of neuronal injury and neurodegenerative diseases, these optimized sample preparation methods will enable more accurate assessment of PARP-1 cleavage events as biomarkers of specific cell death pathways. The integration of these protocols with emerging techniques in spatial proteomics and single-cell analysis represents a promising direction for future methodological development. Through the implementation of these standardized approaches, researchers can achieve greater reproducibility and biological relevance in their studies of PARP-1-mediated cell death mechanisms in neurological contexts, ultimately contributing to improved understanding of neuropathological processes and potential therapeutic interventions.
Harvesting and Preparing Samples from Primary Neuronal Cultures and Cell Lines
The detection of PARP-1 cleavage is a critical methodology in neuronal cell research, serving as a key biomarker for identifying specific cell death pathways in both physiological and pathological contexts. Proper sample harvesting and preparation are paramount to preserving the integrity of PARP-1 and its cleavage fragments, which can provide insights into neurodegenerative mechanisms and potential therapeutic interventions. This protocol details standardized procedures for obtaining high-quality samples from primary neuronal cultures and established cell lines, specifically optimized for the reliable detection of PARP-1 cleavage events. The methodologies outlined here are designed to minimize proteolytic degradation and maintain post-translational modifications that are essential for accurate analysis in downstream applications including Western blotting, immunofluorescence, and enzymatic activity assays.
Cell Culture Models for PARP-1 Research
Selecting appropriate cellular models is fundamental to studying PARP-1 biology in neuronal contexts. Different model systems offer distinct advantages for investigating specific research questions related to DNA damage response and cleavage events.
Table 1: Neuronal Cell Models for PARP-1 Cleavage Studies
| Cell Model | Characteristics | Applications in PARP-1 Research | References |
|---|---|---|---|
| Primary Cortical Neurons | Closest to in vivo physiology, post-mitotic, appropriate synaptic connectivity | Studies on physiological neuronal PARP-1 function and excitotoxicity | [29] |
| SH-SY5Y Neuroblastoma Cell Line | Human-derived, can be differentiated to neuron-like phenotype | Models of ischemic challenge (OGD/ROG), PARP-1 cleavage product function | [30] |
| SK-N-BE(2)C Neuroblastoma Cell Line | MYCN-amplified, high-risk neuroblastoma model | Oncogene amplification studies, DNA damage response in cancer | [31] [32] |
| KELLY Neuroblastoma Cell Line | MYCN-amplified, aggressive disease model | Replication stress-induced PARP-1 activation studies | [31] |
| iPSC-Derived Neurons | Patient-specific, disease modeling capability | Neurodevelopmental disorders, patient-specific PARP-1 dysfunction | [33] [34] |
| BV2 Microglial Cell Line | Murine microglia, CNS immune cells | Neuroinflammation studies, cytoplasmic PARP-1 translocation | [35] |
Experimental Workflow for Sample Preparation
The following diagram illustrates the complete experimental workflow from cell culture to sample analysis for PARP-1 cleavage detection:
Harvesting Protocols
Harvesting from Adherent Cell Cultures
The harvesting procedure varies significantly between different cell models and must be optimized to preserve protein integrity and post-translational modifications.
Primary Neuronal Cultures
Materials:
- Primary cortical neurons from embryonic day 16-18 rodents
- Ice-cold phosphate-buffered saline (PBS), calcium and magnesium-free
- Cell scrapers with rubber paddles
- Pre-chilled microcentrifuge tubes
- Tabletop centrifuge maintained at 4°C
Procedure:
- Culture Preparation: Plate primary cortical neurons on poly-D-lysine coated culture vessels at appropriate density (typically 50,000-100,000 cells/cm²) and maintain for 10-14 days in vitro to establish mature synaptic connections [29].
- Treatment Application: Apply experimental treatments directly to culture medium. For PARP-1 activation studies, treat with oligomeric Aβ₁–₄₂ (1 μM) for 8-48 hours to induce DNA damage and PARP-1 activation [29].
- Medium Removal: Aspirate culture medium completely using vacuum aspiration.
- Washing: Gently add 5-10 mL of ice-cold PBS per 75 cm² flask to remove residual medium and serum proteins. Tilt culture vessel to ensure complete coverage and immediately aspirate.
- Cell Detachment: Add minimal volume of ice-cold PBS (1 mL per 75 cm²) to maintain moisture. Using a cell scraper, gently but firmly detach cells by applying even pressure and sweeping across the entire growth surface.
- Collection: Transfer the cell suspension to pre-chilled 1.5 mL microcentrifuge tubes.
- Centrifugation: Pellet cells at 500 × g for 5 minutes at 4°C.
- Supernatant Removal: Carefully aspirate supernatant without disturbing the cell pellet.
Neuroblastoma Cell Lines
Materials:
- Trypsin-EDTA solution (0.25%) for cell detachment
- Soybean trypsin inhibitor or serum-containing medium for neutralization
- Tabletop centrifuge with cooling capability
Procedure:
- Culture Preparation: Maintain neuroblastoma cell lines (e.g., SH-SY5Y, SK-N-BE(2)C, KELLY) in appropriate medium until 70-80% confluent [31] [30].
- Treatment Application: Apply experimental treatments. For MYCN-amplified lines (SK-N-BE(2)C, KELLY), consider CRISPR-Cas9 nickase targeting to induce replication-dependent DNA damage [31].
- Medium Removal: Aspirate culture medium completely.
- Washing: Wash cells once with 5-10 mL PBS per 75 cm² flask.
- Trypsinization: Add pre-warmed trypsin-EDTA solution (1 mL per 75 cm²) and incubate at 37°C for 2-3 minutes until cells detach.
- Neutralization: Add 2 volumes of complete medium or trypsin inhibitor to neutralize trypsin activity.
- Collection and Centrifugation: Transfer cell suspension to tubes and pellet at 500 × g for 5 minutes at 4°C.
- Washing: Resuspend pellet in PBS and repeat centrifugation to remove residual trypsin.
Cell Counting and Viability Assessment
Accurate cell counting ensures consistent loading across experiments and confirms treatment effects on viability.
Materials:
- Hemocytometer or automated cell counter
- Trypan blue solution (0.4%)
- Microscope with 10× objective
Procedure:
- Cell Resuspension: Resuspend cell pellet in 1 mL of PBS or appropriate buffer.
- Dilution: Mix 10 μL of cell suspension with 10 μL of trypan blue solution (1:1 dilution).
- Counting: Load 10 μL of the mixture onto hemocytometer and count cells in all four corner squares.
- Calculation: Viable cells/mL = (Average count per square) × 2 (dilution factor) × 10⁴
- Viability Assessment: Calculate viability percentage as (unstained cells / total cells) × 100.
Cell Lysis and Protein Extraction
The lysis buffer composition is critical for preserving PARP-1 cleavage fragments and maintaining protein modifications.
Lysis Buffer Formulations
Table 2: Lysis Buffer Compositions for PARP-1 Studies
| Lysis Buffer Type | Composition | Applications | Advantages | Limitations |
|---|---|---|---|---|
| RIPA Buffer | 50 mM Tris-HCl (pH 8.0), 150 mM NaCl, 1% NP-40, 0.5% sodium deoxycholate, 0.1% SDS | General PARP-1 Western blotting, total protein extraction | Efficient nuclear protein extraction, reduces viscosity | May disrupt weak protein interactions |
| Non-denaturing Lysis Buffer | 20 mM Tris-HCl (pH 8.0), 137 mM NaCl, 1% NP-40, 10% glycerol | Co-immunoprecipitation studies, protein complexes | Preserves protein-protein interactions | Less efficient for nuclear proteins |
| Cytosolic Extraction Buffer | 10 mM HEPES (pH 7.9), 10 mM KCl, 0.1 mM EDTA, 0.1 mM EGTA, 1 mM DTT, protease inhibitors | Subcellular fractionation, cytoplasmic PARP-1 studies | Clean cytoplasmic extracts | Multiple steps increase processing time |
| Urea Lysis Buffer | 8 M urea, 50 mM Tris-HCl (pH 8.0), 1% SDS, 5 mM DTT | Insoluble protein fractions, aggregated proteins | Efficient solubilization of aggregated proteins | Incompatible with some assays |
Standard Lysis Protocol
Materials:
- Appropriate lysis buffer (see Table 2)
- Protease inhibitor cocktail (include PARP-specific inhibitors for activity studies)
- Phosphatase inhibitor cocktail (for phosphorylation studies)
- PARP inhibitor (optional, for preventing auto-ADP-ribosylation)
- Benzonase nuclease (optional, for reducing viscosity)
- Sonicator with microtip or needle and syringe for mechanical disruption
Procedure:
- Inhibitor Preparation: Add protease and phosphatase inhibitors to lysis buffer immediately before use. For PARP activity preservation studies, include PARP inhibitors such as 10 μM ABT-888 (veliparib) [29] [35].
- Cell Lysis: Resuspend cell pellet in appropriate volume of lysis buffer (typically 50-100 μL per 10⁶ cells).
- Incubation: Incubate on ice for 15-30 minutes with occasional vortexing.
- Mechanical Disruption:
- Sonication: Sonicate samples on ice with 3 pulses of 10 seconds each at 20-30% amplitude, with 30-second rest intervals.
- Needle Shearing: Pass lysate through 27-gauge needle 10-15 times.
- Centrifugation: Clarify lysates by centrifugation at 16,000 × g for 15 minutes at 4°C.
- Supernatant Collection: Transfer supernatant to fresh pre-chilled tubes, avoiding the pellet.
Subcellular Fractionation
For studies investigating PARP-1 translocation, as observed during microglia activation [35], subcellular fractionation is essential.
Materials:
- Hypotonic lysis buffer (10 mM HEPES pH 7.9, 1.5 mM MgCl₂, 10 mM KCl, 0.5 mM DTT)
- High-salt extraction buffer (20 mM HEPES pH 7.9, 25% glycerol, 1.5 mM MgCl₂, 0.5 M NaCl, 0.2 mM EDTA, 0.5 mM DTT)
- Dounce homogenizer with tight-fitting pestle
Procedure:
- Cell Washing: Wash cell pellet with ice-cold PBS.
- Swelling: Resuspend cells in 5 volumes of hypotonic buffer and incubate on ice for 15 minutes.
- Homogenization: Dounce cells with 15-20 strokes using tight-fitting pestle.
- Cytosolic Fraction: Centrifuge at 3,000 × g for 10 minutes at 4°C; collect supernatant as cytosolic fraction.
- Nuclear Extraction: Resuspend pellet in high-salt extraction buffer and rotate at 4°C for 30 minutes.
- Nuclear Fraction: Centrifuge at 16,000 × g for 15 minutes at 4°C; collect supernatant as nuclear fraction.
Protein Quantification and Quality Assessment
Accurate protein quantification ensures equal loading across samples, which is critical for detecting subtle changes in PARP-1 cleavage patterns.
Quantitative Methods
BCA Assay Protocol:
- Prepare albumin standards in the same buffer as samples.
- Mix BCA working reagent according to manufacturer's instructions.
- Add 10 μL of sample or standard to 200 μL working reagent in microplate wells.
- Incubate at 37°C for 30 minutes.
- Measure absorbance at 562 nm and calculate protein concentration from standard curve.
Bradford Assay Protocol:
- Prepare protein standards in lysis buffer.
- Add 5 μL sample to 250 μL Bradford reagent.
- Incubate 10 minutes at room temperature.
- Measure absorbance at 595 nm.
Quality Assessment
- Pre-electrophoresis Staining: Use Ponceau S staining on nitrocellulose membrane after transfer to visualize total protein pattern and assess transfer efficiency.
- Housekeeping Proteins: Include antibodies against GAPDH, β-actin, or histone H3 for cytosolic, total, and nuclear loading controls, respectively.
The Scientist's Toolkit: Essential Research Reagents
Table 3: Key Research Reagents for PARP-1 Cleavage Studies
| Reagent Category | Specific Examples | Function/Application | Working Concentrations | References |
|---|---|---|---|---|
| PARP Inhibitors | ABT-888 (Veliparib), AG-014699 (Rucaparib), BMN 673 (Talazoparib) | Inhibit PARP catalytic activity, study PARP-1 function in cell death | 1 μM in vitro; 10-50 mg/kg in vivo | [29] |
| DNA Damage Inducers | Oligomeric Aβ₁–₄₂, Hydrogen Peroxide, Tert-Butyl Hydroperoxide | Induce DNA strand breaks, activate PARP-1 | Aβ₁–₄₂: 1 μM; H₂O₂: 100-500 μM | [29] [34] |
| Apoptosis Inducers | Staurosporine, Etoposide, Actinomycin D | Activate caspase-dependent PARP-1 cleavage | Varies by cell type (nM-μM range) | [10] |
| Primary Antibodies | Anti-PARP-1 (full length), Anti-cleaved PARP-1 (Asp214), Anti-PAR | Detect full length and cleaved PARP-1, PAR formation | Manufacturer's recommendations | [29] [10] |
| Protease Inhibitors | PMSF, Aprotinin, Leupeptin, Pepstatin A | Prevent nonspecific proteolysis during sample preparation | Standard cocktail concentrations | [35] |
| Cell Death Assays | Propidium Iodide, Alamar Blue, MTT | Assess viability and cytotoxicity in treatment paradigms | Manufacturer's recommendations | [29] |
PARP-1 Biology and Cleavage Signatures
Understanding PARP-1 domains and their cleavage patterns is essential for interpreting experimental results. The following diagram illustrates PARP-1 domain structure and protease cleavage sites:
PARP-1 Cleavage Signatures
Different proteases generate characteristic PARP-1 fragments that serve as biomarkers for specific cell death pathways:
Caspase-Dependent Cleavage (Apoptosis):
- Fragments: 89 kDa (AMD + CD) and 24 kDa (DBD)
- Biological Significance: The 24 kDa fragment irreversibly binds to damaged DNA, acting as a trans-dominant inhibitor of PARP-1 activity and conserving cellular ATP during apoptosis [10] [30].
Calpain-Dependent Cleavage (Excitotoxicity):
- Fragments: 55 kDa and 42 kDa fragments
- Biological Significance: Associated with calcium-mediated excitotoxic cell death in neurological disorders [10].
Troubleshooting Guide
Table 4: Troubleshooting Common Issues in PARP-1 Sample Preparation
| Problem | Potential Causes | Solutions | Preventive Measures |
|---|---|---|---|
| No PARP-1 signal | Protease degradation, inefficient transfer, antibody issues | Fresh inhibitors, transfer validation, antibody optimization | Aliquot samples, include positive controls |
| High background | Non-specific antibody binding, insufficient blocking | Optimize blocking conditions, increase wash stringency | Use 5% BSA or non-fat milk, optimize antibody dilution |
| Inconsistent cleavage detection | Uneven loading, sample degradation, improper lysis | Normalize protein loading, fresh inhibitors, standardized lysis | BCA quantification, protease inhibitor cocktails |
| Multiple unexpected bands | Non-specific cleavage, alternative splicing, protein aggregation | Include appropriate controls, optimize denaturation conditions | Fresh preparation of reagents, standardized protocols |
| Poor nuclear extraction | Inefficient lysis, improper buffer formulation | Optimize salt concentration, include nuclease treatment | Validate fractionation with nuclear markers (Lamin A/C) |
Proper harvesting and sample preparation from primary neuronal cultures and cell lines are fundamental techniques that significantly impact the reliability of PARP-1 cleavage detection. The protocols outlined here provide standardized methodologies optimized for preserving PARP-1 integrity and detecting its cleavage fragments, which serve as critical biomarkers in neuronal cell death research. By implementing these carefully optimized procedures—from cell model selection through protein extraction—researchers can ensure sample quality that enables accurate interpretation of PARP-1's roles in DNA damage response, cell death pathways, and neurodegenerative mechanisms. These foundational techniques support subsequent analytical approaches that advance our understanding of PARP-1 biology in neurological health and disease.
The integrity of research data, particularly in the study of labile proteins like PARP-1, is fundamentally dependent on the quality of sample preparation. PARP-1, a critical nuclear enzyme involved in DNA repair, cellular stress responses, and transcriptional regulation, is highly susceptible to artefactual proteolysis and post-translational modifications during cell lysis and processing [36]. This application note details standardized protocols for the preparation of neuronal cell lysates to ensure the accurate detection of PARP-1 and its cleavage products, a prerequisite for valid research conclusions in neuroscience and drug development.
The Vulnerability of PARP-1 to Proteolysis
PARP-1 is a 116-kDa modular protein comprising three primary domains: an N-terminal DNA-binding domain, a central automodification domain, and a C-terminal catalytic domain [36]. The automodification domain, rich in glutamate, aspartate, and lysine residues, is particularly sensitive to proteolytic attack. Artefactual cleavage in this region can generate fragments that are indistinguishable from those produced by physiological apoptotic processes (e.g., cleavage by caspase-3), leading to significant data misinterpretation [36].
Furthermore, PARP-1's function is regulated by a complex interplay of post-translational modifications, including phosphorylation, ADP-ribosylation, SUMOylation, and ubiquitylation [37] [38]. During sample isolation, cellular phosphatases can remain active and rapidly erase phosphorylation marks, thereby altering the apparent molecular weight, activity, and interaction partners of PARP-1. Therefore, the simultaneous inhibition of both proteases and phosphatases is non-negotiable for capturing the true state of PARP-1 in neuronal cells.
Inhibitor Selection and Formulation
A targeted cocktail of inhibitors is required to preserve the integrity of PARP-1. The following table summarizes the essential inhibitors, their targets, and their mechanisms of action.
Table 1: Essential Protease and Phosphatase Inhibitors for PARP-1 Research
| Inhibitor | Target Enzymes | Mechanism of Action | Final Working Concentration |
|---|---|---|---|
| PMSF | Serine Proteases (e.g., Trypsin, Chymotrypsin) | Irreversible sulfonylation of active site serine residue | 0.1 - 1 mM |
| Aprotinin | Serine Proteases (Plasmin, Kallikrein) | Reversible competitive inhibition | 0.08 - 2 µg/mL |
| Leupeptin | Cysteine, Serine, & Threonine Proteases | Reversible inhibition of active site | 0.5 - 2 µg/mL |
| Pepstatin A | Aspartic Proteases (e.g., Cathepsin D) | Potent reversible inhibition | ~1 µM |
| EDTA / EGTA | Metallocoproteases (e.g., MMPs) | Chelates Zn²⁺ and other metal cofactors | 1 - 10 mM |
| Sodium Orthovanadate | Tyrosine, Alkaline, & Acid Phosphatases | Reversible competitive inhibitor (mimics phosphate) | 0.1 - 1 mM |
| Sodium Fluoride | Serine/Threonine Phosphatases | Irreversible inhibitor | 1 - 10 mM |
| β-Glycerophosphate | Serine/Threonine Phosphatases | Reversible competitive inhibitor (substrate analogue) | 1 - 10 mM |
Recommended Commercial Cocktails
For consistency and efficiency, commercially available cocktails are highly recommended. These are typically provided as concentrated stock solutions or tablets.
- Complete Ultra EDTA-free Protease Inhibitor Cocktail (Roche): Ideal for preventing artefactual proteolysis without interfering with metal-dependent processes.
- PhosSTOP Phosphatase Inhibitor Cocktails (Roche): Provides broad-spectrum inhibition of serine/threonine, tyrosine, and alkaline phosphatases.
- Halt Protease and Phosphatase Inhibitor Cocktail (Thermo Fisher Scientific): A convenient, single-use formulation for combined protection.
Protocol for Preparing Neuronal Cell Lysates for PARP-1 Immunoblotting
The following protocol is optimized for the culture and lysis of primary neuronal cells or neuronal cell lines for subsequent PARP-1 detection by Western blot.
Materials and Reagents
- Cultured neuronal cells (e.g., primary cortical neurons or SH-SY5Y cell line)
- Pre-warmed PBS (Calcium- and Magnesium-free)
- Appropriate culture medium
- Lysis Buffer: 50 mM Tris-HCl (pH 7.5), 150 mM NaCl, 1% NP-40, 0.5% Sodium Deoxycholate
- Freshly Added Inhibitors: 1x concentration of chosen protease and phosphatase inhibitor cocktails (e.g., Complete Ultra and PhosSTOP), 1 mM PMSF, 1 mM Sodium Orthovanadate
- Cell scrapers (for adherent cells)
- Refrigerated microcentrifuge
Step-by-Step Procedure
- Pre-Chill and Prepare: Place PBS and lysis buffer on ice. Prepare the complete lysis buffer by adding protease and phosphatase inhibitors immediately before use.
- Harvest Cells:
- For Adherent Cells: Aspirate the culture medium and gently wash the cell monolayer twice with ice-cold PBS. Aspirate PBS completely.
- For Suspension Cells: Pellet cells by centrifugation at 300 × g for 5 min at 4°C. Gently wash the pellet with ice-cold PBS and re-pellet.
- Lyse Cells:
- For Adherent Cells: Add an appropriate volume of complete ice-cold lysis buffer (e.g., 100-200 µL per 10⁶ cells) directly to the culture vessel. Lyse cells on ice for 5-10 minutes, then dislodge the lysate using a cell scraper.
- For Suspension Cells: Resuspend the washed cell pellet in complete ice-cold lysis buffer by gentle pipetting. Incubate on ice for 15-30 minutes with occasional vortexing.
- Clarify Lysate: Transfer the lysate to a pre-chilled microcentrifuge tube. Centrifuge at 12,000 - 16,000 × g for 15 minutes at 4°C to pellet insoluble debris.
- Collect and Store Supernatant: Carefully transfer the clarified supernatant (total cell lysate) to a new pre-chilled tube. Keep the lysate on ice at all times.
- Protein Quantification and Analysis: Determine the protein concentration immediately using a compatible assay (e.g., BCA or Bradford). Dilute the lysate with Laemmli sample buffer, boil for 5-10 minutes, and proceed with SDS-PAGE and Western blotting for PARP-1.
Critical Step: The entire procedure, from washing to boiling in sample buffer, must be performed quickly and continuously on ice or at 4°C to minimize the window for artefactual modification.
Workflow and PARP-1 Signaling Context
The following diagram illustrates the critical steps where inhibitors are deployed to ensure sample integrity, contextualized within the broader PARP-1 biology relevant to neuronal research.
Diagram 1: Sample preparation workflow and PARP-1 signaling context. Inhibitors are critical to prevent artefactual cleavage during lysis, which can be confused with physiological caspase cleavage.
The Scientist's Toolkit: Research Reagent Solutions
Table 2: Essential Research Reagents for PARP-1 Cleavage Studies
| Reagent / Assay | Supplier Examples | Specific Function in PARP-1 Research |
|---|---|---|
| Complete Ultra, EDTA-free | Roche, Sigma-Aldrich | Broad-spectrum protease inhibition without affecting metal-dependent PARP-1 activity. |
| PhosSTOP | Roche, Sigma-Aldrich | Inhibits phosphatases to preserve PARP-1's phosphorylation state and migration on gels. |
| Anti-PARP-1 Antibody (for Western Blot) | Cell Signaling Technology, Santa Cruz Biotechnology | Detects full-length (~116 kDa) and cleaved fragments (e.g., ~89 kDa) of PARP-1. |
| Anti-PAR Antibody | Millipore, Trevigen | Monitors PARP-1 enzymatic activity by detecting its product, poly(ADP-ribose). |
| Caspase-3 Inhibitor (Z-VAD-FMK) | Tocris, Selleckchem | Positive control to distinguish apoptotic from artefactual cleavage in cell-based assays. |
| Olaparib / Talazoparib (PARP inhibitors) | Selleckchem, MedChemExpress | Controls for PARP-1 catalytic inhibition and trapping in mechanistic studies [39] [40]. |
| PVDF Membrane | Bio-Rad, Millipore | Optimal for immobilizing high molecular weight proteins like PARP-1 for immunodetection. |
| Enhanced Chemiluminescence (ECL) Substrate | Thermo Fisher, Bio-Rad | Provides high-sensitivity detection for low-abundance PARP-1 cleavage products. |
Troubleshooting Common Issues
- High Background or Smearing on Blot: This often indicates protein degradation. Ensure inhibitors are fresh and added to the lysis buffer immediately before use. Confirm that all steps are performed on ice and that samples are boiled immediately after preparation.
- Failure to Detect PARP-1 Cleavage: Verify the efficacy of your positive control (e.g., cells treated with a known apoptosis inducer like staurosporine). Ensure that the lysis buffer is sufficiently stringent (contains 1% NP-40 or similar) to solubilize nuclear PARP-1.
- Inconsistent Band Shifts: This can be caused by variable phosphatase activity. Ensure the phosphatase inhibitor cocktail is potent and used at the correct concentration. Sodium orthovanadate solutions must be activated (heated to pH 10 until colorless) for maximum efficacy.
Rigorous sample preparation is the cornerstone of reliable PARP-1 research. The implementation of the detailed protocols and inhibitor strategies outlined in this application note will empower researchers to confidently distinguish genuine apoptotic PARP-1 cleavage from artefactual proteolysis, thereby ensuring the accuracy and biological relevance of their data in neuronal models and beyond.
Guidelines for Protein Quantification and Sample Loading for Western Blot
Western blotting is an indispensable technique in molecular biology that enables researchers to detect specific proteins within complex mixtures through antibody-mediated detection. This technique is particularly crucial in neuroscience research focused on PARP-1 cleavage detection, as it serves as a definitive biomarker for identifying specific cell death pathways in neuronal cells. The sample preparation phase represents the most critical determinant of experimental success, as improper handling can lead to protein degradation, post-translational modifications, or incomplete extraction that compromises data integrity. When studying delicate processes like PARP-1 cleavage during neuronal death, maintaining sample quality through optimized preparation protocols is essential for obtaining biologically relevant results that accurately reflect cellular events [41] [42].
The detection of PARP-1 cleavage fragments provides valuable insights into the activation of specific proteolytic pathways during neuronal injury and disease. As a nuclear enzyme involved in DNA repair, PARP-1 undergoes characteristic proteolytic cleavage by caspases during apoptosis, generating signature 89-kD catalytic and 24-kD DNA-binding domain fragments [42]. These fragments serve as specific molecular signatures that distinguish apoptotic cell death from other forms of cell demise. Additionally, research has revealed that PARP-1 can be cleaved by other proteases including calpains, cathepsins, granzymes, and matrix metalloproteinases under various pathological conditions, producing distinct fragment patterns that identify the specific protease activities involved [42]. This makes accurate sample preparation and protein quantification paramount for preserving these delicate molecular signatures that reflect the underlying neuropathological mechanisms.
Theoretical Foundations: PARP-1 Cleavage as a Cell Death Biomarker
PARP-1 Structure and Cleavage Fragments
PARP-1 is a multifunctional nuclear enzyme comprising several distinct domains: a 46-kD DNA-binding domain (DBD) containing two zinc finger motifs at the NH2 terminus, a 22-kD auto-modification domain (AMD) in the central region, and a 54-kD catalytic domain (CD) at the carboxyl terminus that polymerizes poly-ADP ribose units from NAD+ onto target proteins [42]. During apoptotic cell death, executioner caspases (primarily caspase-3 and -7) cleave PARP-1 at a specific aspartic acid residue (located within the glutamate-valine-aspartate-glycine sequence), producing characteristic fragments of 89-kD and 24-kD [42]. The 89-kD fragment contains both the auto-modification and catalytic domains but exhibits greatly reduced DNA binding capacity and often translocates from the nucleus to the cytosol. Meanwhile, the 24-kD fragment, containing the two zinc-finger motifs from the DBD, remains tightly bound to damaged DNA in the nucleus where it functions as a trans-dominant inhibitor of DNA repair processes [42].
Beyond its established role in apoptosis, PARP-1 cleavage serves as a sensitive indicator for various cell death pathways activated in neurological disorders including cerebral ischemia, Alzheimer's disease, Parkinson's disease, traumatic brain injury, and excitotoxicity [42]. The specific pattern of PARP-1 fragments can identify the particular proteases activated in these conditions, providing mechanistic insights into neurodegenerative processes. For instance, research has demonstrated that PARP-1 displays regional and cellular-specific patterns of activation and degradation in response to status epilepticus, with PARP-1 hyperactivation driving neuronal death in hippocampal CA1 and CA3 regions, while PARP-1 degradation mediates neurodegeneration in piriform cortex neurons [43].
Significance in Neuronal Cell Death Pathways
The following diagram illustrates the central role of PARP-1 cleavage in neuronal cell death pathways and its detection via western blotting:
Figure 1: PARP-1 Cleavage in Neuronal Cell Death Pathways. This diagram illustrates how neuronal injury triggers PARP-1 cleavage via caspase activation, generating detectable fragments that serve as apoptosis biomarkers.
Sample Preparation Methodology for Neuronal Cells
Cell Lysis and Protein Extraction
Proper lysis conditions are critical for preserving PARP-1 cleavage fragments while preventing additional proteolysis during sample preparation. For neuronal cells and tissues, a RIPA lysis buffer is generally recommended as it effectively extracts nuclear, membrane-bound, and cytoplasmic proteins while disrupting protein-protein interactions [41] [44]. The composition typically includes:
- 25 mM Tris-HCl (pH 7.6)
- 150 mM NaCl
- 1% NP-40 or Triton X-100
- 1% sodium deoxycholate
- 0.1% SDS
To preserve the integrity of PARP-1 and its cleavage fragments, protease and phosphatase inhibitors must be added immediately before use [41] [44] [45]. For specialized research focusing on phosphorylation events, phosphatase inhibitors are equally important. The following table summarizes essential inhibitors for PARP-1 cleavage studies:
Table 1: Essential Protease and Phosphatase Inhibitors for PARP-1 Studies
| Inhibitor | Final Concentration | Target Enzymes | Special Considerations |
|---|---|---|---|
| PMSF | 1 mM | Serine proteases | Dilute in isopropanol; short half-life in aqueous solutions |
| Aprotinin | 2 µg/mL | Trypsin, Chymotrypsin, Plasmin | Prepare stock at 10 mg/ml in water; freeze aliquots |
| Leupeptin | 1-10 µg/mL | Lysosomal proteases | Dilute in water; freeze aliquots |
| EDTA | 1-10 mM | Mg²⁺ and Mn²⁺ metalloproteases | Prepare 0.5M stock in deionized water |
| Sodium Orthovanadate | 1 mM | Tyrosine phosphatases | Prepare in fume hood due to toxicity |
| Sodium Fluoride | 5-10 mM | Serine/threonine phosphatases | Prepare stock solution in water |
Specific Protocols for Neuronal Cells and Tissues
A. Adherent Neuronal Cell Cultures
- Place culture dishes on ice and carefully remove culture medium [44] [45]
- Wash cells gently with ice-cold PBS to remove residual media and serum proteins [45]
- Aspirate PBS completely and add ice-cold lysis buffer (~200-400 µL for a 6-well plate) [44]
- Gently shake or swirl for 5 minutes on ice to ensure complete coverage [44]
- Collect the lysate using a cell scraper and transfer to a pre-chilled microcentrifuge tube
- Centrifuge at ~14,000 × g for 15 minutes at 4°C to pellet insoluble debris [44] [45]
- Transfer supernatant to a new tube and discard the pellet
B. Brain Tissue Samples
- Dissect brain regions of interest rapidly on ice using pre-chilled tools [45]
- Weigh tissue samples and add ice-cold lysis buffer (1,200 µL per 200 mg tissue) [45]
- Homogenize using an automated homogenizer for approximately 3 minutes at 4°C [45]
- Incubate homogenate for 5 minutes on ice to ensure complete lysis
- Centrifuge at 10,000 × g for 5-10 minutes at 4°C [44] [45]
- Collect supernatant as the soluble protein lysate
For optimal results when working with neuronal tissues, consider regional microdissection to isolate specific brain areas with known PARP-1 cleavage patterns, such as hippocampal subregions (CA1, CA3) or piriform cortex, which exhibit distinct PARP-1 responses to injury [43].
Protein Quantification Methods
Accurate protein quantification is essential for meaningful comparison of PARP-1 cleavage across experimental conditions. Unequal protein loading can lead to misinterpretation of cleavage fragment ratios and erroneous conclusions about cell death extent.
Colorimetric Assays: BCA vs. Bradford
The BCA (Bicinchoninic Acid) assay is generally preferred for neuronal samples prepared with detergent-containing lysis buffers, as it is compatible with up to 5% detergents and demonstrates greater protein-to-protein uniformity [44] [46]. The BCA assay works by reducing Cu²⁺ to Cu⁺ by protein peptide bonds in an alkaline environment, followed by colorimetric detection of Cu⁺ by BCA. In contrast, the Bradford assay (based on Coomassie dye binding) is incompatible with detergents but can be used with reducing agents [41].
- Prepare diluted BSA standards in the range of 20-2000 µg/mL
- Mix protein samples with BCA Working Reagent (50 parts Reagent A: 1 part Reagent B)
- Incubate at 37°C for 30 minutes
- Measure absorbance at or near 562 nm using a plate reader
- Determine protein concentration from the standard curve
Sample Preparation for Electrophoresis
After quantification, prepare samples for SDS-PAGE as follows:
Table 2: Sample Preparation for Denaturing Electrophoresis (SDS-PAGE)
| Reagent | Reduced Sample (µL) | Non-reduced Sample (µL) | Purpose |
|---|---|---|---|
| Protein sample | x µL (20-40 µg total protein) | x µL (20-40 µg total protein) | Protein source |
| SDS/LDS sample buffer (4X) | 2.5 µL | 2.5 µL | Denaturation, charge uniformity |
| Reducing agent (10X) | 1 µL | - | Disulfide bond reduction |
| Deionized water | to 10 µL final volume | to 10 µL final volume | Volume adjustment |
For PARP-1 cleavage studies, heat samples at 70°C for 10 minutes rather than 100°C to prevent potential proteolysis while ensuring complete denaturation [44]. The final protein concentration should be adjusted to 1-2 µg/µL for optimal loading [45]. Include a molecular weight marker lane to verify the sizes of full-length PARP-1 (116-kD) and its characteristic cleavage fragments (89-kD) [45].
Sample Loading and Normalization Strategies
Loading Optimization for PARP-1 Detection
For western blot analysis of PARP-1 cleavage, load 20-40 µg of total protein from cell or tissue lysates per lane [45] [46]. This range provides sufficient target protein for detection while avoiding overloading that can cause distortion and poor resolution. When studying low-abundance proteins or cleavage fragments, consider concentrating samples using TCA/acetone precipitation or immunoprecipitation prior to loading [41].
The following workflow diagram outlines the complete process from sample preparation to imaging:
Figure 2: Western Blot Workflow for PARP-1 Cleavage Detection. This diagram outlines the complete experimental workflow from sample preparation to detection, highlighting critical steps for preserving PARP-1 cleavage fragments.
Normalization Techniques: Housekeeping Proteins vs. Total Protein Normalization
Appropriate normalization is essential for accurate quantification of PARP-1 cleavage fragments. While housekeeping proteins (HKPs) like GAPDH, β-actin, and β-tubulin have traditionally been used as loading controls, they present significant limitations for neuronal cell death studies [47]. HKP expression can vary with cell type, developmental stage, tissue pathology, and experimental conditions, potentially leading to misinterpretation of results [47]. Furthermore, HKPs are typically highly abundant and can easily saturate detection signals, complicating accurate quantification.
Total Protein Normalization (TPN) is increasingly recognized as the gold standard for western blot quantification and is now required by many leading journals [47]. TPN normalizes the target protein signal to the total amount of protein in each lane, providing a more robust and reliable normalization method that is unaffected by changes in individual protein expression. For PARP-1 cleavage studies, where overall protein integrity may be compromised during cell death, TPN offers the additional advantage of assessing sample quality. Fluorogenic labeling methods like the No-Stain Protein Labeling Reagent provide sensitive, uniform total protein detection with low background and no destaining steps [47].
Essential Reagents and Materials
Table 3: Research Reagent Solutions for PARP-1 Cleavage Studies
| Reagent/Category | Specific Examples | Function in Protocol |
|---|---|---|
| Lysis Buffers | RIPA Buffer, M-PER, T-PER | Protein extraction from cells/tissues while maintaining solubility |
| Protease Inhibitors | PMSF, Aprotinin, Leupeptin, EDTA | Prevent proteolytic degradation of PARP-1 and its fragments |
| Phosphatase Inhibitors | Sodium Orthovanadate, Sodium Fluoride | Preserve phosphorylation states; crucial for signaling studies |
| Protein Assays | BCA, Bradford | Accurate protein quantification for equal loading |
| Sample Buffers | Laemmli Buffer, LDS Sample Buffer | Denature proteins and impart uniform charge for SDS-PAGE |
| Reducing Agents | DTT, β-mercaptoethanol | Reduce disulfide bonds for complete protein unfolding |
| Gel Systems | 4-12% Bis-Tris, Tris-Glycine | Size-based separation of full-length PARP-1 and cleavage fragments |
| Transfer Systems | Nitrocellulose, PVDF membranes | Immobilize separated proteins for antibody probing |
| Detection Reagents | ECL, Fluorescent substrates | Visualize target proteins with high sensitivity |
| Normalization Tools | No-Stain Protein Labeling Reagent | Enable total protein normalization for accurate quantification |
Proper protein quantification and sample loading represent foundational elements in western blot analysis of PARP-1 cleavage in neuronal cells. Through meticulous attention to sample preparation conditions, appropriate use of protease inhibitors, accurate quantification methods, and implementation of total protein normalization, researchers can ensure the reliability and reproducibility of their findings. These protocols enable precise detection of the subtle changes in PARP-1 cleavage patterns that provide crucial insights into neuronal cell death mechanisms in neurological disorders and potential therapeutic interventions. As journal requirements evolve toward more rigorous quantification standards, adherence to these guidelines will enhance data quality and facilitate publication of robust, clinically relevant findings in neuroscience research.
Poly(ADP-ribose) polymerase 1 (PARP1) is a nuclear enzyme with critical functions in DNA repair, cellular stress response, and the regulation of cell death pathways. As a key DNA damage sensor, PARP1 catalyzes the transfer of ADP-ribose units from NAD+ to target proteins, a process known as poly(ADP-ribosyl)ation. The detection of PARP-1 cleavage fragments has become an essential methodology in cell death research, particularly in neuronal studies where understanding the balance between apoptosis, parthanatos, and other cell death mechanisms is crucial for therapeutic development. This application note provides detailed protocols and strategic guidance for selecting and using antibodies to accurately detect both full-length and cleaved PARP-1 in neuronal cell models, framed within the broader context of sample preparation for PARP-1 cleavage detection.
During apoptosis, PARP-1 is cleaved by caspases-3 and -7 at the conserved sequence DEVD214↓G, generating two primary fragments: a 24-kDa DNA-binding fragment and an 89-kDa catalytic fragment [11] [10]. This cleavage event serves as a well-established biochemical marker for apoptosis, as it inactivates PARP-1's DNA repair function and facilitates the dismantling of the cell. Beyond caspase-mediated cleavage, PARP-1 can also be processed by other proteases including calpains, cathepsins, granzymes, and matrix metalloproteinases, yielding distinct fragment patterns that serve as signatures for specific cell death pathways [10]. The accurate detection of these fragments requires careful antibody selection, optimized sample preparation, and appropriate experimental design.
PARP-1 Biology and Cleavage Significance
PARP-1 Structure and Domains
PARP-1 is a 113-116 kDa modular protein composed of several functional domains: an N-terminal DNA-binding domain (DBD) containing two zinc finger motifs, a central auto-modification domain (AMD), and a C-terminal catalytic domain (CD) [10]. The DNA-binding domain recognizes and binds to DNA strand breaks, while the catalytic domain transfers ADP-ribose units from NAD+ to acceptor proteins. The nuclear localization signal (NLS) is situated near the DNA-binding domain, and the primary caspase cleavage site (DEVD214) is located within the DBD, separating it from the automodification domain [11].
Biological Significance of PARP-1 Cleavage
The cleavage of PARP-1 during apoptosis serves two primary functions: first, it inactivates the DNA repair activity of PARP-1, conserving cellular ATP and NAD+ pools that would otherwise be depleted by excessive PARP-1 activation [10] [4]. Second, the cleavage generates fragments with distinct biological activities. The 24-kDa fragment, containing the DNA-binding domain, remains tightly bound to DNA breaks and acts as a trans-dominant inhibitor of DNA repair by blocking access of intact PARP-1 and other repair factors to DNA damage sites [10]. Recent research has revealed that the 89-kDa fragment can be translocated to the cytoplasm where it functions as a carrier of poly(ADP-ribose) (PAR) polymers, facilitating the release of apoptosis-inducing factor (AIF) from mitochondria and contributing to parthanatos, a caspase-independent programmed cell death pathway [11].
In neuronal systems, PARP-1 cleavage patterns vary depending on the nature and intensity of the stressor. Status epilepticus, for example, induces regional-specific PARP-1 responses in the hippocampus and piriform cortex, with some neurons exhibiting PARP-1 hyperactivation while others show PARP-1 degradation [27]. The functional consequences of PARP-1 cleavage fragments may also differ – studies in neuronal models have demonstrated that while the 24-kDa fragment is protective against ischemic challenge, the 89-kDa fragment can be cytotoxic and promote inflammatory responses through enhanced NF-κB activity [4].
Antibody Selection Strategy
Key Considerations for Antibody Selection
Selecting the appropriate antibody for PARP-1 detection requires careful consideration of several factors, including the specific epitope recognized, clonality, validation, and intended applications. The optimal choice depends on whether the research goal is to detect full-length PARP-1, specific cleavage fragments, or both simultaneously.
Epitope Location: Antibodies targeting the C-terminal region of PARP-1 (approximately amino acids 667-1014) will recognize both full-length PARP-1 (113-116 kDa) and the 89-kDa cleavage fragment [48]. In contrast, antibodies specifically designed to recognize the neo-epitope created by caspase cleavage at Asp214 will detect only the cleaved form of PARP-1 [6]. Antibodies targeting the N-terminal DNA-binding domain may recognize the 24-kDa fragment but might not detect the C-terminal fragments.
Clonality and Specificity: Monoclonal antibodies like [E51] (ab32064) offer superior batch-to-batch consistency and are ideal for standardized applications, whereas polyclonal antibodies may provide higher sensitivity for detecting low-abundance fragments but with potentially greater variability [49]. For neuronal studies where sample may be limited, sensitivity considerations become particularly important.
Validation: Knockout-validated antibodies provide the highest level of confidence in specificity, as demonstrated by the absence of signal in PARP1 knockout cell lines [49]. Additional validation should include confirmation of expected molecular weights and induction of cleavage fragments in apoptosis-positive controls.
Comparison of Commercial PARP-1 Antibodies
Table 1: Comparison of Commercial Antibodies for PARP-1 Detection
| Antibody | Clonality | Epitope/Immunogen | Recognizes | Applications | Key Features |
|---|---|---|---|---|---|
| Anti-Cleaved PARP1 (ab4830) | Polyclonal | Synthetic peptide corresponding to N-terminus of cleavage site (214/215) | 85 kDa cleaved fragment only | WB | Cleavage-site specific; purified to remove reactivity with full-length PARP1 |
| Anti-Cleaved PARP1 [E51] (ab32064) | Monoclonal (Rabbit) | Not specified in detail | Cleaved PARP1 (observed: 25-27 kDa) | WB, IHC-P | KO-validated; reacts with Human, Mouse, Rat; over 400 publications |
| PARP1 Polyclonal (13371-1-AP) | Polyclonal | Recombinant human PARP1 protein (667-1014 aa) | Full-length (113-116 kDa) and cleaved (89 kDa) | WB, IHC, IF/ICC, IP, FC | Recognizes C-terminal region; detects multiple fragments |
The selection of an appropriate antibody should align with the specific research objectives. For definitive detection of apoptosis through caspase activation, cleavage-specific antibodies like ab4830 or ab32064 are optimal. For comprehensive assessment of both full-length and cleaved PARP-1 in the same sample, a C-terminal directed antibody such as 13371-1-AP is preferable. In neuronal research, where multiple cell death pathways may be activated simultaneously, using a combination of antibodies may provide the most complete picture of PARP-1 processing.
Experimental Protocols for PARP-1 Cleavage Detection
Sample Preparation from Neuronal Cultures
Materials:
- RIPA Lysis Buffer (50 mM Tris-HCl pH 7.4, 150 mM NaCl, 1% NP-40, 0.5% sodium deoxycholate, 0.1% SDS) supplemented with protease and phosphatase inhibitors
- CelLytic M lysis reagent (Sigma-Aldrich C2978) as an alternative [50]
- Bicinchoninic Acid (BCA) Protein Assay Kit
- 4× Laemmli Sample Buffer with 10% β-mercaptoethanol
Procedure:
- Cell Treatment: Treat neuronal cultures with apoptosis inducers (e.g., 1 μM staurosporine for 3-24 hours [49] [11]) or relevant neurotoxic insults. Include untreated controls and caspase inhibitor (e.g., zVAD-fmk) treated conditions as controls.
- Cell Lysis: Aspirate culture media and wash cells with ice-cold PBS. Add appropriate volume of lysis buffer (e.g., 100-200 μL for a 6-well plate) and incubate on ice for 30 minutes with occasional agitation.
- Sample Collection: Scrape cells and transfer lysates to microcentrifuge tubes. Centrifuge at 15,000 × g for 10 minutes at 4°C to pellet insoluble material.
- Protein Quantification: Transfer supernatant to new tubes and determine protein concentration using BCA assay. Adjust samples to equal concentrations with lysis buffer.
- Sample Preparation: Mix equal volumes of protein lysate with 4× Laemmli buffer, boil at 95-100°C for 5 minutes, and store at -20°C until use.
Critical Considerations for Neuronal Samples:
- Neuronal cultures are particularly sensitive to ischemic and excitotoxic insults, which may activate both caspase-dependent and -independent PARP-1 cleavage pathways [27] [4].
- For time-course studies, collect samples at multiple time points (e.g., 1, 3, 6, 12, 24 hours) after insult to capture the progression of PARP-1 cleavage.
- Include positive controls (e.g., staurosporine-treated cells) to validate the detection of cleavage fragments.
Western Blotting for PARP-1 Detection
Materials:
- SDS-PAGE Gels: 8-12% Tris-Glycine gels for optimal separation of full-length and cleaved PARP-1
- PVDF or Nitrocellulose Membranes
- Primary Antibodies: Selected based on Table 1 recommendations
- HRP-conjugated Secondary Antibodies
- Enhanced Chemiluminescence (ECL) Substrate
- Blocking Buffer: 5% non-fat dry milk or BSA in TBST
Procedure:
- Electrophoresis: Load 20-40 μg of protein lysate per lane alongside pre-stained protein molecular weight markers. Perform electrophoresis at constant voltage (100-120V) until adequate separation is achieved.
- Membrane Transfer: Transfer proteins to membrane using wet or semi-dry transfer systems according to manufacturer's recommendations.
- Blocking: Incubate membrane in blocking buffer for 1 hour at room temperature with gentle agitation.
- Primary Antibody Incubation: Dilute primary antibody in blocking buffer or antibody dilution buffer according to manufacturer's recommendations (typically 1:1000-1:10000). Incubate membrane with primary antibody overnight at 4°C with gentle agitation.
- Washing: Wash membrane 3-5 times for 5 minutes each with TBST.
- Secondary Antibody Incubation: Incubate with appropriate HRP-conjugated secondary antibody (1:2000-1:20000 dilution) for 1 hour at room temperature.
- Detection: Wash membrane as before, then incubate with ECL substrate according to manufacturer's instructions. Image using a digital imaging system with appropriate exposure times.
Troubleshooting Tips:
- For optimal resolution of full-length PARP-1 (113-116 kDa) and the 89-kDa fragment, use lower percentage gels (8-10%) and extend electrophoresis time.
- If non-specific bands are observed, try increasing the stringency of washes (e.g., higher salt concentration or addition of 0.1% SDS to wash buffer).
- For cleaved fragment-specific antibodies like ab4830, verify specificity by comparing induced versus uninduced samples and caspase inhibitor-treated conditions.
Additional Applications
Immunohistochemistry in Neuronal Tissues: For IHC applications in brain sections or neuronal cultures, the antibody ab32064 has been successfully used at dilutions of 1:100 with antigen retrieval using Tris-EDTA buffer (pH 9.0) [49]. Include appropriate controls such as no-primary antibody and pre-immune serum to assess background staining.
Subcellular Fractionation: To study the translocation of PARP-1 fragments during cell death processes, subcellular fractionation can be performed using commercial kits (e.g., Subcellular Protein Fractionation Kit, Thermo Scientific 78840) [50]. This is particularly relevant for detecting the movement of the 89-kDa fragment to the cytoplasm and the retention of the 24-kDa fragment in the nucleus [11].
Data Interpretation and Analysis
Expected Results and Band Patterns
Table 2: PARP-1 Fragments and Their Significance
| Fragment Size | Domain Composition | Cellular Localization | Biological Significance | Protease Responsible |
|---|---|---|---|---|
| 113-116 kDa | Full-length PARP-1 (DBD-AMD-CD) | Nucleus | DNA repair function, cell survival | N/A |
| 89 kDa | AMD + Catalytic Domain | Nucleus → Cytoplasm (after cleavage) | Apoptosis marker; PAR carrier in parthanatos | Caspase-3/7 |
| 24 kDa | DNA-Binding Domain | Nucleus (retained at DNA breaks) | Apoptosis marker; dominant-negative inhibitor of DNA repair | Caspase-3/7 |
| 25-27 kDa | Not fully characterized | Varies | Alternative cleavage products; potential non-apoptotic functions | Other proteases (e.g., granzymes) |
When analyzing Western blot results, the expected band patterns depend on the antibody used and the experimental conditions. For C-terminal directed antibodies, both full-length PARP-1 (113-116 kDa) and the 89-kDa cleavage fragment should be detectable. With cleavage-specific antibodies, only the appropriate fragment (85-89 kDa or 24-27 kDa, depending on the antibody) should be visible. The appearance of the 89-kDa fragment typically correlates with decreased full-length PARP-1 signal in apoptosis-induced samples.
In neuronal cells subjected to staurosporine treatment, PAR synthesis typically peaks around 4 hours, with PARP-1 cleavage fragments becoming detectable between 3-6 hours after treatment [11]. The timing may vary depending on the specific neuronal cell type and the nature of the apoptotic stimulus.
Quantification and Normalization
For quantitative analysis, normalize PARP-1 band intensities to appropriate loading controls such as GAPDH, α-tubulin, or histone H3. Calculate the ratio of cleaved to full-length PARP-1 to assess the extent of apoptosis. For more sophisticated analysis, the percentage of PARP-1 cleavage can be calculated using the formula:
PARP-1 Cleavage (%) = [Intensity of Cleaved Fragment / (Intensity of Full-length + Intensity of Cleaved Fragment)] × 100
Statistical analysis should include multiple independent replicates (typically n≥3), with appropriate tests for significance (e.g., Student's t-test for two groups, ANOVA for multiple groups).
Research Reagent Solutions
Table 3: Essential Research Reagents for PARP-1 Cleavage Studies
| Reagent Category | Specific Examples | Application/Function |
|---|---|---|
| PARP-1 Antibodies | Anti-Cleaved PARP1 (ab4830), Anti-Cleaved PARP1 [E51] (ab32064), PARP1 Polyclonal (13371-1-AP) | Detection of full-length and cleaved PARP-1 by WB, IHC, IF |
| Apoptosis Inducers | Staurosporine (1-3 μM, 3-24h), Etoposide (1 μM, 16h), Camptothecin | Positive controls for caspase activation and PARP-1 cleavage |
| Caspase Inhibitors | zVAD-fmk (pan-caspase inhibitor) | Negative control to confirm caspase-dependent cleavage |
| PARP Inhibitors | PJ34, ABT-888 (Veliparib), Olaparib | Tools to study PARP-1 function and inhibition in combination therapies |
| Cell Death Assays | ATPlite kit, Fluoro-Jade B staining, TUNEL assay | Complementary methods to validate and quantify cell death |
| Subcellular Fractionation Kits | Subcellular Protein Fractionation Kit (Thermo Scientific 78840) | Separation of nuclear and cytoplasmic fractions to study fragment localization |
Signaling Pathways and Experimental Workflows
Diagram 1: PARP-1 Cleavage Signaling Pathways and Detection Methods. This workflow illustrates the key events from DNA damage induction to PARP-1 activation, cleavage, and subsequent cell death pathways, along with appropriate detection methodologies.
Troubleshooting Common Issues
Weak or No Signal:
- Confirm antibody specificity and expiration date
- Optimize antibody dilution and incubation time
- Verify protein transfer efficiency using Ponceau S staining
- Ensure sufficient protein loading (20-40 μg for abundant proteins like PARP-1)
- Check ECL substrate activity with positive controls
Non-Specific Bands:
- Increase blocking time or try different blocking agents (BSA vs. non-fat milk)
- Optimize antibody dilution to reduce non-specific binding
- Increase wash stringency (more washes, longer duration, higher salt concentration)
- Verify antibody specificity using PARP1 knockout cell lysates if available [49]
Inconsistent Cleavage Detection:
- Standardize apoptosis induction conditions (concentration, duration)
- Include robust positive controls (staurosporine-treated cells) in every experiment
- Process control and experimental samples simultaneously
- Ensure consistent protein quantification across samples
The detection of PARP-1 cleavage fragments remains a cornerstone methodology in cell death research, particularly in neuronal studies where understanding the balance between different cell death pathways informs therapeutic development for neurological disorders. Successful detection requires appropriate antibody selection based on research objectives, optimized sample preparation protocols that account for neuronal specificities, and careful interpretation of results within the biological context. The protocols and guidelines provided in this application note offer a comprehensive framework for researchers investigating PARP-1 cleavage in neuronal models, contributing to more reliable and reproducible findings in this critical area of biomedical research.
Solving Common Pitfalls: Incomplete Cleavage, High Background, and Unexpected Bands
Within the context of a broader thesis on sample preparation for PARP-1 cleavage detection in neuronal cells research, accurately interpreting Western blot results is paramount. The detection of specific PARP-1 cleavage fragments serves as crucial biomarkers for identifying active cell death pathways in neurological models. However, researchers frequently encounter non-canonical banding patterns that complicate interpretation. This guide provides a systematic approach to troubleshooting these patterns, focusing on the interplay between sample preparation, protease activity, and post-translational modifications that characterize PARP-1 biology in neuronal systems.
PARP-1 Cleavage Fragments: Signature Patterns and Interpretations
Poly(ADP-ribose) polymerase-1 (PARP-1) is a nuclear enzyme with vital functions in DNA repair and cell death signaling. Its cleavage by specific proteases generates signature fragments that serve as recognized biomarkers for particular patterns of protease activity in unique cell death programs [42]. The table below summarizes the characterized PARP-1 fragments and their interpretations.
Table 1: Characterized PARP-1 Fragments and Their Interpretations
| Fragment Size | Protease Responsible | Domains Contained | Biological Significance | Common Contexts |
|---|---|---|---|---|
| 89 kDa & 24 kDa | Caspases-3 and -7 [42] [4] | 89 kDa: AMD + Catalytic Domain; 24 kDa: DBD with 2 zinc-finger motifs [42] | Hallmark of apoptosis; 24 kDa fragment acts as trans-dominant inhibitor of PARP-1 [42] | Cerebral ischemia, traumatic brain injury, excitotoxicity, neurodegenerative diseases [42] |
| 55 kDa & 40-45 kDa (multiple) | Calpains, Cathepsins, Granzymes, MMPs [42] | Varies by protease | Indicates alternative, non-apoptotic cell death pathways (e.g., necrosis, parthanatos) [42] | Context-dependent; requires further validation |
The 24 kDa DNA-binding domain (DBD) fragment deserves special attention. When generated, this fragment is retained in the nucleus where it irreversibly binds to nicked DNA, acting as a trans-dominant inhibitor of active PARP-1 and other DNA repair enzymes [42]. This mechanism conserves cellular ATP pools during apoptosis but effectively halts DNA repair processes.
Experimental Protocol for PARP-1 Cleavage Detection in Neuronal Cells
Cell Culture and Treatment
- Primary Cortical Neuron Isolation: Isolate cortical neurons from Sprague-Dawley rats at postnatal day 2 (P2). Culture in Neurobasal Medium-A supplemented with B27 at a density of 3.75 × 10^5 cells/mL [4].
- Transduction: For expression of specific PARP-1 constructs (WT, UNCL, 124, 189), transduce neurons 3 days after isolation using Adeno-Associated Virus (AAV) vectors [4].
- Oxygen/Glucose Deprivation (OGD): To simulate ischemic conditions, subject cells to OGD for 6 hours followed by restoration of oxygen and glucose (ROG) for 15 hours [4].
Protein Extraction and Western Blotting
- Whole Cell Protein Extraction: Lyse cells in RIPA buffer supplemented with protease and phosphatase inhibitors.
- Electrophoresis: Separate protein extracts (20-30 μg per lane) on 8-10% SDS-PAGE gels [4].
- Transfer and Blocking: Transfer to nitrocellulose membrane using standard Transblot apparatus. Block with 5% non-fat milk in TBST [4].
- Antibody Incubation:
- Primary Antibodies: Anti-PARP-1 (C-2-10) for full-length PARP-1; anti-poly(ADP-ribose) (10H) for PARylation detection [4].
- Secondary Antibodies: Peroxidase-conjugated appropriate secondary antibodies. dispatched- Detection: Use chemiluminescence luminol reagent and visualize by exposure to X-ray film or digital imaging system [4].
Figure 1: Experimental workflow for PARP-1 cleavage detection in neuronal cells, highlighting key decision points for band interpretation.
The Scientist's Toolkit: Research Reagent Solutions
Table 2: Essential Research Reagents for PARP-1 Cleavage Studies
| Reagent | Specific Example | Function/Application | Key Considerations |
|---|---|---|---|
| PARP-1 Antibodies | Anti-PARP (46D11) [51] | Detects full-length and major fragments of PARP-1 in WB, IF | Working dilution: 1:1000 for WB, 1:100 for IF |
| Phospho-Specific Antibodies | Anti-phospho-PARP1(T594) [51] | Detects phosphorylation at T594; affects subcellular localization | Custom-raised; working dilution: 1:500-1:1000 for WB |
| PAR Antibodies | 10H anti-poly(ADP-ribose) [4] | Detects PAR polymers; indicates PARP-1 activation | Use in indirect immunofluorescence |
| PARP Inhibitors | Olaparib [52] | Inhibits PARP catalytic activity; research tool | Used in combination studies (e.g., with ATR inhibitors) |
| PARG Inhibitors | PDD00017273 (PARGi) [53] | Inhibits PAR degradation; increases PAR levels | IC50 in 293A cells: 96±24 µM |
| Caspase Inhibitors | Z-VAD-FMK | Broad-spectrum caspase inhibitor; confirms caspase-dependent cleavage | Use to validate caspase-specific fragments |
| Cell Death Inducers | H2O2 [4], MMS [53] | Induce oxidative stress and DNA damage | Concentration-dependent effects (e.g., 50-200 μM H2O2) |
Troubleshooting Non-Canonical Banding Patterns
Unexpected Fragment Sizes
When fragments other than the canonical 89 kDa and 24 kDa bands appear, consider these potential causes and solutions:
- Multiple Protease Activities: PARP-1 is a substrate for several 'suicidal' proteases beyond caspases, including calpains, cathepsins, granzymes, and matrix metalloproteinases (MMPs) [42]. These proteases generate specific proteolytic cleavage fragments with different molecular weights ranging from 55 kDa to 40-45 kDa.
- Experimental Approach: Utilize specific protease inhibitors to distinguish between caspase-dependent and caspase-independent cleavage patterns. Combine Western blotting with activity assays for different proteases.
- Neuronal Specificity: Primary neuronal cultures may exhibit different cleavage patterns compared to cell lines due to their post-mitotic status and unique metabolic characteristics.
Smearing or Multiple Bands
- PARylation Artifacts: Extensive PARylation can cause smearing or higher molecular weight bands due to the addition of large, negatively charged PAR chains [54].
- Experimental Approach:
- Include PARG in extraction buffers to remove PAR chains [53].
- Use anti-PAR antibodies to distinguish PARylated species.
- Check protein extraction protocol - include PAR degradation steps if necessary.
Absence of Expected Cleavage Fragments
- Alternative Cell Death Pathways: In some neuronal death paradigms, particularly those involving PARP-1 overactivation, cells may undergo parthanatos rather than apoptosis, potentially bypassing canonical caspase-3 mediated PARP-1 cleavage [42].
- Experimental Approach:
- Use positive controls (e.g., cells treated with known apoptosis inducers).
- Check caspase activity directly with fluorogenic substrates.
- Analyze additional cell death markers beyond PARP-1 cleavage.
Figure 2: PARP-1 cleavage pathways showing protease-specific fragmentation patterns and their associated cell death mechanisms.
Advanced Considerations for Neuronal Research
PARP-1 Fragments with Biological Activity
Research indicates that PARP-1 cleavage fragments are not merely inert byproducts but can possess distinct biological activities:
- The 24 kDa DBD fragment (PARP-124) confers protection from oxygen/glucose deprivation damage in neuronal models, while the 89 kDa catalytic fragment (PARP-189) exhibits cytotoxicity [4].
- Expression of PARP-124 decreases iNOS and COX-2 protein levels while increasing Bcl-xL, suggesting a role in modulating inflammatory responses in neuronal cells [4].
Phosphorylation and Subcellular Localization
- PARP-1 phosphorylation at specific sites (e.g., T594) controls its subcellular localization [51].
- Phosphorylation can be monitored using phospho-specific antibodies in combination with subcellular fractionation protocols.
- Altered localization may affect cleavage patterns and should be considered when interpreting banding patterns.
PARP-1 in DNA-Protein Crosslink Repair
Recent research has identified a novel role for PARP-1 in DNA-protein crosslink (DPC) repair, particularly in resolving topoisomerase 1-DNA cleavage complexes (TOP1ccs) [55]. This pathway involves direct PARylation of DPCs, targeting them for ubiquitylation and subsequent proteasomal degradation. Disruption of this pathway in neuronal cells might yield atypical PARP-1 modifications.
Protocol for Validating PARP-1 Cleavage in Neuronal Cells
Cytoplasmic and Nuclear Fractionation
To monitor PARP-1 subcellular localization and fragment distribution [51]:
- Harvest cells and wash with ice-cold PBS.
- Resuspend cell pellet in hypotonic buffer (10 mM HEPES, 1.5 mM MgCl2, 10 mM KCl, protease inhibitors) and incubate on ice for 15 minutes.
- Add NP-40 to 0.5% final concentration, vortex vigorously, and centrifuge at 3000 × g for 10 minutes.
- Collect supernatant as cytoplasmic fraction.
- Wash nuclear pellet and extract nuclei with high-salt buffer (20 mM HEPES, 1.5 mM MgCl2, 420 mM NaCl, 0.2 mM EDTA, 25% glycerol).
- Analyze both fractions by Western blotting using PARP-1 antibodies.
Immunofluorescence Confirmation
- Culture neurons on glass coverslips and treat as required.
- Fix with 4% paraformaldehyde and permeabilize with 0.2% Triton X-100 [4].
- Incubate with primary antibodies (e.g., anti-PARP-1 and cell death markers).
- Use appropriate fluorescent secondary antibodies (e.g., FITC or Texas Red-conjugated).
- Image using confocal laser scanning microscopy with sequential acquisition to avoid bleed-through [4].
This comprehensive troubleshooting guide provides a foundation for accurate interpretation of PARP-1 cleavage patterns in neuronal cells, emphasizing the importance of understanding both canonical and non-canonical fragmentation in the context of neuronal cell death pathways. Proper sample preparation and methodological rigor are essential for generating reproducible and biologically relevant data in PARP-1 research.
Optimizing Electrophoresis and Transfer Conditions for Clear 89 kDa Fragment Resolution
The detection of Poly(ADP-ribose) polymerase-1 (PARP-1) cleavage serves as a critical biomarker for monitoring apoptotic pathways in cellular research, particularly in neuronal cell studies. The appearance of the 89 kDa fragment, resulting from caspase-mediated cleavage at the DEVD214 site, is a well-established hallmark of apoptosis [56] [4]. However, resolving this fragment from the full-length PARP-1 (113-116 kDa) and other non-specific bands presents significant technical challenges that require optimized electrophoretic and transfer conditions. This protocol details a standardized methodology for the clear resolution and accurate identification of the 89 kDa PARP-1 cleavage fragment, framed within the context of sample preparation for neuronal cell research.
Background and Significance
PARP-1 is a nuclear enzyme involved in DNA repair and cell death signaling. During apoptosis, caspases-3 and -7 cleave PARP-1 into two definitive fragments: a 24 kDa DNA-binding fragment and an 89 kDa catalytic domain fragment [4]. The detection of the 89 kDa fragment has become a gold standard for confirming apoptotic induction in experimental models. It is crucial to note that PARP-1 can also be processed during necrosis, producing different cleavage patterns, most notably a 50 kDa fragment generated by lysosomal proteases such as cathepsins B and G [56]. This distinction underscores the importance of specific and clear detection methods.
In neuronal research, particularly in studies modeling cerebral ischemia using oxygen/glucose deprivation (OGD) and restoration models, PARP-1 cleavage fragments play significant but distinct roles. Research indicates that while the 89 kDa fragment is associated with cytotoxicity, the 24 kDa fragment may surprisingly confer protective effects [4]. These findings highlight the critical importance of precise fragment resolution not merely for detection but for understanding fundamental biological processes in neuronal cell death and survival mechanisms.
Key Reagents and Materials
Table 1: Essential Research Reagents for PARP-1 Cleavage Detection
| Reagent/Material | Specification/Function | Example Products |
|---|---|---|
| PARP1 Antibody | Detects full-length (113 kDa) and cleaved (89 kDa) PARP1; multiple applications | Proteintech 13371-1-AP [57], Invitrogen MA5-15031 [58] |
| Neuronal Cell Lines | Models for neuronal research; SH-SY5Y human neuroblastoma line widely used | SH-SY5Y (ATCC CRL-2266) [4] [59] |
| Primary Cortical Neurons | Biologically relevant ex vivo model for ischemia studies | Isolated from Sprague-Dawley rats (P2) [4] |
| Electrophoresis System | Mini-PROTEAN Tetra Vertical System or equivalent | Bio-Rad, Thermo Fisher Scientific |
| Transfer Apparatus | Wet/tank transfer system preferred for high efficiency | Bio-Rad, Thermo Fisher Scientific |
| Membrane | PVDF, 0.45 µm pore size for optimal protein retention | Millipore, Bio-Rad |
Optimized Electrophoresis Conditions
Gel Preparation and Composition
For optimal resolution of the 89 kDa fragment from the full-length PARP-1, a discontinuous SDS-PAGE system is recommended. The following parameters have been validated for clear separation in the 80-120 kDa molecular weight range:
- Gel Dimension: 8 cm × 10 cm (mini-gel format)
- Gel Thickness: 1.0 mm
- Separating Gel Concentration: 10% acrylamide-bisacrylamide (29:1)
- Separating Gel Buffer: 375 mM Tris-HCl, pH 8.8, 0.1% SDS
- Stacking Gel Concentration: 4% acrylamide-bisacrylamide (29:1)
- Stacking Gel Buffer: 125 mM Tris-HCl, pH 6.8, 0.1% SDS
- Well Capacity: 25-30 µL to accommodate sufficient protein load
Electrophoresis Running Parameters
- Running Buffer: 25 mM Tris, 192 mM glycine, 0.1% SDS, pH ~8.3
- Voltage Conditions: 80-100 V constant voltage through stacking gel, then 120-140 V through separating gel
- Running Time: Approximately 90 minutes, or until dye front reaches bottom of gel
- Temperature Control: Maintained at 4°C throughout run to prevent heat-induced artifacts
- Molecular Weight Marker: Pre-stained protein ladder spanning 50-150 kDa for accurate monitoring
Table 2: Optimized Electrophoresis Conditions for 89 kDa Fragment Resolution
| Parameter | Standard Condition | Optimized Condition | Rationale |
|---|---|---|---|
| Gel Percentage | 8-12% gradient | 10% uniform | Optimal balance between resolution and transfer efficiency |
| Acrylamide:Bis Ratio | 29:1 | 29:1 | Standard cross-linking for appropriate pore size |
| Running Voltage | 120-150 V constant | 80 V (stacking), 130 V (separating) | Prevents band smiling and improves sharpness |
| Running Time | 60-75 min | ~90 min | Ensures adequate separation between 113 kDa and 89 kDa bands |
| Temperature | Room temperature | 4°C | Minimizes protein degradation and gel distortion |
Optimized Transfer Conditions
Transfer Assembly and Buffer Composition
A wet transfer system is strongly recommended over semi-dry methods for superior efficiency in transferring the 89 kDa PARP-1 fragment. The following setup has been validated for consistent results:
- Transfer Apparatus: Standard tank transfer system with platinum wire electrodes
- Transfer Time: 90 minutes at constant voltage
- Voltage/Current: 100 V constant voltage (approximately 350-400 mA)
- Membrane: PVDF (0.45 µm), pre-activated in 100% methanol for 1 minute
- Transfer Buffer: 25 mM Tris, 192 mM glycine, pH 8.3
- Methanol Concentration: 20% (v/v) in transfer buffer
- Cooling: Integrated cooling unit or ice pack to maintain 4°C throughout transfer
Transfer Buffer Variations and Considerations
For difficult-to-transfer systems or when examining multiple PARP-1 fragments, consider these adjustments:
- Low Methanol Variation: 10% methanol for improved transfer of higher molecular weight proteins while maintaining 89 kDa fragment efficiency
- Additive Enhancement: 0.1% SDS in transfer buffer to improve elution efficiency, particularly for proteins >100 kDa
- Alternative Buffer Systems: CAPS buffer (10 mM CAPS, pH 11, 10% methanol) for specialized applications requiring high pH
Table 3: Optimized Western Blot Transfer Conditions for PARP-1 Fragments
| Parameter | Standard Condition | Optimized Condition | Effect on 89 kDa Fragment |
|---|---|---|---|
| Transfer Method | Semi-dry or wet | Wet/tank transfer | More consistent transfer, especially for middle MW proteins |
| Transfer Time | 60 min | 90 min | Ensures complete transfer without over-transfer of smaller fragments |
| Voltage | 100 V | 100 V | Standard for tank transfer systems |
| Methanol % | 20% | 20% | Optimal for PVDF membrane binding and protein retention |
| Buffer Additives | None | 0.01-0.1% SDS (optional) | Can improve elution of full-length PARP-1 without losing 89 kDa fragment |
| Temperature | Room temperature | 4°C | Prevents overheating and buffer depletion |
Sample Preparation Protocol for Neuronal Cells
Cell Culture and Treatment
- Culture Conditions: Maintain SH-SY5Y cells in Dulbecco's Modified Eagle Medium (DMEM) supplemented with 10% heat-inactivated fetal bovine serum, 100 U/ml penicillin, and 100 mg/ml streptomycin at 37°C in 5% CO₂ [4].
- Experimental Treatments: For apoptosis induction in neuronal models, apply:
- Oxygen/Glucose Deprivation (OGD): Replace culture medium with deoxygenated, glucose-free balanced salt solution and place cells in a hypoxic chamber (1% O₂, 5% CO₂, 94% N₂) for 2-8 hours [4].
- Chemical Inducers: Staurosporine (0.5-1 µM, 4-6 hours) or etoposide (50-100 µM, 8-12 hours) as positive controls for apoptosis.
- Inclusion of Controls: Always include:
- Untreated control cells
- Caspase inhibitor control (Z-VAD-FMK, 20-50 µM) to confirm caspase-dependent cleavage
- Known apoptotic inducer as positive control
Protein Extraction and Quantification
- Lysis Buffer Composition:
- 1× Cell Lysis Buffer (e.g., Promega) or RIPA buffer
- Protease inhibitor cocktail (e.g., Complete Mini, EDTA-free, Roche)
- 1 mM PMSF
- Optional: 10 µM PARP inhibitor (to prevent artifactual PARylation during extraction)
- Extraction Protocol:
- Place culture dishes on ice and quickly aspirate medium
- Wash cells twice with ice-cold PBS
- Add appropriate volume of lysis buffer (100-200 µL per 10⁶ cells)
- Incubate on ice for 15-20 minutes with occasional gentle agitation
- Scrape cells and transfer lysate to microcentrifuge tube
- Centrifuge at 14,000 × g for 15 minutes at 4°C
- Transfer supernatant to fresh tube
- Protein Quantification:
- Use Bradford or BCA assay according to manufacturer's protocols
- Adjust samples to equal concentration with lysis buffer
- Add 4× Laemmli sample buffer (with 5% β-mercaptoethanol)
- Denature at 95°C for 5-10 minutes
- Store at -80°C if not used immediately
Sample Loading Recommendations
- Total Protein Load: 25-50 µg per lane for neuronal cell lysates
- Positive Control: Include a lane with lysate from cells treated with known apoptotic inducer
- Molecular Weight Marker: 5 µL of pre-stained ladder
- Blank Lane: Load sample buffer only in one lane to assess background
Detection and Validation Methods
Immunoblotting Protocol
- Blocking: Incubate membrane in 5% non-fat dry milk in TBST (Tris-buffered saline with 0.1% Tween-20) for 1 hour at room temperature with gentle agitation.
- Primary Antibody Incubation:
- Antibody: PARP1 Polyclonal Antibody (Proteintech 13371-1-AP) [57]
- Dilution: 1:2000 in 5% BSA or milk in TBST
- Conditions: Overnight at 4°C with gentle agitation
- Volume: Sufficient to fully cover membrane (0.1 mL/cm²)
- Washing: 3 × 10 minutes with TBST at room temperature
- Secondary Antibody Incubation:
- Antibody: HRP-conjugated anti-rabbit IgG
- Dilution: 1:5000-1:10000 in 5% milk in TBST
- Conditions: 1 hour at room temperature with gentle agitation
- Detection:
- ECL or superior chemiluminescent substrate
- Exposure times: 30 seconds to 10 minutes (multiple exposures recommended)
- Digital imaging system for signal capture
Validation of Specificity
- Band Pattern Verification: Confirm the presence of both full-length PARP-1 (113-116 kDa) and the 89 kDa cleavage fragment [57].
- Caspase Dependence: Pre-treatment with caspase inhibitor Z-VAD-FMK (20-50 µM) should prevent appearance of the 89 kDa fragment [56].
- Lysate Control: Include lysate from PARP-1 knockout cells or use siRNA knockdown to confirm antibody specificity if available.
- Alternative Antibody Validation: Compare results with another PARP-1 antibody targeting different epitopes when possible.
Troubleshooting Common Issues
Table 4: Troubleshooting Guide for PARP-1 Cleavage Detection
| Problem | Potential Causes | Solutions |
|---|---|---|
| Weak or no signal | Insufficient protein transfer, low antibody concentration, expired detection reagents | Increase transfer time, optimize antibody dilution, use fresh ECL reagents |
| High background | Incomplete blocking, insufficient washing, antibody concentration too high | Extend blocking time, increase wash stringency, dilute primary antibody |
| Poor resolution between full-length and 89 kDa | Gel percentage inappropriate, running time too short, voltage too high | Use 10% gel, extend running time, reduce voltage, run at 4°C |
| Multiple non-specific bands | Antibody cross-reactivity, protein degradation, insufficient blocking | Include knockout control, use fresh protease inhibitors, try different blocking agent |
| 89 kDa fragment not detected | Insufficient apoptosis induction, fragment degraded, transfer issues | Include positive control, check sample quality, verify transfer efficiency with Ponceau S |
Experimental Workflow and Signaling Pathways
The following diagram illustrates the complete experimental workflow for detecting PARP-1 cleavage in neuronal cells, from culture to detection:
The molecular signaling pathway of PARP-1 cleavage in neuronal apoptosis can be visualized as follows:
The optimized electrophoresis and transfer conditions detailed in this protocol provide a robust methodology for the clear resolution of the 89 kDa PARP-1 cleavage fragment, a critical apoptotic biomarker in neuronal cell research. The precise 10% gel composition combined with extended transfer times in a wet tank system addresses the specific challenges in separating the 89 kDa fragment from the full-length PARP-1 protein. When integrated with appropriate sample preparation techniques from neuronal cultures and validated detection methods, this approach ensures reliable and reproducible assessment of apoptotic pathways. These technical optimizations contribute significantly to the broader objective of accurate PARP-1 cleavage detection in neuroscience research, particularly in studies investigating cell death mechanisms in cerebral ischemia, neurodegenerative diseases, and neurotoxicological assessments.
Addressing High Background Noise and Non-Specific Antibody Binding
The accurate detection of PARP-1 cleavage in neuronal cells is fundamentally compromised by high background noise and non-specific antibody binding. These issues are particularly problematic in neuroscience research, where the accurate quantification of PARP-1 cleavage serves as a critical marker of apoptosis in response to neurodegenerative stimuli and neurotoxic compounds. Within the context of a broader thesis on sample preparation for neuronal cell research, this protocol addresses the persistent challenge of distinguishing specific PARP-1 signals from non-specific background, which can lead to false positives and erroneous conclusions in drug development screening. The energy landscape theory of antibody binding explains these phenomena not as simple errors, but as probabilistic events where antibodies transiently engage with off-target epitopes through shallow energy wells, resulting in the high background observed experimentally [60]. This guide provides validated methodologies to deepen these energy wells, enhancing specificity for reliable detection of PARP-1 cleavage events in neuronal models.
Theoretical Foundation: Molecular Basis of Non-Specific Binding
Energy Landscape Theory of Antibody-Antigen Interactions
The energy landscape theory provides a robust physical framework for understanding both specific and non-specific antibody binding events. Under this model, high-affinity, specific interactions correspond to deep, sharply defined energy wells on the molecular energy landscape, characterized by substantial negative Gibbs free energy change (ΔG typically -7 to -14 kcal/mol) [60]. These specific binding events result from precise geometric complementarity at the antibody-antigen interface, enabling extensive non-covalent interactions including hydrogen bonding, van der Waals forces, hydrophobic packing, and electrostatic interactions [60].
In contrast, non-specific binding corresponds to broad, shallow energy basins where antibodies engage transiently with multiple, structurally diverse antigens. These interactions are characterized by fewer stabilizing bonds, rapid dissociation rates (k_off typically 10⁻¹ to 10¹ s⁻¹), and short residence times (milliseconds to seconds) [60]. In neuronal PARP-1 research, this manifests as background staining when antibodies form low-affinity, transient interactions with non-target proteins in the complex cellular environment.
PARP-1 Signaling and Detection Challenges in Neuronal Cells
PARP-1 functions as a critical DNA damage sensor that becomes cleaved during apoptosis, generating signature fragments that serve as biomarkers for neuronal cell death. The detection system must distinguish these specific fragments from non-specific signals in an environment rich in potential interferents. Recent research has established that PARP-1 undergoes complex post-translational modifications including serine ADP-ribosylation, which may further complicate detection through antibody cross-reactivity [37]. The neuronal context adds additional complexity due to the presence of abundant structural proteins, receptors, and signaling molecules that can serve as inadvertent targets for non-specific binding.
Comprehensive Reagent Solutions for PARP-1 Detection
Table 1: Essential Research Reagents for Optimizing PARP-1 Cleavage Detection
| Reagent Category | Specific Examples | Function & Rationale | Optimization Tips |
|---|---|---|---|
| Blocking Agents | 5-10% normal serum (species-matched to secondary antibody), 0.1-0.5% BSA, commercial protein-free blockers [61] | Reduces non-specific antibody binding by occupying hydrophobic sites on membranes and non-target epitopes | Match serum species to secondary antibody host; avoid serum from primary antibody species [61] |
| Antibody Selection | Monoclonal antibodies for PARP-1 cleavage sites, pre-adsorbed secondary antibodies | Minimizes polyreactive binding; pre-adsorbed secondaries reduce cross-species reactivity | For transient transfection, use stable cell lines with near-physiological expression to avoid overexpression artifacts [39] |
| Washing Solutions | TBST (Tris-Buffered Saline with Tween-20), PBST (PBS with Tween-20) | Removes unbound antibodies through detergent action; reduces background from hydrophobic interactions | Increase washing volume, frequency, and duration; optimize detergent concentration (0.05-0.1% Tween-20) [62] |
| Detection Substrates | Chemiluminescent substrates with optimized concentrations | Provides signal amplification while minimizing precipitate formation that increases background | Dilute substrate according to manufacturer recommendations; reduce incubation time for high-sensitivity systems [62] |
| Cell Culture Systems | Stable neuronal cell lines expressing PARP-1-EGFP at near-physiological levels from BAC transgenes [39] | Maintains endogenous regulation of protein expression; prevents mislocalization and aggregation artifacts | Use HeLa Kyoto, PC3, DLD1, or Cal51 cells validated for PARP studies; avoid transient transfection when possible [39] |
Experimental Protocols for Background Reduction
Optimized Blocking Protocol for Neuronal Cell Assays
Blocking represents the most critical step for reducing non-specific background in PARP-1 detection. The following protocol has been optimized for neuronal cell extracts and sections:
- Following fixation and permeabilization, incubate samples with blocking solution for 1-2 hours at room temperature or overnight at 4°C [61].
- Prepare blocking solution using 5-10% normal serum from the same species as the host of the secondary antibody in an appropriate buffer (e.g., PBS or TBS) [61].
- For particularly challenging backgrounds, combine serum blocking with 0.1-0.5% bovine serum albumin (BSA) or use commercial blocking mixes specifically formulated for immunohistochemistry [61].
- Critical note: Never use normal serum from the same species as the primary antibody, as this will dramatically increase background by creating bridges for secondary antibody binding [61].
- Include 0.05% Tween-20 in blocking buffer for additional stringency when detecting PARP-1 cleavage fragments in apoptotic neuronal cells.
Antibody Titration and Validation Protocol
Antibody concentration directly influences background signal. This protocol establishes optimal working concentrations for PARP-1 antibodies:
- Prepare a dilution series of primary antibody spanning the manufacturer's recommended concentration (typically 1:100 to 1:10,000).
- Incubate sections or membranes with each dilution overnight at 4°C under identical conditions.
- Process all samples identically with matched secondary antibodies, detection reagents, and exposure times.
- Identify the optimal dilution as the concentration that provides strong specific signal at the expected molecular weight (89 kDa and 24 kDa fragments for PARP-1) with minimal background.
- Include controls without primary antibody to identify secondary antibody-mediated background, and use PARP-1 knockout neuronal cells or siRNA knockdown controls when available to verify specificity.
Enhanced Washing Protocol for Low Background
Inadequate washing represents the most common technical error leading to high background:
- Between each incubation step, wash samples 3-5 times with generous volumes (enough to completely submerge and agitate the membrane or slides) of appropriate buffer with detergent (e.g., TBST or PBST with 0.05-0.1% Tween-20) [62].
- Employ progressive stringency: Begin with shorter washes (5 minutes) and increase to longer incubations (10-15 minutes) for later washes.
- Incorporate a high-stringency wash before detection: Use buffer with slightly elevated salt concentration (e.g., 300-500 mM NaCl) to disrupt weak electrostatic interactions contributing to background.
- For membrane-based assays, ensure complete submersion and gentle agitation throughout all washing steps.
Data Presentation and Quantitative Analysis
Quantitative Measures of Signal-to-Noise Optimization
Table 2: Quantitative Parameters for Assessing Background Reduction in PARP-1 Detection
| Parameter | High Background System | Optimized System | Measurement Method |
|---|---|---|---|
| Signal-to-Noise Ratio | < 3:1 | > 10:1 | Quantify band intensity vs. adjacent background using imaging software |
| Non-specific Band Intensity | > 50% of target signal | < 10% of target signal | Densitometry of non-target bands in negative controls |
| Background in Negative Controls | Clearly visible patterns | Minimal to no detectable signal | Visual assessment and quantification of no-primary-antibody controls |
| Inter-assay Variability | > 25% coefficient of variation | < 15% coefficient of variation | Compare signal intensity across multiple replicates and experiments |
| Target Band Clarity | Diffuse, smeared bands | Sharp, distinct bands at expected molecular weights | Visual assessment of band morphology |
Troubleshooting High Background in PARP-1 Detection
Table 3: Systematic Troubleshooting Guide for High Background Issues
| Problem Manifestation | Potential Causes | Recommended Solutions | Validation Approach |
|---|---|---|---|
| High background across entire membrane/section | Insufficient blocking; inadequate washing; secondary antibody concentration too high | Extend blocking time to 2 hours or overnight; increase wash number, duration, and volume; titrate secondary antibody [62] [61] | Compare with no-primary-antibody control; if background remains, address secondary antibody |
| Specific non-target bands present | Antibody cross-reactivity with non-target proteins; overexpression artifacts | Use monoclonal instead of polyclonal antibodies; employ stable cell lines with physiological expression levels [39] [61] | Validate with knockout controls; pre-absorb antibody with specific peptides |
| Spotty or particulate background | Precipitated detection substrates; dirty plates or slides; antibody aggregation | Freshly prepare and filter substrates; ensure clean surfaces; centrifuge antibodies before use [62] | Examine solution for visible particles; test fresh substrate batches |
| High background only in specific cellular compartments | Non-specific binding to abundant regional proteins; insufficient permeabilization | Increase detergent concentration in blocking and washing buffers; optimize permeabilization method | Compare distribution pattern with known cellular markers |
| Background increases after developing | Enzyme reaction overdeveloped; substrate concentration too high | Reduce substrate incubation time; dilute substrate concentration; optimize exposure time [62] | Develop for multiple timepoints; use quantitative imaging system |
Visualization of PARP-1 Signaling and Detection Workflow
Figure 1: PARP-1 Detection Workflow and Troubleshooting Pathway
Advanced Methodological Considerations
Live-Cell Imaging for PARP-1 Dynamics in Neuronal Models
For real-time monitoring of PARP-1 dynamics in neuronal cells, implement live-cell imaging protocols with these specific modifications:
- Generate stable neuronal cell lines expressing PARP-1-EGFP from bacterial artificial chromosome (BAC) transgenes to ensure near-physiological expression levels and avoid mislocalization artifacts [39].
- Perform high-speed imaging at sub-second temporal resolution using spinning-disk confocal systems to capture rapid PARP-1 recruitment and cleavage events following DNA damage induction.
- Implement gentle UV laser micro-irradiation in defined nuclear regions without pre-treatment with DNA damage-sensitizing compounds to study endogenous PARP-1 responses [39].
- Apply mathematical modeling to kinetic data to distinguish specific binding events from non-specific background interactions based on residence times and dissociation rates.
Addressing PARP-1 Post-Translational Modification Complexity
The recently discovered serine ADP-ribosylation of PARP-1 presents additional challenges for specific detection [37]. Implement these strategies to address this complexity:
- Utilize phosphorylation-specific blocking buffers when detecting PARP-1 cleavage, as serine modifications may share structural similarities with phosphorylation sites.
- Employ enzymatic pre-treatment with specific hydrolases (ARH3 for Ser-ADPr) to distinguish between different PARP-1 modifications when background suggests cross-reactivity [37].
- Validate antibody specificity using mass spectrometry-confirmed samples when possible, particularly for commercial PARP-1 cleavage detection antibodies.
Addressing high background noise and non-specific antibody binding requires a systematic approach grounded in the molecular principles of antibody-antigen interactions. The protocols outlined herein provide a comprehensive framework for optimizing PARP-1 cleavage detection in neuronal cells, emphasizing the critical importance of appropriate blocking strategies, antibody validation, and stringent washing techniques. By implementing these methods, researchers can significantly improve signal-to-noise ratios, enhancing the reliability of PARP-1 cleavage as a biomarker of neuronal apoptosis in basic research and drug development applications. The quantitative assessment parameters provided enable objective evaluation of optimization success, ensuring reproducible and specific detection of this critical signaling event in neuronal cell death pathways.
In the field of neuroscience, the detection of Poly (ADP-ribose) polymerase-1 (PARP-1) cleavage serves as a critical biomarker for apoptosis in neuronal cells. PARP-1 is a nuclear enzyme that plays a dual role in cellular homeostasis; it facilitates DNA repair under mild stress but contributes to apoptotic signaling when extensively activated [63] [64]. During apoptosis, caspase-3 cleaves PARP-1 at the Asp214 residue, generating specific 89 kDa and 24 kDa fragments, which inactivates its DNA repair function and facilitates programmed cell death [65]. This cleavage event is particularly relevant in neurodegenerative diseases such as Parkinson's disease, where PARP-1 hyperactivity has been linked to neuronal death and disease progression [64].
The inclusion of appropriate controls, specifically apoptotic inducers and PARP inhibitors, is fundamental to experimental designs aiming to accurately detect and quantify PARP-1 cleavage. These controls enable researchers to distinguish specific cleavage events from non-specific protein degradation, verify antibody specificity, and provide a benchmark for evaluating the efficacy of experimental interventions in neuronal models. This application note provides detailed methodologies and control strategies for sample preparation in neuronal research, with a focus on detecting PARP-1 cleavage.
Experimental Design and Control Strategies
Rationale for Control Selection
A robust experimental design for PARP-1 cleavage detection must incorporate both positive and negative controls to ensure data validity and interpretability. Positive controls, which induce a predictable apoptotic response, validate the functionality of your detection system. Conversely, negative controls, including PARP inhibitors, help establish baseline activity and confirm the specificity of observed effects. The strategic use of these controls is paramount for attributing observed PARP-1 cleavage specifically to the experimental conditions rather than to artifacts or non-specific effects.
For research on neuronal cells, selecting controls with demonstrated efficacy in relevant models is crucial. The PARP inhibitor ABT-888 (Veliparib) has been noted for its high affinity for PARP-1 and, importantly, its potential for low-toxicity applications in neurological contexts, making it a suitable candidate for such controls [64]. Furthermore, well-characterized apoptotic inducers like staurosporine provide a reliable means to generate a positive signal for PARP-1 cleavage.
Key Controls for PARP-1 Cleavage Experiments
The table below summarizes the essential controls for experiments designed to detect PARP-1 cleavage in neuronal cells.
Table 1: Essential Experimental Controls for PARP-1 Cleavage Detection
| Control Type | Specific Agent | Recommended Concentration | Experimental Purpose | Expected Outcome |
|---|---|---|---|---|
| Positive Control (Apoptosis Inducer) | Staurosporine | 0.1 - 1 µM for 2-6 hours | Induces caspase-dependent apoptosis and PARP-1 cleavage [66]. | Clear detection of ~89 kDa cleaved PARP-1 fragment. |
| Inhibitor Control (PARP Inhibitor) | ABT-888 (Veliparib) | 15 - 60 µM [67]. Pre-treatment 1-2 hours prior to inducer. | Inhibits PARP activity, modulates cell death pathways, and provides context for cleavage intensity [64] [67]. | Reduced PAR levels; can alter apoptotic progression. |
| Vehicle Control | DMSO (for Staurosporine/ABT-888 solvent) | Match the highest volume used in treatments (e.g., 0.1%) [66]. | Accounts for any non-specific effects of the solvent. | No significant PARP-1 cleavage. |
| Untreated Control | Culture medium only | N/A | Provides a baseline for cellular health and PARP-1 integrity. | Full-length PARP-1 (116 kDa); no cleavage fragments. |
| Antibody Specificity Control | Cells treated with caspase inhibitor (e.g., Z-VAD-FMK) | 20-50 µM, pre-treatment 1 hour before apoptosis inducer. | Confirms that PARP-1 fragment detection is caspase-dependent. | Absence of the 89 kDa cleaved PARP-1 fragment. |
Detailed Methodologies
Protocol for Treatment of Neuronal Cells
This protocol outlines the steps for preparing neuronal cell samples with the appropriate controls for PARP-1 cleavage detection.
Materials Needed:
- Cultured neuronal cells (e.g., primary neurons or neuronal cell lines like SH-SY5Y).
- Apoptosis inducer: Staurosporine (e.g., 1 mM stock in DMSO).
- PARP inhibitor: ABT-888 (Veliparib, e.g., 60 mM stock in DMSO) [67].
- Vehicle: Dimethyl sulfoxide (DMSO), sterile.
- Appropriate neuronal cell culture medium.
- Caspase inhibitor: Z-VAD-FMK (optional, for specificity control).
Procedure:
- Cell Seeding: Seed neuronal cells at an appropriate density (e.g., 1-2 x 10^6 cells per well in a 6-well plate) in complete medium and allow them to adhere and stabilize for 24-48 hours.
- Preparation of Working Solutions: Dilute staurosporine, ABT-888, and other control agents in pre-warmed culture medium to achieve the desired final concentrations. Ensure vehicle control solutions contain an equivalent volume of DMSO.
- Pre-treatment (for Inhibitor Controls): Aspirate the medium from the relevant wells and add medium containing ABT-888 (e.g., 60 µM) [67]. Incubate for 1-2 hours.
- Apoptosis Induction: Aspirate the medium from all wells (except the untreated control). Apply the following to the respective wells:
- Positive Control: Medium containing staurosporine (e.g., 1 µM).
- Inhibitor Control: Medium containing ABT-888 and staurosporine.
- Vehicle Control: Medium containing the highest volume of DMSO used in other treatments.
- Untreated Control: Fresh, pre-warmed culture medium.
- Incubation: Incubate the cells for a predetermined time course (e.g., 2-6 hours) at 37°C and 5% CO₂.
- Cell Harvesting: Harvest cells promptly for downstream analysis. For Western blotting, rinse wells with ice-cold PBS and lyse cells directly in RIPA buffer supplemented with protease and phosphatase inhibitors.
Protocol for Apoptosis Validation via Flow Cytometry
Validating apoptosis through Annexin V/Propidium Iodide (PI) staining in parallel provides crucial corroborative data for PARP-1 cleavage experiments [68] [66].
Materials Needed:
- Annexin V binding buffer (10 mM HEPES, 140 mM NaCl, 2.5 mM CaCl₂, pH 7.4).
- Fluorescently conjugated Annexin V (e.g., Annexin V-FITC).
- Propidium Iodide (PI) stock solution (e.g., 50 µg/mL).
- Flow cytometry tubes.
- Cold PBS.
Procedure:
- Cell Staining: After treatment, harvest cells gently using non-enzymatic dissociation to preserve membrane integrity. Wash cells once with cold PBS and resuspend in Annexin V binding buffer at ~1 x 10^6 cells/mL.
- Staining: Transfer 100 µL of cell suspension to a flow cytometry tube. Add 5 µL of Annexin V-FITC and 5 µL of PI solution.
- Incubation: Gently mix the cells and incubate for 15 minutes at room temperature in the dark.
- Analysis: Within one hour, add 400 µL of binding buffer to each tube and analyze by flow cytometry. Use untreated cells and single-stained controls for instrument compensation and quadrant setting.
Data Interpretation:
- Viable Cells: Annexin V negative / PI negative.
- Early Apoptotic Cells: Annexin V positive / PI negative (key population for initial apoptosis).
- Late Apoptotic/Necrotic Cells: Annexin V positive / PI positive.
Protocol for PARP-1 Cleavage Detection via Western Blot
Materials Needed:
- RIPA Lysis Buffer with protease inhibitors.
- BCA Protein Assay Kit.
- SDS-PAGE gel (8-12% gradient recommended).
- Primary antibodies: Anti-cleaved PARP-1 (Asp214) [65] and loading control (e.g., β-actin).
- HRP-conjugated secondary antibodies.
- Chemiluminescent substrate.
Procedure:
- Protein Extraction and Quantification: Lyse harvested cells in RIPA buffer on ice for 30 minutes. Centrifuge at 12,000 x g for 15 minutes at 4°C. Collect the supernatant and quantify protein concentration using a BCA assay.
- Gel Electrophoresis and Transfer: Load equal amounts of protein (20-30 µg) onto an SDS-PAGE gel. Electrophorese and transfer to a PVDF membrane.
- Immunoblotting: Block the membrane with 5% non-fat milk. Incubate with primary antibody against cleaved PARP-1 (Asp214) overnight at 4°C [65]. Wash and incubate with an HRP-conjugated secondary antibody. Develop using chemiluminescent substrate.
- Analysis: Detect the full-length PARP-1 at ~116 kDa and the cleaved fragment at ~89 kDa. Re-probe the membrane for a loading control like β-actin to ensure equal loading.
The Scientist's Toolkit: Research Reagent Solutions
Table 2: Essential Reagents for PARP-1 Cleavage Studies in Neuronal Cells
| Reagent | Function / Target | Key Application Notes |
|---|---|---|
| Anti-PARP-1 (cleaved Asp214) Antibody | Specifically detects the 89 kDa caspase-cleaved fragment of PARP-1 [65]. | Validated for Western Blot (WB), Flow Cytometry (Flow), and Immunocytochemistry (ICC) in human and rodent samples [65]. |
| ABT-888 (Veliparib) | Potent inhibitor of PARP-1 and PARP-2 [67]. | Used at 15-60 µM in vitro; pre-treatment for 1-2 hours is typical. Considered for low-toxicity neuroprotective studies [64] [67]. |
| Staurosporine | Broad-spectrum protein kinase inhibitor that rapidly induces apoptosis. | A reliable positive control; use at 0.1-1 µM for 2-6 hours. Aliquot and store at -20°C in DMSO, protected from light. |
| Annexin V-FITC Conjugate | Binds to phosphatidylserine (PS) externalized on the outer leaflet of the plasma membrane in early apoptosis [68] [66]. | Used in conjunction with PI for flow cytometry-based apoptosis quantification. Calcium must be present in the binding buffer. |
| Propidium Iodide (PI) | Membrane-impermeant DNA intercalating dye that stains cells with compromised membranes (late apoptosis/necrosis) [66]. | Distinguishes early apoptotic (Annexin V+/PI-) from late apoptotic/necrotic (Annexin V+/PI+) cells. |
| Caspase Inhibitor (Z-VAD-FMK) | Pan-caspase inhibitor that blocks the enzymatic cascade of apoptosis. | A critical control to confirm caspase-dependent PARP-1 cleavage (e.g., at 20-50 µM). |
Signaling Pathways and Workflows
PARP-1 Cleavage and Apoptosis Signaling Pathway
Diagram 1: Apoptosis and PARP-1 Cleavage Pathway
Experimental Workflow for PARP-1 Cleavage Analysis
Diagram 2: PARP-1 Cleavage Analysis Workflow
The rigorous inclusion of apoptotic inducers and PARP inhibitors like ABT-888 as controls is not merely a methodological formality but a cornerstone of reliable research on PARP-1 cleavage in neuronal cells. The detailed protocols and controls outlined in this application note provide a framework for generating robust, interpretable, and reproducible data. By validating apoptosis through multiple methods and confirming the specificity of PARP-1 cleavage detection, researchers can significantly advance our understanding of cell death mechanisms in neurological health and disease, thereby strengthening the foundation for future therapeutic development.
Challenges in Cytoplasmic-Nuclear Fractionation and PARP-1 Localization Studies
The precise subcellular localization of poly(ADP-ribose) polymerase-1 (PARP-1) serves as a critical biomarker for understanding cellular stress, DNA damage response, and cell death pathways. During apoptosis, PARP-1 undergoes caspase-mediated cleavage, generating signature fragments that translocate between cellular compartments. However, studying these events presents significant technical challenges, particularly when working with complex primary cells like neurons. This application note details the obstacles in cytoplasmic-nuclear fractionation for PARP-1 localization studies and provides validated protocols to overcome them, specifically framed within neuronal cell research and drug development contexts.
Biological Significance of PARP-1 Localization and Cleavage
PARP-1 is a nuclear enzyme that rapidly responds to DNA damage by catalyzing the addition of poly(ADP-ribose) (PAR) chains onto target proteins. Its cleavage and subcellular redistribution are hallmark events in cell death pathways:
- Apoptotic Cleavage: During apoptosis, executioner caspases-3 and -7 cleave PARP-1 at the DEVD214 motif, generating a 24 kDa DNA-binding domain (DBD) fragment and an 89 kDa catalytic fragment [42] [4]. This cleavage is considered a definitive biomarker of apoptosis.
- Functional Consequences: The 24 kDa fragment, which contains zinc finger motifs, can irreversibly bind to damaged DNA, acting as a trans-dominant inhibitor of DNA repair processes. The 89 kDa fragment, containing the automodification and catalytic domains, has reduced DNA binding capacity and can be liberated from the nucleus [42].
- Differential Effects on Viability: Research in neuronal models shows that the cleavage fragments exert opposing effects on cell survival. Expression of the 24 kDa fragment or an uncleavable PARP-1 mutant (PARP-1UNCL) was cytoprotective in models of oxygen/glucose deprivation (OGD), whereas the 89 kDa fragment was cytotoxic [4].
- Cytoplasmic Translocation in Non-Apoptotic Signaling: Beyond apoptosis, DNA damage can induce PARP-1 translocation to the cytoplasm in an iNOS- and DNA-PK-dependent manner. Here, PARP-1 can PARylate cytoplasmic proteins like cGAS, thereby linking genome instability to the regulation of antiviral immunity [69].
Key Technical Challenges in Fractionation and Localization
Accurate assessment of PARP-1 cleavage and localization is fraught with methodological pitfalls that can compromise data interpretation.
- Cross-Contamination During Fractionation: Incomplete separation of nuclear and cytoplasmic fractions is a primary concern. The 24 kDa DBD fragment can remain tightly bound to nuclear DNA, while the 89 kDa fragment may leak into the cytoplasm, leading to misinterpretation of translocation events [42].
- Analysis of Complex Cell Mixtures: When analyzing primary cells from heterogeneous tissues (e.g., brain) or blood, the required purification and culturing steps can alter the native cellular state and signaling pathways. Cell sorting is harsh on samples, and recovered cells may no longer reflect physiological conditions [70].
- Limitations of Conventional Flow Cytometry: Standard flow cytometry excels at multiparametric surface marker analysis but cannot natively provide information on protein subcellular localization without specialized kits or instrumentation [70].
- Low Protein Yield from Primary Samples: The protein yield from core needle biopsies of human tissues or primary neuronal cultures is often significantly lower and more variable than from immortalized cell lines. This necessitates protocol modifications to achieve sufficient protein load for detection assays like Western blotting or immunoassays [71].
- Dynamic and Rapid Shuttling: PARP-1's localization is highly dynamic. For instance, nuclear PARP-1 hyperactivity can trigger mitochondrial dysfunction within 60 minutes, indicating rapid inter-organelle communication that can be missed with single time-point analyses [72].
Quantitative Data on PARP-1 Cleavage Fragments
The following table summarizes the key characteristics of the primary PARP-1 cleavage fragments, which are crucial for their identification and functional analysis.
Table 1: Characterization of Major PARP-1 Cleavage Fragments
| Fragment Size | Domains Contained | Reported Localization | Post-Cleavage Function |
|---|---|---|---|
| 24 kDa | DNA-Binding Domain (DBD) with two zinc finger motifs [42] | Nuclear retention [42] | Irreversibly binds damaged DNA; trans-dominant inhibitor of DNA repair [42] |
| 89 kDa | Auto-modification domain (AMD) and Catalytic Domain (CD) [42] | Can be liberated from nucleus to cytosol [42] | Catalytic activity is greatly reduced due to separation from DBD; implicated in cytotoxicity [4] |
Recommended Experimental Protocols
Flow Cytometry-Based Quantification of Nuclear vs. Cytoplasmic Localization
This protocol, adapted from a validated method for use in whole blood and complex cell mixtures, allows for quantitative measurement of protein localization without requiring cell sorting or purification [70].
Workflow Overview:
Detailed Procedure:
- Sample Collection: Collect fresh blood in K3-EDTA vacutainers or primary neuronal cells in suspension. Do not purify or culture to maintain the endogenous environment [70].
- Fixation: Fix cells according to standard procedures for your cell type.
- Sequential Permeabilization and Staining:
- Cytoplasmic Staining: Permeabilize cells using a mild cytoplasmic buffer (e.g., from the Whole Blood Nuclear Localization Kit, Beckman Coulter). Incubate with fluorochrome-conjugated antibodies against cytoplasmic markers (e.g., α-Tubulin) and/or proteins of interest with known cytoplasmic roles. Wash thoroughly [70].
- Nuclear Staining: Subsequently, permeabilize cells with a stronger, proprietary nuclear permeabilization buffer. Incubate with antibodies against nuclear epitopes. For PARP-1, use validated antibodies (e.g., Clone 9532, CST) and detect cleavage-specific forms if possible (e.g., anti-cleaved PARP-1 Asp214). Wash thoroughly [70].
- Data Acquisition and Analysis: Acquire data on a conventional flow cytometer. The sequential staining allows for discrete quantification of protein amounts in each compartment. Data can be reported as Mean Fluorescent Intensity (MFI) for each channel [70].
Validated Protocol for PAR Immunoassay on Low-Yield Samples
This protocol addresses the challenge of low protein yield from precious samples like neuronal biopsies or primary cultures, a common issue reported during the development of PAR immunoassays [71].
Key Modifications for Low-Yield Samples:
- Lysis Buffer Optimization: Use a lysis buffer compatible with loading larger volumes of lysate into the assay well without interference (e.g., avoiding high detergent concentrations that can disrupt antibody binding) [71].
- Increased Lysate Volume: To achieve the desired protein concentration for detection, a larger volume of the clarified lysate can be loaded into the immunoassay well compared to standard protocols optimized for cell lines [71].
- Controls for Assay Sensitivity: Always include a positive control (e.g., cells treated with a DNA-damaging agent like H₂O₂) and a negative control (e.g., cells treated with a PARP inhibitor like Veliparib) to confirm the dynamic range of the assay under modified conditions [71] [73].
The Scientist's Toolkit: Essential Research Reagents
The following table lists critical reagents and their applications for studying PARP-1 localization and activity, as cited in the literature.
Table 2: Key Research Reagent Solutions for PARP-1 Studies
| Reagent / Assay | Specific Example (Where Cited) | Primary Function in Research |
|---|---|---|
| PARP Inhibitors | Veliparib (ABT-888) [71] [73] | Tool compound to inhibit PARP enzymatic activity; used to establish PARP-dependence of observed phenomena. |
| Apoptosis Inducers | Staurosporine (STS) [9] | A well-characterized apoptotic stimulus used to trigger caspase activation and subsequent PARP-1 cleavage. |
| Anti-PARP-1 Antibodies | Clone 9532 (CST) [74]; Anti-cleaved PARP-1 (Asp214) [73] | Detection of full-length and cleaved forms of PARP-1 via Western blot, flow cytometry, or immunofluorescence. |
| Anti-PAR Antibodies | Clone 10H (Enzo Life Sciences) [73] | Detection of poly(ADP-ribose) polymers, serving as a direct marker of PARP enzymatic activity. |
| PAR Immunoassay | Commercial Kit (Trevigen) [71] | Quantification of PAR levels in cell or tissue lysates as a pharmacodynamic marker of PARP activity. |
| Flow Cytometry Kit | Whole Blood Nuclear Localization Kit (Beckman Coulter) [70] | Enables quantitative separation of cytoplasmic and nuclear signals in complex cell mixtures using conventional flow cytometers. |
Visualization of PARP-1 in Apoptotic and DNA Damage Signaling
PARP-1 functions at the nexus of DNA damage response and cell death. The following diagram integrates its role in apoptosis, as detected by cleavage, and in a newly identified cytoplasmic signaling pathway.
Accurate determination of PARP-1 localization and cleavage status is technically challenging but essential for valid interpretation of its role in neuronal cell death, DNA damage response, and inflammation. The key to success lies in selecting appropriate methods that minimize artifacts from sample processing, especially when working with primary neuronal cells. The protocols and tools outlined here, including a robust flow cytometry method for complex samples and optimized immunoassays for low-yield material, provide a framework for generating reliable, reproducible data. This rigorous approach to sample preparation and analysis is a critical foundation for basic research and the development of PARP-targeted therapies in neurological diseases.
Ensuring Specificity: Validating Your PARP-1 Cleavage Results with Orthogonal Methods
Within the context of neuronal cell research and the specific study of PARP-1 cleavage, confirming apoptosis through multiple correlated markers is a cornerstone of reliable data interpretation. Apoptosis, or programmed cell death, is characterized by a cascade of specific biochemical events. Among these, the activation of caspase-3 is a pivotal point of no return, leading to the cleavage of key cellular substrates, most notably poly(ADP-ribose) polymerase 1 (PARP-1). The detection of cleaved PARP-1 serves as a definitive hallmark of apoptosis, distinguishing it from other forms of cell death. This application note provides detailed protocols and data analysis frameworks for researchers and drug development professionals to robustly confirm apoptosis by correlating caspase-3/7 activation with PARP-1 cleavage, with a specific emphasis on sample preparation and analysis in neuronal models.
Quantitative Analysis of Apoptotic Markers
The following table summarizes the key apoptotic markers, their detection methods, and the biological significance of their measurement, synthesizing common approaches used in the field.
Table 1: Key Apoptotic Markers and Detection Methods
| Marker | Detection Method | Key Feature Detected | Significance in Apoptosis |
|---|---|---|---|
| Caspase-3/7 Activity | Luminescent Assay (e.g., Caspase-Glo 3/7) [75] | Enzymatic activity of activated caspases | Central executioners of apoptosis; key indicator of commitment to cell death. |
| Cleaved PARP-1 | Western Blot (e.g., Antibody #9542) [76] | ~89 kDa cleavage fragment (from full-length 116 kDa) [76] | Definitive biomarker of caspase-mediated apoptosis; indicates inactivation of DNA repair. |
| Cleaved PARP-1 | Immunohistochemistry / Western Blot (e.g., Antibody [E51]) [49] | ~25-29 kDa fragment containing the caspase cleavage site [49] | Validated specificity for the apoptotic fragment; useful for multiple applications including IHC. |
| Nuclear Fragmentation | TUNEL Assay [77] | DNA strand breaks in the nucleus | Late-stage apoptotic marker; indicates irreversible DNA degradation. |
The quantitative data from these assays can be consolidated for comparison, as shown in the table below. The values are representative and should be established empirically for each experimental system.
Table 2: Representative Quantitative Data from Apoptosis Assays
| Assay | Control Signal (Luminescence/RFU/Band Intensity) | Apoptosis-Induced Signal (e.g., Staurosporine) | Signal-to-Background Ratio | Assay Duration |
|---|---|---|---|---|
| Caspase-Glo 3/7 [75] | ~500,000 RLU | ~2,500,000 RLU | 5.0 | ~1 hour incubation |
| Western Blot (Cleaved PARP-1) [49] | Undetectable (Lane 1) | Strong ~25/27 kDa band (Lane 2) | N/A | Overnight (Primary Ab) |
Experimental Protocols for Correlative Analysis
Protocol 1: Caspase-3/7 Activity Measurement using a Luminescent Assay
This protocol is adapted from the commercially available Caspase-Glo 3/7 Assay system [75] [78], which provides a homogeneous, "add-mix-measure" format for sensitive detection of caspase activity.
Materials:
- Caspase-Glo 3/7 Buffer and Lyophilized Substrate (Promega)
- White-walled multiwell plate (96- or 384-well)
- Plate shaker
- Luminometer
- Cultured neuronal cells (e.g., SH-SY5Y, Neuro 2a) [77]
Procedure:
- Cell Seeding and Treatment: Seed neuronal cells in a white-walled multiwell plate and treat with the apoptotic agent of interest (e.g., 1-3 µM Staurosporine) [49] for a predetermined duration.
- Reagent Preparation: Equilibrate the Caspase-Glo 3/7 Buffer and substrate to room temperature. Transfer the buffer into the substrate bottle and mix by swirling or inverting until the substrate is fully dissolved to form the Caspase-Glo 3/7 Reagent.
- Assay Execution: Remove the culture media from the wells. Add a volume of Caspase-Glo 3/7 Reagent equal to the volume of the remaining culture medium in each well (e.g., add 100 µL reagent to 100 µL medium) [78].
- Incubation and Measurement: Mix the contents gently on a plate shaker for 30 seconds. Incubate the plate at room temperature for 1-3 hours to allow the luminescent signal to develop. Measure the luminescence using a plate-reading luminometer.
Protocol 2: Detection of PARP-1 Cleavage by Western Blotting
This protocol is critical for correlating caspase activation with its downstream effect on PARP-1 cleavage [49] [76].
Materials:
- RIPA Lysis Buffer (for total protein extraction)
- BCA or Bradford Protein Assay Kit
- Primary Antibodies: Anti-PARP Antibody (#9542, Cell Signaling Technology) [76] or Anti-Cleaved PARP1 antibody [E51] (ab32064, Abcam) [49]
- Secondary Antibodies: HRP-conjugated anti-rabbit IgG
- SDS-PAGE Gel, Nitrocellulose/PVDF Membrane
- Chemiluminescent Substrate
Procedure:
- Sample Preparation (Critical Step): Lyse treated neuronal cells in an appropriate lysis buffer (e.g., RIPA with protease inhibitors). Centrifuge the lysates to remove debris and collect the supernatant. Determine the protein concentration of each sample using a colorimetric assay (e.g., Qubit Protein Assay Kit) [78] to ensure equal loading.
- Gel Electrophoresis and Transfer: Denature equal amounts of protein (e.g., 20-30 µg) in Laemmli buffer, resolve by SDS-PAGE on a 4-12% gradient gel, and transfer to a nitrocellulose or PVDF membrane.
- Immunoblotting:
- Blocking: Block the membrane with 5% non-fat dry milk or BSA in TBST for 1 hour at room temperature.
- Primary Antibody Incubation: Incubate the membrane with a primary antibody that detects both full-length and cleaved PARP-1 (e.g., PARP Antibody #9542 at 1:1000 dilution) [76] overnight at 4°C. This antibody recognizes the full-length PARP1 (116 kDa) and the large caspase-cleaved fragment (89 kDa).
- Washing and Secondary Antibody: Wash the membrane 3-4 times with TBST, then incubate with an HRP-conjugated secondary antibody (e.g., 1:2000-1:10000 dilution) for 1 hour at room temperature.
- Detection: After further washing, incubate the membrane with a chemiluminescent substrate and image using a digital imaging system.
The Apoptotic Signaling Pathway: From Initiation to Demolition
The diagram below illustrates the core signaling pathway in caspase-dependent apoptosis, highlighting the central role of Caspase-3 and its key substrate, PARP-1.
Diagram Title: Caspase-3 Activation and PARP-1 Cleavage in Apoptosis
The Scientist's Toolkit: Essential Reagents for Apoptosis Detection
The following table lists key reagents and their applications for the protocols described in this note.
Table 3: Research Reagent Solutions for Apoptosis Detection
| Reagent / Assay | Vendor Example | Primary Function in Apoptosis Research |
|---|---|---|
| Caspase-Glo 3/7 Assay | Promega [75] | Homogeneous, luminescent assay for measuring caspase-3 and -7 activity in live cells. |
| CellEvent Caspase-3/7 Green | Thermo Fisher Scientific [79] | Fluorescent reagent for direct detection and imaging of caspase-3/7 activation in live cells. |
| PARP Antibody (#9542) | Cell Signaling Technology [76] | Detects both full-length (116 kDa) and caspase-cleaved (89 kDa) PARP-1 by Western blot. |
| Anti-Cleaved PARP1 [E51] (ab32064) | Abcam [49] | Rabbit monoclonal antibody specific for the cleaved fragment of PARP-1; validated for WB and IHC. |
| PARP1 Antibody (sc-56196) | Santa Cruz Biotechnology [80] | Mouse monoclonal antibody recommended for detection of the cleaved product of PARP-1. |
The correlative analysis of caspase-3/7 activation and PARP-1 cleavage provides a robust and reliable framework for confirming apoptosis in neuronal cell research. The protocols detailed herein, from sensitive luminescent activity assays to specific immunoblotting for cleavage fragments, offer researchers a comprehensive toolkit. Proper sample preparation is paramount, as it ensures the accurate preservation of these proteolytic events. By employing these complementary techniques, scientists and drug developers can generate high-quality, reproducible data to validate the efficacy of pro-apoptotic therapies and deepen the understanding of cell death mechanisms in neurological diseases and cancer.
The detection of PARP-1 cleavage serves as a critical biomarker in neuronal cell death research, particularly in studying neurodegenerative diseases such as Alzheimer's and Parkinson's disease [29] [10]. During apoptosis, caspase-3 and caspase-7 specifically cleave PARP-1 at the DEVD214-Gly215 site, generating characteristic 24-kDa and 89-kDa (or 85-kDa) fragments [81] [4] [11]. While Western blotting is commonly employed to detect these fragments, relying on a single methodology can yield incomplete data. This application note details a comprehensive framework of orthogonal techniques—immunoprecipitation and immunofluorescence—to provide robust, complementary data on PARP-1 cleavage status, cellular localization, and function within physiologically relevant models of neuronal injury.
PARP-1 Cleavage Fragments: Signatures in Cell Death
Caspase-mediated cleavage of PARP-1 produces fragments with distinct localizations and functions, which can be leveraged for specific detection techniques.
The diagram above illustrates the cleavage process and fate of the resulting fragments. The 24-kDa fragment, containing the DNA-binding domain, remains nuclear-bound and can act as a trans-dominant inhibitor of DNA repair [11] [10]. In contrast, the 89-kDa fragment, containing the automodification and catalytic domains, can translocate to the cytoplasm under certain conditions, sometimes carrying poly(ADP-ribose) (PAR) polymers and facilitating apoptosis-inducing factor (AIF)-mediated cell death pathways [11]. This differential localization provides a strategic basis for employing immunofluorescence to distinguish between these fragments.
Orthogonal Techniques for PARP-1 Cleavage Detection
Immunoprecipitation for Target Isolation
Immunoprecipitation (IP) enables the selective isolation of PARP-1 and its cleavage fragments from complex cell lysates, facilitating downstream analysis and enhancing detection sensitivity.
- Key Applications: Concentrate low-abundance cleavage fragments prior to Western blot analysis; isolate PARP-1 complexes to study interacting proteins; purify specific fragments for functional studies [82].
- Protocol Summary:
- Prepare Lysates: Lyse neuronal cells (e.g., primary cortical neurons or SH-SY5Y neuroblastoma cells) using RIPA buffer supplemented with protease inhibitors [4].
- Pre-clear Lysate: Incubate lysate with control IgG and protein A/G beads to reduce non-specific binding.
- Incubate with Antibody: Add 1-5 µg of anti-PARP-1 antibody to the pre-cleared lysate and incubate at 4°C for 2-4 hours [82].
- Capture Complexes: Add protein A/G beads and incubate for 1 hour at 4°C.
- Wash and Elute: Wash beads extensively with lysis buffer, then elute bound proteins with Laemmli buffer for Western blot analysis.
- Validation: Always include PARP-1 knockout cell lines as a negative control to confirm antibody specificity, as recommended in standardized antibody characterization protocols [82].
Immunofluorescence for Spatial Localization
Immunofluorescence (IF) provides critical spatial and morphological context, allowing researchers to correlate PARP-1 cleavage with subcellular events and to perform single-cell analyses.
- Key Applications: Determine subcellular localization of full-length and cleaved PARP-1 fragments; correlate cleavage with nuclear condensation and other morphological hallmarks of cell death; validate findings from Western blot and IP in a cellular context [11].
- Protocol Summary:
- Cell Culture and Treatment: Plate neuronal cells on glass coverslips and treat with apoptotic inducers (e.g., camptothecin, oligomeric Aβ1–42) [81] [29].
- Fixation and Permeabilization: Fix cells with 4% paraformaldehyde for 15 minutes, then permeabilize with 0.2% Triton X-100 in PBS.
- Antibody Staining: Incubate with primary antibodies (e.g., mouse anti-PARP-1 for total PARP-1, rabbit anti-cleaved PARP-1 [Asp214]) diluted in blocking buffer overnight at 4°C [81].
- Detection and Imaging: Incubate with fluorophore-conjugated secondary antibodies (e.g., Alexa Fluor 488). Mount and image using a confocal microscope.
- Advanced Technique - In Situ Fractionation: To reduce background from abundant nuclear PARP-1 and better visualize DNA damage-recruited PARP-1, use a CSK buffer with Triton and 0.42 M NaCl (C+T+S) to extract "free" nuclear PARP-1 before fixation, leaving behind the fraction strongly bound to DNA lesions [83].
The Scientist's Toolkit: Essential Research Reagents
Table 1: Key Reagents for PARP-1 Cleavage Studies
| Reagent Category | Specific Example | Function in Experiment |
|---|---|---|
| Cell Lines | SH-SY5Y human neuroblastoma [4] | Common in vitro model for neuronal death studies |
| Primary rat cortical neurons [4] | Physiologically relevant model for neurodegeneration | |
| Apoptosis Inducers | Camptothecin (10 µM) [81] | Topoisomerase inhibitor; positive control for apoptosis |
| Oligomeric Aβ1–42 (1 µM) [29] | Alzheimer's disease-relevant toxin inducing PARP-1 activation | |
| PARP Inhibitors | ABT-888 (Veliparib, 1 µM) [29] | Pharmacological tool to inhibit PARP activity and study consequences |
| Key Antibodies | Anti-PARP-1 (cleaved Asp214) [81] | Specifically detects the 89-kDa cleavage fragment |
| HLNC4 antibody (conjugated with Alexa Fluor 488) [81] | Enables flow cytometric or IF detection of the 85/89-kDa fragment | |
| Detection Systems | Fluorophore-conjugated secondary antibodies [81] | For immunofluorescence and flow cytometry detection |
Integrated Experimental Workflow
A robust experimental design integrates these orthogonal techniques to provide a comprehensive picture of PARP-1 biology.
The interplay between different PARP-1 fragments adds complexity to their roles in cell fate decisions. Research indicates that the cleavage fragments themselves are not merely inert byproducts but can have active and opposing biological functions. For instance, the expression of the 24-kDa fragment or an uncleavable PARP-1 mutant (PARP-1UNCL) conferred protection from oxygen/glucose deprivation in neuronal models, while the 89-kDa fragment was cytotoxic [4]. This underscores the importance of techniques that can distinguish between these fragments.
Furthermore, the role of PARP-1 cleavage extends beyond a simple apoptotic marker. A 2020 study revealed a novel pathway where the caspase-3-generated 89-kDa fragment, with attached PAR polymers, translocates to the cytoplasm and facilitates AIF release from mitochondria, creating a link between caspase-mediated apoptosis and AIF-mediated parthanatos [11]. This complex biology is best unraveled using a multi-faceted technical approach.
In conclusion, moving beyond Western blot to incorporate immunoprecipitation and immunofluorescence provides a more powerful and conclusive framework for studying PARP-1 cleavage. This orthogonal strategy, utilizing well-validated reagents within standardized protocols, enables researchers to confidently dissect the nuanced roles of PARP-1 and its cleavage products in neuronal death, thereby accelerating therapeutic development for neurodegenerative diseases.
Distinguishing Apoptotic Cleavage from Other Proteolytic Events (Calpain, etc.)
In the study of neuronal cell death, the accurate detection of specific proteolytic events is a cornerstone of mechanistic research. The cleavage of poly (ADP-ribose) polymerase-1 (PARP-1) serves as a classic biomarker, yet its interpretation is complicated by the enzyme's susceptibility to multiple families of proteases activated in different cell death pathways. Apoptosis, traditionally characterized by caspase activation, and other forms of programmed cell death involving calpains (Ca²⁺-dependent proteases) can both process PARP-1 into distinct fragments [10]. For researchers investigating neurotoxicity, neurodegenerative diseases, or neuroprotective drug candidates, distinguishing these cleavage events is not merely an academic exercise but a critical prerequisite for correctly interpreting experimental outcomes. This application note, framed within the broader context of optimizing sample preparation for PARP-1 cleavage detection in neuronal cells, provides detailed protocols and tools to differentiate apoptotic caspase cleavage from calpain-mediated proteolysis, thereby ensuring accurate data interpretation in neuroscience research and drug development.
Background
Key Proteases in Neuronal Cell Death
In neuronal pathologies, two major protease families often contribute to the execution of cell death:
- Caspases: A family of cysteine-aspartic proteases that are central effectors of apoptosis. They are typically activated by intrinsic (mitochondrial) or extrinsic (death receptor) pathways. Caspase-3 and -7 are the primary executioners and cleave their substrates after aspartic acid residues within specific motifs [10].
- Calpains: A family of calcium-activated neutral cysteine proteases. The two ubiquitous isoforms, µ-calpain (calpain I) and m-calpain (calpain II), require micromolar and millimolar concentrations of Ca²⁺, respectively, for activation [84]. Calpain activation is implicated in neuronal apoptosis following spinal cord injuries, stroke, and neurodegenerative diseases such as Alzheimer's and Parkinson's [84]. Calpain activity is regulated by its endogenous inhibitor, calpastatin [84].
PARP-1 as a Protease Substrate
PARP-1 is a nuclear enzyme involved in DNA repair and other nuclear functions. It becomes a target for proteolysis during cell death, and the resulting cleavage fragments serve as specific signatures of protease activity.
- Caspase Cleavage: Caspase-3 and -7 cleave PARP-1 at the DEVD²¹⁴ site within its DNA-binding domain, generating a characteristic 24 kDa DNA-binding fragment and an 89 kDa catalytic fragment [4] [10]. This event is considered a hallmark of apoptosis.
- Calpain Cleavage: Calpain processes PARP-1 at a different site, producing a 50 kDa fragment containing the catalytic domain and other distinct fragments, but notably not the 24 kDa and 89 kDa pair [10]. The presence of the 50 kDa fragment is a recognized signature of calpain activity.
The table below summarizes the key characteristics of these cleavage events.
Table 1: Characteristics of PARP-1 Cleavage by Different Proteases
| Feature | Caspase-3/7 Mediated Cleavage | Calpain Mediated Cleavage |
|---|---|---|
| Primary Stimulus | Apoptotic signals (e.g., DNA damage, death receptor ligation) | Ca²⁺ influx (e.g., excitotoxicity, ischemia) |
| Cleavage Site | DEVD²¹⁴ | Distinct from caspase site (not DEVD) |
| Signature Fragments | 24 kDa (DBD) + 89 kDa (Catalytic) | 50 kDa (Catalytic), and others |
| Biological Implication | Apoptosis; disables DNA repair | Necrosis-like and other cell death pathways |
| Inhibitor | Z-VAD-FMK (pan-caspase) | Calpeptin, MDL-28170 |
The following diagram illustrates the specific cleavage of PARP-1 by caspases and calpains, resulting in their unique signature fragments.
Application Notes & Protocols
This section provides a detailed workflow and specific protocols for the preparation and analysis of neuronal cell samples to distinguish between caspase and calpain-mediated PARP-1 cleavage.
General Workflow for Sample Preparation
The logical flow of experiments, from cell treatment to analysis, is outlined below. This workflow ensures that the source of PARP-1 cleavage can be accurately identified.
Protocol 1: Differentiating PARP-1 Cleavage Using Pharmacological Inhibition
Objective: To induce cell death in neuronal cells and use specific protease inhibitors to determine the contribution of caspases and calpains to PARP-1 cleavage.
Materials:
- Primary rat cortical neurons or human neuroblastoma cell line (e.g., SH-SY5Y) [4].
- Inducers: Staurosporine (1 µM, for apoptosis), Glutamate (100 µM, for excitotoxicity), or H₂O₂ (100-500 µM, for oxidative stress).
- Inhibitors: Z-VAD-FMK (50 µM, pan-caspase inhibitor), Calpeptin (20-50 µM, calpain inhibitor) [85] [86].
- Lysis Buffer: RIPA buffer supplemented with a broad-spectrum protease inhibitor cocktail (excluding EDTA for calpain-active assays) and 1 mM PMSF.
- Antibodies: Anti-PARP-1 antibody (to detect full-length and all fragments), anti-caspase-3 antibody (for cleavage control), anti-α-spectrin antibody (a known calpain substrate, for cleavage control).
Method:
- Cell Culture and Treatment: Plate neurons in appropriate culture vessels. On the day of the experiment, pre-treat cells with either DMSO (vehicle control), 50 µM Z-VAD-FMK, or 50 µM Calpeptin for 1 hour.
- Induction of Cell Death: Add the chosen death inducer (e.g., staurosporine for apoptosis, glutamate for excitotoxicity) to the pre-treated cells. Incubate for a predetermined time (e.g., 4-24 hours, requires optimization).
- Cell Lysis: Place culture plates on ice. Aspirate the medium and wash cells once with ice-cold PBS. Add an appropriate volume of ice-cold lysis buffer to the cells. Scrape the cells and transfer the lysate to a microcentrifuge tube. Incubate on ice for 20 minutes, then centrifuge at 14,000 x g for 15 minutes at 4°C.
- Protein Quantification: Transfer the supernatant to a new tube. Determine the protein concentration of each sample using a Bradford or BCA assay.
- Western Blot Analysis: Dilute lysates in Laemmli buffer to achieve equal protein loading (e.g., 20-30 µg per lane). Heat denature samples at 95°C for 5 minutes. Separate proteins by SDS-PAGE (8-12% gel) and transfer to a PVDF membrane. Block the membrane with 5% non-fat milk in TBST for 1 hour. Incubate with primary antibodies (e.g., anti-PARP-1, 1:1000) overnight at 4°C. After washing, incubate with an HRP-conjugated secondary antibody (1:5000) for 1 hour at room temperature. Detect signals using a chemiluminescent substrate and image the blot.
Expected Results and Interpretation:
- Staurosporine-treated cells: Should show the classic 89 kDa and 24 kDa PARP-1 fragments. This cleavage should be blocked by Z-VAD-FMK but not by calpeptin.
- Glutamate-treated cells: May show the 50 kDa calpain-generated fragment, or a mix of fragments depending on the severity of the insult. Calpeptin should block the appearance of the 50 kDa fragment.
- Controls: Always run a sample from healthy, untreated cells to show the full-length PARP-1 band. The efficacy of caspase inhibition should be confirmed by the absence of cleaved caspase-3. The efficacy of calpain inhibition should be confirmed by the absence of calpain-specific α-spectrin breakdown products.
Protocol 2: Sequential Extraction for Localization of Cleavage Fragments
Objective: To separate nuclear and cytosolic fractions to track the translocation of PARP-1 cleavage fragments, which can provide additional evidence for the active protease.
Materials:
- Fractionation Kit: Commercial nuclear/cytosolic fractionation kit.
- Additional Antibodies: Antibody for Apoptosis-Inducing Factor (AIF), a mitochondrial protein released and translocated to the nucleus upon calpain activation [85].
Method:
- Cell Treatment: Treat neurons as described in Protocol 1.
- Fractionation: Follow the manufacturer's instructions for the fractionation kit. Typically, this involves using a detergent-based cytosolic extraction buffer first, followed by a more stringent buffer to lyse the nucleus.
- Analysis: Analyze both the cytosolic and nuclear fractions by Western blotting using antibodies against PARP-1, AIF, and fractionation controls (e.g., Lamin B1 for nucleus, GAPDH for cytosol).
Expected Results and Interpretation:
- The 24 kDa caspase-generated PARP-1 fragment remains tightly bound to nuclear DNA [10].
- The 89 kDa caspase-generated fragment can be liberated into the cytosol [10].
- Calpain-mediated cleavage and the resulting fragments may exhibit a different distribution pattern. Furthermore, calpain activation can lead to the cleavage of AIF and its translocation from mitochondria to the nucleus, a event not typically associated with pure caspase-dependent apoptosis [85]. Observing nuclear AIF accumulation alongside a 50 kDa PARP-1 fragment strongly indicates calpain involvement.
The Scientist's Toolkit: Key Research Reagents
The following table lists essential reagents for investigating PARP-1 cleavage in neuronal cell death models.
Table 2: Essential Reagents for PARP-1 Cleavage Studies
| Reagent / Material | Function / Application | Examples & Notes |
|---|---|---|
| SH-SY5Y Cells / Primary Cortical Neurons | Common in vitro neuronal models for cell death studies. | SH-SY5Y is a human neuroblastoma line [4]. Primary neurons offer higher physiological relevance. |
| Z-VAD-FMK | Cell-permeable, irreversible pan-caspase inhibitor. | Used at 20-50 µM to confirm caspase-dependent processes [86]. |
| Calpeptin | Cell-permeable, potent and selective calpain inhibitor. | Used at 20-50 µM to confirm calpain-dependent processes [85] [86]. |
| Anti-PARP-1 Antibody | Detects full-length (113 kDa) and cleavage fragments (89, 50, 24 kDa). | Crucial for identifying protease-specific signatures via Western blot [10]. |
| Anti-Caspase-3 Antibody | Control for apoptosis induction and caspase inhibitor efficacy. | Detects full-length (35 kDa) and cleaved active form (17/19 kDa). |
| Anti-α-Spectrin Antibody | Control for calpain activation. | Calpain generates specific 145/150 kDa breakdown products; caspases generate a 120 kDa fragment. |
| Anti-AIF Antibody | Marker for calpain-mediated mitochondrial permeabilization. | Detects release of AIF from mitochondria and its translocation to the nucleus [85]. |
| Protease Inhibitor Cocktail (EDTA-free) | Protects protein samples from general degradation during lysis. | Use EDTA-free versions when studying calpain, as calpain requires Ca²⁺. |
Data Analysis and Interpretation
The definitive interpretation of PARP-1 cleavage relies on correlating the observed fragment pattern with the use of specific inhibitors and other cell death markers. The decision matrix below can serve as a guide.
Table 3: Interpreting PARP-1 Cleavage Patterns in Neuronal Death
| Observed PARP-1 Fragment(s) | Effect of Z-VAD-FMK | Effect of Calpeptin | Likely Primary Protease | Recommended Confirmatory Assays |
|---|---|---|---|---|
| 89 kDa + 24 kDa | Blocks cleavage | No effect | Caspase-3/7 | Measure caspase-3/7 activity; TUNEL assay. |
| ~50 kDa | No effect | Blocks cleavage | Calpain | Assess calpain activity; check for α-spectrin breakdown products (145/150 kDa). |
| Multiple fragments (e.g., 89, 50 kDa) | Partial reduction | Partial reduction | Mixed Caspase & Calpain Activity | Perform fractionation to localize fragments; check for AIF translocation. |
| No cleavage (Full-length only) | N/A | N/A | No significant protease activation | Check cell viability; confirm death stimulus efficacy. |
Concluding Remarks
The meticulous preparation and analysis of neuronal cell samples are fundamental to accurately dissecting the complex signaling pathways that underlie cell death. By leveraging the distinct PARP-1 cleavage signatures generated by caspases and calpains, and by employing the pharmacological and biochemical tools detailed in this note, researchers can move beyond simply observing cell death to defining its precise molecular mechanism. This level of discrimination is essential for advancing our understanding of neurological disorders and for the rational development of targeted neurotherapeutics. The protocols provided herein offer a robust framework for achieving this critical distinction.
Comparative Analysis of PARP-1 Cleavage Across Different Neuronal Cell Models
Poly(ADP-ribose) polymerase-1 (PARP-1) is a nuclear enzyme crucial for DNA repair, cellular homeostasis, and cell death signaling. During apoptosis, caspase-3 cleaves PARP-1 at the DEVD214 site, generating 24 kDa and 89 kDa fragments (or 25 kDa and 85 kDa, as reported in some studies) [4] [81]. This cleavage event serves as a well-established hallmark of apoptosis and significantly influences cellular viability and inflammatory responses in neurological contexts [4] [27]. This application note provides a detailed comparative analysis of PARP-1 cleavage patterns in different neuronal cell models, offering standardized protocols for researchers investigating PARP-1 in neuronal death pathways.
Quantitative Analysis of PARP-1 Cleavage in Neuronal Models
Comparative Cell Viability and PARP-1 Fragment Effects
Table 1: Quantitative Effects of PARP-1 Cleavage Fragments on Neuronal Cell Viability
| PARP-1 Construct | Cell Viability Post-OGD | Cell Viability Post-OGD/ROG | NF-κB Activation | Key Regulatory Proteins |
|---|---|---|---|---|
| PARP-1WT (Control) | Baseline | Baseline | Baseline | Baseline iNOS, COX-2, Bcl-xL |
| PARP-1UNCL (Uncleavable) | Increased [4] | Increased [4] | Similar to PARP-1WT [4] | ↓ iNOS, ↓ COX-2, ↑ Bcl-xL [4] |
| PARP-124 (24 kDa fragment) | Increased [4] | Increased [4] | Similar to PARP-1WT [4] | ↓ iNOS, ↓ COX-2, ↑ Bcl-xL [4] |
| PARP-189 (89 kDa fragment) | Decreased [4] | Decreased [4] | Significantly higher than PARP-1WT [4] | ↑ iNOS, ↑ COX-2, ↓ Bcl-xL [4] |
Note: OGD = Oxygen/Glucose Deprivation; OGD/ROG = OGD/Restoration of Oxygen and Glucose
Regional and Cellular Specificity of PARP-1 Responses
Table 2: Regional-Specific PARP-1 Responses in Rat Brain Models Following Status Epilepticus
| Brain Region | Cell Type | PARP-1 Response | Functional Outcome | Response to PARP Inhibitors |
|---|---|---|---|---|
| CA1 & CA3 Hippocampus | Neurons | PARP-1 hyperactivation [27] | Neuronal death [27] | Attenuated neuronal death [27] |
| CA1 Hippocampus | Reactive Astrocytes | PARP-1 induction & activation [27] | Reactive astrogliosis [27] | Inhibited reactive astrogliosis [27] |
| Dentate Gyrus (Molecular Layer) | Astrocytes | PARP-1 degradation [27] | Astroglial death [27] | Aggravated astroglial death [27] |
| Piriform Cortex | Neurons | PARP-1 degradation [27] | Neuronal death [27] | No protective effect [27] |
| Piriform Cortex | Microglia | PARP-1 induction [27] | Activation | Not specified |
Experimental Protocols for PARP-1 Cleavage Detection
Protocol 1: PARP-1 Cleavage Detection via Flow Cytometry
This protocol enables specific detection of the 85 kDa PARP-1 cleavage fragment using antibody-based flow cytometry [81].
Materials:
- HLNC4 antibody conjugated with Alexa Fluor 488 [81]
- Paraformaldehyde (1% in PBS) [81]
- Flow cytometer (e.g., LSR II, Becton Dickinson) [81]
Procedure:
- Treat cells with experimental compounds (e.g., 25 µg/mL 2,4,6-TBP or PBP) for 24 hours at 37°C in darkness [81].
- Include camptothecin (10 µM) as a positive control for apoptosis induction [81].
- Wash cells and suspend in 1% paraformaldehyde in PBS [81].
- Add HLNC4 antibody conjugated with Alexa Fluor 488 to samples [81].
- Incubate for 30 minutes at 37°C in total darkness [81].
- Perform cytometric analysis at excitation/emission maxima of 494/519 nm for Alexa Fluor 488 [81].
- Record data for a total of 10,000 cells per sample [81].
Protocol 2: Oxygen/Glucose Deprivation (OGD) Model
This protocol simulates ischemic conditions in neuronal cell cultures to study PARP-1 cleavage under stress conditions [4].
Materials:
- SH-SY5Y human neuroblastoma cells or rat primary cortical neurons [4]
- Dulbecco's Modified Eagle Medium (DMEM) complete [4]
- Neurobasal Medium-A (NB-A) supplemented with B27 (for primary neurons) [4]
- Tetracycline-inducible PARP-1 constructs (PARP-1WT, PARP-1UNCL, PARP-124, PARP-189) [4]
Procedure:
- Culture SH-SY5Y cells in DMEM complete or primary cortical neurons in NB-A with B27 [4].
- Generate tetracycline-inducible stable transfectants with PARP-1 constructs [4].
- For primary neurons, transduce with Adeno-Associated Virus (AAV) vectors containing PARP-1 constructs 3 days after isolation [4].
- At day 6 post-isolation, subject cells to OGD for 6 hours [4].
- For OGD/ROG model, follow OGD with 15 hours of restoration of oxygen and glucose [4].
- Assess cell viability, PARP-1 cleavage fragments, and NF-κB activity [4].
Signaling Pathways and Experimental Workflows
PARP-1 Cleavage Signaling Pathway
PARP-1 Cleavage in Neuronal Apoptosis
Experimental Workflow for Comparative Analysis
PARP-1 Cleavage Analysis Workflow
The Scientist's Toolkit: Essential Research Reagents
Table 3: Key Research Reagent Solutions for PARP-1 Cleavage Studies
| Reagent/Resource | Function/Application | Example Specifications |
|---|---|---|
| HLNC4 Antibody | Specific detection of the 85 kDa PARP-1 cleavage fragment [81] | Conjugated with Alexa Fluor 488 for flow cytometry [81] |
| PARP-1 Constructs | Study of specific PARP-1 forms and their functions [4] | Tetracycline-inducible; PARP-1WT, PARP-1UNCL, PARP-124, PARP-189 [4] |
| Caspase-3 Activator | Positive control for apoptosis induction [81] | Camptothecin (10 µM) [81] |
| PARP Inhibitors | Investigate PARP-1 function in neuronal death [27] | PJ-34, DPQ [27] |
| AAV Vectors | Gene delivery in primary neuronal cultures [4] | For PARP-1 construct expression in cortical neurons [4] |
| Cell Culture Media | Maintenance of neuronal cell models [4] | DMEM complete for SH-SY5Y; Neurobasal-A with B27 for primary neurons [4] |
This application note demonstrates that PARP-1 cleavage exhibits distinct patterns across different neuronal cell models, with significant implications for cell viability and inflammatory responses. The cytoprotective effects of PARP-124 and the cytotoxic nature of PARP-189 highlight the complex regulatory functions of PARP-1 fragments. The provided protocols and analytical frameworks support standardized investigation of PARP-1 cleavage in neuronal research, particularly relevant for studies of ischemic injury and neurodegenerative processes.
Best Practices for Densitometric Analysis and Quantitative Data Presentation
The detection of PARP-1 cleavage is a critical methodology in cell death research, particularly in neuronal studies where distinguishing between apoptosis and other forms of programmed cell death is essential for understanding neuropathological mechanisms. As a signature event in apoptotic cascades, PARP-1 cleavage by caspases generates specific proteolytic fragments that serve as definitive biomarkers. This protocol details the best practices for the densitometric analysis and quantitative presentation of PARP-1 cleavage data, with particular emphasis on applications in neuronal cell research. The accurate quantification of these cleavage events provides invaluable insights into cell death pathways and potential therapeutic interventions for neurodegenerative conditions.
The Scientific Basis of PARP-1 Cleavage
PARP-1 Structure and Cleavage Fragments
PARP-1 is a 116-kDa nuclear protein composed of three primary domains: a DNA-binding domain (DBD) at the N-terminus, an automodification domain (AMD) in the central region, and a catalytic domain (CD) at the C-terminus [11] [10]. During caspase-dependent apoptosis, executioner caspases-3 and -7 cleave PARP-1 at a specific site within the nuclear localization signal near the DNA-binding domain, resulting in the characteristic 24-kDa and 89-kDa fragments [11] [10].
The 24-kDa fragment contains the DNA-binding motif and nuclear localization signal, while the 89-kDa fragment contains the automodification and catalytic domains [10]. Following cleavage, these fragments undergo distinct cellular trafficking—the 24-kDa fragment remains bound to DNA lesions acting as a trans-dominant inhibitor of DNA repair, while the 89-kDa fragment can translocate to the cytoplasm [11]. Research has demonstrated that these cleavage products differentially modulate cellular protection, with the 24-kDa fragment conferring protection from oxygen/glucose deprivation damage in neuronal models, while the 89-kDa fragment exhibits cytotoxic effects [14].
Biological Significance in Cell Death Pathways
PARP-1 cleavage serves as a crucial molecular switch between cell survival and death decisions. In neuronal cells, this process helps differentiate between apoptosis and other forms of cell death such as parthanatos, a caspase-independent programmed cell death pathway [11]. The 89-kDa PARP-1 fragment has been identified as a carrier of poly(ADP-ribose) (PAR) polymers to the cytoplasm, where it facilitates apoptosis-inducing factor (AIF) release from mitochondria, ultimately leading to nuclear shrinkage and DNA fragmentation [11]. This intricate relationship between PARP-1 cleavage fragments and cell death pathways underscores the importance of accurate detection and quantification in neuronal research.
Experimental Workflow for PARP-1 Cleavage Detection
The following diagram illustrates the complete experimental workflow from sample preparation through data analysis for PARP-1 cleavage detection in neuronal cells:
Research Reagent Solutions
The following table details essential reagents and materials required for PARP-1 cleavage detection experiments:
| Reagent/Material | Specific Function | Application Notes |
|---|---|---|
| Primary Antibodies | PARP-1 full-length and fragment detection | Use antibodies recognizing both full-length (116-kDa) and cleavage fragments (89-kDa, 24-kDa); validate specificity [11] |
| Caspase Inhibitors | Experimental controls (zVAD-fmk) | Confirm caspase-dependence of cleavage; use in control groups [11] |
| Apoptosis Inducers | Trigger PARP-1 cleavage (staurosporine, actinomycin D) | Standard concentrations: 0.1-1µM staurosporine, 0.5-5µM actinomycin D [11] |
| PARP Inhibitors | Experimental controls (PJ34, AG14361, ABT888) | Distinguish PARP-1-dependent cell death; PJ34 at 10-30µM [11] [87] |
| Cell Lines | Neuronal models (SH-SY5Y, primary cortical neurons) | SH-SY5Y human neuroblastoma validated for PARP-1 cleavage studies [14] |
| Detection Reagents | Chemiluminescent substrates, HRP-conjugated secondary antibodies | Ensure linear detection range for accurate densitometry [88] |
Detailed Experimental Protocols
Sample Preparation from Neuronal Cells
Protocol: Neuronal Cell Culture, Treatment, and Protein Extraction
Cell Culture and Differentiation:
- Maintain SH-SY5Y human neuroblastoma cells in DMEM/F12 medium with 10% FBS, 2mM L-glutamine, and 1% penicillin/streptomycin at 37°C with 5% CO₂ [14].
- For primary cortical neurons, isolate from E16-18 rat embryos and plate on poly-D-lysine coated dishes in Neurobasal medium with B-27 supplement, 2mM GlutaMAX, and 5% FBS [14].
Apoptotic Induction and PARP-1 Activation:
- Induce apoptosis using staurosporine (0.1-1µM) or actinomycin D (0.5-5µM) for 4-24 hours based on experimental requirements [11].
- Include control groups with caspase inhibitor zVAD-fmk (20-50µM) to confirm caspase-dependent cleavage [11].
- For PARP-1 activation studies, treat cells with hydrogen peroxide (H₂O₂) at 100-500µM for oxidative stress induction [87].
Protein Extraction and Quantification:
- Lyse cells using NP-40 lysis buffer (20mM Tris-HCl pH 8.8, 100mM NaCl, 1mM EDTA, 0.5% Nonidet P-40, 12mM Na-deoxycholate) with protease and phosphatase inhibitors [88].
- Incubate lysates on ice for 30 minutes, followed by centrifugation at 20,000 × g for 10 minutes at 4°C [88].
- Determine protein concentration using BCA assay with bovine serum albumin standards [88].
- Prepare samples in Laemmli buffer with 5% β-mercaptoethanol, denature at 95°C for 5 minutes, and store at -80°C if not used immediately.
Western Blot and Detection
Protocol: Electrophoresis, Transfer, and Immunodetection
Gel Electrophoresis:
- Load 20-50μg of total protein per lane on 4-12% Bis-Tris polyacrylamide gels to ensure optimal separation of full-length PARP-1 (116-kDa) and cleavage fragments (89-kDa, 24-kDa).
- Include pre-stained protein molecular weight markers for accurate size determination.
- Run electrophoresis at 120-150V for 60-90 minutes in MOPS or MES running buffer.
Protein Transfer and Membrane Blocking:
- Transfer proteins to nitrocellulose membranes using wet or semi-dry transfer systems at 100V for 60 minutes or 25V for 90 minutes respectively.
- Verify transfer efficiency using Ponceau S staining.
- Block membranes with 5% non-fat dry milk or BSA in TBST (Tris-buffered saline with 0.1% Tween-20) for 1 hour at room temperature with gentle agitation.
Antibody Incubation and Detection:
- Incubate with primary antibodies against PARP-1 (diluted 1:1000 in blocking buffer) overnight at 4°C with gentle agitation [88].
- Include antibodies for housekeeping proteins (β-actin, GAPDH, or Histone H3) simultaneously for loading controls.
- Wash membranes 3×10 minutes with TBST.
- Incubate with appropriate HRP-conjugated secondary antibodies (1:2000-1:5000) for 1 hour at room temperature.
- Develop using enhanced chemiluminescent substrates with digital imaging system capture.
Densitometric Analysis and Data Normalization
Image Acquisition and Quantitative Analysis
The following diagram illustrates the key decision points and analytical pathways for densitometric quantification of PARP-1 cleavage fragments:
Data Normalization and Cleavage Quantification
Protocol: Densitometric Measurements and Calculations
Band Detection and Background Subtraction:
- Use image analysis software (ImageJ, Image Lab, or Image Studio) to detect bands corresponding to full-length PARP-1 (116-kDa) and cleavage fragments (89-kDa, 24-kDa).
- Draw rectangular regions of interest (ROIs) of consistent size around each band.
- Measure background signal from adjacent areas immediately above and below each band and subtract from band intensity values.
Data Normalization:
- Normalize background-subtracted PARP-1 band intensities to housekeeping protein controls (β-actin, GAPDH, or Histone H3) from the same lane.
- Calculate normalized band intensity using the formula: Normalized Intensity = (PARP Band Intensity - Background) / (Housekeeping Protein Intensity - Background)
Cleavage Percentage Calculation:
- Determine the percentage of PARP-1 cleavage using the formula: Cleavage Percentage = [89-kDa Fragment / (116-kDa Full-length + 89-kDa Fragment)] × 100
- For the 24-kDa fragment, use the formula: 24-kDa Percentage = [24-kDa Fragment / (116-kDa Full-length + 24-kDa Fragment)] × 100
- Note that the 24-kDa fragment may be more challenging to detect due to potential retention in the nuclear fraction or lower antibody affinity.
Quantitative Data Presentation Standards
The following table summarizes the key parameters for quantitative presentation of PARP-1 cleavage data:
| Data Presentation Element | Standard Practice | Purpose |
|---|---|---|
| Representative Blots | Include full-length and cleavage fragments from at least 3 independent experiments | Demonstrate experimental reproducibility |
| Densitometric Data | Present as mean ± SEM from ≥3 biological replicates | Enable statistical analysis and group comparisons |
| Cleavage Percentage | Calculate as 89-kDa/(116-kDa + 89-kDa) × 100 | Standardized metric for cross-study comparisons |
| Statistical Analysis | ANOVA with post-hoc tests for multiple groups; t-test for two groups | Determine significance between experimental conditions |
| Housekeeping Controls | Include β-actin, GAPDH, or histone H3 on same blot | Control for loading and transfer variations |
| Molecular Weight Markers | Display on all blots for fragment size verification | Confirm identity of cleavage fragments |
Troubleshooting and Quality Control
Common Technical Challenges and Solutions
- Incomplete Cleavage Detection: If 89-kDa fragment is faint, optimize antibody concentration and increase protein loading. Verify caspase activation with parallel caspase-3 cleavage assays.
- High Background: Increase blocking time, optimize antibody concentrations, and extend wash times. Consider using BSA instead of milk for blocking.
- 24-kDa Fragment Not Detectable: This fragment may be less immunoreactive or retained in nuclear fractions. Try different commercial antibodies or prepare nuclear-enriched fractions.
- Non-Linear Signal Response: Perform dilution series of control samples to establish the linear range of detection for both full-length and fragment signals.
- Inconsistent Housekeeping Signals: Validate housekeeping protein stability under experimental conditions. Consider using multiple loading controls or total protein normalization.
Data Interpretation Considerations
When interpreting PARP-1 cleavage data in neuronal cells, consider that:
- PARP-1 cleavage is a definitive but not exclusive marker of apoptosis; correlate with other apoptotic markers (caspase activation, phosphatidylserine externalization) [10].
- The 89-kDa fragment may translocate to the cytoplasm under certain conditions, potentially affecting detection in whole cell lysates [11].
- Different PARP-1 fragments may have opposing biological functions—the 24-kDa fragment can be protective while the 89-kDa fragment may be cytotoxic in ischemic models [14].
- PARP-1 inhibition can shift cell death modalities; use pharmacological inhibitors (PJ34, ABT888) as experimental controls to distinguish PARP-1-dependent effects [11] [87].
Following these standardized protocols for densitometric analysis and data presentation will ensure robust, reproducible quantification of PARP-1 cleavage in neuronal cell research, facilitating accurate interpretation of cell death mechanisms and potential therapeutic interventions.
Conclusion
Mastering sample preparation for PARP-1 cleavage detection is paramount for accurately interpreting neuronal cell fate decisions in response to genotoxic stress, neurodegenerative triggers, or therapeutic compounds. This guide synthesizes the journey from understanding the foundational biology of PARP-1 as a sensor for multiple cell death pathways to implementing robust, reproducible methodological protocols. The future of this field lies in further elucidating the context-dependent roles of PARP-1 fragments, developing even more specific detection tools, and applying these techniques to complex 3D neuronal models and in vivo systems. For drug development, reliable PARP-1 cleavage detection remains a critical biomarker for assessing the efficacy and mechanism of action of novel neuroprotective agents and PARP inhibitors, bridging fundamental research with clinical translation.
References
- 1. cellular stress signaling through poly(ADP-ribose) and PARP-1 [https://genesdev.cshlp.org/content/26/5/417]
- 2. PARP-1, a determinant of cell survival in response to DNA ... [https://www.sciencedirect.com/science/article/pii/S0301472X03000833]
- 3. A Dual Role for Poly(ADP-Ribose) Polymerase-1 During ... [https://pmc.ncbi.nlm.nih.gov/articles/PMC3491962/]
- 4. Poly(ADP-ribose) polymerase-1 and its cleavage products ... [https://pmc.ncbi.nlm.nih.gov/articles/PMC4013233/]
- 5. PARP Antibody #9542 [https://www.cellsignal.com/products/primary-antibodies/parp-antibody/9542?srsltid=AfmBOopsBUeV5TLcnvTZRj2s8Jv_EN9Hexitc0Ykq2VSH8JvQ6du7kYt]
- 6. Anti-Cleaved PARP1 antibody (ab4830) [https://www.abcam.com/en-us/products/primary-antibodies/cleaved-parp1-antibody-ab4830]
- 7. Truncated PARP1 mediates ADP-ribosylation of RNA ... [https://www.nature.com/articles/s41421-021-00355-1]
- 8. Parp1 promotes sleep, which enhances DNA repair in ... [https://www.sciencedirect.com/science/article/pii/S1097276521009333]
- 9. pADP-ribosylation regulates the cytoplasmic localization, ... [https://pmc.ncbi.nlm.nih.gov/articles/PMC10972696/]
- 10. PARP-1 cleavage fragments: signatures of cell-death ... [https://biosignaling.biomedcentral.com/articles/10.1186/1478-811X-8-31]
- 11. The 89-kDa PARP1 cleavage fragment serves as a ... [https://pmc.ncbi.nlm.nih.gov/articles/PMC7948984/]
- 12. The 89-kDa PARP1 cleavage fragment serves as a ... - PubMed [https://pubmed.ncbi.nlm.nih.gov/33168626/]
- 13. Cleaved PARP1 antibody (60555-1-Ig) [https://www.ptglab.com/products/Cleaved-PARP1-Antibody-60555-1-Ig.htm?srsltid=AfmBOorsXOGsFh3vEv6zb6OcdoK6UJ3u0j4GGNG4o9XR08aO6WDI4vsG]
- 14. Poly(ADP-ribose) polymerase-1 and its cleavage products ... [https://www.sciencedirect.com/science/article/pii/S0167488913004242]
- 15. Human cleaved PARP1 (Gly215) ELISA Kit [https://www.abcam.com/en-us/products/elisa-kits/human-cleaved-parp1-gly215-elisa-kit-ab317545]
- 16. Human Cleaved-PARP (D214/G215) ELISA Kit [https://www.raybiotech.com/human-cleaved-parp-d214-g215-elisa-pte-parp-d214]
- 17. Poly (ADP-Ribose) polymerase 1 and parthanatos in neurological... [https://pubmed.ncbi.nlm.nih.gov/37783233/]
- 18. activation/expression modulates regional-specific PARP ... 1 neuronal [https://www.nature.com/articles/cddis2014331?error=cookies_not_supported&code=d6381b1d-5932-41b7-afb6-69f5d278f145]
- 19. Research progress on ferroptosis and PARP inhibitors in ... [https://pmc.ncbi.nlm.nih.gov/articles/PMC12058875/]
- 20. PARP inhibition promotes ferroptosis via repressing ... [https://www.sciencedirect.com/science/article/pii/S2213231721000768]
- 21. Emerging role of PARP-1 and PARthanatos in ischemic stroke [https://pmc.ncbi.nlm.nih.gov/articles/PMC9010225/]
- 22. PARP cleavage, DNA fragmentation, and pyknosis during excitotoxin-induced neuronal death - PubMed [https://pubmed.ncbi.nlm.nih.gov/14637106/]
- 23. Activation of PARP in secondary brain injury following ... [https://www.sciencedirect.com/science/article/pii/S2589238X24000731]
- 24. HTRF Human and Mouse PARP cleaved-Asp214 Detection Kit, 500 Assay Points | Revvity [https://www.revvity.com/product/htrf-parp-cleaved-asp214-kit-500-pts-64parpeg]
- 25. Potent EGFR/ PARP - 1 by spirooxindole-triazole hybrids for... inhibition [https://pubs.rsc.org/en/content/articlelanding/2025/ra/d4ra05966b]
- 26. Integrating diffusion models and molecular modeling for... [https://pubmed.ncbi.nlm.nih.gov/40801836/]
- 27. PARP1 activation/expression modulates regional-specific ... [https://pmc.ncbi.nlm.nih.gov/articles/PMC4454306/]
- 28. Comparing Efficiency of Lysis Buffer Solutions and Sample ... [https://pmc.ncbi.nlm.nih.gov/articles/PMC9181984/]
- 29. Poly(ADP-ribose) Polymerase 1 Deficiency Attenuates ... [https://pmc.ncbi.nlm.nih.gov/articles/PMC12424659/]
- 30. Poly(ADP-ribose) polymerase- 1 and its cleavage products differentially... [https://pubmed.ncbi.nlm.nih.gov/24333653/]
- 31. Selective targeting of genome amplifications and repeat ... [https://www.nature.com/articles/s41467-025-60160-2]
- 32. MicroRNA-193b-3p represses neuroblastoma growth... | Oncotarget cell [https://www.oncotarget.com/article/24793/text/]
- 33. Probing DNA damage in Rett syndrome neurons uncovers ... [https://www.sciencedirect.com/science/article/pii/S2213671125002498]
- 34. Induced pluripotent stem cells carrying novel APTX ... [https://www.nature.com/articles/s41420-025-02723-2]
- 35. Frontiers | Vesicular translocation of PARP - 1 to cytoplasm causes... [https://www.frontiersin.org/journals/cellular-neuroscience/articles/10.3389/fncel.2024.1363154/full]
- 36. On PAR with PARP: cellular stress signaling through poly ... [https://pmc.ncbi.nlm.nih.gov/articles/PMC3305980/]
- 37. Serine ADPr on histones and PARP1 is a cellular target of ... [https://www.nature.com/articles/s41589-025-01974-5]
- 38. The ubiquitin-dependent ATPase p97 removes cytotoxic ... [https://www.nature.com/articles/s41556-021-00807-6]
- 39. Protocol for quantifying PARP inhibitor-induced changes in ... [https://pmc.ncbi.nlm.nih.gov/articles/PMC12509909/]
- 40. The basi(c)s of PARP inhibitor efficacy and resistance [https://www.sciencedirect.com/science/article/pii/S0093775423000611]
- 41. Western Blot: The Complete Guide [https://www.antibodies.com/applications/western-blotting]
- 42. PARP-1 cleavage fragments: signatures of cell-death ... [https://pmc.ncbi.nlm.nih.gov/articles/PMC3022541/]
- 43. PARP1 activation/expression modulates regional-specific ... [https://www.nature.com/articles/cddis2014331]
- 44. Western Blot Sample Preparation Protocol [https://www.thermofisher.com/us/en/home/life-science/protein-biology/protein-biology-learning-center/protein-gel-electrophoresis-information/western-blot-protocols/western-blot-sample-preparation.html]
- 45. Western blot protocol [https://www.abcam.com/en-us/technical-resources/protocols/western-blot]
- 46. Western Blot [https://www.protocols.io/view/western-blot-g8grbztv7.html]
- 47. 2024 Guide to Quantitative Western Blot Publication [https://www.thermofisher.com/blog/life-in-the-lab/2023-guide-to-quantitative-western-blot-publication/]
- 48. PARP1 antibody (13371-1-AP) [https://www.ptglab.com/products/PARP1-Antibody-13371-1-AP.htm?srsltid=AfmBOootZdttpSAo6Jv5CzeAN9dj_9D3pe7MTqIs3GcKIahdB5nw-Dos]
- 49. Anti-Cleaved PARP1 antibody [E51] (ab32064) [https://www.abcam.com/en-us/products/primary-antibodies/cleaved-parp1-antibody-e51-ab32064]
- 50. Differential trapping of PARP1 and PARP2 by clinical PARP ... [https://pmc.ncbi.nlm.nih.gov/articles/PMC3528345/]
- 51. Identification of phosphorylation site on PARP mediating its cytosolic... 1 [https://pmc.ncbi.nlm.nih.gov/articles/PMC9640338/]
- 52. DNA damage response deficiency enhances ... [https://www.sciencedirect.com/science/article/pii/S2211124725003080]
- 53. DePARylation is critical for S phase progression and cell ... [https://elifesciences.org/reviewed-preprints/89303v3/pdf]
- 54. The Enigmatic Function of PARP1: From PARylation ... [https://www.mdpi.com/2073-4409/8/12/1625]
- 55. -dependent DNA-protein crosslink... | Nature Communications PARP 1 [https://www.nature.com/articles/s41467-024-50912-x?error=cookies_not_supported&code=cdc73849-07a9-49d4-b659-daa26f1552f3]
- 56. Characterization of the necrotic cleavage of poly(ADP- ... [https://www.nature.com/articles/4400851]
- 57. PARP1 antibody (13371-1-AP) [https://www.ptglab.com/products/PARP1-Antibody-13371-1-AP.htm?srsltid=AfmBOorn9-YTuRhOZy6_fUb97XbdvWKsTUH1lvZ1OnglfE8OQN6ZSHvA]
- 58. Anti-PARP1 Antibodies | Invitrogen [https://www.thermofisher.com/antibody/primary/target/parp1]
- 59. PHF20 collaborates with PARP to promote stemness and... 1 [https://pmc.ncbi.nlm.nih.gov/articles/PMC5951121/]
- 60. Reconciling specificity and non-specificity in antibody binding [https://pmc.ncbi.nlm.nih.gov/articles/PMC12443689/]
- 61. Immunohistochemistry Basics: Blocking Non-Specific ... [https://bitesizebio.com/13466/immunohistochemistry-basics-blocking-non-specific-staining/]
- 62. How to deal with high background in ELISA [https://www.abcam.com/en-us/technical-resources/troubleshooting/high-background-elisa]
- 63. PARP Inhibitors: Clinical Relevance, Mechanisms of Action ... [https://pmc.ncbi.nlm.nih.gov/articles/PMC7509090/]
- 64. Evaluation of a Low- Toxicity as a Neuroprotective... PARP Inhibitor [https://pubmed.ncbi.nlm.nih.gov/33788167/]
- 65. Anti-PARP1 (cleaved Asp214) Antibodies | Invitrogen [https://www.thermofisher.com/antibody/primary/target/parp1%20(cleaved%20asp214)]
- 66. Annexin V PI Staining Guide for Apoptosis Detection [https://www.bosterbio.com/blog/post/methods/flow-cytometry-with-annexin-v-pi-staining?srsltid=AfmBOopFeEV3hp8Q4-JmAd5dkXw5l2siQ6miNwQc6G6gRz-ykpifYTqk]
- 67. Poly (ADP-Ribose) Polymerase Inhibitor, ABT888 ... [https://pmc.ncbi.nlm.nih.gov/articles/PMC8301366/]
- 68. Annexin V and PI Staining for Apoptosis by Flow Cytometry [https://www.bio-techne.com/resources/protocols-troubleshooting/apoptosis-flow-annexin-v-protocol]
- 69. Cytoplasmic PARP1 links the genome instability to ... [https://www.sciencedirect.com/science/article/pii/S1097276522002908]
- 70. A rapid method for quantifying cytoplasmic versus nuclear ... [https://pmc.ncbi.nlm.nih.gov/articles/PMC5516235/]
- 71. Implementation of Validated Pharmacodynamic Assays in ... [https://pmc.ncbi.nlm.nih.gov/articles/PMC4096894/]
- 72. Nuclear Poly(ADP-ribose) Polymerase-1 Rapidly Triggers ... [https://www.sciencedirect.com/science/article/pii/S0021925820659002]
- 73. New Insights into the Significance of PARP-1 Activation [https://www.mdpi.com/2073-4409/10/3/599]
- 74. The deubiquitination-PARylation positive feedback loop of ... [https://www.nature.com/articles/s41388-025-03428-7]
- 75. Caspase-Glo® 3/7 Assay System [https://www.promega.com/products/cell-health-assays/apoptosis-assays/caspase_glo-3_7-assay-systems/]
- 76. PARP Antibody #9542 [https://www.cellsignal.com/products/primary-antibodies/parp-antibody/9542?srsltid=AfmBOoqhIikiqrupVjTjAuMnaMbDyIkWD6oN7WN8QozhIn40EQvQ6wz-]
- 77. A Novel Anticancer Agent, 8-Methoxypyrimido... | PLOS One [https://journals.plos.org/plosone/article?id=10.1371/journal.pone.0066430]
- 78. Caspase 3/7 Activity [https://www.protocols.io/view/caspase-3-7-activity-d66n9hde.html]
- 79. Apoptosis Assay (Caspase-3 Activation) [https://bio-protocol.org/exchange/minidetail?id=8446884&type=30]
- 80. PARP1 Antibody (194C1439): sc-56196 [https://www.scbt.com/p/cleaved-parp-1-antibody-194c1439?srsltid=AfmBOop82BI7c8UEIawC5JNgXCrVU-WcRyA3nzApcumth4v9uV-ac7Ga]
- 81. 5.2.6. PARP-1 Cleavage [https://bio-protocol.org/exchange/minidetail?id=17483286&type=30]
- 82. The identification of high-performing antibodies for FUS ... [https://f1000research.com/articles/12-376]
- 83. Characterization of the interactions of PARP-1 with UV- ... [https://www.nature.com/articles/srep19020]
- 84. Role of Calpain in Apoptosis - PMC - PubMed Central - NIH [https://pmc.ncbi.nlm.nih.gov/articles/PMC3584455/]
- 85. Calpain I Induces Cleavage and Release of Apoptosis ... [https://www.sciencedirect.com/science/article/pii/S0021925819627535]
- 86. Cleavage of the calpain inhibitor, calpastatin, during ... [https://www.nature.com/articles/4400424]
- 87. PARP-1 inhibition influences the oxidative stress response ... [https://www.sciencedirect.com/science/article/pii/S2213231716300222]
- 88. Differentiation-Associated Downregulation of Poly... | PLOS One [https://journals.plos.org/plosone/article?id=10.1371/journal.pone.0134227]