Annexin V Staining Flow Cytometry Protocol: A Complete Guide for Apoptosis Detection
This comprehensive guide provides researchers, scientists, and drug development professionals with a complete framework for planning, executing, and validating Annexin V staining experiments for apoptosis detection via flow cytometry.
Annexin V Staining Flow Cytometry Protocol: A Complete Guide for Apoptosis Detection
Abstract
This comprehensive guide provides researchers, scientists, and drug development professionals with a complete framework for planning, executing, and validating Annexin V staining experiments for apoptosis detection via flow cytometry. Covering foundational principles through advanced optimization, the article details the molecular basis of phosphatidylserine externalization, step-by-step protocols for various experimental setups, troubleshooting for common pitfalls like false positives, and validation strategies comparing different methodologies. By synthesizing current best practices and recent technical modifications, this resource enables accurate discrimination between viable, early apoptotic, and late apoptotic/necrotic cell populations, which is crucial for biomedical research and preclinical drug efficacy studies.
Understanding Apoptosis and the Molecular Basis of Annexin V Binding
The Biological Significance of Apoptosis in Research and Drug Development
Apoptosis, or programmed cell death, is a fundamental biological process critical for maintaining tissue homeostasis, ensuring proper development, and eliminating damaged or infected cells [1]. In biomedical research and drug development, the accurate detection and quantification of apoptosis is paramount. It serves as a key metric for evaluating the efficacy of chemotherapeutic agents, understanding immune system regulation, and developing treatments for diseases characterized by dysregulated cell death, such as cancer and neurodegenerative disorders [1]. Among the various techniques available for apoptosis detection, flow cytometry using Annexin V staining has emerged as a gold standard method due to its ability to identify early apoptotic events, its high sensitivity, and its compatibility with multi-parametric analysis [1] [2].
The biological significance of apoptosis is rooted in its highly regulated mechanism. Unlike necrotic cell death, which is chaotic and inflammatory, apoptosis is a controlled process characterized by specific biochemical events, including the externalization of the membrane phospholipid phosphatidylserine (PS) [3] [1]. During early apoptosis, PS, which is normally confined to the inner leaflet of the plasma membrane, is rapidly translocated to the outer leaflet, making it a specific "eat-me" signal for phagocytic cells [3] [4]. This loss of membrane asymmetry is a universal indicator of programmed cell death and forms the fundamental basis for the Annexin V staining protocol. Annexin V is a 35-36 kDa calcium-dependent phospholipid-binding protein with a high affinity for PS (Kd ≈ 5 x 10⁻¹⁰ M) [4]. When conjugated to a fluorochrome, it serves as a powerful probe for detecting cells in the early stages of apoptosis before membrane integrity is lost [3] [1].
The following diagram illustrates the fundamental morphological and biochemical changes a cell undergoes during apoptosis, highlighting the key stage detected by Annexin V binding:
Principle and Mechanism of Annexin V Staining
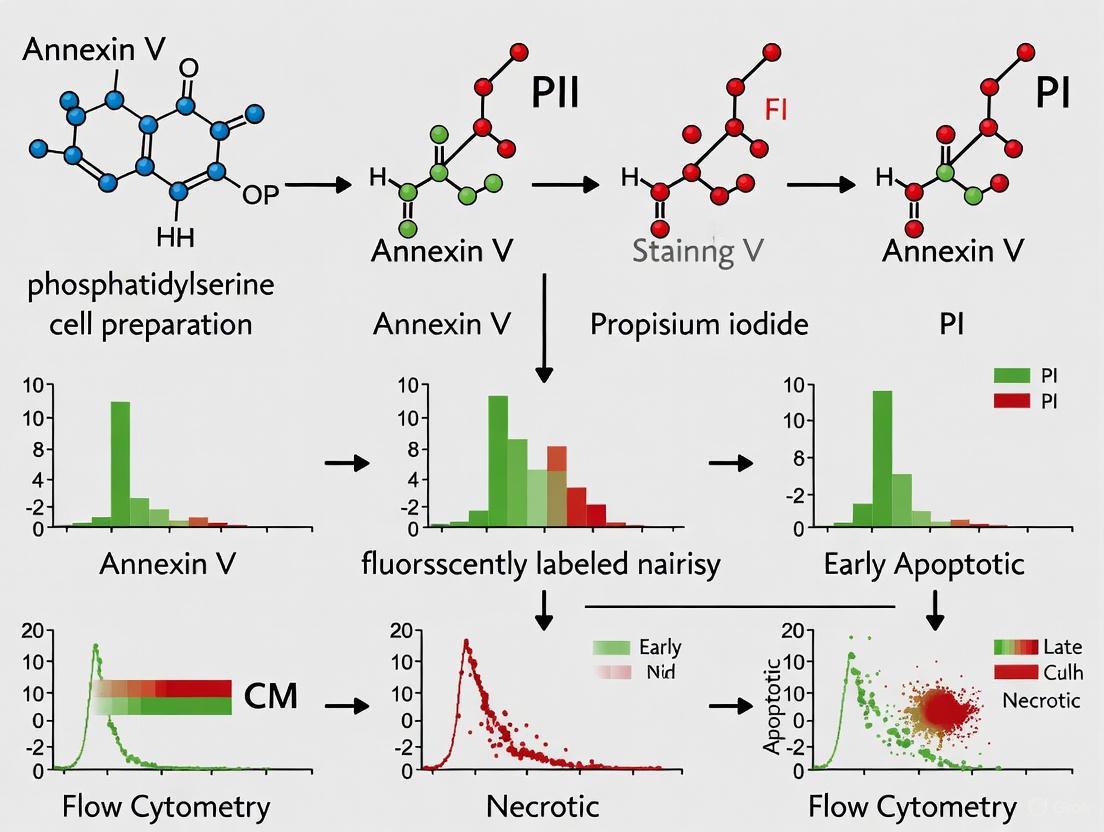
The Annexin V assay operates on a straightforward yet powerful principle: the calcium-dependent binding of Annexin V to phosphatidylserine (PS) exposed on the outer leaflet of the cell membrane during early apoptosis [3] [1]. This interaction is highly specific and reversible, requiring precise buffer conditions for optimal staining [5] [1]. To accurately distinguish between different stages of cell death, the Annexin V staining protocol is almost always performed in conjunction with a viability dye, such as propidium iodide (PI) or 7-AAD [5] [6] [1]. These dyes are excluded from viable and early apoptotic cells with intact membranes but can penetrate late apoptotic and necrotic cells, binding to nucleic acids and producing a strong fluorescent signal [1] [4].
This dual-staining strategy allows for the clear discrimination of four distinct cell populations when analyzed by flow cytometry. Viable cells are negative for both Annexin V and PI, indicating no PS exposure and an intact plasma membrane. Early apoptotic cells are positive for Annexin V but negative for PI, demonstrating PS externalization while maintaining membrane integrity. Late apoptotic cells are positive for both Annexin V and PI, as the loss of membrane integrity in later stages allows PI to enter the cell. Finally, necrotic cells are negative for Annexin V but positive for PI, representing cells that have died through an unprogrammed, traumatic pathway without PS flipping [7] [1]. The accuracy of this discrimination hinges on the calcium-dependent nature of Annexin V binding, making it critical to avoid buffers containing EDTA or other calcium chelators that would disrupt the interaction [5].
The table below summarizes the interpretation of cell populations based on Annexin V and viability dye staining:
| Cell Population | Annexin V Staining | Viability Dye (PI/7-AAD) | Biological Interpretation |
|---|---|---|---|
| Viable/Live | Negative | Negative | Healthy cells with no PS exposure and intact membranes. |
| Early Apoptotic | Positive | Negative | Cells undergoing programmed death with PS exposure but intact membranes. |
| Late Apoptotic | Positive | Positive | Cells in later stages of apoptosis with compromised membrane integrity. |
| Necrotic | Negative | Positive | Cells that have died via unprogrammed, traumatic pathways. |
Detailed Annexin V Staining Protocol for Flow Cytometry
This section provides a comprehensive, step-by-step methodology for detecting apoptosis using Annexin V staining in conjunction with a viability dye, optimized for flow cytometric analysis. The protocol is designed to be a reliable starting point that can be adapted for various cell types, whether in suspension or adherent culture [5] [6] [1].
Reagent and Solution Preparation
The foundation of a successful assay lies in proper reagent preparation. A critical component is the 1X Annexin V Binding Buffer. This buffer provides the necessary calcium ions for the Annexin V-PS interaction. It can be prepared by diluting a commercial 10X concentrate 1:9 with distilled water [5] [6]. If preparing from scratch, a standard recipe contains 0.1 M HEPES (pH 7.4), 1.4 M NaCl, and 25 mM CaCl₂ [6]. It is imperative that this buffer is free of EDTA, EGTA, or other calcium chelators. Other essential reagents include fluorochrome-conjugated Annexin V (e.g., FITC, PE, APC) and a viability dye solution, such as Propidium Iodide (PI) or 7-AAD [5] [6]. For researchers integrating surface or intracellular marker staining, Fixable Viability Dyes (FVDs) are recommended over PI/7-AAD, as they allow for cell fixation and permeabilization without losing the viability signal [5].
Step-by-Step Staining Procedure
- Cell Harvesting and Washing: Harvest approximately (1 \times 10^5) to (1 \times 10^6) cells per sample. For suspension cells, collect the entire culture, including floating cells, by centrifugation [3]. For adherent cells, it is crucial to gently detach the cells using a method like mild trypsinization (which should be halted with serum-containing media) and to combine these cells with any floating cells from the culture supernatant, as the latter may contain a enriched population of apoptotic cells [3] [1]. Wash the harvested cells once with cold 1X PBS to remove residual media and proteases [5] [6].
- Cell Resuspension: After washing, carefully decant the supernatant and resuspend the cell pellet in 1X Annexin V Binding Buffer at a density of (1-5 \times 10^6) cells/mL [5] [6].
- Annexin V Staining: Transfer 100 µL of the cell suspension (containing (1-5 \times 10^5) cells) to a flow cytometry tube. Add 5 µL of the fluorochrome-conjugated Annexin V reagent [5] [6]. Gently vortex the tube to mix and incubate for 10-15 minutes at room temperature, protected from light [5] [3].
- Viability Dye Addition: Following the incubation, add 2-5 µL of Propidium Iodide (PI) or 5 µL of 7-AAD directly to the cell suspension. Do not wash the cells after this step, as the viability dye must remain in the buffer during acquisition to identify cells with compromised membranes [5] [6].
- Sample Analysis: Add an additional 400 µL of 1X Annexin V Binding Buffer to the tubes to bring them to an appropriate volume for acquisition on the flow cytometer [6]. Analyze the samples as soon as possible, ideally within 1 hour, to maintain cell viability and staining integrity [5] [6] [3].
The workflow below outlines the key stages of the protocol from cell preparation to data analysis:
Essential Controls and Titration
Appropriate controls are non-negotiable for accurate data interpretation and instrument setup. For a basic Annexin V/PI assay, the following single-stain controls are required [6] [3]:
- Unstained cells: To assess cellular autofluorescence.
- Cells stained with Annexin V only: To set compensation and gate for Annexin V-positive cells.
- Cells stained with PI only: To set compensation and gate for PI-positive cells.
For a more rigorous experiment, an Annexin V blocking control can be performed by pre-incubating cells with an excess of unconjugated Annexin V to saturate all PS binding sites, followed by staining with the conjugated Annexin V. A significant reduction in signal confirms the specificity of the binding [6]. Furthermore, including a well-established positive control, such as cells treated with a known apoptosis-inducing agent like Staurosporine or Camptothecin, is highly recommended to validate the entire staining procedure [3].
Antibody Titration: The optimal concentration of Annexin V can vary depending on the cell type and the specific reagent lot. Using too much can lead to high background, while too little can result in a weak signal. It is good practice to perform a titration assay using both healthy and induced-apoptotic cells to determine the concentration that provides the maximum separation between positive and negative populations with the lowest non-specific binding [3].
Data Analysis, Interpretation, and Troubleshooting
Gating Strategy and Population Quantification
Once data is acquired on the flow cytometer, a systematic gating strategy is applied. After excluding debris based on forward and side scatter properties, cells are plotted on a two-dimensional dot plot with Annexin V fluorescence on one axis (e.g., FITC) and viability dye fluorescence (e.g., PI) on the other [1]. The quadrants are set based on the single-stained and unstained controls [6]. The resulting four quadrants directly correspond to the cell populations described in Section 2. The percentage of cells in each quadrant is then calculated, providing a quantitative measure of cell health and death within the population. The baseline apoptosis in untreated control samples should always be subtracted from the values obtained in treated samples to determine the induced apoptotic effect [6].
Common Pitfalls and Troubleshooting Guide
Despite its relative simplicity, several factors can compromise the quality of Annexin V staining. The table below outlines common issues, their potential causes, and recommended solutions.
| Problem | Potential Cause | Recommended Solution |
|---|---|---|
| High Background/False Positives | Rough cell handling creating membrane holes [3].Calcium chelators (EDTA) in buffers [5].Over-trypsinization of adherent cells [1]. | Harvest cells gently and quickly [3].Ensure binding buffer and wash buffers are calcium-rich and EDTA-free [5].Use gentle detachment methods and wash with serum [1]. |
| Weak Annexin V Signal | Insufficient Annexin V concentration [4].Expired or improperly stored reagents. | Titrate the Annexin V reagent for optimal concentration [3] [4].Use fresh reagents and prepare buffers fresh. |
| Low Viability in Control Sample | Extended analysis time.Prolonged exposure to PI/7-AAD. | Analyze samples immediately (within 1 hour of staining) [5] [3].Keep samples on ice and protected from light until acquisition. |
| Inconsistent Staining Between Samples | Inconsistent cell numbers or buffer volumes.Inadequate mixing after reagent addition. | Use consistent cell counts per sample.Vortex samples gently but thoroughly after each reagent addition. |
Advanced Applications and Integration with Multiparametric Flow Cytometry
The basic Annexin V assay is highly adaptable and can be integrated into more complex, multicolor flow cytometry panels to gain deeper biological insights. This allows researchers to not only identify apoptotic cells but also to determine which specific cell types within a heterogeneous population are undergoing cell death, or to correlate apoptosis with other functional markers.
A common application is combining Annexin V staining with cell surface immunophenotyping. In this case, cell surface antigens are stained with conjugated antibodies first, following standard surface staining protocols. The cells are then washed and proceed to the Annexin V and viability dye staining steps as described in Section 3.2 [5]. It is critical to use azide-free and serum/protein-free PBS during these washes to prevent inhibition of the calcium-dependent Annexin V binding [5].
For investigating intracellular signaling events that precede or accompany apoptosis, such as caspase activation or cytochrome c release, Annexin V can be combined with intracellular staining. The recommended workflow involves first staining for cell surface markers, then performing the Annexin V staining (since it requires live, unfixed cells), and finally fixing and permeabilizing the cells for intracellular antibody staining [5]. When designing these complex panels, careful fluorochrome selection is crucial. The principles of multicolor panel design dictate that brighter fluorophores (like PE or APC) should be assigned to markers with low expression levels, while dimmer fluorophores can be used for highly expressed antigens like Annexin V [8]. This ensures clear population resolution.
The Scientist's Toolkit: Key Reagent Solutions
Successful execution of the Annexin V assay relies on a set of core reagents, each with a specific function.
| Reagent/Tool | Function/Description | Example Products/Catalog Numbers |
|---|---|---|
| Annexin V Conjugate | Calcium-dependent protein that binds exposed PS on apoptotic cells. Available conjugated to various fluorochromes (FITC, PE, APC, etc.). | Annexin V-FITC [6], Annexin V-PE [6], Annexin V-APC [5] |
| Viability Dye | Nucleic acid stain that distinguishes cells with compromised membranes. Essential for differentiating early and late apoptosis. | Propidium Iodide (PI) [6], 7-AAD (Via-Probe) [6] |
| Fixable Viability Dye (FVD) | amine-reactive dyes that covalently bind to intracellular proteins, allowing fixation/permeabilization without signal loss. Used for intracellular staining panels. | FVD eFluor 506, 660, or 780 [5] |
| Binding Buffer (10X/1X) | Provides the optimal calcium-rich, EDTA-free environment essential for Annexin V-PS interaction. | 10X Binding Buffer [5] [6] |
| Compensation Controls | Single-stained cells or beads used to correct for spectral overlap between fluorochromes on the flow cytometer. | Unstained, Annexin V-only, and Viability Dye-only cells [6] [3] |
| Positive Control Reagent | Chemical inducer of apoptosis used to validate the staining protocol and generate a positive control population. | Staurosporine [3], Camptothecin [3] |
Annexin V staining by flow cytometry remains an indispensable tool in the life scientist's arsenal, providing a robust, quantitative, and early measure of apoptotic cell death. Its significance in research and drug development is underscored by its ability to bridge fundamental biological discovery with applied therapeutic assessment. By understanding the core principles, adhering to a detailed and careful protocol, and integrating the method with advanced multiparametric approaches, researchers can continue to unlock critical insights into cell fate decisions, disease mechanisms, and the action of novel pharmacological agents.
In the realm of programmed cell death, the translocation of phosphatidylserine (PS) from the inner to the outer leaflet of the plasma membrane serves as a fundamental molecular event marking the early stages of apoptosis [9]. This loss of membrane asymmetry represents one of the earliest detectable features of apoptotic cell death, occurring before other morphological changes such as cell shrinkage and nuclear fragmentation [9]. The discovery that PS externalization is a general feature of apoptosis regardless of the initiating stimulus has established it as a cornerstone biomarker for identifying and quantifying apoptotic cells in diverse experimental systems [9]. Within the context of a broader thesis on Annexin V staining flow cytometry protocols, this application note examines the scientific principles, methodological approaches, and practical considerations for detecting PS externalization, providing researchers with a comprehensive framework for apoptosis analysis.
The Molecular Basis of Phosphatidylserine Externalization
Membrane Asymmetry and Its Collapse in Apoptosis
In viable, healthy cells, membrane phospholipids are distributed asymmetrically across the plasma membrane bilayer. The aminophospholipid phosphatidylserine is predominantly restricted to the inner (cytoplasmic) leaflet through the action of ATP-dependent translocases [10]. This strategic localization sequesters PS from the external environment, where its presence could serve as an recognition signal for phagocytic cells. During the early phases of apoptosis, this carefully maintained asymmetry collapses due to coordinated inactivation of translocases and activation of scramblases, resulting in the rapid exposure of PS on the cell surface [1]. This externalized PS functions as an "eat-me" signal, facilitating the recognition and clearance of apoptotic cells by macrophages without inducing inflammatory responses [11].
PS Externalization as a Universal Apoptotic Indicator
Research has demonstrated that PS externalization constitutes an early and widespread event during apoptosis across diverse murine and human cell types, irrespective of the initiating stimulus [9]. This phenomenon precedes other characteristic events associated with apoptotic cell death, including DNA fragmentation and loss of membrane integrity [9]. Importantly, under conditions that prevent the morphological features of apoptosis—such as macromolecular synthesis inhibition, or overexpression of anti-apoptotic proteins Bcl-2 and Abl—the appearance of PS on the external leaflet of the plasma membrane is similarly prevented [9]. These findings support the model that activation of an inside-outside PS translocase represents a conserved early event in the apoptotic pathway, making it an exceptionally robust marker for apoptosis detection.
Annexin V Binding Principle and Detection Methodology
Annexin V: A Calcium-Dependent PS-Binding Protein
Annexin V is a 35-36 kDa human vascular anticoagulant protein that binds with high affinity to phosphatidylserine in a calcium-dependent manner [11]. This specific binding property forms the basis for its application in apoptosis detection, as fluorescently conjugated Annexin V can selectively label cells that have externalized PS on their surface [1]. The interaction between Annexin V and PS requires calcium ions, making the inclusion of calcium in binding buffers an absolute necessity for successful staining [5]. The difference in fluorescence intensity between apoptotic and non-apoptotic cells stained with fluorescent Annexin V conjugates, as measured by flow cytometry, is typically approximately 100-fold, providing excellent signal-to-noise resolution [11].
Quantitative Analysis of Annexin V-Membrane Interactions
Advanced studies of Annexin V-membrane interactions have revealed that the binding characteristics follow a mathematical relationship dependent on both calcium concentration and protein concentration [12]. Quantitative analysis indicates that Annexin V-membrane binding may involve sequential multiple steps, providing researchers with a framework for optimizing detection conditions [12]. This quantitative understanding enables more precise standardization of Annexin V-based apoptosis assays across different experimental systems and laboratory settings.
Comprehensive Annexin V Staining Protocol for Flow Cytometry
Reagent Preparation and Cell Handling
Essential Reagents:
- Annexin V Binding Buffer (1X): 0.1 M HEPES (pH 7.4), 1.4 M NaCl, 25 mM CaCl₂ [6]. Note: Avoid buffers containing EDTA or other calcium chelators as they interfere with Annexin V binding [5].
- Annexin V Conjugate: Fluorochrome-labeled Annexin V (FITC, PE, APC, or other conjugates).
- Viability Dye: Propidium iodide (PI), 7-AAD, or fixable viability dyes.
- PBS Buffer (pH 7.4): 8 g NaCl, 0.2 g KCl, 1.44 g Na₂HPO₄, 0.24 g KH₂PO₄ per liter of distilled water [7].
Cell Preparation Considerations: For suspension cells, collect all media and cells, wash with cold PBS, and centrifuge at 300-500 × g for 5 minutes [10]. For adherent cells, first collect the media containing floating (often apoptotic) cells, then gently detach remaining adherent cells using non-enzymatic methods or mild trypsinization to preserve membrane integrity [1] [3]. Combine both fractions to obtain a representative population of all cells. Wash cells twice with cold PBS to remove residual media and serum proteins that might interfere with staining [7]. Resuspend cells in 1X Binding Buffer at a concentration of 1-5 × 10⁶ cells/mL [5].
Table 1: Research Reagent Solutions for Annexin V Staining
| Reagent | Composition/Type | Function in Assay |
|---|---|---|
| Annexin V Conjugate | Fluorochrome-labeled Annexin V (FITC, PE, APC, etc.) | Binds externalized phosphatidylserine on apoptotic cells |
| Binding Buffer | 10 mM HEPES, 140 mM NaCl, 2.5 mM CaCl₂, pH 7.4 | Provides calcium-dependent binding environment |
| Viability Dye | Propidium iodide, 7-AAD, or fixable viability dyes | Identifies cells with compromised membrane integrity |
| Wash Buffer | PBS, pH 7.4 | Removes residual media/serum without calcium chelation |
Staining Procedure and Flow Cytometric Analysis
- Staining Setup: Transfer 100 μL of cell suspension (containing 1-5 × 10⁵ cells) to a 5 mL flow cytometry tube [6] [5].
- Annexin V Incubation: Add 5 μL of fluorochrome-conjugated Annexin V to each tube. Gently vortex or tap the tube to mix [5] [11].
- Incubation Conditions: Incubate at room temperature for 10-15 minutes in the dark [5]. Note that incubation times may vary from 5-15 minutes depending on the specific protocol and cell type [1] [3].
- Viability Stain Addition: Add 5 μL of propidium iodide (typically 50 μg/mL stock) or other viability dye without washing [10]. For 7-AAD, add 5 μL per test [6].
- Final Preparation: Add 400 μL of 1X Binding Buffer to each tube [6]. Keep samples on ice and protect from light.
- Flow Cytometry Analysis: Analyze samples by flow cytometry as soon as possible (within 1 hour) to maintain optimal staining quality and cell viability [6] [3].
Essential Controls and Experimental Design
Proper experimental controls are critical for accurate interpretation of Annexin V staining results:
- Unstained Cells: For setting flow cytometer baseline and background fluorescence [6] [10].
- Single-Stained Controls: Cells stained with Annexin V only (no viability dye) and viability dye only (no Annexin V) for compensation settings [6] [7].
- Annexin V Blocking Control: Pre-incubation with unconjugated Annexin V to saturate binding sites, followed by stained Annexin V to demonstrate staining specificity [6].
- Positive Control: Cells treated with apoptosis inducers (e.g., staurosporine, camptothecin) to validate the staining protocol [3] [10].
- Negative Control: Untreated healthy cells to establish baseline staining and identify basal apoptosis levels [6].
Table 2: Quantitative Analysis of Annexin V Binding Parameters
| Parameter | Optimal Range | Impact on Staining |
|---|---|---|
| Calcium Concentration | 2.5 mM in binding buffer | Critical for Annexin V-PS binding; chelators inhibit |
| Incubation Time | 5-15 minutes | Cell-type dependent; optimize for specific systems |
| Cell Concentration | 1-5 × 10⁶ cells/mL | Too high causes aggregation; too low reduces data quality |
| Analysis Window | Within 1 hour post-staining | Prolonged incubation affects viability and staining |
| Temperature | Room temperature | Consistent temperature improves reproducibility |
Data Interpretation and Analysis
Flow Cytometry Gating Strategies and Population Discrimination
When analyzing Annexin V staining results in flow cytometry, cells are typically displayed in a two-dimensional dot plot with Annexin V fluorescence on one axis and viability dye (e.g., PI) fluorescence on the other [10]. This approach enables clear discrimination of four distinct populations:
- Viable Cells (Annexin V−/PI−): Located in the lower left quadrant, these cells exhibit no PS externalization and maintain membrane integrity [7] [10].
- Early Apoptotic Cells (Annexin V+/PI−): Located in the lower right quadrant, these cells display PS externalization while maintaining membrane integrity, representing the population undergoing early apoptosis [1] [10].
- Late Apoptotic/Necrotic Cells (Annexin V+/PI+): Located in the upper right quadrant, these cells show both PS externalization and loss of membrane integrity, indicative of late-stage apoptosis or secondary necrosis [7] [10].
- Necrotic Cells (Annexin V−/PI+): Located in the upper left quadrant, these cells have lost membrane integrity without significant PS externalization, typically representing primary necrotic cells [10].
Troubleshooting Common Technical Issues
Several technical challenges may arise during Annexin V staining experiments:
- Weak Fluorescence Signal: May result from insufficient Annexin V concentration, expired reagents, or incorrect calcium concentration in binding buffer [1]. Ensure proper storage of reagents and prepare fresh buffers.
- High Background Staining: Often caused by inadequate washing, non-specific binding, or excessive cell death during processing [1]. Optimize washing steps and handle cells gently throughout the procedure.
- False Positive Staining: Can occur when compromised plasma membranes allow Annexin V to access PS on the inner membrane leaflet [11]. Always include viability dyes and handle cells gently to minimize mechanical damage.
- Cell Aggregation: May result from high cell concentration or excessive centrifugation force. Gently pipette to create single-cell suspension and optimize cell concentration [10].
Advanced Applications and Multiparametric Analysis
Integration with Additional Cellular Markers
The Annexin V staining protocol can be extended to incorporate analysis of additional cellular parameters, enabling more comprehensive characterization of apoptotic pathways:
- Surface Marker Analysis: Combine Annexin V staining with fluorochrome-conjugated antibodies against cell surface antigens to investigate apoptosis in specific cell subpopulations [5] [13].
- Intracellular Staining: Following Annexin V staining and fixation, intracellular targets such as activated caspases or other signaling molecules can be detected, providing insights into apoptotic mechanisms [5].
- Multiplexed Apoptosis Assessment: Simultaneously evaluate multiple aspects of apoptosis, such as combining Annexin V with mitochondrial membrane potential dyes (e.g., MitoTracker Red) or metabolic activity markers (e.g., C12-resazurin) [11].
Quantitative Tracking of Protein Expression During Apoptosis
Advanced applications of Annexin V staining enable quantitative analysis of protein expression changes within defined apoptotic subpopulations [13]. For example, researchers can track the downregulation of specific surface receptors (e.g., CD44 in MDA-MB-231 breast cancer cells) from viable to apoptotic cells following treatment with chemotherapeutic agents [13]. This multiparametric approach provides key insights into signaling regulation and the mechanisms underlying apoptotic responses to cytotoxic treatments, offering significant potential for elucidating therapeutic resistance across various cellular models.
Phosphatidylserine externalization represents one of the most reliable and early hallmarks of apoptotic cell death, providing researchers with a robust biomarker for detecting and quantifying apoptosis. The Annexin V staining protocol offers a sensitive, specific, and quantitative method for analyzing this key event, with flow cytometry enabling high-throughput multiparametric analysis of heterogeneous cell populations. When properly optimized and controlled, this technique delivers invaluable insights into cellular responses to various stimuli, playing an essential role in basic research, drug discovery, and therapeutic development. By following the comprehensive guidelines presented in this application note, researchers can implement this powerful methodology to advance their investigations into the mechanisms and regulation of programmed cell death.
Annexin V is a 35-36 kDa calcium-dependent phospholipid-binding protein with a high affinity for phosphatidylserine (PS), a membrane phospholipid normally confined to the inner leaflet of the plasma membrane in viable cells [3] [1]. During the early stages of apoptosis, cells lose membrane asymmetry and expose PS on their outer surface [1]. This externalization of PS represents one of the earliest indicators of programmed cell death and serves as a recognizable "eat-me" signal for phagocytes [4]. The strong, specific binding of Annexin V to exposed PS, with a dissociation constant (Kd) of approximately 5 × 10⁻¹⁰ M, makes it an excellent probe for detecting apoptotic cells [4]. This binding is reversible and strictly dependent on calcium ions, requiring precise buffer conditions for optimal performance [5] [1].
Flow cytometry techniques utilizing Annexin V staining, particularly when combined with viability dyes such as propidium iodide (PI), provide a robust method for the quantitative analysis of apoptosis induction and the discrimination of different cell death stages [13] [7] [14]. This approach enables researchers to differentiate between viable (Annexin V⁻/PI⁻), early apoptotic (Annexin V⁺/PI⁻), and late apoptotic or necrotic cells (Annexin V⁺/PI⁺) within a heterogeneous population [15] [14]. The versatility of Annexin V conjugates, available with various fluorochromes, allows for integration into multiparametric flow cytometry panels, enabling the simultaneous tracking of protein expression changes and other cellular parameters in defined subpopulations during apoptosis [13] [14].
Scientific Principles and Binding Mechanism
Molecular Basis of Phosphatidylserine Recognition
The interaction between Annexin V and phosphatidylserine is fundamentally dependent on calcium ion coordination. Annexin V contains a conserved structural motif that binds calcium ions, which subsequently bridge the protein to the phosphoserine head group of phosphatidylserine [12]. This specific binding mechanism requires the presence of calcium concentrations typically around 2.5 mM, as provided in standard binding buffers [15]. The mathematical relationship describing the Annexin V-membrane interaction demonstrates that membrane-bound Annexin V concentration (B) depends on both calcium concentration ([C]) and protein concentration ([P]), following a characteristic binding curve that may involve sequential multiple steps [12].
During apoptosis, the loss of phospholipid asymmetry results from the coordinated inactivation of flippases (which transport PS inward) and activation of scramblases (which promote bidirectional movement of phospholipids) [1]. This translocation event exposes PS on the outer leaflet within hours of apoptosis induction, preceding other morphological changes such as membrane blebbing and nuclear fragmentation [1]. The exposed PS creates specific binding sites for Annexin V, while the membrane integrity of early apoptotic cells remains sufficient to exclude viability dyes like propidium iodide [14]. This temporal sequence of events enables the distinction between early and late apoptotic stages through dual staining approaches.
Key Differences from Alternative Apoptosis Assays
Compared to other apoptosis detection methods, Annexin V binding offers distinct advantages and limitations. While TUNEL assays detect DNA fragmentation occurring later in apoptosis, and caspase activity measurements target enzymatic events in the apoptotic cascade, Annexin V staining identifies the earliest detectable phase of programmed cell death through PS externalization [1]. Unlike Western blotting or ELISA, which require cell lysis and represent endpoint measurements, Annexin V staining permits real-time, live-cell analysis of apoptosis progression [1]. However, the Annexin V assay cannot distinguish between apoptosis and other forms of PS-exposing cell death, such as necroptosis, and does not provide information on upstream apoptotic pathway activation [1].
Comprehensive Experimental Protocols
Basic Annexin V Staining Protocol for Flow Cytometry
The following protocol is adapted from standardized methodologies and is suitable for most cell types, with adjustments potentially needed for specific experimental systems [5] [3] [15].
Materials Required:
- 12 × 75 mm round-bottom tubes
- 1X PBS (cold)
- Annexin V conjugate (FITC, PE, APC, or other fluorochromes)
- 10X binding buffer (typically 10 mM HEPES pH 7.4, 140 mM NaCl, 2.5 mM CaCl₂)
- Propidium iodide (PI) staining solution or 7-AAD
- Flow cytometer with appropriate laser and filter sets
Procedure:
- Prepare 1X binding buffer by diluting 10X binding buffer 1:10 with distilled water [5].
- Harvest cells gently to preserve membrane integrity. For adherent cells, collect both supernatant (containing floating cells) and gently trypsinized adherent cells, combining them for analysis [3] [7].
- Wash cells once with cold 1X PBS, then once with 1X binding buffer, centrifuging at 400-600 × g for 5 minutes at room temperature after each wash [5].
- Resuspend cells in 1X binding buffer at a concentration of 1-5 × 10⁶ cells/mL [5].
- Add fluorochrome-conjugated Annexin V (typically 5 μL per 100 μL of cell suspension) and mix gently [5] [15].
- Incubate for 10-15 minutes at room temperature, protected from light [5].
- Add 2 mL of 1X binding buffer and centrifuge at 400-600 × g for 5 minutes. Discard supernatant [5].
- Resuspend cells in 200 μL of 1X binding buffer [5].
- Add 5 μL of PI staining solution and incubate for 5-15 minutes on ice or at room temperature [5]. Do not wash after this step.
- Analyze by flow cytometry within 1 hour for optimal results [15].
Critical Considerations:
- Maintain calcium concentration (2.5 mM) and avoid EDTA-containing buffers that chelate calcium [5].
- Include appropriate controls: unstained cells, Annexin V only, PI only, and positive control (apoptotic cells induced with staurosporine or camptothecin) [3] [15].
- Process samples quickly and maintain cells at 4°C to prevent progression of apoptosis after harvesting [3].
- Titrate Annexin V concentration for new cell types to optimize signal-to-noise ratio [3].
Annexin V Staining with Fixable Viability Dyes
For experiments requiring subsequent intracellular staining or fixed cell preservation, fixable viability dyes (FVD) offer advantages over PI [5].
Additional Materials:
- Fixable Viability Dye (e.g., eFluor 660, eFluor 506, or eFluor 780 - note: eFluor 450 is not recommended)
- Flow Cytometry Staining Buffer
- Azide- and serum/protein-free PBS
Modified Procedure:
- Wash cells twice in azide-free and serum/protein-free PBS [5].
- Resuspend cells at 1-10 × 10⁶ cells/mL in azide-free and serum/protein-free PBS [5].
- Add FVD (1 μL per 1 mL of cells), vortex immediately, and incubate for 30 minutes at 2-8°C, protected from light [5].
- Wash cells twice with Flow Cytometry Staining Buffer or equivalent [5].
- Wash cells once with 1X binding buffer [5].
- Continue with basic protocol from step 4 onward [5].
Integrated Multiparametric Analysis Protocol
Recent advancements enable comprehensive analysis of apoptosis alongside other cellular parameters. The following integrated protocol allows simultaneous assessment of proliferation, cell cycle, apoptosis, and mitochondrial membrane potential from a single sample [14].
Materials Expansion:
- Bromodeoxyuridine (BrdU) or CellTrace Violet
- JC-1 dye (for mitochondrial membrane potential)
- Intracellular staining buffers
- Fluorochrome-conjugated antibodies for surface or intracellular markers
Integrated Workflow:
- Pulse cells with BrdU or stain with CellTrace Violet according to standard protocols [14].
- Induce apoptosis using experimental treatment.
- Harvest cells gently as described in basic protocol.
- Stain surface antigens first using appropriate antibodies in staining buffer [5].
- Wash cells and proceed with fixable viability dye staining as described in section 3.2 [5].
- Perform Annexin V staining as in basic protocol, but omit PI [14].
- Fix and permeabilize cells using Foxp3/Transcription Factor Staining Buffer Set or Intracellular Fixation & Permeabilization Buffer Set [5].
- Perform intracellular staining for BrdU, cell cycle markers, or other intracellular targets [14].
- Analyze by flow cytometry using appropriate compensation controls for multiple fluorochromes [13].
This multiparametric approach enables the correlative assessment of apoptosis with functional cellular states, providing insights into mechanistic relationships between treatment effects and cell death pathways [14].
Quantitative Data and Binding Characteristics
Mathematical Modeling of Annexin V-Membrane Interaction
Quantitative analysis of Annexin V binding to membrane-associated phosphatidylserine reveals a complex binding relationship dependent on calcium and protein concentrations [12]. Mathematical modeling of this interaction demonstrates that the relative concentration of membrane-bound Annexin V (B) follows characteristic curves when plotted against calcium concentration ([C]) or protein concentration ([P]) [12]. Specifically, when protein concentration is fixed, the relationship between B and [C] exhibits a sigmoidal pattern, indicating cooperative binding behavior potentially involving sequential multiple steps [12]. Similarly, when calcium concentration is fixed, the relationship between B and [P] follows a saturable binding curve consistent with specific receptor-ligand interactions [12].
These mathematical relationships have practical implications for experimental design, as they guide the optimization of calcium concentrations and Annexin V reagent amounts for different cell types and experimental conditions [12]. The quantitative framework also strengthens the interpretation of interaction data, allowing for more precise comparisons between experimental treatments and conditions [12].
Quantitative Analysis of Cellular Apoptosis
The standard Annexin V/PI assay enables quantification of apoptosis induction across experimental conditions. The table below summarizes typical population distributions observed in untreated and apoptosis-induced cells:
Table 1: Quantitative Distribution of Cell Populations in Annexin V/PI Assay
| Cell Population | Annexin V Staining | PI Staining | Untreated Cells (%) | Apoptosis-Induced Cells (%) | Biological Interpretation |
|---|---|---|---|---|---|
| Viable | Negative | Negative | 85-95% | 30-60% | Healthy, non-apoptotic cells |
| Early Apoptotic | Positive | Negative | 2-5% | 20-40% | Early-stage apoptosis |
| Late Apoptotic | Positive | Positive | 1-3% | 10-30% | Late apoptosis/necrosis |
| Necrotic | Negative | Positive | 1-5% | 1-10% | Primary necrosis |
Data compiled from multiple sources [7] [15] [14]
The quantitative distribution between these populations provides a dynamic snapshot of cell death progression, with treatments typically increasing the percentage of early and late apoptotic cells in a time- and dose-dependent manner [14]. When combined with additional parameters such as mitochondrial membrane potential (measured using JC-1 dye) and cell cycle status (assessed by BrdU/PI staining), this approach enables comprehensive profiling of cellular responses to experimental treatments [14].
Essential Research Reagents and Tools
The Scientist's Toolkit: Core Reagent Solutions
Successful implementation of Annexin V staining protocols requires specific reagents optimized for apoptosis detection. The following table details essential materials and their functions:
Table 2: Essential Research Reagents for Annexin V Staining
| Reagent | Composition/Type | Function in Assay | Critical Considerations |
|---|---|---|---|
| Annexin V Conjugate | Fluorochrome-conjugated (FITC, PE, APC, etc.) | Binds externalized PS on apoptotic cells | Calcium-dependent binding; requires titration for new cell types [3] |
| Binding Buffer | 10 mM HEPES pH 7.4, 140 mM NaCl, 2.5 mM CaCl₂ | Provides optimal calcium concentration and pH | Must be calcium-rich and free of EDTA/chelators [5] |
| Viability Dyes | Propidium iodide, 7-AAD, or Fixable Viability Dyes | Identifies membrane-compromised cells | PI/7-AAD cannot be washed out; FVD compatible with fixation [5] |
| Positive Control Inducers | Staurosporine, Camptothecin | Generates apoptotic cells for assay validation | Typically induce 40-70% apoptosis in 4-6 hours [3] |
| Staining Buffer | PBS with protein carrier (e.g., BSA) | Maintains cell viability during processing | Should be azide-free when using viability dyes [5] |
| Fixation/Permeabilization Buffers | Formaldehyde, methanol, or commercial buffer sets | Enables intracellular staining with Annexin V | Must preserve Annexin V binding if applied post-staining [5] |
Selection Guide for Fluorochrome Conjugates
The choice of Annexin V conjugate depends on experimental design, available laser lines, and detector configuration on the flow cytometer. FITC conjugates are most common and suitable for single-apoptosis assays, while brighter fluorochromes like PE or APC are preferable for multicolor panels [5]. PerCP-eFluor 710 conjugates typically do not include viability dyes, requiring combination with fixable viability dyes such as eFluor 660, eFluor 506, or eFluor 780 [5]. Critical compatibility notes include avoiding eFluor 450 with Annexin V Apoptosis Detection Kits due to potential spectral overlap or interference issues [5].
Applications in Biomedical Research
Drug Discovery and Development
Annexin V staining serves as a fundamental tool in preclinical drug evaluation, particularly in oncology for assessing chemotherapeutic efficacy and mechanism of action [13] [1]. The protocol enables quantitative assessment of apoptosis induction in response to candidate compounds, providing critical data on potency and time course of cell death activation [13]. When combined with surface or intracellular markers, this approach can identify cell type-specific responses and track protein expression changes associated with treatment, as demonstrated in studies of doxorubicin-treated MDA-MB-231 breast cancer cells monitoring CD44 expression dynamics [13].
The multiparametric capabilities of modern Annexin V protocols facilitate comprehensive profiling of drug effects beyond simple viability assessment, revealing connections between cell cycle arrest, mitochondrial dysfunction, and apoptosis initiation [14]. For instance, the integrated workflow described in section 3.3 can distinguish whether reduced cell numbers result from decreased proliferation or increased cell death, and further elucidate the underlying mechanisms such as cell cycle arrest or mitochondrial depolarization [14].
Immunological Research and Beyond
In immunology, Annexin V staining is widely employed to study activation-induced cell death in T lymphocytes and other immune cells [1]. The assay detects apoptosis resulting from immune activation, tolerance induction, or cytokine withdrawal, providing insights into immune regulation and homeostasis [1]. Additional applications include toxicology screening, stem cell research, and developmental biology, where precise quantification of cell death patterns is essential for understanding normal and pathological processes [1].
The compatibility of Annexin V staining with high-throughput flow cytometry makes it suitable for screening applications in drug discovery and functional genomics, allowing rapid assessment of apoptosis induction across multiple experimental conditions [1]. Furthermore, the adaptability of the protocol for different sample types, including primary cells, tissue isolates, and cell lines, enhances its utility across diverse research contexts [3].
Within the framework of advanced research on Annexin V staining flow cytometry protocols, the ability to accurately differentiate the distinct stages of apoptosis is paramount. This analytical power is largely derived from the strategic combination of Annexin V conjugates with complementary viability dyes. During the early phase of apoptosis, a cell undergoes a characteristic flip of phosphatidylserine (PS) from the inner to the outer leaflet of the plasma membrane, while the membrane itself remains intact [11] [10]. This externalized PS serves as a specific binding site for Annexin V, a 35-36 kDa calcium-dependent phospholipid-binding protein [11] [16]. The subsequent loss of membrane integrity marks the transition to late apoptosis or necrosis, a stage detected by the influx of membrane-impermeant viability dyes such as propidium iodide (PI) or 7-AAD [5] [10]. This application note details the core principles and provides definitive protocols for leveraging these reagents to obtain precise, quantifiable data on cell death, essential for researchers and drug development professionals.
The Biochemical Basis of Detection
Phosphatidylserine Externalization and Annexin V Binding
The fundamental event detected in early apoptosis is the translocation of the phospholipid phosphatidylserine (PS). In viable cells, PS is meticulously maintained on the inner, cytoplasmic surface of the plasma membrane by enzymatic activity [10]. A key early biochemical event in apoptosis is the cessation of this activity, coupled with the activation of scramblases, resulting in the rapid exposure of PS on the cell surface [10]. This externalized PS acts as an "eat-me" signal for phagocytes in vivo [11].
Annexin V binds to PS with high affinity in a calcium-dependent manner, with a dissociation constant (Kd) of approximately 10 nM [16]. By conjugating Annexin V to a fluorochrome (e.g., FITC, PE, APC), researchers can tag and identify cells that are in this critical early apoptotic phase via flow cytometry. The fluorescence intensity difference between apoptotic and non-apoptotic cells stained this way is typically about 100-fold, providing a robust and clear signal [11].
Membrane Integrity as a Marker for Late-Stage Cell Death
The integrity of the plasma membrane serves as the second critical parameter for differentiating apoptotic stages. Viable and early apoptotic cells possess an intact membrane that excludes dyes like propidium iodide (PI) and 7-AAD [5] [10]. These dyes are nucleic acid intercalators that fluoresce brightly upon binding to DNA, but they cannot cross an intact lipid bilayer.
As a cell progresses to late apoptosis or undergoes necrosis, the membrane becomes compromised. This loss of barrier function allows PI and 7-AAD to enter the cell, stain the DNA, and generate a strong fluorescent signal [10]. The use of a viability dye in tandem with Annexin V is crucial to avoid false positives, as any breach in the membrane (even in necrotic cells) would allow Annexin V to access PS on the inner leaflet [11]. Therefore, a cell positive for both Annexin V and a viability dye is reliably classified as being in a late stage of cell death.
Table 1: Characterizing Cell Populations with Annexin V and a Viability Dye
| Annexin V Staining | Viability Dye Staining (PI/7-AAD) | Cell Population | Physiological State |
|---|---|---|---|
| Negative | Negative | Viable | Healthy, with intact membrane and no external PS. |
| Positive | Negative | Early Apoptotic | Undergoing programmed death, with external PS but an intact membrane. |
| Positive | Positive | Late Apoptotic/Necrotic | Loss of membrane integrity, with external PS. |
| Negative | Positive | Necrotic (or Late Apoptotic) | Loss of membrane integrity without specific PS externalization; may indicate primary necrosis. |
Diagram 1: The progression of cell death, highlighting the key detectable events.
Experimental Protocols
Standard Annexin V/Propidium Iodide (PI) Staining Protocol
This protocol is adapted from established methodologies for use with suspension and adherent cell cultures [5] [17] [10].
Materials and Reagents
- Cells: Cultured cells (0.2-1 x 10⁶ per sample).
- Annexin V Conjugate: Fluorochrome-labeled (e.g., FITC, Alexa Fluor 488, PE).
- Viability Dye: Propidium Iodide (PI) solution (or 7-AAD).
- Binding Buffer: 10 mM HEPES, 140 mM NaCl, 2.5 mM CaCl₂, pH 7.4. A 10X concentrate is often provided in kits and must be diluted to 1X with distilled water before use [5] [17].
- Phosphate-Buffered Saline (PBS): Cold, without Ca²⁺/Mg²⁺, EDTA, or azide.
- Flow Cytometry Tubes: 12 x 75 mm round-bottom tubes.
- Centrifuge and Flow Cytometer.
Step-by-Step Procedure
- Prepare 1X Binding Buffer: Dilute the 10X binding buffer concentrate 1:9 with distilled water [5].
- Harvest Cells: Collect cells, including any floating cells in the culture supernatant for adherent cultures. It is critical to be gentle; mechanical stress can damage membranes and cause false positives [18] [3].
- For adherent cells, use a gentle dissociation method like trypsin without EDTA. Over-digestion must be avoided [18].
- Wash Cells: Pellet cells by centrifugation (300-500 x g for 5 minutes). Carefully decant the supernatant and resuspend the cell pellet in cold PBS. Repeat this wash step once [17] [10].
- Resuspend in Buffer: After the final wash, thoroughly resuspend the cell pellet in 1X Binding Buffer at a density of 1-5 x 10⁶ cells/mL [5] [10].
- Stain with Annexin V: Aliquot 100 µL of cell suspension into a flow cytometry tube. Add the recommended volume of fluorochrome-conjugated Annexin V (typically 5 µL). Mix gently by swirling or tapping [5] [17].
- Incubate: Incubate the tubes for 15-20 minutes at room temperature. Protect the samples from light throughout the procedure [17] [10].
- Add Viability Dye: Without washing, add 5 µL of PI staining solution (or the appropriate volume for 7-AAD) directly to the cell suspension [5] [7].
- Analyze by Flow Cytometry: Add 400 µL of 1X Binding Buffer to the tube, mix gently, and analyze the samples immediately (within 1 hour) on a flow cytometer. Do not wash after adding PI, as this would remove the dye [17] [7].
Diagram 2: Workflow for the standard Annexin V/PI staining protocol.
Protocol Incorporating Fixable Viability Dyes
For experiments requiring subsequent intracellular staining or fixation, fixable viability dyes (FVDs) are the preferred choice. These dyes covalently bind to intracellular amines in cells with compromised membranes and retain signal after fixation, unlike PI [5].
Key Modifications to the Standard Protocol
- Stain with FVD First: After harvesting and washing cells with azide-free and serum/protein-free PBS, resuspend the cells in PBS. Add 1 µL of FVD (e.g., eFluor 660, eFluor 780) per 1 mL of cells, vortex immediately, and incubate for 30 minutes at 2-8°C in the dark [5].
- Wash Excess Dye: Wash the cells twice with a Flow Cytometry Staining Buffer or equivalent to remove any unbound FVD [5].
- Proceed with Annexin V Staining: Wash cells once with 1X Binding Buffer. Then, resuspend the pellet in Binding Buffer and continue with the Annexin V staining steps (5-8) as described in the standard protocol, including a final wash before analysis [5].
Critical Data Analysis and Gating Strategy
Optimized Gating to Exclude Debris
A common pitfall in apoptosis analysis is the inclusion of cellular debris in the live cell population, which artificially inflates the viable fraction. A robust 3-step gating strategy effectively addresses this [19]:
- Gate on Double-Negative Events: On an ungated plot of Annexin V vs. PI, draw a region (R1) around the Annexin V-negative/PI-negative population.
- Define Debris Population: Create a Forward Scatter (FSC) vs. Side Scatter (SSC) plot, gated on R1. The events in R1 will typically separate into a main population of true live cells and a population with lower FSC (smaller events). Draw a tight region (R2) around this smaller population and label it "Debris."
- Create a "Not-Debris" Gate: Invert the "Debris" gate (R2) to create a "Not-Debris" gate. Apply this "Not-Debris" gate to the total population for the final analysis of Annexin V vs. PI. This ensures that small, non-fluorescent debris is excluded from the downstream classification of cell death stages [19].
Essential Experimental Controls
Proper controls are non-negotiable for accurate instrument setup and data interpretation [18] [17] [10].
Table 2: Required Controls for Annexin V / Viability Dye Experiments
| Control Tube | Annexin V | Viability Dye | Purpose |
|---|---|---|---|
| Unstained | - | - | Determines background autofluorescence and sets negative populations. |
| Annexin V Single-Stain | + | - | Used to adjust compensation for spectral overlap into the viability dye channel. |
| Viability Dye Single-Stain | - | + | Used to adjust compensation for spectral overlap into the Annexin V channel. |
| Induced Apoptosis (Positive Control) | + | + | Validates the staining protocol; treated with an apoptosis inducer (e.g., staurosporine, camptothecin). |
Troubleshooting and Best Practices
Even with a straightforward protocol, attention to detail is critical for success. The table below outlines common challenges and their solutions.
Table 3: Troubleshooting Common Issues in Annexin V Staining
| Problem | Potential Cause | Solution |
|---|---|---|
| High Background/False Positives | 1. Cell harvesting too harsh.2. EDTA in trypsin or buffers.3. Incubation time too long. | 1. Be gentle when handling cells [3].2. Use trypsin without EDTA and wash thoroughly; ensure buffers are calcium-containing and chelator-free [5] [18].3. Adhere strictly to incubation times. |
| Low Annexin V Signal | 1. Insufficient calcium.2. Poor viability dye separation. | 1. Verify that 1X Binding Buffer contains 2.5 mM CaCl₂ [10].2. Titrate the Annexin V reagent for optimal signal-to-noise ratio [3]. |
| High Debris in Sample | 1. Over-digestion of adherent cells.2. Toxic treatment causing excessive death. | 1. Optimize digestion time and method [18].2. Implement the 3-step gating strategy to exclude debris from the final analysis [19]. |
| Poor Compensation | 1. Weak signal in single-stained controls. | 1. Use properly induced apoptotic cells with strong positive signals for single-stain controls [18]. |
The Scientist's Toolkit: Research Reagent Solutions
Table 4: Essential Reagents for Annexin V-Based Apoptosis Detection
| Reagent / Kit | Key Function | Example Products & Specifications |
|---|---|---|
| Annexin V Conjugates | Binds to externalized phosphatidylserine (PS) on apoptotic cells. | Stand-alone conjugates: Alexa Fluor 488, FITC, PE, APC, eFluor dyes [5] [11]. |
| Membrane-Impermeant Viability Dyes | Distinguishes intact vs. compromised membranes. | Propidium Iodide (PI): Standard for immediate analysis [17] [7]. 7-AAD: Often used as an alternative to PI [5]. |
| Fixable Viability Dyes (FVD) | Distinguishes live/dead cells in samples requiring fixation/permeabilization. | FVD eFluor 506, eFluor 660, eFluor 780; compatible with intracellular staining [5]. |
| Annexin V Apoptosis Kits | Provides optimized, matched reagents for a streamlined workflow. | Kits include Annexin V conjugate, viability dye (PI/7-AAD/SYTOX), and 5X or 10X Binding Buffer [5] [17] [11]. |
| Binding Buffer | Provides calcium and ionic strength for optimal Annexin V-PS binding. | 10 mM HEPES, 140 mM NaCl, 2.5 mM CaCl₂, pH 7.4; must be free of EDTA and other calcium chelators [5] [17]. |
Comparison with Other Apoptosis Detection Methods (TUNEL, Caspase Assays)
Within the broader scope of research on Annexin V staining protocols for flow cytometry, it is crucial to understand how this method compares to other established techniques for apoptosis detection. The choice of assay is fundamentally dictated by the specific stage of the apoptotic process one aims to investigate. This application note provides a detailed comparative analysis of three cornerstone methods: Annexin V staining for detecting early membrane alterations, TUNEL assay for identifying late-stage DNA fragmentation, and Caspase Activation Assays for confirming the involvement of key enzymatic pathways [1] [20] [21]. We summarize their core principles, provide detailed protocols for key experiments, and contextualize their application in drug development research.
Comparative Analysis of Key Apoptosis Detection Methods
The following table offers a consolidated, quantitative comparison of the three primary apoptosis detection methods, highlighting their key characteristics and optimal use cases.
Table 1: Comprehensive Comparison of Apoptosis Detection Methods
| Feature | Annexin V Staining | TUNEL Assay | Caspase Activation Assays |
|---|---|---|---|
| Detection Target | Phosphatidylserine (PS) externalization on the cell membrane [1] | DNA fragmentation (strand breaks) [20] [22] | Proteolytic activity of executioner caspases (e.g., 3/7) [1] [20] |
| Apoptosis Stage | Early event [1] [23] | Late event [20] [22] | Mid-stage event (execution phase) [21] |
| Typical Assay Time | ~1-1.5 hours [5] [3] | ~2+ hours [22] | 1-3 hours (luminescent) [24] |
| Key Advantage | Distinguishes early apoptotic (Annexin V+/PI-), late apoptotic (Annexin V+/PI+), and necrotic (Annexin V-/PI+) cells [7] [1] | High specificity for DNA fragmentation, a hallmark of apoptosis; usable on tissue sections [20] [22] | Directly measures enzyme activity central to the apoptotic pathway; high sensitivity [1] [20] |
| Primary Limitation | Cannot distinguish apoptosis from other forms of PS-exposing cell death (e.g., necroptosis) [1] | Requires cell fixation and permeabilization, making it an endpoint assay [20] | Does not confirm the final cell death; caspase activity can be transient [21] |
| Compatibility with Flow Cytometry | Excellent; primarily designed for it [7] [5] | Excellent; multiple kits available [21] [22] | Good (fluorescence-based); also excellent for plate-reader formats (luminescence) [24] |
Detailed Experimental Protocols
Annexin V/Propidium Iodide (PI) Staining for Flow Cytometry
This protocol is adapted from established methodologies for detecting early apoptosis in cell cultures, such as treated cancer cells [7] [5] [13].
Materials:
- Cells: Adherent or suspension cells (e.g., MDA-MB-231, Jurkat) [13] [23].
- Inducer: Apoptosis-inducing agent (e.g., 10 µM Camptothecin or 0.5 µM Staurosporine) [3] [23].
- Reagents: Fluorochrome-conjugated Annexin V (e.g., Annexin V-FITC), Propidium Iodide (PI) Staining Solution, 10X Annexin V Binding Buffer, PBS [7] [5].
- Equipment: Flow cytometer, centrifuge, cultureware.
Procedure:
- Induction and Harvest: Induce apoptosis in cells. For adherent cells, first collect the media containing floating cells, then gently trypsinize the adherent layer and combine all cells. For suspension cells, collect the entire culture [7] [3].
- Washing: Wash cells twice with cold PBS by centrifugation (500–670 × g for 5 minutes) [7] [5].
- Staining: Resuspend the cell pellet (~1-5 x 10^5 cells) in 100 µL of 1X Annexin V Binding Buffer.
- Analysis: Add an additional 200-400 µL of 1X Binding Buffer to the tubes and analyze immediately by flow cytometry using 488 nm excitation. Do not wash after the incubation step [7] [5].
Data Interpretation: Analyze the population densities on a dot plot of Annexin V-FITC vs. PI.
- Viable Cells: Annexin V-/PI-
- Early Apoptotic Cells: Annexin V+/PI- [7] [1]
- Late Apoptotic/Necrotic Cells: Annexin V+/PI+ [7] [1]
TUNEL Assay for DNA Fragmentation
This protocol is based on the Click-iT TUNEL methodology for detecting apoptosis in fixed cells or tissue samples [22].
Materials:
- Cells or Tissues: Cultured cells or formalin-fixed, paraffin-embedded (FFPE) tissue sections.
- Reagents: Click-iT TUNEL Imaging Assay Kit (containing TdT enzyme, EdUTP, Click-iT reaction buffer, and fluorescent azide), Paraformaldehyde (4%), Triton X-100, Bovine Serum Albumin (BSA) [22].
- Equipment: Fluorescence microscope, humidified chamber.
Procedure:
- Fixation and Permeabilization: Fix cells with 4% paraformaldehyde for 15 minutes at room temperature. Wash with PBS. Permeabilize the cells with 0.1% Triton X-100 in PBS for 15 minutes [20] [22].
- TUNEL Reaction: Prepare the TUNEL reaction cocktail per kit instructions (TdT + EdUTP). Apply the cocktail to the samples and incubate in a humidified chamber at 37°C for 60 minutes [20] [22].
- Click-iT Reaction: After washing, prepare the Click-iT reaction mixture containing the fluorescent azide. Apply this to the samples and incubate for 30 minutes at room temperature in the dark [22].
- Counterstaining and Imaging: Wash the samples thoroughly. Apply a nuclear counterstain (e.g., DAPI or Hoechst). Mount the samples and visualize under a fluorescence microscope. TUNEL-positive nuclei will fluoresce with the color of the azide dye used [22].
Caspase-Glo 3/7 Assay for Caspase Activation
This homogenous, luminescent assay measures the activity of effector caspases-3 and -7, which are key executioners of apoptosis [24].
Materials:
- Cells: Cells in culture (e.g., in a 96-well white-walled plate).
- Reagent: Caspase-Glo 3/7 Reagent (Promega) [24].
- Equipment: Luminescent plate reader.
Procedure:
- Cell Preparation: Plate cells in a 96-well plate and treat with the apoptotic inducer. Include a negative control (untreated cells) and a blank (media only).
- Assay Execution: Equilibrate the Caspase-Glo 3/7 Reagent and plate to room temperature. Add an equal volume of reagent to each well containing cells in culture medium. For example, add 100 µL of reagent to 100 µL of cell culture medium [24].
- Incubation and Reading: Mix the contents gently using a plate shaker for 30 seconds. Incubate the plate at room temperature for 30 minutes to 3 hours. Measure the luminescence in a plate reader [24].
Data Interpretation: The luminescent signal is proportional to the amount of caspase activity present. An increase in luminescence in treated samples compared to the control indicates induction of apoptosis.
Visualizing Apoptosis Pathways and Methodologies
Apoptosis Signaling Pathways and Detection Points
The following diagram illustrates the major pathways of apoptosis and the specific stages where Annexin V, TUNEL, and Caspase assays detect the process.
Annexin V/Propidium Iodide Staining Workflow
This flowchart details the step-by-step experimental procedure for the Annexin V/PI staining protocol.
The Scientist's Toolkit: Key Research Reagent Solutions
Selecting the appropriate reagents is fundamental to the success of any apoptosis detection experiment. The following table outlines essential materials and their functions.
Table 2: Essential Reagents for Apoptosis Detection Assays
| Reagent / Kit | Function / Application | Key Considerations |
|---|---|---|
| Annexin V-FITC Apoptosis Detection Kit [5] | All-in-one solution for flow cytometry-based detection of early apoptosis. Typically contains Annexin V-FITC, PI, and Binding Buffer. | Ensure calcium-containing binding buffer is used; avoid EDTA. Fast and simple protocol for live cells. |
| Click-iT TUNEL Alexa Fluor Imaging Assay [22] | Fluorescence-based detection of DNA fragmentation in fixed cells/tissues via "click" chemistry. | Requires fixation/permeabilization. Superior for tissue sections and multiplexing with other markers. |
| Caspase-Glo 3/7 Assay [24] | Luminescent, homogenous assay for measuring caspase-3/7 activity in a plate-reader format. | Provides a direct, quantitative measure of key apoptotic enzyme activity. No washing or transfer steps. |
| Propidium Iodide (PI) / 7-AAD [7] [5] | Cell-impermeant viability dyes used to distinguish late apoptotic/necrotic cells in Annexin V assays. | PI is excited by 488 nm laser. 7-AAD has different emission spectra, useful for multiplexing. |
| 10X Annexin Binding Buffer [5] | Provides the optimal calcium-containing environment for Annexin V to bind to externalized PS. | Critical for assay performance. Must be diluted and free of calcium chelators like EDTA. |
| Staurosporine / Camptothecin [21] [3] [23] | Common pharmacological inducers of apoptosis used for positive experimental controls. | Staurosporine is a broad-spectrum inducer. Camptothecin is a topoisomerase inhibitor. |
Step-by-Step Annexin V Staining Protocol for Flow Cytometry
The Annexin V staining protocol for flow cytometry is a cornerstone method for detecting apoptotic cells by measuring the externalization of phosphatidylserine (PS), a key early event in apoptosis [25] [10]. Annexin V is a 35-36 kDa calcium-dependent phospholipid-binding protein with a high affinity for PS [25] [3]. In viable, healthy cells, PS is predominantly located on the inner leaflet of the plasma membrane. During apoptosis, PS is translocated to the outer leaflet, where it can be bound by fluorochrome-conjugated Annexin V [26] [10]. Accurate detection of apoptosis is critical in various research fields, including drug development, cancer biology, and immunology, for understanding disease mechanisms and evaluating therapeutic efficacy [10]. The reliability of this assay is fundamentally dependent on the correct selection and use of specific kits, buffers, and critical components, which are detailed in this application note.
Core Kits and Reagents
The essential reagents for an Annexin V assay are available as individual components or, more commonly, as commercially optimized kits that ensure compatibility and performance.
Commercial Apoptosis Detection Kits
Multiple manufacturers offer comprehensive kits that typically include a conjugated Annexin V and a proprietary binding buffer. The table below summarizes selected kit options:
Table 1: Overview of Commercial Annexin V Apoptosis Detection Kits
| Manufacturer | Annexin V Conjugates Available | Viability Dye Included | Key Features |
|---|---|---|---|
| Thermo Fisher Scientific [5] | eFluor 450, FITC, PerCP-eFluor 710, PE, PE-Cyanine7, APC | Propidium Iodide (PI) or 7-AAD (in most kits) | Multiple fluorochrome options for panel flexibility; Detailed protocols for complex staining (e.g., with fixable viability dyes or intracellular targets). |
| BD Biosciences [25] | FITC | Propidium Iodide (PI) | Well-established, routinely tested kit; Includes 10X Annexin V Binding Buffer. |
| RayBiotech [26] | RayBright V450 (Violet 450) | RayBright Live R780 | Designed for compatibility with subsequent immunophenotyping that requires cell fixation. |
Critical Individual Reagents
Annexin V Conjugates
Annexin V conjugated to fluorochromes is the primary detection reagent. The choice of fluorochrome (e.g., FITC, PE, APC) is determined by the laser and filter configuration of the flow cytometer and the need for multicolor panels [5]. Titration of the Annexin V reagent is recommended for optimal results, as the required amount can vary with cell type. The goal is to find the concentration that provides maximum separation between positive and negative populations with minimal nonspecific binding [3].
Viability Staining Probes
A membrane-impermeant viability dye is crucial for distinguishing early apoptotic cells (Annexin V-positive, viability dye-negative) from late apoptotic and necrotic cells (Annexin V-positive, viability dye-positive) [25] [10]. The most common dyes are:
- Propidium Iodide (PI) or 7-Amino-Actinomycin D (7-AAD): These dyes are included in most standard kits and are added just before analysis without a subsequent wash step [5] [25].
- Fixable Viability Dyes (FVDs): These dyes are preferred when the assay is combined with intracellular staining or when cell fixation is required. They covalently bind to amines in cells with compromised membranes, allowing for subsequent permeabilization and washing steps without loss of the viability signal [5]. It is critical to avoid using FVD eFluor 450 in conjunction with Annexin V Apoptosis Detection Kits, as per manufacturer warnings [5].
Essential Buffers and Solutions
The proper biochemical environment is vital for specific Annexin V binding and cell integrity.
Annexin V Binding Buffer
The binding buffer is a critical component with three key functions:
- Providing Calcium: Annexin V binding to phosphatidylserine is calcium-dependent. The buffer must contain CaCl₂ (typically at 2.5 mM in the 1X working solution) [25] [10].
- Maintaining Physiological pH: It is buffered, often with HEPES/NaOH at pH 7.4, to maintain a stable environment for the cells [25].
- Providing Osmotic Balance: It contains salts (e.g., NaCl) to maintain isotonicity and prevent cell lysis [25].
A 10X concentrated stock is often provided in kits and must be diluted to 1X with distilled water before use [5] [25]. It is imperative to avoid buffers containing EDTA or other calcium chelators, as they will inhibit Annexin V binding [5].
Supporting Buffers
- Phosphate-Buffered Saline (PBS): Used for washing cells to remove residual media, serum, and EDTA that could interfere with the assay. For use with Fixable Viability Dyes, PBS should be azide-free and serum/protein-free [5].
- Flow Cytometry Staining Buffer: A protein-based buffer used after FVD staining to quench the reaction and remove unbound dye [5].
Experimental Protocols
Standard Staining Protocol with PI
This is the most common workflow for detecting apoptosis using a kit with PI [5] [25].
- Prepare 1X Binding Buffer: Dilute the provided 10X binding buffer 1:9 with distilled water [25].
- Harvest and Wash Cells: Harvest cells gently to preserve membrane integrity, especially for adherent cells. Wash cells once with cold PBS and once with 1X Binding Buffer. Centrifuge at 300-500 x g for 5 minutes [5] [25].
- Resuspend Cells: Resuspend the cell pellet in 1X Binding Buffer at a concentration of 1-5 x 10⁶ cells/mL [5].
- Stain with Annexin V: Transfer 100 µL of cell suspension to a tube. Add 5 µL of fluorochrome-conjugated Annexin V, gently vortex, and incubate for 10-15 minutes at room temperature in the dark [5] [25].
- Wash and Resuspend: Add 2 mL of 1X Binding Buffer, centrifuge, and discard the supernatant. Resuspend the cells in 200 µL of 1X Binding Buffer [5].
- Stain with PI: Add 5 µL of Propidium Iodide Staining Solution. Do not wash after adding PI [5] [25].
- Acquire Data: Analyze by flow cytometry within 1 hour. Keep samples on ice and protected from light until acquisition [25].
The following workflow diagram summarizes the key steps:
Protocol with Fixable Viability Dyes
This protocol is used when combining apoptosis detection with staining for intracellular targets [5].
- Wash Cells: Wash cells twice in azide-free and serum/protein-free PBS [5].
- Stain with FVD: Resuspend cells in PBS and add FVD at 1 µL per 1 mL of cells. Vortex immediately and incubate for 30 minutes at 2-8°C in the dark [5].
- Quench and Wash: Wash cells twice with Flow Cytometry Staining Buffer or an equivalent protein-based buffer [5].
- Proceed with Annexin V Staining: Wash cells once with 1X Binding Buffer, then follow the standard protocol from step 3 (Resuspend Cells) onward [5].
The Scientist's Toolkit
Table 2: Essential Research Reagent Solutions for Annexin V Staining
| Item | Function & Importance | Examples & Notes |
|---|---|---|
| Annexin V Conjugate | Binds to exposed phosphatidylserine, marking apoptotic cells. | FITC, PE, APC conjugates [5]. Must be titrated for each cell type [3]. |
| Viability Dye | Distinguishes intact (early apoptotic) and compromised (late apoptotic/necrotic) membranes. | Propidium Iodide (PI) / 7-AAD [25]; Fixable Viability Dyes (FVDs) for intracellular staining [5]. |
| Binding Buffer (1X) | Provides calcium for Annexin V binding and maintains cell viability. | Must contain Ca²⁺ (2.5 mM) [10]. Must be free of EDTA/chelators [5]. |
| Apoptosis Inducer | Provides a reliable positive control for assay validation. | Staurosporine or Camptothecin [25] [3]. |
| Compensation Controls | Essential for accurate multicolor flow cytometry to correct for spectral overlap. | Unstained cells; cells stained with Annexin V only; cells stained with viability dye only [25] [3]. |
Data Interpretation and Analysis
The standard method for analyzing Annexin V staining data is through a two-dimensional dot plot. The following diagram illustrates how to interpret the results to distinguish between viable, early apoptotic, and late apoptotic/necrotic cell populations:
- Viable Cells (Annexin V⁻ / PI⁻): These cells have not undergone apoptosis and have intact membranes, excluding PI [25] [10].
- Early Apoptotic Cells (Annexin V⁺ / PI⁻): This population is a key indicator of early apoptosis, showing PS externalization while maintaining membrane integrity [25] [10].
- Late Apoptotic/Necrotic Cells (Annexin V⁺ / PI⁺): These cells have exposed PS and have lost membrane integrity, which can occur in the late stages of apoptosis or through necrotic cell death [25] [10].
The integrity of the plasma membrane is a foundational parameter in flow cytometry-based apoptosis detection using Annexin V. During early apoptosis, phosphatidylserine (PS) translocates from the inner to the outer leaflet of the plasma membrane while membrane integrity remains intact, creating specific binding sites for Annexin V. Any compromise of membrane integrity during cell harvesting—whether through mechanical shear force or enzymatic degradation—can artificially permit Annexin V access to internal PS, generating false-positive results and compromising data validity. [5] [27] [11]
This application note details specialized harvesting techniques for suspension and adherent cell cultures, emphasizing procedures that preserve membrane integrity. Proper cell preparation ensures accurate discrimination between viable (Annexin V−/PI−), early apoptotic (Annexin V+/PI−), and late apoptotic/necrotic (Annexin V+/PI+) populations, which is crucial for obtaining biologically relevant results in drug development and basic research. [10] [15]
Fundamental Principles: Why Gentle Harvesting is Non-Negotiable
The Phosphatidylserine Exposure Paradox
In healthy cells, phosphatidylserine is maintained exclusively on the inner leaflet of the plasma membrane by ATP-dependent translocases. During early apoptosis, this asymmetry collapses, and PS becomes exposed on the cell surface while the membrane remains selectively permeable. This externalized PS binds Annexin V in a calcium-dependent manner, forming the basis of the assay. [1] [27] [11]
The critical vulnerability arises because any mechanical or chemical disruption of membrane integrity—even in healthy cells—allows Annexin V to penetrate and bind PS on the inner membrane leaflet. This produces false-positive signals indistinguishable from true apoptosis, fundamentally skewing experimental results. [3] [11]
Consequences of Improper Harvesting Techniques
- Mechanical Stress: Over-vigorous pipetting or centrifugation can create transient pores in the plasma membrane. [3]
- Enzymatic Damage: Prolonged trypsinization cleaves cell surface proteins and can damage membrane integrity. [1] [27]
- Pressure Changes: Rapid pressure differentials during processing can lyse fragile cells. [3]
Table 1: Troubleshooting Harvesting-Related Artifacts in Annexin V Staining
| Problem | Potential Cause | Solution |
|---|---|---|
| High Annexin V+ signal in negative controls | Rough pipetting during washing | Use wide-bore pipette tips; avoid bubble formation |
| Excessive cellular debris in flow cytometry | Over-trypsinization of adherent cells | Use minimal trypsin incubation time; use enzyme inhibitors |
| Unusually high PI+ population | Mechanical shear during centrifugation | Optimize centrifugation speed; use cushioning buffers |
| Inconsistent staining between replicates | Variable harvesting techniques | Standardize harvesting protocol across all samples |
Detailed Methodologies: Cell-Type Specific Harvesting Protocols
Harvesting Suspension Cells
Suspension cells (e.g., Jurkat, THP-1, primary lymphocytes) require careful processing to maintain viability while ensuring efficient recovery.
Materials Needed
- Pre-chilled phosphate-buffered saline (PBS)
- Centrifuge with temperature control
- Round-bottom tubes (12 × 75 mm recommended)
- Wide-bore pipettes or pipette tips
Step-by-Step Protocol
- Collect Culture Media: Transfer the entire cell culture suspension to a 15 mL conical tube. Include all floating cells, as these may contain apoptotic populations. [3]
- Wash Surfaces: Add 3 mL of cold PBS to the culture vessel and rinse thoroughly to recover any remaining cells; pool with the original suspension. [3]
- Gentle Centrifugation: Spin at 300–400 × g for 5 minutes at 4°C. Higher forces may damage membrane integrity. [10] [15]
- Careful Supernatant Removal: Decant or gently aspirate supernatant, leaving approximately 100 µL to avoid disturbing the cell pellet.
- Resuspension Technique: Gently resuspend cells in the remaining buffer using a wide-bore pipette tip. Avoid vortexing or vigorous pipetting.
- Buffer Addition: Add 2–3 mL of cold Annexin V binding buffer or PBS and repeat centrifugation.
- Final Resuspension: Resuspend cells in appropriate volume of binding buffer (typically 100 µL per 1–5 × 10^5 cells). [5] [15]
Harvesting Adherent Cells
Adherent cells (e.g., HEK293, HeLa, MCF-7) present greater challenges due to the requirement for detachment while preserving membrane integrity.
Materials Needed
- Pre-warmed (37°C) dissociation reagent (trypsin-EDTA or non-enzymatic alternatives)
- Complete growth medium (with serum to inhibit trypsin)
- PBS without calcium and magnesium
- Cell scraper (optional, for non-enzymatic detachment)
Step-by-Step Protocol
- Pre-collect Supernatant: Collect and retain culture media containing any spontaneously detached (potentially apoptotic) cells in a 15 mL tube. [3]
- Gentle Rinse: Wash the monolayer gently with pre-warmed PBS without calcium and magnesium to remove serum and debris.
- Optimized Detachment:
- Enzymatic Method: Add minimal volume of pre-warmed 0.05% trypsin-EDTA (just enough to cover the monolayer) and incubate at 37°C for the shortest time required for detachment (typically 2–5 minutes). [1] [3]
- Non-enzymatic Method: Use EDTA-based solutions or gentle cell scrapers for sensitive cells. [10]
- Rapid Neutralization: Once cells begin to detach (observe under microscope), add complete growth medium with serum (at least 2× volume of trypsin) to neutralize enzymatic activity.
- Harvesting: Gently pipette the solution across the growth surface to detach remaining cells; avoid foaming.
- Combine Fractions: Pool the harvested cells with the supernatant collected in step 1 to ensure inclusion of all cell populations. [3]
- Centrifuge and Wash: Centrifuge at 300 × g for 5 minutes at 4°C; wash once with cold PBS. [15]
- Final Preparation: Resuspend in binding buffer at 1–5 × 10^6 cells/mL for staining. [5]
The workflow below illustrates the parallel processes for harvesting suspension and adherent cells, highlighting critical decision points for gentle handling:
The Scientist's Toolkit: Essential Reagents and Materials
Table 2: Key Research Reagent Solutions for Gentle Cell Harvesting
| Reagent/Material | Function | Application Notes |
|---|---|---|
| Calcium-containing Binding Buffer [5] [27] | Provides optimal conditions for Annexin V binding to PS | Must be calcium-rich; avoid EDTA-containing buffers during staining |
| Low-Concentration Trypsin-EDTA (0.05%) [1] [3] | Gentle detachment of adherent cells | Minimize incubation time; neutralize promptly with serum |
| Non-enzymatic Dissociation Agents [10] | Alternative to trypsin for sensitive cells | Preserves surface epitopes; reduces membrane damage |
| Wide-Bore Pipette Tips | Reduces shear stress during resuspension | Essential for avoiding mechanical membrane damage |
| Propidium Iodide (PI) or 7-AAD [5] [10] | Membrane integrity indicator | Must remain in buffer during acquisition; do not wash out |
| Fixable Viability Dyes (FVD) [5] | Alternative viability markers | Compatible with subsequent intracellular staining |
| Serum-Free, Protein-Free PBS [5] | Washing buffer prior to viability staining | Removes serum phosphatidylserine that could compete for binding |
Quality Assessment: Validating Harvesting Success
Key Performance Indicators
Following harvesting, assess preparation quality before proceeding with Annexin V staining:
- Viability Baseline: Using trypan blue exclusion, harvested cells should maintain >95% viability in negative control samples. [3]
- Morphological Integrity: Microscopic examination should reveal spherical, refractile cells without membrane blebbing in healthy controls.
- Flow Cytometry Forward Scatter: A tight, homogeneous population in FSC vs. SSC plots indicates minimal membrane disruption. [27]
Titration and Optimization
The required amount of Annexin V conjugate varies by cell line. Perform titration using apoptotic positive control cells (induced with staurosporine or camptothecin) alongside healthy cells. The optimal concentration provides maximum separation between positive and negative populations in apoptotic cells while minimizing nonspecific binding in healthy cells. [3]
Integrated Workflow: From Harvesting to Analysis
For a comprehensive cellular analysis, Annexin V staining can be integrated with other probes in a multiparametric panel. Recent methodologies enable simultaneous assessment of apoptosis, cell cycle, proliferation, and mitochondrial membrane potential from a single sample. [14]
The integrated approach reveals interconnections between these processes—for example, how mitochondrial depolarization precedes apoptosis induction, or how cell cycle arrest influences susceptibility to apoptosis. This provides a systems-level understanding of cellular responses to experimental treatments, making the initial careful cell preparation even more critical for generating reliable, multi-parameter data. [14]
The success of Annexin V-based apoptosis detection fundamentally depends on the initial cell harvesting approach. Gentle, standardized techniques that preserve plasma membrane integrity are essential for distinguishing true biological apoptosis from preparation-induced artifacts. By implementing the cell-type-specific protocols outlined in this application note, researchers can ensure the generation of reliable, reproducible data crucial for both basic research and drug development applications.
Standard Staining Protocol with Annexin V and Propidium Iodide
Within the broader context of optimizing cell death detection methods, the Annexin V and Propidium Iodide (PI) staining protocol stands as a cornerstone technique for flow cytometry-based apoptosis analysis. Accurate differentiation between viable, early apoptotic, late apoptotic, and necrotic cell populations is fundamental to numerous research fields, including cancer biology, immunology, and drug discovery [10] [28]. This application note provides a detailed, standardized protocol for the reliable quantification of apoptosis and necrosis, enabling researchers to precisely evaluate cellular responses to various experimental treatments.
The externalization of phosphatidylserine (PS) is a key early event in the apoptotic cascade. In viable cells, PS is predominantly confined to the inner leaflet of the plasma membrane. During apoptosis, this phospholipid asymmetry is lost, and PS becomes exposed on the cell surface [1] [28]. Annexin V, a 35-36 kDa calcium-binding protein, binds to exposed PS with high affinity in a calcium-dependent manner. When conjugated to a fluorochrome, it serves as a sensitive probe for detecting cells in early apoptosis [10] [1]. Propidium Iodide is a membrane-impermeant DNA dye that is excluded from viable and early apoptotic cells with intact plasma membranes. It stains cells with compromised membrane integrity, characteristic of late apoptosis and necrosis [10] [29]. The simultaneous application of both markers allows for the clear discrimination of different cell states within a heterogeneous population [15].
Principles and Mechanisms
Biochemical Basis of Annexin V/Propidium Iodide Staining
The Annexin V/PI assay leverages two distinct physiological changes that occur during cell death: the loss of membrane phospholipid asymmetry and the loss of membrane integrity.
Phosphatidylserine Externalization: The translocation of PS from the inner to the outer leaflet of the plasma membrane is a well-established "eat-me" signal for phagocytic cells and is a near-universal indicator of the initiation of apoptosis. The binding of fluorescently labeled Annexin V to this exposed PS provides a direct measure of this event [10] [28]. This process is calcium-dependent, necessitating the use of calcium-containing binding buffers for the assay [5].
Loss of Membrane Integrity: PI serves as a vital exclusion dye. Its inability to cross intact membranes means that only cells with disrupted permeability barriers—such as those in late-stage apoptosis (secondary necrosis) or primary necrosis—will incorporate the dye and exhibit nuclear fluorescence [10] [29]. This functional distinction is crucial for separating early apoptotic events from terminal stages of cell death.
Differentiation of Cell States
The power of this assay lies in its ability to resolve four distinct cell populations based on differential staining, as illustrated in the following logical framework:
The diagram above outlines the fundamental interpretation strategy for Annexin V/PI flow cytometry data. Viable cells (Q3) exclude both dyes and are thus double-negative. Early apoptotic cells (Q4) bind Annexin V due to PS externalization but maintain membrane integrity and exclude PI. Late apoptotic cells (Q2) have both exposed PS and compromised membranes, resulting in double-positive staining. Necrotic cells (Q1) typically show PI positivity without Annexin V binding, though this population can vary depending on the necrotic pathway [10] [15].
Materials and Reagents
Research Reagent Solutions
A successful Annexin V/PI assay requires specific reagents formulated to maintain cell viability and support specific binding interactions. The table below details the essential components and their critical functions.
Table 1: Essential Reagents for Annexin V/PI Staining
| Reagent | Function | Critical Notes |
|---|---|---|
| Fluorochrome-conjugated Annexin V | Binds to exposed phosphatidylserine on apoptotic cells. | Available in multiple conjugates (e.g., FITC, PE, APC). Titration may be required for different cell types [3]. |
| Propidium Iodide (PI) | Membrane-impermeant DNA dye staining necrotic/late apoptotic cells. | A recommended starting concentration is 2 µg/mL; optimal amount may vary (2-10 µL/test) [29] [6]. |
| 10X Binding Buffer | Provides optimal calcium and pH conditions for Annexin V binding. | Must contain Ca²⁺ (e.g., 2.5 mM CaCl₂). Avoid EDTA-containing buffers as they chelate calcium [10] [5]. |
| Phosphate Buffered Saline (PBS) | Used for washing cells to remove media and serum. | Should be cold and without calcium or magnesium for washing steps [29]. |
| Apoptosis Inducer (e.g., Staurosporine) | Provides a positive control for the assay. | Essential for validating the staining protocol and instrument setup [10] [3]. |
Equipment
- Flow cytometer equipped with appropriate lasers and filters for the chosen fluorochromes.
- Centrifuge capable of maintaining 4°C.
- Polystyrene round-bottom FACS tubes (12 x 75 mm).
- Piperettes and tips.
- Ice bath for storing stained samples.
Standard Staining Protocol
Experimental Workflow
The following diagram summarizes the key stages of the standard Annexin V/PI staining protocol, from cell preparation to final analysis:
Detailed Step-by-Step Procedure
Step 1: Cell Preparation
- Harvesting: For adherent cells, collect the supernatant (which may contain floating dead cells) first. Then, detach the adherent layer gently using a non-enzymatic dissociation buffer (e.g., EDTA) or mild trypsinization followed by a wash in serum-containing media to inhibit trypsin [3] [1]. For suspension cells, collect the cell suspension directly [10]. The goal is to minimize mechanical damage to the plasma membrane.
- Washing: Pellet cells by centrifugation at 300-500 × g for 5-7 minutes at room temperature or 4°C. Decant the supernatant and resuspend the cell pellet in cold PBS. Repeat this wash step once to ensure complete removal of serum and media, which can contain PS and interfere with Annexin V binding [10] [7].
- Concentration Adjustment: After the final wash, resuspend the cell pellet in 1X Binding Buffer at a density of 1-5 x 10⁶ cells/mL [5] [15].
Step 2: Staining
- Aliquot 100 µL of the cell suspension (containing 1-5 x 10⁵ cells) into a FACS tube.
- Add 5 µL of fluorochrome-conjugated Annexin V. The precise volume may vary by manufacturer; always consult the product datasheet [5] [6].
- Add 2-5 µL of PI staining solution. As noted in Table 1, this may require optimization for your specific cell system [6].
- Gently vortex or tap the tube to ensure thorough mixing.
Step 3: Incubation
- Incubate the stained cells for 15 minutes at room temperature (15-25°C) in the dark [10] [15]. Fluorochromes are light-sensitive, and protection from light is essential to prevent photobleaching and loss of signal.
Step 4: Final Preparation and Analysis
- Following incubation, add 300-400 µL of 1X Binding Buffer to each tube [10] [15]. Do not wash the cells after adding PI, as this could lead to the leakage of the dye from dead cells and result in inaccurate readings.
- Keep the samples on ice and protected from light if analysis will be performed within one hour. Analyze the samples by flow cytometry as soon as possible, ideally within one hour, to prevent deterioration of the staining profile and maintain cell viability [5] [6].
Critical Controls and Setup
Essential Experimental Controls
The inclusion of proper controls is non-negotiable for accurate data interpretation and instrument setup. The following table outlines the necessary controls and their specific purpose.
Table 2: Required Controls for Annexin V/PI Flow Cytometry
| Control Sample | Preparation | Purpose |
|---|---|---|
| Unstained Cells | Cells in binding buffer without dyes. | To determine cellular autofluorescence and set voltage thresholds. |
| Annexin V Single Stain | Cells stained with Annexin V only. | To compensate for fluorescence spillover into the PI detector. |
| PI Single Stain | Cells stained with PI only. | To compensate for fluorescence spillover into the Annexin V detector. |
| Viable (Negative) Control | Untreated, healthy cells stained with both dyes. | To establish the baseline for viable (double-negative) cell populations. |
| Apoptotic (Positive) Control | Cells treated with an apoptosis inducer (e.g., 1µM Staurosporine for 4-6 hours) and stained with both dyes. | To confirm the assay is working and to help set quadrant gates. |
Flow Cytometer Compensation and Gating
- Compensation: Using the single-stained controls, adjust the flow cytometer's compensation settings to correct for spectral overlap between the Annexin V and PI fluorescence signals. Proper compensation is critical for clear separation of the four cell populations [10].
- Gating: Begin by plotting forward scatter (FSC) vs. side scatter (SSC) to identify the main population of intact cells and exclude debris. Then, create a dot plot of Annexin V fluorescence (e.g., FITC) vs. PI fluorescence. Apply the quadrant gates based on the unstained and single-stained controls, with the lower left quadrant (double-negative) representing the viable cell population [10] [6].
Data Interpretation and Analysis
The final step involves quantifying the percentage of cells in each quadrant to determine the physiological state of the cell population. The following quantitative framework guides the interpretation:
Table 3: Interpretation of Annexin V/PI Staining Results
| Cell Population | Annexin V Staining | PI Staining | Biological Interpretation |
|---|---|---|---|
| Viable/Healthy Cells | Negative (-) | Negative (-) | Cells with intact membranes and no PS externalization. |
| Early Apoptotic Cells | Positive (+) | Negative (-) | Cells with exposed PS but an intact plasma membrane. |
| Late Apoptotic Cells | Positive (+) | Positive (+) | Cells with exposed PS and a compromised plasma membrane. |
| Necrotic Cells | Negative (-) | Positive (+) | Cells that have lost membrane integrity without PS externalization (less common). |
It is important to note that the "Late Apoptotic" population (Annexin V+/PI+) may also include cells that have undergone secondary necrosis. The basal level of apoptosis in untreated control samples should always be subtracted from the induced samples to determine the specific effect of the treatment [6].
Advanced Modifications and Troubleshooting
Addressing False-Positive PI Staining
A significant advancement in this protocol is the modification to reduce false-positive PI signals. Conventional protocols can yield up to 40% false-positive events due to PI binding to cytoplasmic RNA, a phenomenon particularly prevalent in large cells and primary cells with low nuclear-to-cytoplasmic ratios [29].
Modified RNase A Protocol:
- After performing the standard Annexin V/PI staining and washing steps (Sections 4.2, Steps 1-3), fix the cells by resuspending them in a 1% formaldehyde solution on ice for 10 minutes [29].
- Wash the fixed cells with PBS to remove the formaldehyde.
- Add RNase A at a final concentration of 50 µg/mL and incubate for 15 minutes at 37°C. This step digests cytoplasmic RNA, which is the primary source of non-nuclear PI signal [29].
- Analyze the cells by flow cytometry. This modification has been shown to significantly reduce false-positive events, providing a more accurate assessment of cell death, especially in complex primary cell samples [29].
Common Troubleshooting Guide
- High Background/Weak Staining: Ensure reagents are fresh and have been stored properly. Verify that the binding buffer contains the correct concentration of calcium and is at the proper pH. Titrate the Annexin V and PI reagents for optimal signal-to-noise ratio [3] [1].
- Excessive Necrotic Population: Review cell harvesting and handling procedures. Use gentler detachment methods and avoid excessive pipetting or vortexing. Process control cells as quickly as possible to minimize stress [3].
- Unexpected Staining Patterns: Always include the full set of controls listed in Table 2. Check compensation settings on the flow cytometer. Ensure that EDTA or other calcium chelators are not present in any buffers used after the initial wash [5].
Protocol Adaptation for Fixable Viability Dyes (FVD)
The accurate detection of apoptotic cells is fundamental to research in oncology, immunology, and drug development. The Annexin V staining protocol, a gold standard for identifying early apoptosis, relies on the calcium-dependent binding of Annexin V to phosphatidylserine (PS) after its translocation to the outer leaflet of the plasma membrane [30] [10]. A critical challenge in this assay is the discrimination of early apoptotic cells from necrotic cells or late-stage apoptotic cells with compromised membranes. While traditional viability dyes like propidium iodide (PI) or 7-AAD are effective in unfixed samples, they are unsuitable for protocols requiring intracellular staining or fixation, as their staining pattern is lost upon permeabilization [31] [32].
Fixable Viability Dyes (FVDs) address this limitation. These amine-reactive dyes form covalent bonds with cellular amines. In live cells with intact membranes, staining is limited to surface amines, resulting in dim fluorescence. In dead cells, the compromised membrane allows the dye access to intracellular amines, generating bright fluorescence [31] [33] [34]. This differential staining is preserved after fixation and permeabilization, enabling researchers to accurately exclude dead cells from analysis during complex multicolor flow cytometry experiments that include intracellular targets [5] [31]. This application note details the adaptation of the standard Annexin V protocol to incorporate FVDs, enhancing the assay's robustness for advanced immunophenotyping.
Scientific Rationale and Principle
The Critical Role of Viability Staining in Annexin V Assays
The integrity of the plasma membrane is the key parameter that allows Annexin V staining to specifically identify early apoptosis. In healthy cells, phosphatidylserine (PS) is confined to the inner leaflet of the membrane. During early apoptosis, PS is externalized while the membrane remains intact, allowing Annexin V to bind without permitting viability dyes to enter the cell [30] [10]. However, in late-stage apoptosis and necrosis, the membrane becomes permeable. Without a viability marker, it is impossible to distinguish between early apoptotic cells (Annexin V positive, viability dye negative) and late apoptotic/necrotic cells (Annexin V positive, viability dye positive). The latter can be a source of false positives, as Annexin V can pass through the compromised membrane and bind to PS on the inner leaflet [30].
The integration of a viability dye is, therefore, not optional but essential for precise interpretation. The use of FVDs provides a significant advantage over non-fixable DNA-binding dyes like PI or 7-AAD in experiments that extend beyond surface staining. As illustrated in Figure 1, the bright fluorescence of FVDs in dead cells is maintained after fixation, whereas PI staining is lost [31]. This preservation is crucial for ensuring that dead cells—which exhibit high non-specific antibody binding and autofluorescence—can be reliably gated out even after procedures like intracellular cytokine staining or transcription factor profiling [5] [32] [34].
Mechanism of Fixable Viability Dyes
FVDs are cell-impermeant, amine-reactive fluorescent dyes. Their mechanism of action is based on the differential accessibility of cellular amines between live and dead cells:
- Live Cells: The dye can only react with the limited number of primary amines present on the cell surface, resulting in dim fluorescence [31] [34].
- Dead Cells: The compromised membrane allows the dye to penetrate the cell and react with the abundant intracellular amines, resulting in very bright fluorescence [31] [33].
The dye-cell amine bond is covalent, making it stable through subsequent washing, fixation, and permeabilization steps. The difference in fluorescence intensity between live and dead cell populations is typically greater than 50-fold, allowing for clear discrimination [31].
Figure 1. Experimental workflow for integrating Fixable Viability Dyes. The diagram illustrates the process from staining with a fixable viability dye through fixation and permeabilization to final analysis, showing how the differential staining between live and dead cells is maintained throughout the protocol.
Research Reagent Solutions
The successful adaptation of the Annexin V protocol requires specific reagents optimized for compatibility. The table below lists essential materials and their functions.
Table 1: Essential Reagents for Annexin V Staining with Fixable Viability Dyes
| Reagent | Function & Importance | Key Considerations |
|---|---|---|
| Fixable Viability Dye (FVD) [5] [31] | Distinguishes live from dead cells post-fixation. Covalently labels amine groups. | Select a fluorochrome (e.g., eFluor 660, eFluor 780) compatible with your flow cytometer and not conflicting with Annexin V or other antibodies [5]. Avoid FVD eFluor 450 with Annexin V kits [5]. |
| Annexin V Conjugate [5] [30] | Binds externalized phosphatidylserine (PS) on apoptotic cells. | Available conjugated to various fluorochromes (FITC, PE, APC, etc.). Choose one spectrally distinct from the FVD and other markers. |
| 10X Binding Buffer [5] [6] | Provides the calcium (Ca²⁺) essential for Annexin V-PS binding. | Always dilute to 1X before use. Avoid buffers containing EDTA or other calcium chelators, as they will inhibit binding [5] [30]. |
| Flow Cytometry Staining Buffer [5] | Used for washing cells after FVD staining. Prevents non-specific binding. | Should be azide-free and serum/protein-free for the FVD staining step [5]. |
| Intracellular Fixation & Permeabilization Buffer Set [5] | For protocols involving intracellular antigen staining after Annexin V/FVD. | Fixes cells and permeabilizes membranes to allow antibody entry while preserving FVD and Annexin V signals. |
Adapted Staining Protocol for FVD and Intracellular Staining
This protocol is designed for the simultaneous analysis of apoptosis (Annexin V), cell viability (FVD), cell surface markers, and intracellular antigens.
Materials
- Cells of interest (e.g., treated Jurkat or MDA-MB-231 cells) [35]
- 1X PBS (calcium- and magnesium-free, azide-free, and serum/protein-free for FVD step) [5]
- Recommended Fixable Viability Dye (e.g., LIVE/DEAD Fixable Far Red Stain, FVD eFluor 780, or equivalent) [5] [31]
- Fluorochrome-conjugated Annexin V (e.g., Annexin V, FITC) [5]
- 10X Annexin V Binding Buffer [5] [6]
- Antibodies against cell surface antigens
- Intracellular Fixation & Permeabilization Buffer Set (e.g., Foxp3/Transcription Factor Staining Buffer Set) [5]
- Antibodies against intracellular antigens
- Flow cytometer with appropriate laser and filter configuration
Experimental Procedure
Step 1: Cell Preparation and Surface Staining
- Harvest cells (both adherent and suspension) using gentle methods to preserve membrane integrity. For adherent cells, prefer non-enzymatic disassociation or mild trypsinization [10] [1].
- Wash cells once with cold 1X PBS.
- Resuspend cell pellet in cold, azide-free PBS and stain with antibodies against cell surface antigens for 20-30 minutes on ice or at room temperature, protected from light.
- Wash cells twice with Flow Cytometry Staining Buffer or azide-free PBS to remove unbound antibody.
Step 2: Fixable Viability Dye Staining
- Resuspend the cell pellet from Step 1 in azide-free, serum/protein-free PBS at a concentration of 1-10 x 10⁶ cells/mL [5].
- Add the recommended volume of FVD (typically 1 µL per 1 mL of cell suspension) and vortex immediately [5].
- Incubate for 30 minutes at 2-8°C, protected from light [5].
- Wash cells twice with Flow Cytometry Staining Buffer or an equivalent buffer to remove any unreacted dye.
Step 3: Annexin V Staining
- Prepare 1X Annexin V Binding Buffer by diluting the 10X concentrate with distilled water [5] [6].
- Wash cells once with 1X Annexin V Binding Buffer.
- Resuspend cells in 1X Annexin V Binding Buffer at a concentration of 1-5 x 10⁶ cells/mL [5].
- Transfer 100 µL of cell suspension (~1-5 x 10⁵ cells) to a flow cytometry tube.
- Add 5 µL of fluorochrome-conjugated Annexin V, mix gently, and incubate for 10-15 minutes at room temperature, protected from light [5] [6]. Do not wash after this step if using PI/7-AAD. For FVD protocols, a wash is included.
- Add 2 mL of 1X Binding Buffer and centrifuge at 400-600 x g for 5 minutes. Discard the supernatant [5].
- Resuspend the cell pellet in 200 µL of 1X Binding Buffer.
Step 4: Intracellular Staining (if applicable)
- Following Annexin V staining, fix and permeabilize cells using a commercial intracellular staining buffer kit according to the manufacturer's instructions (e.g., Intracellular Fixation & Permeabilization Buffer Set) [5].
- Stain the fixed and permeabilized cells with antibodies against intracellular antigens for 30 minutes at room temperature, protected from light.
- Wash cells with Permeabilization Buffer or PBS to remove unbound antibody.
- Resuspend the final cell pellet in an appropriate buffer (e.g., Flow Cytometry Staining Buffer or PBS + 1% BSA) for flow cytometry analysis [35].
Step 5: Flow Cytometry Analysis
- Analyze samples promptly, ideally within 4 hours, to maintain optimal cell viability and staining integrity [5].
- Use single-stained controls (cells or compensation beads) for the FVD, Annexin V, and all antibodies to set up proper compensation on the flow cytometer.
- The gating strategy should first identify single cells, then use the FVD to gate out dead cells, and finally, analyze Annexin V staining and other markers within the live (FVD-negative) population.
Table 2: Key Steps and Critical Considerations in the Adapted Protocol
| Protocol Step | Critical Parameter | Recommendation |
|---|---|---|
| Cell Harvesting | Membrane Integrity | Use gentle detachment methods for adherent cells (e.g., low-concentration EDTA) to avoid mechanical damage and false-positive Annexin V staining [10]. |
| FVD Staining | Buffer Composition | Use azide-free and protein-free PBS. Azides and serum proteins can quench the dye reaction [5]. |
| Annexin V Staining | Calcium Ions | Essential for binding. Ensure binding buffer contains CaCl₂ and is free of EDTA or other calcium chelators [5] [30] [10]. |
| Post-Staining | Fixation | Aldehyde-based (formaldehyde) fixation is acceptable after Annexin V/FVD staining. Avoid alcohol-based fixatives as they may disrupt membrane structure [30]. |
| Timing | Analysis | Analyze samples as soon as possible (within 1-4 hours) after the final resuspension to prevent progression of apoptosis and loss of membrane integrity [5] [6]. |
Troubleshooting and Optimization
Even with an optimized protocol, challenges may arise. The table below outlines common issues and proposed solutions.
Table 3: Troubleshooting Guide for Annexin V and FVD Staining
| Problem | Potential Cause | Solution |
|---|---|---|
| High background in FVD channel | Unreacted dye not sufficiently washed out; over-titration of dye. | Increase the number or volume of washes after FVD staining. Titrate the FVD to determine the optimal volume for your cell type [32]. |
| Weak or no Annexin V signal | Insufficient calcium in buffer; apoptosis not induced; EDTA contamination. | Prepare fresh 1X Binding Buffer from concentrate. Verify apoptosis induction with a positive control (e.g., camptothecin-treated cells) [30] [1]. Ensure no carry-over of EDTA from trypsin or other buffers. |
| High percentage of late apoptotic/necrotic cells (Annexin V+/FVD+) | Over-induction of apoptosis; overly harsh cell harvesting. | Optimize the dose and duration of the apoptosis-inducing agent. Use gentler cell harvesting techniques [10] [1]. |
| Poor separation between live and dead populations by FVD | Incorrect dye titration; degraded dye; voltage settings on cytometer. | Titrate the FVD for optimal separation. Ensure the dye is fresh and stored properly. Adjust PMT voltages on the flow cytometer to maximize population distinction [31]. |
| Loss of staining after fixation (if using PI/7-AAD) | Expected behavior of non-fixable dyes. | This is a limitation of PI/7-AAD. Switch to a fixable viability dye for all protocols involving fixation and permeabilization [31]. |
Combining Annexin V Staining with Surface and Intracellular Markers
Within the broader investigation of Annexin V staining protocols for flow cytometry, a common and significant challenge is the integration of this apoptosis detection method with assays for surface and intracellular markers. Researchers often need to not only identify apoptotic cells but also understand which specific cell subtypes are undergoing death, or to analyze intracellular processes that correlate with the initiation of apoptosis. This application note provides a detailed, optimized protocol for the simultaneous detection of phosphatidylserine externalization, cell surface phenotype, and intracellular antigens in a multicolor flow cytometry panel. The methodology is crucial for complex fields like immunology and oncology drug development, where understanding the specific susceptibility of cell populations to therapy-induced death is paramount. The procedure outlined below has been synthesized from established, vendor-agnostic principles to ensure robust and reproducible results [5].
Scientific Background and Principles
Apoptosis is a tightly regulated process of programmed cell death characterized by distinct biochemical and morphological changes. One of the earliest detectable events is the loss of plasma membrane asymmetry, specifically the translocation of the membrane phospholipid phosphatidylserine (PS) from the inner to the outer leaflet [1] [36] [25]. Annexin V, a 35-36 kDa calcium-dependent phospholipid-binding protein, exhibits high affinity for PS and serves as a sensitive probe for identifying cells in the early stages of apoptosis when conjugated to a fluorochrome [25] [11].
However, Annexin V staining alone does not provide information about the lineage or functional state of the apoptotic cell. To gain this deeper insight, researchers combine Annexin V staining with antibodies against surface markers (e.g., CD4, CD8, CD19) for immunophenotyping, and/or intracellular markers (e.g., cytokines, transcription factors, phosphorylated signaling proteins) [5]. The key technical challenge lies in the fact that Annexin V binding is a live-cell, calcium-dependent assay, whereas intracellular staining requires cell permeabilization, which compromises membrane integrity and can lead to false-positive Annexin V binding [5] [1]. The presented workflow sequentially addresses these conflicting requirements to preserve the validity of the apoptosis measurement.
The following diagram illustrates the logical sequence of the experimental workflow, highlighting the critical steps that maintain assay validity.
Experimental Protocols
Detailed Staining Protocol
This protocol is designed for the simultaneous detection of surface markers, apoptosis via Annexin V, and intracellular targets. All centrifugation steps should be performed at 400-600 x g for 5 minutes at room temperature unless specified. Protect cells from light throughout the procedure [5].
Step 1: Cell Harvesting and Surface Staining. Begin by harvesting cells, gently rinsing adherent cells to avoid mechanical induction of apoptosis [3]. Wash cells twice with cold 1X PBS and resuspend the cell pellet (0.2-1 x 10^6 cells) in a suitable staining buffer to stain for cell surface antigens. Follow the standard protocol for your chosen antibodies, including incubation and wash steps [5].
Step 2: Viability Staining. Following surface staining, wash cells twice in azide-free and serum/protein-free PBS. Resuspend the cell pellet at 1-10 x 10^6 cells/mL in the same buffer. Add 1 µL of Fixable Viability Dye (FVD) per 1 mL of cell suspension and vortex immediately. Incubate for 30 minutes at 2-8°C. After incubation, wash the cells twice with a flow cytometry staining buffer to remove unbound dye [5]. Note: Avoid FVD eFluor 450, as it is not recommended for use with Annexin V kits [5].
Step 3: Annexin V Staining. Critical: Wash cells once with 1X Annexin V Binding Buffer to provide the required calcium ions for subsequent Annexin V binding. Resuspend the cell pellet in 1X Annexin V Binding Buffer at a concentration of 1-5 x 10^6 cells/mL. Transfer 100 µL of the cell suspension to a tube and add 5 µL of fluorochrome-conjugated Annexin V. Incubate for 10-15 minutes at room temperature in the dark. Add 2 mL of 1X Binding Buffer and centrifuge. Do not wash after this step if using propidium iodide (PI) or 7-AAD; simply resuspend in 200-400 µL of 1X Binding Buffer for acquisition [5] [6] [25]. If proceeding to intracellular staining, a wash step is required [5].
Step 4: Intracellular Staining. After Annexin V staining and a subsequent wash with 1X Binding Buffer, the cells must be fixed and permeabilized using a commercial buffer set (e.g., Foxp3/Transcription Factor Staining Buffer Set or Intracellular Fixation & Permeabilization Buffer Set) according to the manufacturer's instructions. Once permeabilized, stain the cells with antibodies against the intracellular target(s) of choice. After a final wash, resuspend the cells in an appropriate buffer for flow cytometry analysis [5].
Essential Controls and Reagent Titration
Appropriate controls are non-negotiable for accurate data interpretation and panel setup [6] [25].
Required Controls:
- Unstained cells: To assess autofluorescence.
- Single-color controls: Cells stained with Annexin V conjugate only, viability dye only, and each antibody used individually. These are essential for fluorescence compensation.
- Fluorescence Minus One (FMO) controls: To accurately set positive/negative boundaries for each marker, especially in complex panels.
- Induced apoptosis control: Treat cells with an apoptosis inducer like camptothecin (4-6 µM for 4-6 hours) or staurosporine to generate a positive control for Annexin V staining [3] [25].
- Specificity control (optional): Pre-incubate an aliquot of cells with unlabeled Annexin V to block binding sites, followed by stained Annexin V, to confirm staining specificity [6].
Reagent Titration: The optimal concentration of Annexin V can vary by cell line. It is critical to titrate the Annexin V conjugate using both healthy cells and induced apoptotic cells. The goal is to find a concentration that provides maximal separation between positive and negative populations in apoptotic cells while yielding the lowest non-specific binding in healthy cells [3].
The Scientist's Toolkit: Key Reagents and Materials
The successful execution of this multiplexed assay depends on the use of specific, high-quality reagents. The table below catalogues the essential components and their functions.
Table 1: Essential Research Reagents and Materials for Combined Staining
| Reagent/Material | Function/Benefit | Key Considerations |
|---|---|---|
| Fluorochrome-conjugated Annexin V [5] [11] | Detects exposed phosphatidylserine on apoptotic cells. | Choose a fluorochrome compatible with your flow cytometer and other panel antibodies (e.g., FITC, PE, APC). |
| Fixable Viability Dye (FVD) [5] | Distinguishes live from dead cells; signal is retained after fixation. | Essential for excluding false positives from dead cells. Avoid FVD eFluor 450 with Annexin V kits [5]. |
| 10X Annexin V Binding Buffer [5] [6] | Provides the optimal calcium-rich environment for Annexin V-PS binding. | Must be diluted to 1X for use. Avoid buffers with EDTA or other calcium chelators [5]. |
| Surface & Intracellular Antibodies [5] | Enable immunophenotyping of apoptotic cells and analysis of intracellular pathways. | Must be titrated and compatible with the chosen fixation/permeabilization method. |
| Intracellular Fixation & Permeabilization Buffer Set [5] | Preserves cell structure while allowing antibodies to access intracellular antigens. | Use a commercial kit designed for flow cytometry for best results. |
| Apoptosis Inducer (e.g., Camptothecin) [3] [25] | Generates a reliable positive control population for Annexin V staining. | Used for assay validation and titration. |
Data Analysis and Interpretation
Gating Strategy and Population Definition
A rigorous gating strategy is vital to avoid misinterpretation, particularly to exclude cellular debris that can artificially inflate the "viable" population [19]. A recommended 3-step gating approach is as follows:
- Gate on Intact Cells: On a plot of Annexin V versus the viability dye (e.g., PI) of the ungated data, draw a region around the double-negative (Annexin V-negative, viability dye-negative) population.
- Define Debris: Gate the events from the double-negative region onto a Forward Scatter (FSC) vs. Side Scatter (SSC) plot. Draw a tight region around the population with low FSC, which constitutes debris.
- Exclude Debris: Invert this debris gate to create a "Not-Debris" gate. Use this "Not-Debris" gate for all downstream analysis of your surface markers and Annexin V/viability dye plots [19].
Once debris is excluded, the populations can be defined on the Annexin V vs. viability dye plot as outlined in the table below.
Table 2: Definition of Cell Populations Based on Annexin V and Viability Dye Staining
| Population | Annexin V | Viability Dye (PI/7-AAD) | Interpretation |
|---|---|---|---|
| Viable / Live | Negative | Negative | Healthy cells not undergoing apoptosis. |
| Early Apoptotic | Positive | Negative | Cells in early apoptosis; membrane is intact. |
| Late Apoptotic / Necrotic | Positive | Positive | Cells in late-stage apoptosis (secondary necrosis) or necrotic cells. |
| Dead / Necrotic | Negative* | Positive | Typically necrotic cells; can also be dead cells where PS is degraded. *Note: A pure necrotic population may be Annexin V positive due to internal PS binding [11]. |
Technical Considerations and Limitations
While powerful, this combined protocol has inherent limitations. The fixation and permeabilization steps required for intracellular staining will compromise membrane integrity. This means that the Annexin V signal cannot be reliably used after permeabilization to distinguish early from late apoptotic stages [5] [1]. The Annexin V staining must therefore be performed and analyzed before the cell is permeabilized, capturing a snapshot of the PS exposure at the moment of fixation. Furthermore, the assay detects PS exposure, which, while a hallmark of apoptosis, is not exclusively specific and can occur in other cell death processes like necroptosis [1]. The use of a viability dye is critical to provide context, but mechanistic conclusions should be supported by additional assays.
The integration of Annexin V staining with surface and intracellular marker analysis provides a powerful, multidimensional tool for investigating cell death in specific cellular subsets. The protocol detailed herein offers a robust framework for researchers to simultaneously assess immunophenotype, viability, apoptotic status, and intracellular signaling events. Adherence to the sequential staining order, careful selection of compatible reagents and fluorochromes, and implementation of a stringent gating strategy that excludes debris are all critical for generating reliable and publication-quality data. This methodology enables profound insights into the dynamics of the apoptotic process within complex cell populations, accelerating research in drug discovery, immunology, and cancer biology.
Within the broader investigation of Annexin V staining protocols for flow cytometry, the precise configuration of the flow cytometer and the definition of acquisition parameters are critical steps that directly determine the validity, reproducibility, and accuracy of apoptosis data. This Application Note provides a detailed, step-by-step guide for instrument setup, grounded in the fundamental principles of phosphatidylserine (PS) detection. During early apoptosis, PS translocates from the inner to the outer leaflet of the plasma membrane, where it is bound by fluorescently conjugated Annexin V in a calcium-dependent manner [3] [1]. This assay is typically combined with a viability dye such as propidium iodide (PI) or 7-AAD to distinguish intact early apoptotic cells from late apoptotic and necrotic cells with compromised membranes [10] [6]. Proper instrument configuration is essential to accurately resolve these distinct cell populations, a task complicated by the need for multicolor analysis and the potential for spectral overlap. The following sections outline the necessary materials, a standardized setup procedure, and advanced troubleshooting to ensure researchers can generate high-quality, reliable data for drug efficacy studies and basic cellular research.
Principles of Annexin V Detection and Instrument Requirements
The core principle of this assay hinges on detecting the loss of plasma membrane asymmetry, a hallmark of early apoptosis. In viable cells, PS is restricted to the inner, cytoplasmic leaflet of the membrane. During apoptosis, this phospholipid is rapidly externalized, creating a specific binding site for Annexin V [1]. The binding is strictly dependent on calcium ions; therefore, buffers containing calcium chelators like EDTA must be scrupulously avoided during staining and analysis [5]. A viability dye is incorporated as a counterstain because Annexin V can also access PS in cells where the membrane integrity has been destroyed, leading to false positives for apoptosis. Dyes like PI are excluded by intact membranes but intercalate into the DNA of cells that have lost membrane integrity, identifying late apoptotic/necrotic cells [10].
The logical workflow for sample preparation and analysis, culminating in the critical step of instrument setup, is summarized in the diagram below.
For the flow cytometer itself, the instrument must be equipped with lasers and filters compatible with the chosen fluorochromes. Common Annexin V conjugates like FITC and PE are excited by the standard 488 nm blue laser [1] [6]. The viability dyes PI and 7-AAD are also excited by the 488 nm laser but are detected in different emission ranges. The table below specifies the typical laser and filter requirements for a standard Annexin V assay.
Table 1: Laser and Filter Configuration for Common Fluorochromes
| Fluorochrome | Excitation Laser | Emission Filter (Bandpass) | Primary Detection Purpose |
|---|---|---|---|
| Annexin V-FITC | 488 nm | 530/30 nm or FITC detector (FL1) | Early Apoptosis [1] [6] |
| Propidium Iodide (PI) | 488 nm | 585/42 nm or PE detector (FL2) | Late Apoptosis/Necrosis [10] [6] |
| Annexin V-PE | 488 nm | 585/42 nm or PE detector (FL2) | Early Apoptosis [5] [6] |
| 7-AAD | 488 nm | >650 nm or PerCP detector (FL3) | Late Apoptosis/Necrosis [5] [6] |
Research Reagent Solutions
A successful experiment relies on a specific set of reagents and materials, each serving a critical function. The following table details the essential components of the Annexin V staining workflow.
Table 2: Essential Reagents and Materials for Annexin V Staining
| Item | Function / Purpose | Critical Notes |
|---|---|---|
| Fluorochrome-conjugated Annexin V | Binds to externalized phosphatidylserine (PS) on apoptotic cells. | Calcium-dependent binding; available in FITC, PE, APC, and other conjugates [5] [1]. |
| Viability Dye (PI or 7-AAD) | Distinguishes cells with intact vs. compromised membranes. | PI and 7-AAD must not be washed out after staining; they are present during acquisition [5] [6]. |
| 1X Annexin Binding Buffer | Provides the calcium-containing environment necessary for Annexin V binding. | Must be free of EDTA or other calcium chelators [5] [10]. |
| Cell Staining Tubes | Suitable tubes for staining and acquisition. | 12 x 75 mm round-bottom tubes are commonly recommended [5]. |
| Fixable Viability Dye (FVD) | Optional; for experiments requiring subsequent intracellular staining. Allows cell fixation. | FVD eFluor 450 is not recommended for use with Annexin V kits [5]. |
Step-by-Step Instrument Setup and Acquisition Protocol
Preparation of Controls
Before starting the instrument setup, it is imperative to prepare the necessary control samples. These controls are required for setting up fluorescence compensation and for correctly positioning the quadrants on the dot plot.
- Unstained Cells: Cells resuspended in 1X Binding Buffer only. This sets the baseline autofluorescence [6].
- Annexin V Single-Stain Control: Cells stained with Annexin V conjugate only (e.g., Annexin V-FITC). This is best prepared using cells induced to undergo apoptosis (e.g., with staurosporine or camptothecin) to ensure a strong positive signal [3] [15].
- Viability Dye Single-Stain Control: Cells stained with the viability dye only (e.g., PI or 7-AAD). This can be prepared using fixed or heat-treated cells to ensure membrane permeability and a strong positive signal [6].
- Experimental Samples: Cells stained with both Annexin V conjugate and viability dye.
Cytometer Configuration and Voltage Optimization
With the controls prepared, proceed to configure the flow cytometer.
- Create a New Experiment: Set up a dot plot with Annexin V fluorescence (e.g., FITC) on the x-axis and viability dye fluorescence (e.g., PI) on the y-axis. Both axes should be displayed on a logarithmic scale.
- Adjust Photomultiplier Tube (PMT) Voltages:
- Load the unstained cell sample.
- Adjust the PMT voltages for the Annexin V and viability dye channels so that the cell population is positioned in the lower left quadrant (double-negative), but not compressed against the axes. The negative population should be clearly resolved from the background electronic noise with a clear separation, typically in the first decade of the log scale [37].
- Avoid the common mistake of setting voltages too low to minimize autofluorescence. Autofluorescence is a property of the cells, and detector sensitivity should be set to clearly distinguish the negative population from the positive, not to make the negative population appear "dim" [37].
Fluorescence Compensation Setup
Spectral overlap, where the emission of one fluorochrome is detected in the detector of another, is inevitable in multicolor flow cytometry. Compensation is the mathematical correction for this spillover [37].
- Load the Annexin V single-stain control. The positive population should be visible on the x-axis. Adjust the compensation value for the Annexin V channel into the viability dye channel until the median fluorescence intensity (MFI) of the positive and negative populations in the viability dye channel are equal.
- Load the viability dye single-stain control. The positive population should be visible on the y-axis. Adjust the compensation value for the viability dye channel into the Annexin V channel until the MFI of the positive and negative populations in the Annexin V channel are equal.
- Verify compensation by viewing the single-stain controls on the dot plot. A properly compensated sample will show the positive population aligned with the axis, without spreading into the double-positive or double-negative quadrants.
Acquisition and Data Collection
Once the instrument is configured and compensated, data acquisition can begin.
- Establish Gating Strategy:
- Use FSC-A vs. SSC-A to gate on the primary cell population, excluding debris and aggregates.
- Apply this gate to your experimental samples.
- Run and Record Data:
- Acquire a sufficient number of events; typically, 10,000 events within the live cell gate is a good minimum for statistical analysis.
- Critical Timing: Analyze the samples promptly, ideally within 1 hour of staining, due to the adverse effects on cell viability from prolonged dye exposure and the potential for ongoing apoptosis [5] [10].
The final data analysis involves interpreting the quadrant results, as depicted in the following diagram.
Advanced Configuration and Troubleshooting
For high-dimensional panels involving Annexin V and other markers, careful panel design is crucial. Place bright fluorochromes on low-abundance antigens and dimmer fluorochromes on highly expressed antigens to minimize spillover spreading [37]. When including surface or intracellular markers, the staining order is critical. Typically, surface staining is performed first, followed by viability dye (preferably a fixable dye if fixation is needed), then Annexin V staining, and finally intracellular staining if required, using specialized buffer sets [5].
Table 3: Troubleshooting Common Instrument Setup Issues
| Problem | Potential Cause | Solution |
|---|---|---|
| High background in unstained control | Excessive PMT voltage; cellular autofluorescence. | Re-titrate voltages using unstained cells. For autofluorescence, consider using fluorochromes excited by red lasers where autofluorescence is lower [37]. |
| Poor separation between positive and negative populations | Suboptimal antibody/dye titration; over- or under-compensation. | Titrate all reagents, including Annexin V and viability dye, to find the concentration that gives the best stain index [3] [37]. Re-run single-stain controls with brightly stained cells to reset compensation. |
| Low signal in apoptotic sample | Inadequate apoptosis induction; expired binding buffer; calcium chelators in buffer. | Include a robust positive control (e.g., staurosporine-treated cells). Prepare fresh 1X binding buffer and ensure it is free of EDTA [10] [1]. |
| Inconsistent results between runs | Laser power fluctuation; failure to record instrument settings. | Perform regular cytometer performance tracking with calibration beads. Save the instrument setup (PMT voltages, compensation) as a template for reproducibility [38]. |
Solving Common Problems and Enhancing Assay Accuracy
Accurate detection of apoptosis is fundamental for biomedical research, particularly in fields like oncology and drug development where quantifying cell death is essential for evaluating therapeutic efficacy [10]. The Annexin V flow cytometry assay is a powerful and widely adopted method for identifying apoptotic cells by detecting the externalization of phosphatidylserine (PS), a key early event in apoptosis [1]. However, the integrity of its results is heavily dependent on pre-analytical conditions. Minor technical errors during sample preparation can easily compromise membrane integrity, leading to a false-positive signal where healthy cells are misidentified as apoptotic [39] [3]. This application note details critical pre-analytical considerations and provides optimized protocols to safeguard the specificity and reliability of your Annexin V staining results.
The Science of Annexin V Staining and False Positive Pitfalls
Biochemical Principles of the Assay
In viable, healthy cells, the phospholipid phosphatidylserine (PS) is maintained exclusively on the inner leaflet of the plasma membrane by ATP-dependent enzymes [1]. During the early stages of apoptosis, this membrane asymmetry is lost, and PS is translocated to the outer leaflet, where it becomes accessible for binding [7]. Annexin V is a 35-36 kDa phospholipid-binding protein with a high affinity for PS. Its binding is calcium-dependent, requiring the presence of Ca²⁺ ions in the binding buffer [5] [1].
The standard assay utilizes a viability dye, most commonly Propidium Iodide (PI) or 7-AAD, to distinguish between different stages of cell death. These dyes are normally excluded from cells with intact plasma membranes. Therefore, the core interpretation of the assay is as follows:
- Viable Cells: Annexin V negative / PI negative.
- Early Apoptotic Cells: Annexin V positive / PI negative (intact membrane).
- Late Apoptotic/Necrotic Cells: Annexin V positive / PI positive (compromised membrane) [10] [6] [17].
Common Mechanisms of False Positives
False positives in Annexin V staining typically occur when the assay incorrectly labels a viable, non-apoptotic cell as Annexin V positive. The primary mechanisms include:
- Loss of Membrane Integrity from Handling: Rough or improper cell harvesting, washing, or pipetting can create transient pores or tears in the plasma membrane. This allows Annexin V to enter the cell and bind to PS located on the inner leaflet of the membrane, which is always present but normally inaccessible [3]. This is the most common pre-analytical error.
- Enzymatic Cell Detachment: Harsh trypsinization or prolonged use of other proteolytic enzymes to detach adherent cells can damage the cell surface, leading to PS exposure independent of apoptosis [1].
- Inappropriate Buffer Conditions: The use of buffers containing EDTA, EGTA, or other calcium chelators will inhibit the calcium-dependent binding of Annexin V to PS, potentially leading to false negatives. Conversely, using the wrong calcium concentration or incorrect pH can affect binding specificity [5].
- Delayed or Improper Analysis: Analyzing samples too long after staining or performing washes after the addition of PI can alter staining patterns and result in inaccurate data [5] [6].
Critical Pre-analytical Factors and Optimization Strategies
Cell Harvesting and Handling
The goal of cell harvesting is to obtain a single-cell suspension while preserving perfect plasma membrane integrity.
- Adherent Cells: It is critical to first collect the culture supernatant, as it may contain dead and apoptotic cells that have detached spontaneously [3]. For the remaining adherent cells, use gentle, non-enzymatic dissociation buffers containing low concentrations of EDTA (e.g., 1-5 mM) where possible, and limit incubation time [10]. Avoid scraping, as this method directly shears cells.
- Suspension Cells: Centrifuge cells at low speeds (e.g., 300–500 x g) and resuspend pellets by gently flicking the tube or using a wide-bore pipette tip to minimize shear forces [10] [7]. Consistently using cold buffers and working on ice can help stabilize the membrane, though staining steps themselves are performed at room temperature.
Buffer Composition and Reagent Quality
The binding buffer is not merely a diluent; it is a critical component for specific signal detection.
- Calcium is Essential: Always use a HEPES-based binding buffer containing a final concentration of 2.5 mM CaCl₂ [6] [17]. Scrupulously avoid contaminating your samples with any PBS or other buffers that contain EDTA or other calcium chelators during the washing steps prior to resuspension in Annexin Binding Buffer [5].
- Reagent Freshness: Prepare binding buffer fresh or aliquot and store it appropriately to avoid contamination. Confirm that your Annexin V conjugates and viability dyes have been stored correctly and are not past their expiration dates.
Controls are Non-Negotiable
Robust controls are the cornerstone of any reliable flow cytometry experiment and are indispensable for verifying staining specificity and setting up accurate flow cytometry quadrants.
Table 1: Essential Controls for Annexin V Staining
| Control Type | Purpose | Interpretation |
|---|---|---|
| Unstained Cells | To assess cellular autofluorescence and set voltage thresholds. | Baseline fluorescence. |
| Single-Stained Controls | Cells stained with Annexin V only or PI only. | Critical for setting fluorescence compensation on the flow cytometer to correct for spectral overlap [6]. |
| Viability Control | Untreated, healthy cells. | Determines the baseline level of spontaneous apoptosis and necrosis in the population [6]. |
| Induced Apoptosis Control | Cells treated with an apoptosis inducer (e.g., Staurosporine, Camptothecin) [3]. | Provides a true positive population for establishing the Annexin V positive gate and validating protocol performance. |
| Specificity (Blocking) Control | Pre-incubate cells with an excess of unlabeled Annexin V before adding labeled Annexin V. | Unlabeled Annexin V blocks PS binding sites. A significant reduction in fluorescence confirms staining specificity [6]. |
Recommended Protocols for Minimizing False Positives
The following protocols integrate the critical considerations outlined above to maximize data fidelity.
Standard Annexin V/PI Staining Protocol for Suspension Cells
This protocol is adapted from industry-leading sources [5] [6] [17].
Materials:
- 1X Annexin V Binding Buffer: 10 mM HEPES, 140 mM NaCl, 2.5 mM CaCl₂, pH 7.4.
- Fluorochrome-conjugated Annexin V (e.g., FITC, PE).
- Propidium Iodide (PI) Stock Solution (e.g., 50 µg/mL) or 7-AAD.
- Cold Phosphate-Buffered Saline (PBS), without Ca²⁺/Mg²⁺ and without EDTA.
Procedure:
- Harvest & Wash: Gently pellet cells (300–500 x g for 5 minutes). Carefully decant the supernatant and resuspend the cell pellet in cold PBS. Repeat this wash one more time.
- Resuspend in Binding Buffer: After the second wash, thoroughly decant the PBS supernatant. Resuspend the cell pellet in 1X Annexin V Binding Buffer at a density of 1–5 x 10⁶ cells/mL.
- Stain: Transfer 100 µL of the cell suspension (containing 1–5 x 10⁵ cells) to a flow cytometry tube. Add 5 µL of Annexin V conjugate and 2-5 µL of PI solution [6]. Gently vortex or tap the tube to mix.
- Incubate: Incubate at room temperature for 15 minutes in the dark.
- Analyze: After incubation, add 400 µL of 1X Annexin V Binding Buffer to each tube. Do not wash the cells after staining, as this can cause loss of cells or alter the PI staining [6] [7]. Analyze by flow cytometry immediately (within 1 hour).
Protocol for Adherent Cells with Fixable Viability Dye (FVD)
For adherent cells, combining Annexin V with a fixable viability dye allows for intracellular staining post-fixation, providing greater experimental flexibility [5].
Materials:
- All materials from the standard protocol, plus a Fixable Viability Dye (FVD) such as eFluor 660 or 780. Note: FVD eFluor 450 is not recommended for use with Annexin V kits [5].
Procedure:
- Harvest Supernatant: Collect the culture media containing any detached cells into a tube.
- Gently Detach Adherent Cells: Use a gentle, non-enzymatic cell dissociation buffer. Briefly rinse the culture vessel and combine these cells with the supernatant collected in step 1.
- Wash: Wash the combined cells twice with cold, azide-free, and protein-free PBS.
- Viability Stain: Resuspend the cell pellet in PBS at 1–10 x 10⁶ cells/mL. Add 1 µL of FVD per 1 mL of cells and vortex immediately. Incubate for 30 minutes at 2–8°C in the dark.
- Wash and Stain for Annexin V: Wash cells twice with a standard flow cytometry staining buffer to remove unbound FVD. Then, wash once with 1X Annexin V Binding Buffer. Resuspend the final pellet in binding buffer and proceed with Annexin V staining as described in the standard protocol (Steps 3-5) [5].
The Scientist's Toolkit: Essential Research Reagent Solutions
Table 2: Key Reagents for Annexin V Apoptosis Detection
| Reagent / Kit | Function / Key Feature | Example Catalog Numbers |
|---|---|---|
| Annexin V, FITC conjugate | Binds externalized PS; widely compatible with blue laser-equipped cytometers. | Cat. No. 556420 [6] |
| Annexin V, PE conjugate | Bright fluorochrome alternative to FITC. | Cat. No. 556421 [6] |
| Propidium Iodide (PI) | Membrane-impermeable DNA dye; labels dead/late apoptotic cells. | Cat. No. 556463 [6] |
| 7-AAD Viability Stain | Viability dye alternative to PI; used with Annexin V-PE. | Cat. No. 555816 [6] |
| 10X Annexin V Binding Buffer | Provides optimal calcium and pH for specific Annexin V binding. | Cat. No. 556454 [6] |
| Fixable Viability Dyes (FVD) | Allows for subsequent cell fixation and intracellular staining. | FVD eFluor 660 (Cat. No. 65-0864-14) [5] |
| Annexin V Apoptosis Detection Kit | Complete solution with Annexin V, viability dye, and buffers. | NBP2-29373 (Bio-Techne) [17] |
Experimental Workflow and Data Interpretation
The entire process, from cell culture to data analysis, must be carefully planned and executed to avoid artifacts. The following diagram summarizes the critical steps and decision points.
Adherence to this workflow, combined with the rigorous application of the pre-analytical factors and controls discussed, will significantly enhance the reliability of apoptosis data generated using the Annexin V assay.
Optimizing Annexin V Titration for Different Cell Lines
Within the broader context of optimizing Annexin V staining for flow cytometry, titration of the Annexin V reagent is a critical yet frequently overlooked step. The translocation of phosphatidylserine (PS) from the inner to the outer leaflet of the plasma membrane is a hallmark early event in apoptosis [3]. Annexin V, a 35-36 kDa calcium-dependent phospholipid-binding protein, binds with high affinity to this exposed PS, allowing for the detection of apoptotic cells when conjugated to a fluorochrome [11]. However, the density of PS exposure can vary significantly between different cell types and even between different treatment conditions [3]. Using a standardized, suboptimal concentration of Annexin V can lead to poor separation between positive and negative populations, increased background staining, and ultimately, unreliable data. This application note provides a detailed protocol and data for optimizing Annexin V titration to achieve maximum assay sensitivity and specificity across diverse cell lines.
The Critical Need for Titration
A primary challenge in Annexin V-based apoptosis detection is achieving maximal specific binding to apoptotic cells while minimizing non-specific background signal in healthy cells. The goal of titration is to identify the Annexin V concentration that provides the maximum separation between the positive and negative populations in an apoptotic sample and, simultaneously, the lowest non-specific binding in a healthy cell population [3].
This optimization is particularly crucial for adherent cell lines, which can be more susceptible to mechanical stress during harvesting, potentially compromising membrane integrity and leading to false-positive Annexin V staining [40]. Research has demonstrated that the method of cell harvesting can drastically influence the results of apoptosis analysis. A study comparing enzymatic detachment (trypsinization) with mechanical methods (scraping or wash-down) found that in three out of six cancer cell lines tested (HT 29, PANC 1, and A-673), mechanical detachment resulted in over 49% of cells being falsely identified as apoptotic due to membrane damage [40]. Titrating the reagent ensures that the assay is robust enough to distinguish true apoptosis from such artifacts.
Materials and Reagents
Table 1: Essential Reagents and Materials for Annexin V Titration
| Item | Function/Description | Examples/Specifications |
|---|---|---|
| Cells | Provide biological context for optimization. Requires both healthy and apoptosis-induced cells. | ~7 million apoptotic cells; ~7 million healthy cells [3]. |
| Annexin V Conjugate | The reagent to be titrated; binds exposed phosphatidylserine. | Various fluorochrome conjugates (e.g., FITC, PE, APC, Pacific Blue) [5] [11]. |
| Apoptosis Inducer | Generates a positive control population of apoptotic cells. | Staurosporine (e.g., Sigma, S4400) or Camptothecin (e.g., Sigma, C9911) [3]. |
| Binding Buffer | Provides calcium-dependent binding environment; must be calcium-containing and EDTA-free. | 10 mM HEPES, 140 mM NaCl, 2.5 mM CaCl₂, pH 7.4 [5] [10]. |
| Viability Stain | Distinguishes early apoptotic (viable) from late apoptotic/necrotic (non-viable) cells. | Propidium Iodide (PI), 7-AAD, or SYTOX Green [5] [11] [7]. |
| Flow Cytometry Tubes | Sample holder for analysis. | 12 x 75 mm round-bottom tubes [5]. |
The Scientist's Toolkit: Key Research Reagent Solutions
Table 2: Key Reagent Solutions for Annexin V Assays
| Reagent Category | Specific Example | Critical Function in the Assay |
|---|---|---|
| Annexin V Conjugates | Annexin V, Alexa Fluor 488 | Binds to externalized phosphatidylserine; signal brightness and laser compatibility vary by conjugate [11]. |
| Viability Dyes | Propidium Iodide (PI) | Membrane-impermeant DNA dye; identifies cells with compromised membranes (late apoptotic/necrotic) [7] [10]. |
| Fixable Viability Dyes | FVD eFluor 780 | Covalently labels amine groups in non-viable cells; allows for subsequent fixation/permeabilization steps [5]. |
| Binding Buffers | 10X Annexin Binding Buffer | Provides the calcium-rich environment essential for specific Annexin V-PS interaction; must be free of EDTA [5] [11]. |
| Apoptosis Induction Agents | Staurosporine | A broad-spectrum protein kinase inhibitor used as a reliable positive control to induce apoptosis in cell cultures [3]. |
Detailed Titration Protocol
Pre-Titration Preparation
- Induce Apoptosis: Generate a positive control sample by treating cells with a known apoptosis inducer. For instance, treat cells with 1-10 µM Staurosporine or Camptothecin for 4-6 hours [3] [11]. Include a parallel culture of untreated, healthy cells.
- Harvest Cells Gently: This step is crucial to avoid mechanical damage that causes false positives.
- For adherent cells, first collect the media containing any floating (often dead) cells. Then, detach the adherent cells gently using a non-enzymatic method (e.g., EDTA) or brief, controlled trypsinization, as it has been shown to cause less membrane damage than scraping in susceptible cell lines [40]. Combine the floating and detached cells.
- For suspension cells, collect the culture directly [3] [10].
- Wash and Resuspend: Wash the harvested cells twice with cold PBS. After the final wash, resuspend the cell pellets in Annexin V Binding Buffer. You will need approximately 7 million apoptotic cells and 7 million healthy cells, each in a final volume of 700 µL of binding buffer [3]. This prepares two master mixes at a concentration of ~1 x 10⁷ cells/mL.
Titration Procedure
- Prepare Staining Tubes: Label twelve flow cytometry tubes. Set up two rows: one for apoptotic cells and one for healthy cells.
- Aliquot Cells: Pipette 100 µL of the apoptotic cell master mix into each of six tubes. Repeat with the healthy cell master mix into another six tubes.
- Add Annexin V: Add varying volumes of the fluorochrome-conjugated Annexin V stock to the tubes. A suggested range is 0.1 µL, 0.2 µL, 0.5 µL, 1.0 µL, 2.0 µL, and 5.0 µL [3]. Gently vortex the tubes to mix.
- Incubate: Incubate the cells at room temperature for 15 minutes in the dark [5].
- Add Viability Stain and Analyze: After incubation, add 200-400 µL of binding buffer containing a viability dye like DAPI (40 ng/mL final concentration) or Propidium Iodide to each tube [3]. Do not wash the cells after adding the viability dye [5]. Analyze the samples immediately on a flow cytometer.
The workflow for the titration experiment is summarized in the following diagram:
Data Analysis and Interpretation
Gating Strategy and Optimization Criteria
When analyzing the titration samples, create a dot plot with Annexin V fluorescence on one axis (e.g., FITC) and the viability dye (e.g., PI) on the other. The optimal concentration is identified by analyzing the apoptotic cell sample:
- The goal is to find the concentration that provides the clearest separation between the Annexin V-negative (viable) and Annexin V-positive (apoptotic) populations, typically measured by the distance between the medians of the two peaks [3].
- A good titration will show a bright, distinct positive population with minimal spread into the negative region.
Simultaneously, analyze the healthy cell sample:
- The optimal concentration should yield the lowest nonspecific binding, meaning the healthy cell population remains tightly clustered in the Annexin V-negative quadrant [3].
- High Annexin V signal in the healthy control indicates non-specific staining, and a lower concentration should be selected.
Expected Results and Data Presentation
The effect of titration on key assay parameters can be quantified as shown in the table below.
Table 3: Quantitative Assessment of Titration Concentrations
| Annexin V Amount (µL) | Signal in Apoptotic Cells (Mean Fluorescence Intensity) | Background in Healthy Cells (% Annexin V+) | Staining Index / Separation Score |
|---|---|---|---|
| 0.1 | Low | Very Low | Poor |
| 0.2 | Moderate | Low | Good |
| 0.5 | High | Low | Optimal |
| 1.0 | High | Moderate | Good |
| 2.0 | Saturated | High | Poor |
| 5.0 | Saturated | Very High | Unacceptable |
The following diagram illustrates the logical decision-making process for selecting the optimal working concentration based on the flow cytometry data.
Troubleshooting and Technical Notes
- Calcium is Critical: The binding of Annexin V to PS is strictly calcium-dependent. Always use a calcium-containing binding buffer and avoid buffers with chelators like EDTA or EGTA, which will abolish binding [5] [11].
- Handle with Care: Rough handling during harvesting, pipetting, or centrifugation can create holes in healthy cell membranes, allowing Annexin V to enter and bind to PS on the inner leaflet, causing false-positive results [3] [40].
- Time is of the Essence: Annexin V staining is a functional live-cell assay. Cells should be analyzed by flow cytometry as soon as possible after staining (typically within 1 hour). If a delay is unavoidable, keep samples on ice and protected from light [3] [5].
- Include Appropriate Controls: For a reliable experiment, include unstained cells, single-stained controls (Annexin V only and viability dye only) for compensation, and both induced (apoptotic) and non-induced (healthy) cell population controls [3] [10].
Addressing Calcium Sensitivity and EDTA Contamination
Annexin V staining is a cornerstone technique in flow cytometry for the detection of apoptotic cells, relying on the protein's high affinity for phosphatidylserine (PS). This binding event is strictly calcium-dependent, a characteristic that renders the assay highly susceptible to interference from calcium-chelating agents, most notably EDTA and EGTA [1] [41]. Within the context of apoptosis detection and broader cell health analysis, understanding and mitigating this vulnerability is paramount for data accuracy. Contamination from such chelators, often introduced during cell preparation (e.g., via trypsinization) or through residual reagents, can lead to false-negative results by preventing the essential Annexin V-PS interaction [42] [41]. This application note details the mechanistic basis of this interference and provides validated protocols to identify, prevent, and resolve EDTA contamination, ensuring the reliability of Annexin V-based assays.
The Critical Role of Calcium and Mechanisms of Interference
Calcium-Dependent Binding Mechanism
The externalization of phosphatidylserine (PS) from the inner to the outer leaflet of the plasma membrane is a well-established hallmark of early apoptosis. Annexin V is a 35-36 kDa phospholipid-binding protein that recognizes and binds to exposed PS with high affinity. The binding site of Annexin V requires calcium ions (Ca²⁺) to form a bridging complex with the negatively charged head groups of PS [1]. The 10X Annexin V binding buffer, typically composed of 0.1 M HEPES (pH 7.4), 1.4 M NaCl, and 25 mM CaCl₂, is specifically formulated to provide the optimal ionic and calcium environment for this interaction to occur [43] [6]. Any factor that reduces the availability of free calcium ions directly compromises the binding efficiency.
EDTA (Ethylenediaminetetraacetic acid) is a potent chelator of divalent cations like Ca²⁺. Its ubiquitous use in cell biology presents multiple potential points of contamination in an Annexin V staining workflow:
- Cell Dissociation: Trypsin solutions commonly contain EDTA to enhance cell detachment by chelating calcium that mediates cell-adhesion proteins [44] [41].
- Anticoagulants: Blood samples collected in EDTA-coated tubes can introduce chelators if the lymphocytes are subsequently used for apoptosis assays [45].
- Cell Culture Media: Some media formulations include EDTA as a stabilizer for certain components.
- Wash Buffers: PBS or other buffers lacking added calcium can effectively dilute the available calcium in the binding buffer [41].
The core problem is that the introduction of EDTA, even in small quantities, sequesters the Ca²⁺ in the binding buffer, making it unavailable for the Annexin V-PS binding reaction, thereby abolishing or severely diminishing the apoptotic signal.
Experimental Data and Impact Assessment
The quantitative impact of EDTA contamination on Annexin V staining is profound. The table below summarizes the key experimental observations and their implications for data interpretation.
Table 1: Impact of EDTA Contamination on Annexin V Staining Outcomes
| Experimental Observation | Impact on Staining | Manifestation in Flow Cytometry |
|---|---|---|
| Use of trypsin with EDTA for adherent cell detachment [44] [41] | False Negatives | Drastic reduction or complete loss of Annexin V-positive population. |
| Presence of EDTA in wash buffers or PBS [41] | Reduced Signal Intensity | Decreased mean fluorescence intensity (MFI) of Annexin V, potentially shifting positive cells into the negative gate. |
| Attempting to use PBS instead of dedicated Annexin V Binding Buffer [41] | Signal Abolishment | Absence of positive signal, as PBS lacks the requisite Ca²⁺ concentration. |
| Inadequate washing post-EDTA trypsinization [44] | Inconsistent & Unreliable Staining | High well-to-well and experiment-to-experiment variability. |
Recommended Protocols for Mitigation and Recovery
Protocol for Adherent Cell Harvesting to Minimize EDTA Effects
This protocol is designed to safely harvest adherent cells while preserving the integrity of the Annexin V staining.
Materials:
- Appropriate cell culture ware
- EDTA-free dissociation reagent (e.g., Accutase) [42] or trypsin without EDTA
- Complete culture medium (with serum to inhibit trypsin)
- 1X PBS, without Ca²⁺/Mg²⁺
- 1X Annexin V Binding Buffer
Procedure:
- Collect Supernatant: Gently collect the culture medium containing any detached (floating) cells, which often include a enriched population of apoptotic cells. Centrifuge and retain the cell pellet [44] [41].
- Gentle Cell Detachment:
- Neutralize and Pool: Neutralize the dissociation reagent with a volume of complete medium (with serum). Combine these cells with the pellet from the supernatant collected in Step 1.
- Thorough Washing: Centrifuge the pooled cells and wash them twice with a generous volume (e.g., 5-10 mL) of PBS or plain culture medium to dilute residual EDTA or trypsin [44].
- Final Resuspension: Resuspend the final cell pellet in 1X Annexin V Binding Buffer at a concentration of 1-5 x 10⁶ cells/mL for staining [5] [6].
Protocol for Salvaging EDTA-Exposed Cells
If cells have already been exposed to EDTA, this salvage protocol can often recover the ability to stain.
Procedure:
- Pellet Cells: Collect the EDTA-exposed cells by centrifugation.
- Intensive Washing: Wash the cell pellet three times with a large volume (e.g., 10 mL) of pre-warmed PBS or calcium-free buffer. This step is critical to physically remove the EDTA.
- Calcium Replenishment: Resuspend the final cell pellet in a standard 1X Annexin V Binding Buffer. The high concentration of CaCl₂ (2.5 mM in 1X buffer) in the binding buffer will restore the free calcium needed for staining.
- Proceed with Staining: Continue with the standard Annexin V and viability dye staining protocol [43] [6].
Standardized Annexin V Staining Protocol
This is the core staining procedure once EDTA-free conditions are ensured.
Materials:
- Fluorochrome-conjugated Annexin V (e.g., FITC, PE, APC)
- Viability dye (e.g., Propidium Iodide (PI) or 7-AAD)
- 10X Annexin V Binding Buffer
- Flow cytometry tubes
Procedure:
- Prepare Buffer: Dilute 10X Binding Buffer to 1X with distilled water [5].
- Wash Cells: After harvesting and washing, resuspend the cell pellet in 1X Binding Buffer at 1-5 x 10⁶ cells/mL.
- Stain Cells: Transfer 100 µL of cell suspension (~1-5 x 10⁵ cells) to a flow cytometry tube. Add 5 µL of Annexin V conjugate and 5 µL of viability dye (e.g., PI or 7-AAD) [43] [6].
- Incubate: Gently vortex the tubes and incubate for 15 minutes at room temperature (25°C) in the dark [43].
- Analyze: After incubation, add 400 µL of 1X Binding Buffer to each tube and analyze by flow cytometry within 1 hour [43] [6].
Diagram 1: Experimental workflow for EDTA-free Annexin V staining
The Scientist's Toolkit: Essential Research Reagent Solutions
The following table lists key reagents critical for successfully executing Annexin V assays free from calcium-related artifacts.
Table 2: Key Reagents for Robust Annexin V Staining
| Reagent | Function & Role | Critical Specification |
|---|---|---|
| Annexin V Binding Buffer (10X) [43] [6] | Provides optimal calcium and salt concentration (25 mM CaCl₂) for specific Annexin V-PS binding. | Must be free of EDTA/EGTA. Do not substitute with PBS. |
| EDTA-Free Dissociation Reagent (e.g., Accutase) [42] | Gently dissociates adherent cells without chelating calcium, preserving PS binding sites. | Verified absence of EDTA, trypsin, or other chelators. |
| Viability Dye (PI, 7-AAD) [43] [1] [6] | Distinguishes early apoptotic (viable dye-negative) from late apoptotic/necrotic (viable dye-positive) cells. | Must be added in calcium-containing binding buffer; do not wash out. |
| Calcium Indicator Dyes (e.g., Indo-1, Fluo-4) [46] [45] | For parallel calcium flux assays; confirms cellular responsiveness to calcium-dependent signaling. | Cell-permeant AM esters for easy loading (e.g., Indo-1 AM). |
| Fc Receptor Blocking Antibody [45] | Reduces non-specific antibody binding in complex primary cells (e.g., splenocytes, PBMCs). | Use in azide-free, protein-free PBS before Annexin V staining. |
Calcium sensitivity is an inherent and defining property of the Annexin V assay. Vigilance against EDTA contamination is not merely a troubleshooting step but a fundamental requirement for experimental validity. By understanding the mechanism of interference, employing EDTA-free reagents like Accutase for cell dissociation, implementing rigorous washing steps, and using only validated Annexin V Binding Buffers, researchers can confidently generate accurate, reproducible, and meaningful data on apoptosis and cell death. Adherence to these detailed protocols ensures that the critical early apoptotic population is accurately identified, thereby strengthening conclusions in drug development and basic cell biology research.
Within the broader context of optimizing Annexin V staining for flow cytometry, this application note addresses a common technical challenge: the compromise of data integrity due to propidium iodide (PI) binding to cytoplasmic RNA. In a standard Annexin V/PI apoptosis assay, PI is used as a viability probe to distinguish late apoptotic and necrotic cells by staining DNA in cells with compromised membranes. However, without proper treatment, PI also binds to double-stranded RNA, resulting in elevated background fluorescence and reduced resolution between cell populations [47]. This technical issue can obscure the accurate quantification of early apoptotic cells, a critical parameter in therapeutic drug development.
The integration of RNase treatment into the staining protocol provides a targeted solution to this problem. By hydrolyzing cellular RNA, RNase eliminates non-specific PI binding sites, thereby ensuring that the subsequent PI signal is derived specifically from nuclear DNA. This modification is particularly crucial for research requiring precise cell cycle analysis concurrent with apoptosis detection or for studies involving cell types with high RNA content [47]. This protocol details a refined methodology that incorporates RNase treatment to enhance the specificity and reliability of cellular staining in Annexin V-based assays.
The Scientist's Toolkit: Essential Research Reagents
The successful implementation of this modified protocol requires the following key reagents. Their specific functions are outlined in the table below.
Table 1: Key Research Reagents and Their Functions
| Reagent | Function/Explanation |
|---|---|
| Propidium Iodide (PI) | A membrane-impermeant DNA fluorochrome that intercalates stoichiometrically with double-stranded DNA for cell cycle analysis and necrotic cell identification. It also binds to RNA, necessitating RNase treatment [47]. |
| Ribonuclease A (RNase A) | An enzyme that hydrolyzes cellular RNA. Its inclusion is essential to eliminate background signal from PI binding to double-stranded RNA, ensuring the PI fluorescence signal is specific to DNA content [47]. |
| Annexin V Conjugate | A calcium-dependent phospholipid-binding protein conjugated to a fluorochrome (e.g., FITC, PE). It specifically binds to phosphatidylserine (PS) exposed on the outer leaflet of the plasma membrane in early apoptotic cells [6] [3] [1]. |
| Binding Buffer | Provides the appropriate calcium-containing, physiological environment (e.g., HEPES, NaCl) necessary for the specific binding of Annexin V to phosphatidylserine. Buffers containing EDTA or other calcium chelators must be avoided [6] [5]. |
| Fixative (e.g., 70% Ethanol) | Used to permeabilize the cell membrane, allowing RNase and PI access to the intracellular compartment. Ethanol fixation is ideal for DNA staining as it provides low CV (Coefficient of Variation) profiles [47] [48]. |
Methodology: RNase Treatment Protocol for PI Staining
The following diagram illustrates the key stages of the protocol, highlighting how RNase treatment specifically resolves the issue of cytoplasmic PI staining to clarify the final flow cytometry analysis.
Detailed Step-by-Step Procedure
This protocol is adapted for use with cells that will be fixed, which is a prerequisite for the RNase treatment step [47] [48]. Note: If performing a classic Annexin V/PI assay on unfixed cells to distinguish live, early apoptotic, and late apoptotic/necrotic populations, RNase treatment is not required or recommended, as it would compromise cell viability and the assay's principle.
Cell Harvesting and Fixation
- Harvest the cells (approximately 1-5 x 10^6) using a standard method and wash once with phosphate-buffered saline (PBS) [47] [48].
- Centrifuge the cells gently (e.g., 300-400 x g for 5 minutes) and carefully decant the supernatant.
- While gently vortexing the cell pellet, slowly add 1-3 mL of cold 70% ethanol drop-wise to fix and permeabilize the cells. Note: 70% ethanol should be prepared with distilled water, not PBS, to prevent protein precipitation [47].
- Fix the cells for a minimum of 30 minutes at 4°C. Fixed cells can be stored in ethanol for several weeks at 4°C for future analysis [47] [48].
RNase Treatment
- Centrifuge the fixed cells (e.g., 300 x g for 5 minutes) and thoroughly decant the ethanol.
- Wash the cell pellet twice with PBS to remove residual ethanol.
- Resuspend the cell pellet in 0.5-1 mL of PBS.
- Add RNase A to a final concentration of 100 µg/mL [47]. For example, add 50 µL of a 100 µg/mL stock solution to the cell suspension.
- Incubate the mixture for 15-30 minutes at 37°C or at room temperature. This step is critical for digesting RNA and eliminating its contribution to the PI signal.
Propidium Iodide Staining and Analysis
- Add PI to the RNase-treated cell suspension. A recommended starting concentration is 50 µg/mL (e.g., add 200 µL of a 50 µg/mL stock solution) [47]. The optimal concentration should be determined empirically for specific cell types to ensure DNA binding sites are saturated.
- Incubate the cells for 15-30 minutes at room temperature in the dark.
- Analyze the stained cells by flow cytometry promptly. Use a 488 nm laser for excitation and measure PI fluorescence emission at approximately 605 nm [47].
Expected Results and Data Interpretation
With successful RNase treatment, the flow cytometry analysis should yield a clear DNA histogram with a low coefficient of variation (CV) for the G0/G1 peak, ideally below 5% [47] [48]. This allows for precise discrimination of cells in different cell cycle phases (G0/G1, S, and G2/M) based on DNA content. The removal of RNA-mediated PI fluorescence significantly reduces background noise, leading to more accurate and reliable data.
Table 2: Troubleshooting Common Issues in RNase/PI Staining
| Problem | Potential Cause | Recommended Solution |
|---|---|---|
| High Background/Noise | Inadequate RNase treatment or activity. | Ensure RNase is DNase-free; confirm concentration and incubation time; use fresh RNase solution [47] [48]. |
| Broad Peaks (High CV) | Poor cell fixation or cell clumping. | Ensure cells are in a single-cell suspension before adding ethanol; add ethanol drop-wise while vortexing [47] [48]. |
| Weak PI Fluorescence | Insufficient PI concentration or degradation. | Titrate PI to achieve saturating conditions for your cell type; protect PI solution from light [48]. |
The integration of an RNase treatment step is a simple yet powerful modification to protocols utilizing propidium iodide staining. By ensuring the specificity of PI for DNA, this method significantly enhances the resolution of flow cytometric analysis for both cell cycle studies and complex apoptosis assays. This refinement provides researchers and drug development professionals with a more robust tool for generating high-quality, reproducible data, ultimately contributing to more accurate assessments of cellular responses to experimental treatments.
Handling Challenges with Large Cells and Primary Cell Cultures
Within the broader scope of thesis research on Annexin V staining flow cytometry protocols, a significant practical challenge involves adapting standard methods for non-standard cell types. This application note addresses the specific difficulties encountered when working with large cells and sensitive primary cell cultures in apoptosis detection. The integrity of these cells is easily compromised during harvesting and processing, leading to inaccurate Annexin V staining and false-positive results. This document provides detailed, optimized protocols to ensure reliable and quantitative apoptosis data for researchers and drug development professionals.
Understanding the Specific Challenges
Challenges with Large Cells
Flow cytometers and cell sorters were originally designed with blood cells (typically under 20 µm) in mind. Sorting larger cells requires careful consideration of the instrument's physical parameters to avoid clogs and ensure efficient droplet formation for sorting [49].
- Flow Cell Tip Compatibility: A fundamental rule is that a particle will clog an orifice of a smaller diameter. Therefore, the flow tip must be larger than the cell. As a practical guideline, a tip diameter 4-5 times larger than the cell is recommended. While 100 µm tips are common, tips up to 200 µm can be specially ordered for very large cells [49].
- Sheath Pressure and Sort Rate: Using a larger flow tip necessitates a reduction in sheath pressure (e.g., to 5-7 p.s.i. for a 200 µm tip) to conserve sheath fluid and stabilize droplet formation. This lower pressure reduces the oscillator frequency, which in turn lowers the maximum cell sort rate. At an oscillation of 7,000 Hz, the theoretical maximum sort rate is only about 700 cells per second, which can make sorting rare populations time-consuming and impractical without pre-enrichment strategies [49].
- Sort Optimization and Validation: Optimizing the instrument for large cells requires using calibration particles of a similar size. Since most commercial microspheres are small, naturally occurring particles like pollen or spores (up to 100 µm) can be stained and used as effective, large calibration standards [49].
Challenges with Primary Cell Cultures
Primary cells are notoriously fragile and require gentler handling than established cell lines to preserve membrane integrity, a critical factor for accurate Annexin V staining.
- Membrane Integrity: Rough harvesting techniques can puncture the plasma membrane of healthy cells, allowing Annexin V to access phosphatidylserine (PS) on the inner leaflet and causing false-positive signals for apoptosis. Gentle detachment using non-enzymatic methods (e.g., EDTA) is crucial [10] [3].
- Basal Apoptosis: Primary cell populations often have a higher basal level of apoptosis and necrosis. It is essential to include an untreated control in every experiment to establish this baseline, which must be subtracted from the treated population to determine the induced apoptosis level accurately [6].
- Cellular Heterogeneity: Primary cultures, including neural cells, are often highly heterogeneous. This complexity can confound experimental readouts, making careful panel design and gating strategies essential for resolving specific cell populations of interest [50].
Optimized Protocols for Challenging Samples
Annexin V Staining Protocol for Primary and Sensitive Cells
The following protocol is optimized for primary cells and other sensitive cultures, emphasizing steps that preserve membrane integrity [5] [6] [3].
Table 1: Reagents and Materials for Annexin V Staining
| Item | Function | Notes |
|---|---|---|
| Fluorochrome-conjugated Annexin V | Binds exposed phosphatidylserine (PS) on apoptotic cells | Calcium-dependent binding [36] |
| Propidium Iodide (PI) or 7-AAD | Membrane-impermeable DNA dye; indicates loss of membrane integrity | Do not wash out after adding; analyze immediately [5] [6] |
| 10X Binding Buffer | Provides calcium and optimal pH for Annexin V binding | Dilute to 1X; avoid EDTA-containing buffers [5] |
| Azide/Protein-free PBS | Wash buffer for use with fixable viability dyes | Prevents non-specific staining [5] |
| Fixable Viability Dye (FVD) | Distinguishes live from dead cells; compatible with fixation | Do not use FVD eFluor 450 with Annexin V kits [5] |
Experimental Procedure:
Cell Harvesting:
- For adherent primary cultures, first collect the culture medium, which may contain dead or floating cells, into a tube [3].
- Gently wash the layer of remaining adherent cells with cold PBS.
- Detach the cells using a gentle, non-enzymatic method (e.g., low-concentration EDTA or cell scrapers) to preserve membrane integrity. Avoid trypsin, which can digest surface epitopes and damage the membrane [10] [50]. Combine all cells into one tube.
Washing and Staining:
- Centrifuge the cell suspension at 300-500 x g for 5 minutes. Decant the supernatant carefully [6].
- Resuspend the cell pellet in 1X Binding Buffer at a concentration of 1-5 x 10^6 cells/mL [5].
- Transfer 100 µL of cell suspension to a flow cytometry tube.
- Add 5 µL of fluorochrome-conjugated Annexin V. Gently vortex or tap the tube to mix [5] [6].
- Incubate for 10-15 minutes at room temperature, protected from light [5].
Viability Staining and Analysis:
- Add 2 mL of 1X Binding Buffer and centrifuge to wash. Decant the supernatant.
- Resuspend the cells in 200 µL of 1X Binding Buffer.
- Add 5 µL of Propidium Iodide (PI) or 7-AAD Staining Solution. Do not wash after this step, as the dye must remain in the buffer during acquisition [5].
- Analyze by flow cytometry promptly, ideally within 1 hour, to prevent deterioration of the sample [6].
Experimental workflow for primary cells
Protocol Adaptation for Large Cells
When working with large cells, the standard protocol is modified primarily at the instrument setup level.
- Instrument Setup: Fit the flow cytometer or sorter with a large-bore flow tip (100 µm, 130 µm, 140 µm, or even 200 µm) that is 4-5 times the diameter of your cells [49].
- Sheath Pressure Adjustment: Lower the sheath pressure significantly (e.g., to 5-7 p.s.i.) to accommodate the larger tip and ensure stable droplet formation [49].
- System Optimization and Calibration: Use large, indestructible particles such as pollen or spores (or large microspheres if available) that are similar in size to your cells to optimize the droplet delay and other sort settings. This step is critical for achieving high sorting purity and recovery [49].
Troubleshooting and Data Interpretation
Common Pitfalls and Solutions
Table 2: Troubleshooting Common Issues
| Problem | Potential Cause | Solution |
|---|---|---|
| High background in untreated controls | Rough harvesting causing mechanical damage | Optimize gentle, non-enzymatic detachment methods [3] |
| Excessive debris in samples | Cell fragmentation from apoptosis or harsh processing | Use a defined gating strategy to exclude debris (see 3.2) [19] |
| Low Annexin V signal | Insufficient Annexin V reagent; calcium chelators present | Titrate Annexin V for optimal signal; ensure buffers contain Ca²⁺ and no EDTA [5] [3] |
| Unclear population separation | Suboptimal instrument compensation or voltage | Use single-stained controls for proper compensation [6] |
A Robust Gating Strategy for Apoptosis Assays
A critical step in analysis is correctly excluding debris, which can artificially inflate the "live" cell population. The following 3-step method is highly effective [19]:
- On the ungated file, create an Annexin V vs. PI plot and draw a region (R1) around the Double Negative (Annexin V-/PI-) population.
- Gate a FSC vs. SSC plot on R1. Draw a tight region (R2) around the subset of cells with low FSC, which constitutes "Debris."
- Invert the debris gate (R2) to create a "Not-Debris" gate. Use this "Not-Debris" gate for the final analysis on the Annexin V vs. PI plot to classify the true cell populations.
Gating strategy to exclude debris
Interpreting Results
After applying the correct gating strategy, cells can be categorized into four populations based on Annexin V and PI staining [10] [36]:
- Viable Cells: Annexin V negative / PI negative.
- Early Apoptotic Cells: Annexin V positive / PI negative (PS externalized, membrane intact).
- Late Apoptotic Cells: Annexin V positive / PI positive (PS externalized, membrane compromised).
- Necrotic Cells: Annexin V negative / PI positive (membrane damaged without PS externalization; can also be cells in terminal necrosis or mechanically damaged).
Successfully applying Annexin V flow cytometry to large cells and primary cultures hinges on acknowledging their unique demands. For large cells, this involves instrument-level modifications with larger flow tips and adjusted pressures. For primary cells, the focus must be on gentle handling throughout the workflow to preserve membrane integrity. By integrating the optimized protocols, rigorous gating strategies, and troubleshooting guidance outlined in this application note, researchers can obtain reliable, high-quality apoptosis data from these challenging but biologically critical samples, thereby enhancing the validity of their thesis research and drug development efforts.
Within the broader investigation of Annexin V staining protocols for flow cytometry, understanding the critical temporal aspects of the procedure is paramount for data integrity. The translocation of phosphatidylserine (PS) to the outer leaflet of the plasma membrane is a key event in early apoptosis, and Annexin V, a calcium-dependent phospholipid-binding protein, exploits this as a specific detection marker [3] [10]. The reliability of this detection, however, is highly dependent on a meticulously timed workflow. This application note details the essential timeline considerations, from cell harvesting to final flow cytometric analysis, to ensure the accurate quantification of apoptotic populations and minimize artifacts such as false positives or the loss of signal.
Critical Time Factors in the Experimental Workflow
The entire Annexin V staining procedure is a time-sensitive functional assay. The following table summarizes the key steps and their associated time constraints, which will be elaborated in the subsequent sections.
Table 1: Key Temporal Considerations in Annexin V Staining
| Phase | Step | Critical Time Consideration | Consequence of Deviation |
|---|---|---|---|
| Preparation | Cell Harvesting | Must be performed gently and rapidly. | Rough handling can mechanically damage healthy cells, allowing Annexin V to access internal PS and cause false positives [3]. |
| Preparation of 1X Binding Buffer | Prepare fresh as needed. | Buffer must contain calcium and be free of EDTA/chelators to enable Annexin V-PS binding [5]. | |
| Staining | Annexin V Incubation | 10-15 minutes at room temperature, protected from light [5]. | Under-staining reduces sensitivity; over-staining may increase non-specific binding. |
| Viability Dye (PI/7-AAD) Incubation | 5-15 minutes on ice or at room temperature; DO NOT WASH after adding [5]. | Washing after adding membrane-impermeant dyes like PI will remove the dye and eliminate the viability signal. | |
| Analysis | Flow Cytometry Acquisition | Analyze immediately, ideally within 1 hour [3], and no more than 4 hours after staining [5]. | Prolonged storage leads to a progressive loss of cell viability and membrane integrity, adversely affecting staining patterns and data accuracy [5]. |
The Staining to Analysis Window
A paramount rule in Annexin V assays is to minimize the delay between staining and analysis. Cells should be analyzed by flow cytometry as soon as possible after the staining incubation is complete [3]. It is strongly recommended to complete data acquisition within 1 to 4 hours of staining [5]. Stored samples must be kept at 2–8°C and protected from light during this window to slow down cellular processes and prevent photobleaching [5]. Exceeding this timeframe allows for the adverse effects of propidium iodide (PI) or 7-AAD on cell viability over prolonged periods and leads to a gradual deterioration of the sample, compromising the distinction between early apoptotic, late apoptotic, and necrotic populations.
Detailed Time-Conscious Staining Protocols
This section provides detailed methodologies for two common staining approaches, with an emphasis on steps where timing is critical.
Basic Annexin V/Propidium Iodide (PI) Staining Protocol
This protocol is suitable for the simultaneous detection of early apoptosis (Annexin V positive) and loss of membrane integrity (PI positive) [10].
Materials:
- Fluorochrome-conjugated Annexin V (e.g., FITC, PE, APC)
- Propidium Iodide (PI) Staining Solution (or 7-AAD)
- 10X Binding Buffer (dilute to 1X with distilled water)
- 1X PBS (calcium-free, without EDTA)
- Flow cytometer
Procedure:
- Harvest and Wash Cells: Harvest cells, particularly adherent cells, as gently as possible using non-enzymatic methods to preserve membrane integrity [10]. Wash cells once with 1X PBS and once with 1X Binding Buffer by centrifugation (e.g., 300-500 x g for 5 minutes) [5].
- Resuspend Cells: Resuspend the cell pellet in 1X Binding Buffer at a concentration of 1-5 x 10^6 cells/mL [5].
- Stain with Annexin V: Transfer 100 µL of cell suspension to a tube. Add 5 µL of fluorochrome-conjugated Annexin V, mix gently, and incubate for 10-15 minutes at room temperature in the dark [5].
- Add PI and Analyze: Without washing, add 5 µL of PI staining solution to the tube. Analyze the samples immediately on the flow cytometer. Do not wash after PI addition, as the dye must remain in the buffer during acquisition [5].
Annexin V Staining with Fixable Viability Dyes and Surface Markers
This protocol is ideal for complex panels where the inclusion of a fixable viability dye (FVD) improves viability assessment and allows for subsequent intracellular staining.
Materials:
- All materials from the basic protocol.
- Fixable Viability Dye (e.g., eFluor 506, eFluor 660, eFluor 780). Note: FVD eFluor 450 is not recommended for use with Annexin V kits [5].
- Flow Cytometry Staining Buffer
- Antibodies for surface and/or intracellular targets
Procedure:
- Stain Surface Antigens: Begin by staining cell surface antigens following standard protocols [5].
- Wash: Wash cells twice with azide- and serum/protein-free PBS.
- Stain with Viability Dye: Resuspend cells in PBS at 1-10 x 10^6 cells/mL. Add 1 µL of FVD per 1 mL of cells, vortex immediately, and incubate for 30 minutes at 2-8°C in the dark [5].
- Wash and Stain for Annexin V: Wash cells twice with Flow Cytometry Staining Buffer and once with 1X Binding Buffer. Resuspend in 1X Binding Buffer and stain with Annexin V as described in steps 3-4 of the basic protocol [5].
- Intracellular Staining (Optional): After Annexin V staining and a final wash, the cells can be fixed and permeabilized for intracellular staining using commercial buffer sets [5].
Experimental Workflow and Data Analysis
Visualizing the Staining and Analysis Workflow
The following diagram illustrates the integrated workflow for a typical Annexin V experiment, highlighting the critical path and key decision points to ensure a successful assay.
Gating Strategy and Data Interpretation
Once data is acquired, a systematic gating strategy is essential for accurate interpretation. The cornerstone of analysis is a two-dimensional dot plot that cross-references Annexin V fluorescence against a viability dye like PI.
Table 2: Essential Research Reagent Solutions
| Reagent | Function in Assay | Key Consideration |
|---|---|---|
| Annexin V Conjugate | Binds externalized phosphatidylserine (PS) on apoptotic cells [10]. | Calcium-dependent; requires Ca²⁺ in binding buffer. Avoid EDTA [5]. |
| Propidium Iodide (PI) | Membrane-impermeant DNA dye indicating loss of membrane integrity [14]. | Do not wash out after addition. Cells must be analyzed promptly after its addition [5]. |
| 7-AAD | Alternative to PI; membrane-impermeant nucleic acid dye [5]. | Similar use and considerations as PI. |
| Fixable Viability Dyes (FVD) | Covalently labels amines in non-viable cells; stable after fixation [5]. | Must be used before fixation. Incompatible with some Annexin V conjugates (e.g., eFluor 450) [5]. |
| 10X Binding Buffer | Provides optimal calcium and salt conditions for Annexin V-PS binding [10]. | Must be diluted to 1X and be free of chelators like EDTA [5]. |
The quadrant gating, as visualized above, allows for the clear discrimination of four distinct populations [14] [10]:
- Viable Cells (Q2, Annexin V- / PI-): Healthy cells with intact membranes and no PS externalization.
- Early Apoptotic Cells (Q3, Annexin V+ / PI-): Cells undergoing apoptosis, exhibiting PS externalization but maintaining membrane integrity that excludes PI.
- Late Apoptotic Cells (Q1, Annexin V+ / PI+): Cells in the late stages of apoptosis or secondary necrosis, with both PS externalization and compromised membrane integrity.
- Necrotic/Damaged Cells (Q4, Annexin V- / PI+): Cells that have undergone primary necrosis or severe mechanical damage, losing membrane integrity without PS externalization.
Ensuring Specificity and Comparing Methodological Approaches
Essential Experimental Controls for Accurate Interpretation
The Annexin V staining protocol for flow cytometry is a cornerstone technique for detecting programmed cell death (apoptosis) in diverse research and drug development contexts. This method leverages the calcium-dependent binding of Annexin V protein to phosphatidylserine (PS), a phospholipid that translocates from the inner to the outer leaflet of the plasma membrane during early apoptosis [3] [1]. Accurate interpretation of this assay, however, is entirely contingent upon the implementation of appropriate experimental controls. Without proper controls, researchers risk misinterpreting artifacts, non-specific binding, or spectral overlap for true biological signals, leading to fundamentally flawed conclusions. This application note details the essential controls required to ensure the integrity, reproducibility, and accurate quantification of apoptosis data using Annexin V flow cytometry.
The Science of Annexin V and Apoptosis Detection
Biochemical Principles of Phosphatidylserine Externalization
In viable, healthy cells, phosphatidylserine (PS) is actively maintained on the inner, cytoplasmic leaflet of the plasma membrane by the enzyme flippase [10]. During the initial phases of apoptosis, this enzymatic activity is disrupted, and another enzyme, scramblase, is activated. This results in the loss of membrane asymmetry and the exposure of PS on the cell's outer surface [1]. This externalized PS serves as an "eat-me" signal for phagocytic cells to clear the dying cell. Annexin V, a 35-36 kDa natural protein, exhibits a high affinity for PS in the presence of calcium ions (Ca²⁺) [3]. By conjugating Annexin V to a fluorochrome (e.g., FITC, PE, APC), cells undergoing apoptosis can be specifically labeled and detected via flow cytometry.
Distinguishing Apoptotic Stages with Vital Dyes
A critical feature of the standard Annexin V protocol is its combination with a membrane-impermeant vital dye, most commonly Propidium Iodide (PI) or 7-Aminoactinomycin D (7-AAD). These dyes bind to nucleic acids but are excluded from viable cells and early apoptotic cells with intact plasma membranes [10] [1]. The loss of membrane integrity, which is a hallmark of late-stage apoptosis and necrosis, allows PI or 7-AAD to enter the cell and stain nuclear DNA. This dual-staining strategy enables the discrimination of distinct cell populations:
- Viable Cells: Annexin V negative / PI negative.
- Early Apoptotic Cells: Annexin V positive / PI negative (PS exposed, membrane intact).
- Late Apoptotic/Necrotic Cells: Annexin V positive / PI positive (PS exposed, membrane compromised).
The following diagram illustrates the core biological principle and the resulting flow cytometry data:
Essential Experimental Controls for Annexin V Assays
Robust Annexin V flow cytometry data requires a multi-layered control strategy. The controls can be categorized into three primary groups: (1) Gating and Instrument Controls, (2) Specificity and Staining Controls, and (3) Biological Validation Controls.
Gating and Instrument Controls
These controls are fundamental for configuring the flow cytometer correctly and ensuring that the electronic signals from different fluorochromes are accurately measured and distinguished.
Table 1: Essential Gating and Instrument Controls
| Control Type | Purpose | Composition | Critical Application |
|---|---|---|---|
| Unstained Cells [6] [3] | Determines the level of cellular autofluorescence and background signal. | Cells in binding buffer only. | Used to set the baseline fluorescence and negative gate for both Annexin V and PI channels. |
| Single-Stain Controls [6] [51] [15] | Enables proper compensation, correcting for spectral spillover between the Annexin V and PI detection channels. |
|
The fluorescence from these samples is used by the cytometer software to calculate compensation matrices, ensuring a signal in one channel does not falsely appear in another. |
| Fluorescence Minus One (FMO) Control [51] | Accurately defines the boundary between positive and negative populations, especially in multicolor panels beyond just Annexin V and PI. | Cells stained with all antibodies and dyes in the panel except for one. (e.g., FMO-Annexin V). | Critical for setting correct gates by revealing the background signal and spread caused by all other fluorophores in the experiment. |
Specificity and Staining Controls
These controls verify that the observed staining is specific for the intended target and not an artifact of non-specific antibody binding or other experimental variables.
- Annexin V Blocking Control: This control demonstrates the specificity of Annexin V binding. Cells are pre-incubated with an excess of unlabeled Annexin V to saturate all PS binding sites, followed by incubation with the labeled Annexin V. A significant reduction in fluorescence in the blocked sample compared to the experimental sample confirms that the staining is specific for PS [6].
- Viability Stain Control: Using a fixable viability dye (FVD) prior to Annexin V staining can help identify and gate out dead cells that may bind Annexin V non-specifically due to membrane damage from sample processing [5]. This is particularly important when working with fragile primary cells or tissue samples.
Biological Validation Controls
These controls confirm that the assay is functioning as expected and can detect true biological changes.
- Induced Apoptosis Positive Control: A sample of cells treated with a known apoptosis inducer (e.g., staurosporine, camptothecin) is essential [3] [15]. This control validates the entire protocol, from staining to instrument setup, by generating a clear population of Annexin V-positive cells. It is indispensable for titrating new reagent batches and troubleshooting.
- Untreated Healthy Cell Control: Normal, untreated cells establish the baseline levels of spontaneous apoptosis and necrosis within the specific cell population being studied [6]. The percentage of induced apoptosis in experimental samples is often calculated by subtracting the basal apoptotic percentage in the untreated control.
Recommended Reagent Solutions and Materials
A successful experiment relies on high-quality, well-characterized reagents. The following table lists key materials and their functions.
Table 2: Research Reagent Solutions for Annexin V Staining
| Reagent / Material | Function / Description | Key Considerations |
|---|---|---|
| Fluorochrome-conjugated Annexin V [5] [6] | The primary detection reagent that binds externalized phosphatidylserine. | Available in multiple fluorochromes (FITC, PE, APC, etc.) to fit different flow panel designs. |
| Propidium Iodide (PI) or 7-AAD [6] [10] | Membrane-impermeant nucleic acid dye used to distinguish late apoptotic/necrotic cells. | Do not wash out after staining; it must remain in the buffer during acquisition [5]. |
| 10X Annexin V Binding Buffer [6] [15] | Provides the optimal calcium-containing environment (e.g., 10 mM HEPES, 140 mM NaCl, 2.5 mM CaCl₂, pH 7.4) for Annexin V-PS binding. | Critical: Must be calcium-supplemented and free of EDTA or other calcium chelators [5]. |
| Fixable Viability Dyes (FVD) [5] | Amine-reactive dyes that covalently label dead cells with compromised membranes, allowing for their exclusion during analysis. | Must be used before Annexin V staining. Staining should be performed in azide-free and serum/protein-free PBS [5]. |
| Apoptosis Inducer (e.g., Staurosporine) [3] | Used to generate a reliable positive control sample for assay validation. | Treat cells for a predetermined duration (e.g., 2-6 hours) to induce early apoptosis. |
Integrated Experimental Workflow
The following diagram maps the complete experimental journey, from cell preparation to data analysis, highlighting the points at which critical controls are integrated.
Detailed Methodologies for Key Experiments
Standard Annexin V/PI Staining Protocol
This is a detailed step-by-step protocol for the core apoptosis detection assay [5] [6] [15].
Preparation:
- Induce apoptosis in experimental cells and include vehicle-treated negative controls.
- Gently harvest cells (using non-enzymatic dissociation for adherent cells where possible to preserve membrane integrity) and collect by centrifugation (300–500 × g for 5 minutes).
- Prepare a 1X working solution of Annexin Binding Buffer from a 10X stock by dilution with distilled water.
Staining:
- Wash cells once with cold PBS and once with 1X Binding Buffer.
- Resuspend the cell pellet in 1X Binding Buffer at a density of 1–5 × 10^6 cells/mL.
- Transfer 100 µL of the cell suspension (containing 1–5 × 10^5 cells) to a 5 mL flow cytometry tube.
- Add 5 µL of the fluorochrome-conjugated Annexin V. Gently vortex the tube to mix.
- Incubate for 15 minutes at room temperature (15–25°C) in the dark.
- Add 5 µL of Propidium Iodide (PI) staining solution directly to the tube. Do not wash the cells. Gently mix and incubate for another 5–15 minutes at room temperature in the dark.
- Add 400 µL of 1X Binding Buffer to the tube to stop the reaction and keep cells in suspension.
Analysis:
- Analyze the samples on a flow cytometer immediately, ideally within 1 hour. Keep samples on ice and protected from light if a short delay is unavoidable.
Protocol for Annexin V Staining with Fixable Viability Dyes
When incorporating a fixable viability dye (FVD) to discriminate dead cells more effectively in complex panels, follow this adapted protocol [5]:
- Wash cells twice with azide-free and serum/protein-free PBS.
- Resuspend cells at 1–10 × 10^6 cells/mL in the same PBS.
- Add 1 µL of Fixable Viability Dye (e.g., FVD eFluor 780) per 1 mL of cell suspension and vortex immediately.
- Incubate for 30 minutes at 2–8°C in the dark.
- Wash cells twice with Flow Cytometry Staining Buffer or equivalent to remove unbound dye.
- Proceed with the standard Annexin V and PI staining protocol as described in section 6.1, starting from the wash with 1X Binding Buffer.
The power of the Annexin V assay to provide sensitive, quantitative data on apoptosis is undeniable. However, this power is fully realized only through rigorous experimental discipline. The essential controls outlined herein—unstained and single-stain controls for instrument setup, FMO and blocking controls for gate placement and specificity, and biological controls for assay validation—are not optional. They form an integral part of the experiment, safeguarding against misinterpretation and ensuring that the resulting data truly reflects the biological state of the cells. For researchers in drug development, where decisions are made based on these data points, embedding this comprehensive control strategy into every experiment is a fundamental requirement for scientific rigor and reliability.
Annexin V Blocking Experiments to Confirm Specificity
Within the broader scope of optimizing the Annexin V staining flow cytometry protocol for apoptosis detection, confirming the specificity of phosphatidylserine (PS) binding is a critical methodological checkpoint. A false positive signal can lead to a significant overestimation of apoptotic cell populations, compromising data integrity in research and drug development [11]. This application note details the use of competitive blocking experiments to validate that fluorescence signals are due to the specific interaction between Annexin V and externally exposed PS, rather than non-specific binding [6].
During early apoptosis, cells lose the asymmetric distribution of phospholipids in their plasma membrane, leading to the translocation of PS from the inner to the outer leaflet [52] [11] [53]. Annexin V, a 35-36 kDa calcium-dependent phospholipid-binding protein, binds with high affinity to this exposed PS, providing the basis for one of the most common assays to detect apoptosis [11] [53]. However, the integrity of this assay hinges on the specificity of this interaction. The blocking experiment, which uses an excess of unlabeled Annexin V to competitively occupy PS binding sites before adding the fluorescent conjugate, serves as a definitive control to confirm this specificity [6].
Scientific Rationale and Principle of the Blocking Experiment
The underlying principle of the Annexin V blocking experiment is competitive inhibition. The core mechanism of apoptosis detection and its confirmation via blocking is a sequential process that can be visualized as follows:
The Critical Role of Membrane Integrity
A crucial consideration for any Annexin V assay is membrane integrity. In a viable, non-apoptotic cell, the membrane is intact and prevents Annexin V conjugates from crossing and binding to PS on the inner leaflet. During early apoptosis, the membrane remains intact despite PS exposure, allowing for the specific detection of this early event. However, in late apoptosis and necrosis, the loss of membrane integrity allows Annexin V to penetrate the cell and bind to internal PS, potentially leading to false-positive interpretation [11] [10]. Therefore, Annexin V staining is only a reliable marker of apoptosis in cells with an intact plasma membrane, which is why a viability dye, such as propidium iodide (PI) or 7-AAD, is always used in parallel [5] [6] [7]. Cells that are Annexin V positive and viability dye negative are classified as being in early apoptosis [11].
Essential Reagents and Materials
A successful blocking experiment requires careful preparation of specific reagents. The table below summarizes the key solutions required.
Table 1: Essential Research Reagent Solutions for Annexin V Blocking Experiments
| Reagent | Composition / Example | Critical Function in the Assay |
|---|---|---|
| Unconjugated Annexin V | Recombinant human Annexin V (supplied in Annexin V-FITC Apoptosis Detection Kit II, Cat. No 556570) [6] | Serves as the competitive blocking agent by binding to and occupying PS sites before the labeled Annexin V is added. |
| Fluorochrome-conjugated Annexin V | FITC, PE, APC, Alexa Fluor dyes (e.g., Annexin V-FITC, Cat. No. 556420) [6] [11] | The primary detection reagent for flow cytometry; its binding is inhibited in a successful block. |
| 10X / 1X Binding Buffer | 0.1 M HEPES (pH 7.4), 1.4 M NaCl, 25 mM CaCl₂ [6]. Diluted to 1X with distilled water for use. | Provides the calcium-rich, isotonic environment mandatory for calcium-dependent Annexin V-PS binding. |
| Viability Stain | Propidium Iodide (PI) [6] [7] or 7-AAD [6] [11] | A cell-impermeable DNA dye that identifies late apoptotic/necrotic cells with compromised membranes, defining the early apoptotic (Annexin V+/PI-) population. |
| Cell Wash Buffer | 1X Phosphate-Buffered Saline (PBS), azide- and serum/protein-free for use with fixable viability dyes [5]. | Used to wash cells free of culture media and serum proteins that can interfere with staining. |
Critical Note on Buffers: The calcium-dependent nature of the Annexin V-PS interaction cannot be overstated. All binding and wash buffers must contain calcium (typically 2.5 mM CaCl₂ in 1X binding buffer) and must avoid EDTA or other calcium chelators, as these will abrogate binding and invalidate the assay [5] [11].
Detailed Experimental Protocol
This section provides a step-by-step methodology for performing the Annexin V blocking experiment, adapted from established protocols [6].
Sample Preparation and Staining
The workflow for preparing the necessary controls and the blocked experimental sample is outlined below, ensuring a correctly configured flow cytometry experiment.
Key Procedural Details and Quantities
The following table expands on the critical steps and recommended quantities for the blocking experiment.
Table 2: Detailed Staining Protocol for Blocking Experiment
| Step | Experimental Tube (Blocked) | Control Tubes | Notes and Optimization |
|---|---|---|---|
| 1. Cell Preparation | Resuspend apoptotic cells at ~1 x 10⁶ cells/mL in 1X Binding Buffer [6]. | Same as experimental tube. | Use gently detached cells; rough handling can create membrane holes, causing non-specific Annexin V entry [3]. |
| 2. Aliquoting | Transfer 100 µL (~1 x 10⁵ cells) to a tube [6]. | Prepare separate tubes for unstained, Annexin V only, and viability dye only. | Single-stain controls are essential for flow cytometry compensation [6] [3]. |
| 3. Blocking | Add 5-15 µg of unconjugated Annexin V. Mix gently and incubate for 15 min at RT [6]. | Not applicable. | The amount of blocking agent needed to saturate sites can vary by cell type and apoptosis level; titration may be required [6]. |
| 4. Staining with Labeled Annexin V | Add 5 µL of fluorochrome-conjugated Annexin V (e.g., FITC, PE). Incubate 15 min at RT in the dark [5] [6]. | Add conjugated Annexin V to the "Annexin V only" control tube. | Protect samples from light to prevent fluorochrome photobleaching. |
| 5. Staining with Viability Dye | Add 5 µL of PI or 7-AAD [6]. Do not wash after adding the viability dye [5] [7]. | Add viability dye to the "viability dye only" and "unstained" tubes. | The dye must remain in the buffer during acquisition. Analyze samples within 1 hour for best results [5] [6]. |
| 6. Analysis | Add 400 µL of 1X Binding Buffer and analyze by flow cytometry [6]. | Same as experimental tube. | Keep samples on ice and protected from light if analysis is delayed. |
Data Interpretation and Analysis
Expected Results and Gating Strategy
A correctly executed blocking experiment will demonstrate a clear reduction in the fluorescence signal from the labeled Annexin V in the blocked sample compared to the unblocked control.
- Successful Blocking: The population of cells that were positive for Annexin V in the unblocked control should show a significant shift to become Annexin V negative/low in the blocked sample. This confirms that the original signal was due to specific binding to PS.
- Viability Gating: The viability dye (PI or 7-AAD) is used to gate on the intact cell population. The early apoptotic cells are defined as Annexin V positive and viability dye negative. The blocking effect should be most evident in this population.
Troubleshooting Common Issues
- Incomplete Blocking: If the signal is not sufficiently reduced, the concentration of the unconjugated Annexin V may be too low. Consider increasing the amount of blocking agent or reducing the number of cells per sample [6].
- High Background in Viability Dye Channel: Ensure that the viability dye is titrated correctly for your cell type, as the optimal amount can range between 2–10 µl/test [6].
- Poor Separation of Populations: Always include a positive control (e.g., cells treated with Staurosporine or Camptothecin) to validate your staining protocol and instrument setup [3].
The Annexin V blocking experiment is a fundamental and robust control that should be incorporated into the experimental design of any study relying on Annexin V staining to quantify apoptosis. It provides direct evidence of assay specificity, thereby strengthening data validity and interpretation. For researchers in drug development, where accurately measuring compound-induced cytotoxicity is paramount, this control is indispensable for confirming that observed cell death is truly apoptotic and specifically detected via PS externalization. Integrating this protocol into the standard Annexin V staining workflow ensures rigorous, reliable, and reproducible results in cellular research.
The accurate assessment of cell viability, proliferation, and death is fundamental to biomedical research and drug development. Among the various methods available, Annexin V staining has emerged as a cornerstone technique for detecting apoptotic cells. This application note provides a detailed comparative analysis of three primary platforms for analyzing cellular apoptosis: flow cytometry, fluorescence microscopy, and automated cell counters. Each technology offers distinct advantages and limitations in parameters such as throughput, multiplexing capability, resolution, and cost. Framed within the context of a broader thesis on Annexin V staining protocol research, this document provides structured quantitative data, detailed experimental protocols, and strategic guidance to enable researchers to select the most appropriate technology for their specific application needs in basic research or drug development pipelines.
Technology Comparison & Performance Metrics
The evaluation of cell viability and apoptosis is crucial for diverse applications, from basic cell culture maintenance to advanced drug efficacy studies. The table below summarizes the core characteristics of the three main analytical platforms.
Table 1: Core Technology Comparison for Cell Analysis
| Feature | Flow Cytometry | Automated Cell Counters | Fluorescence Microscopy |
|---|---|---|---|
| Detection Principle | Optical scattering & fluorescence of cells in a fluid stream [54] | Image analysis (brightfield/fluorescence) or electrical impedance [54] | Visual inspection of fluorescent or brightfield images |
| Multiplexing Capacity | High (multiple parameters simultaneously) [55] [13] | Low to Moderate (typically 1-2 fluorescence channels) [56] | Moderate (limited by filters and camera) [57] |
| Throughput | Very High (10,000+ cells/sec) [54] | High (<30 seconds/sample) [56] | Low (manual, time-consuming) [54] |
| Cell Resolution | Population-level statistics | Population-level statistics with some morphological data [56] | Single-cell resolution with detailed morphology [57] |
| Capital Cost | High [54] | Moderate [54] | Low to Moderate |
| Key Strength | Quantitative, multi-parametric analysis of heterogeneous populations | Speed, ease of use, and integration into cell culture workflow [56] | Visual confirmation and morphological detail [57] |
Quantitative performance metrics are critical for selecting the appropriate instrument. A comparative study assessing apoptosis detection using Annexin V and Propidium Iodide (PI) counterstain across these platforms revealed cell-type-dependent variations in performance [57]. Furthermore, a study comparing an automated fluorescence microscopic viability test with conventional and flow cytometry methods found that the automated microscope showed strong correlation (r=0.99) with both conventional methods and flow cytometry, while also demonstrating superior precision (2.0-6.2% coefficient of variation) [58].
Table 2: Quantitative Performance Metrics in Apoptosis Detection
| Performance Metric | Flow Cytometry | Automated Cell Counters | Fluorescence Microscopy |
|---|---|---|---|
| Correlation with Reference | High (r = 0.99 with manual methods) [58] | High (r = 0.99 with flow cytometry) [58] | Similar patterns to automated counters [57] |
| Precision (CV) | Varies by instrument | 2.0 - 6.2% [58] | Subject to user variability |
| Analysis Time per Sample | Minutes (including setup) | ~10 seconds [56] | 5+ minutes (manual counting) [56] |
| User Variability | Low (automated analysis) | Low (automated gating) [56] | High (≥20% between technicians) [56] |
| Cell-Type Dependency | Significant (e.g., microalgae vs. mammalian) [57] | Significant (less effective for microalgae) [57] | Significant (less effective for microalgae) [57] |
Experimental Protocols for Annexin V Staining
Flow Cytometry Protocol for Annexin V/PI Apoptosis Detection
The following protocol is adapted from manufacturer guidelines and validated research methods for the detection of apoptosis in cell suspensions using flow cytometry [5] [6] [10].
Materials:
- Cells: Cultured cells (e.g., MDA-MB-231 breast cancer cells) [13].
- Staining Reagents: Fluorochrome-conjugated Annexin V (e.g., FITC, PE, APC), Propidium Iodide (PI) solution (or 7-AAD) [5] [6].
- Buffers: 1X PBS (calcium-free), 1X Annexin Binding Buffer (10 mM HEPES, 140 mM NaCl, 2.5 mM CaCl₂, pH 7.4) [6] [10].
- Equipment: Flow cytometer with appropriate lasers and filters, centrifuge, 5 mL round-bottom tubes.
Procedure:
- Cell Preparation and Harvesting:
- Gently harvest adherent cells using non-enzymatic dissociation buffers or mild trypsinization to preserve membrane integrity [10]. Avoid EDTA-containing buffers as they chelate calcium, which is essential for Annexin V binding [5].
- Wash cells twice with cold PBS by centrifuging at 300-400 x g for 5 minutes [6].
- Resuspend the cell pellet in 1X Annexin Binding Buffer at a density of 1 x 10⁶ cells/mL [6].
Staining:
- Aliquot 100 µL of cell suspension (∼1 x 10⁵ cells) into a flow cytometry tube [6].
- Add 5 µL of fluorochrome-conjugated Annexin V (e.g., Annexin V-FITC) [5] [6].
- Add 2-5 µL of PI solution (typically 50 µg/mL stock) [6] [10].
- Gently vortex the tubes and incubate for 15 minutes at room temperature in the dark [5].
Analysis:
- After incubation, add 400 µL of 1X Annexin Binding Buffer to each tube [6].
- Analyze samples on the flow cytometer within 1 hour. Keep samples on ice if analysis is delayed [10].
- Use unstained cells, single-stained controls (Annexin V only, PI only), and apoptosis-induced positive controls for instrument setup, compensation, and gating [6] [10].
The workflow for this protocol is systematized in the diagram below.
Protocol for Automated Cell Counters
Automated cell counters offer a rapid, lower-throughput alternative for viability and apoptosis assessment [56] [57].
Materials:
- Instrument: Automated fluorescence cell counter (e.g., Countess II FL) [56].
- Reagents: Fluorochrome-conjugated Annexin V, PI, and/or trypan blue [56] [57].
- Consumables: Specific chamber slides for the instrument [56].
Procedure:
- Cell Staining:
- Harvest and wash cells as described in the flow cytometry protocol.
- Stain the cell sample with Annexin V and PI according to the flow cytometry staining protocol [56].
- Loading and Analysis:
- Pipette 10 µL of the stained cell sample directly into a chamber slide [56].
- Insert the slide into the instrument port to initiate autofocus.
- Press the "Count" button. The instrument automatically focuses and captures images.
- Use the software's gating options for size, brightness, circularity, and fluorescence intensity to distinguish live, early apoptotic, and late apoptotic/necrotic populations [56].
- Record the concentrations and percentages for each population.
The Scientist's Toolkit: Key Reagent Solutions
Successful apoptosis detection relies on a core set of reagents and appropriate controls. The following table details essential components for a typical Annexin V staining experiment.
Table 3: Essential Research Reagents for Annexin V Staining
| Reagent | Function / Role in Assay | Key Considerations |
|---|---|---|
| Fluorochrome-conjugated Annexin V | Binds to phosphatidylserine (PS) exposed on the outer leaflet of the plasma membrane during early apoptosis [10]. | Calcium-dependent binding. Choose a fluorochrome compatible with your instrument's lasers and filters (e.g., FITC, PE, APC) [5]. |
| Membrane-Impermeant Dye (PI or 7-AAD) | Distinguishes late apoptotic/necrotic cells. PI enters cells with compromised membranes and intercalates into DNA [10]. | Do not wash after adding PI/7-AAD. Must be present in buffer during acquisition [5]. |
| Annexin Binding Buffer | Provides the calcium ions necessary for Annexin V binding and maintains an optimal physiological pH for cell integrity [6]. | Must be calcium-containing and free of EDTA/EGTA, which chelate calcium and inhibit binding [5]. |
| Viability Dyes (for flow cytometry) | Fixable viability dyes (FVDs) can be used prior to Annexin V staining to identify dead cells, especially for intracellular staining protocols [5]. | Some FVDs (e.g., eFluor 450) are not recommended for use with certain Annexin V kits; check compatibility [5]. |
| Controls (Unstained, Single-Stained, Positive) | Essential for setting up the instrument, compensating for spectral overlap, and validating the assay [6] [10]. | Include cells stained with Annexin V only and PI only. Use staurosporine or UV-treated cells as a positive control for apoptosis [10]. |
Strategic Implementation and Analysis
Technology Selection Workflow
Choosing the right platform depends on the experimental goals, sample characteristics, and available resources. The following decision tree outlines a logical selection process.
Data Interpretation and Gating Strategy
For flow cytometry data, a standard quadrant gating approach is used based on single-stained controls.
- Viable Cells (Annexin V⁻/PI⁻): Lower left quadrant.
- Early Apoptotic Cells (Annexin V⁺/PI⁻): Lower right quadrant.
- Late Apoptotic/Necrotic Cells (Annexin V⁺/PI⁺): Upper right quadrant.
- Necrotic/Damaged Cells (Annexin V⁻/PI⁺): Upper left quadrant (less common) [10].
It is critical to note that the distribution of cells in these quadrants can be cell-type and treatment-dependent [57]. Furthermore, automated computational methods for flow cytometry data analysis have matured significantly and can reproduce expert manual gating with high accuracy (F-measures > 0.85), offering an objective and reproducible alternative to traditional analysis [55].
Flow cytometry, fluorescence microscopy, and automated cell counters each provide distinct value for apoptosis analysis. Flow cytometry stands out for its high-throughput, multi-parametric capabilities in drug development and advanced research. Fluorescence microscopy remains indispensable for morphological validation and detailed single-cell observation. Automated cell counters offer a robust solution for rapid, routine assessment within cell culture workflows. The optimal choice is not universal but depends on the specific experimental requirements for throughput, information depth, and resource constraints. By leveraging the comparative data and detailed protocols provided herein, researchers can make informed decisions to effectively implement Annexin V staining protocols, thereby generating reliable and reproducible data in apoptosis research.
Annexin V staining, followed by flow cytometric analysis, is a cornerstone technique for detecting apoptotic cells based on the externalization of phosphatidylserine (PS). However, the assumption that a single, standardized protocol is universally applicable across diverse cell types is a significant oversimplification that can compromise data integrity. This application note delineates the critical methodological variations required for the accurate detection of apoptosis in mammalian cells versus microalgae, drawing on comparative empirical studies. The translocation of PS from the inner to the outer leaflet of the plasma membrane is a well-established early event in mammalian cell apoptosis [11] [3]. The human protein Annexin A5 binds to this exposed PS in a calcium-dependent manner, providing a mechanism for detection when conjugated to fluorochromes [59] [11]. While this principle is well-defined for mammalian systems, its application to eukaryotic microalgae presents unique challenges and necessitates rigorous, cell-specific validation. The following sections provide a detailed comparative analysis, optimized protocols, and data interpretation guidelines for these distinct cell types.
Comparative Analysis: Detection Efficiency and Instrumentation
The efficacy of Annexin V staining is highly dependent on both the cell type and the detection instrument used. A comparative study investigating mammalian (pancreatic cancer, metastatic breast cancer, mouse fibroblasts) and microalgae (Chlorella vulgaris) cells revealed stark contrasts in optimal detection methodologies [60].
Table 1: Comparison of Cell Death Detection Methods Across Cell Types
| Cell Type | Annexin V-PI Detection (Optimal Instrument) | Trypan Blue Detection | Key Findings |
|---|---|---|---|
| Mammalian Cells | Flow Cytometry, Fluorescence Microscope, Automated Cell Counter [60] | Fluorescence Microscope, Automated Cell Counter [60] | Automated cell counter and fluorescence microscopy showed similar patterns. Flow cytometry provided accurate detection for one specific mammalian line post-UV treatment [60]. |
| Microalgae Cells | Flow Cytometry (only applicable instrument) [60] | Not Applicable [60] | Annexin V-PI and trypan blue methods were not applicable for automated cell counter or microscopic detection. Flow cytometry revealed significant changes in cell death [60]. |
This data underscores that reliable quantification is not a function of the assay alone but is intrinsically linked to the cell type and instrumentation [60]. For microalgae, which possess a rigid cell wall, traditional viability stains like trypan blue and the standard Annexin V protocol may fail, necessitating method modification and validation against alternative viability assays [60] [61].
Detailed Experimental Protocols
Annexin V Staining Protocol for Mammalian Cells
The following protocol is optimized for suspension and adherent mammalian cells and should be performed gently to avoid mechanical induction of apoptosis [6] [3].
Materials & Reagents
- Annexin V Binding Buffer (1X): 0.1 M HEPES (pH 7.4), 1.4 M NaCl, 25 mM CaCl₂ [6].
- Fluorochrome-conjugated Annexin V (e.g., FITC, PE, APC).
- Viability Stain: Propidium Iodide (PI) or 7-AAD solution.
- Phosphate-Buffered Saline (PBS), cold.
- Flow cytometer.
Procedure
- Cell Harvesting: For suspension cells, collect all media and cells. For adherent cells, first collect the media (containing dead cells), then gently detach the remaining adherent cells using mild trypsin or a non-enzymatic solution. Combine all cell fractions [3].
- Washing: Wash cells twice with cold PBS by centrifuging at 500 × g for 5-7 minutes at 4°C. Decant the supernatant completely [5] [3].
- Resuspension: Resuspend the cell pellet in 1X Annexin V Binding Buffer at a density of 1-5 × 10⁶ cells/mL [5] [6].
- Staining: Transfer 100 µL of the cell suspension (~1-5 × 10⁵ cells) to a flow cytometry tube. Add 5 µL of fluorochrome-conjugated Annexin V. Gently vortex and incubate for 10-15 minutes at room temperature in the dark [5] [6].
- Viability Staining: Without washing, add 5 µL of PI (or 7-AAD) to the tube. Incubate for an additional 5-15 minutes on ice or at room temperature, protected from light [5]. Do not wash after this step, as PI must remain in the buffer during acquisition.
- Analysis: Add 400 µL of 1X Binding Buffer to the tube and analyze by flow cytometry within 1 hour [6].
Adapted Staining Protocol for Microalgae Cells
Standard Annexin V protocols often require adaptation for microalgae due to their complex cell walls. The following is a generalized framework based on comparative studies.
Materials & Reagents
- Microalgae culture (e.g., Chlorella vulgaris).
- Annexin V Binding Buffer (1X), with calcium.
- Fluorochrome-conjugated Annexin V.
- Viability Stain: PI or SYTOX Green.
- Flow cytometer.
Procedure
- Cell Preparation: Concentrate microalgae cells from culture medium by gentle centrifugation. Wash cells once with Annexin V Binding Buffer to remove culture contaminants.
- Staining Optimization: Resuspend cells in 1X Annexin V Binding Buffer. The concentration of Annexin V and incubation time may require empirical optimization. Initial conditions can mirror the mammalian protocol (5 µL Annexin V per 100 µL cell suspension, 15 min incubation) [60].
- Viability Staining: Add a viability stain like PI. Note that PI penetration may be inefficient in microalgae with intact cell walls.
- Analysis: Analyze by flow cytometry. Crucially, the use of a fluorescence microscope or automated cell counter for Annexin V-PI detection in microalgae is not recommended based on comparative studies [60].
- Validation: Given the potential for false positives and negatives, results must be validated against an alternative cell death assay specific to microalgae.
The Scientist's Toolkit: Essential Research Reagents
Table 2: Key Reagent Solutions for Annexin V Staining
| Reagent | Function | Critical Considerations |
|---|---|---|
| Annexin V Conjugate | Binds externalized PS on apoptotic cells. | Must be conjugated to a fluorochrome compatible with your flow cytometer's lasers and filters (e.g., FITC, PE, APC) [11]. |
| Binding Buffer (10X) | Provides the optimal calcium-containing environment for Annexin V-PS binding. | Always dilute to 1X. Avoid buffers containing EDTA or other calcium chelators, as they inhibit binding [5] [6]. |
| Viability Dye (PI/7-AAD) | Distinguishes late apoptotic/necrotic cells (permeable to compromised membranes). | Added after Annexin V without a subsequent wash [5]. For microalgae, permeability can be an issue [60]. |
| Fixable Viability Dyes (FVD) | Allows for subsequent fixation and intracellular staining without losing viability information. | Must be used before Annexin V staining. FVD eFluor 450 is not recommended with some Annexin V kits [5]. |
Data Interpretation and Analysis
Proper gating strategy is essential for accurate quantification of apoptotic populations. The following diagram and table outline the standard interpretation framework.
Table 3: Flow Cytometry Data Interpretation Guide
| Cell Population | Annexin V Signal | Viability Dye (PI/7-AAD) Signal | Physiological State |
|---|---|---|---|
| Viable/Healthy | Negative | Negative | Healthy, intact membrane, PS internal. |
| Early Apoptotic | Positive | Negative | PS externalized, plasma membrane intact. |
| Late Apoptotic | Positive | Positive | PS externalized, membrane integrity lost. |
| Necrotic | Negative (or spuriously positive) | Positive | Loss of membrane integrity without ordered PS externalization. |
A critical consideration, especially for microalgae, is the risk of false positives. If the plasma membrane is compromised, Annexin V can enter the cell and bind to PS on the inner leaflet, incorrectly labeling a necrotic cell as apoptotic [11]. This underscores the necessity of including a viability dye in every experiment.
The validation of Annexin V staining protocols across different cell types is not a mere formality but a fundamental requirement for generating reliable, interpretable data. As demonstrated, mammalian cells and microalgae exhibit significant differences in their response to standard apoptosis detection assays. The robust protocols established for mammalian systems cannot be directly transposed to microalgae without empirical optimization and validation. Researchers must account for cell-specific characteristics, particularly the microalgal cell wall, which presents a significant barrier to staining and detection. By adhering to the tailored methodologies and rigorous analytical frameworks outlined in this application note, scientists can ensure the accuracy and biological relevance of their apoptosis studies in diverse model systems.
The accurate detection of apoptotic cells is a cornerstone of cellular research, playing a pivotal role in understanding disease mechanisms, developmental biology, and evaluating the efficacy and cytotoxicity of potential therapeutic compounds [10]. Apoptosis, or programmed cell death, is a tightly regulated process essential for maintaining cellular homeostasis, distinct from necrotic cell death which results from acute cellular injury [10]. Among the various techniques available for apoptosis detection, flow cytometry utilizing Annexin V and Propidium Iodide (PI) staining has emerged as a powerful, reliable, and quantitative method for distinguishing between healthy, early apoptotic, late apoptotic, and necrotic cells within a heterogeneous population [10].
Flow cytometry offers significant advantages for this application, including high-throughput analysis of thousands of cells per second, multiparametric capability to simultaneously measure multiple markers, and the sensitivity to detect subtle changes in cell properties, thus enabling the early detection of apoptosis [10]. The subsequent interpretation of the data generated, particularly through rigorous gating strategies and quadrant analysis, is critical for drawing meaningful biological conclusions. This application note provides a detailed guide to these interpretation processes, framed within the context of Annexin V staining protocols, to ensure researchers can generate robust, reproducible, and publication-quality data.
The Science of Annexin V/PI Staining
Biochemical Basis of the Assay
The Annexin V/PI staining assay leverages two fundamental cellular changes that occur during cell death: the translocation of phosphatidylserine (PS) and the loss of plasma membrane integrity.
Phosphatidylserine Externalization: In viable, healthy cells, the phospholipid phosphatidylserine (PS) is predominantly restricted to the inner leaflet of the plasma membrane through the activity of energy-dependent translocases [10]. During the early stages of apoptosis, this asymmetry is lost due to the inactivation of translocases and activation of scramblases, leading to the exposure of PS on the outer leaflet of the membrane [10] [3]. Annexin V is a 35-36 kDa cellular protein that binds to PS with high affinity in a calcium-dependent manner [62] [3]. By conjugating Annexin V to a fluorochrome (e.g., FITC, PE), cells undergoing early apoptosis can be specifically tagged for detection.
Loss of Membrane Integrity: Propidium Iodide (PI) is a membrane-impermeant DNA intercalating dye. In viable cells and those in early apoptosis with intact plasma membranes, PI is excluded. However, in late apoptotic and necrotic cells, where the membrane integrity is compromised, PI can enter the cell, bind to DNA, and emit red fluorescence when excited [10]. This principle allows PI to serve as a viability dye, identifying cells with compromised membranes.
Visualizing the Staining Principle and Outcome
The following diagram illustrates the fundamental principles of how Annexin V and PI distinguish between different cellular states based on membrane PS localization and integrity.
Essential Reagents and Materials
A successful Annexin V/PI experiment requires careful preparation and the use of specific, quality-controlled reagents. The table below summarizes the essential components of the assay kit and their critical functions.
Table 1: Key Research Reagent Solutions for Annexin V/PI Flow Cytometry
| Reagent/Material | Function & Importance | Key Considerations |
|---|---|---|
| Fluorochrome-conjugated Annexin V | Binds to externally exposed phosphatidylserine (PS) on apoptotic cells. | Available in various conjugates (FITC, PE, APC, etc.); choice depends on other fluorochromes in the panel to avoid spectral overlap [5]. |
| Propidium Iodide (PI) | DNA intercalating dye; stains cells with compromised plasma membranes. | Must be added to the buffer immediately before analysis and not washed out [5]. |
| 10X Binding Buffer | Provides the optimal calcium-containing environment for Annexin V-PS binding. | Critical to avoid buffers containing EDTA or other calcium chelators, which will inhibit binding [5]. |
| Fixable Viability Dyes (FVD) | Optional alternative to PI for identifying dead cells, especially when intracellular staining or fixation is required. | FVD eFluor 450 is not recommended for use with Annexin V kits due to potential interference [5]. |
| Apoptosis Inducer (e.g., Staurosporine) | Used to generate a positive control sample of apoptotic cells. | Essential for protocol validation and for setting up instrument compensation controls [10] [3]. |
Step-by-Step Experimental Protocol
Cell Preparation and Staining
The following protocol is adapted from established best practices and commercial kit instructions [10] [5] [3].
Cell Harvesting:
- Suspension Cells: Collect cells directly into a tube.
- Adherent Cells: First, collect the culture media containing any detached (often dead/dying) cells. Then, gently detach the remaining adherent cells using a non-enzymatic method (e.g., EDTA) to preserve membrane integrity. Combine all cells. Note: Rough harvesting can create holes in healthy cells, leading to false-positive Annexin V staining [3].
Washing: Centrifuge the cell suspension at 300–500 x g for 5 minutes. Carefully decant the supernatant and resuspend the cell pellet in cold Phosphate-Buffered Saline (PBS). Repeat this wash step once to remove residual media and serum proteins completely.
Buffer Preparation: Prepare 1X Annexin Binding Buffer by diluting the 10X concentrate with distilled water. Ensure the buffer is at room temperature for the staining step.
Cell Suspension: Resuspend the washed cell pellet in 1X Annexin Binding Buffer at a concentration of 1–5 x 10^6 cells/mL.
Annexin V Staining: Aliquot 100 µL of the cell suspension (approximately 1–5 x 10^5 cells) into a flow cytometry tube. Add the recommended volume of fluorochrome-conjugated Annexin V (typically 5 µL, but refer to manufacturer's datasheet). Gently vortex or tap the tube to mix. Incubate for 10–15 minutes at room temperature, protected from light.
PI Staining: After the incubation, add 2 mL of 1X Binding Buffer and centrifuge at 400–600 x g for 5 minutes. Discard the supernatant. Resuspend the cell pellet in 200 µL of 1X Binding Buffer. Add 5 µL of PI Staining Solution (or 7-AAD) and incubate for 5–15 minutes on ice or at room temperature, protected from light. Crucially, do not wash the cells after adding PI, as it must remain in the buffer during acquisition to stain non-viable cells [5].
Flow Cytometric Analysis: Analyze the samples promptly on a flow cytometer, ideally within 1 hour. Keep samples on ice and protected from light if a short delay is unavoidable.
Controls and Titration
The inclusion of proper controls is non-negotiable for accurate data interpretation and instrument setup [10] [63] [3].
- Unstained Cells: To determine background autofluorescence and set photomultiplier tube (PMT) voltages.
- Single-Stained Controls: Cells stained with only Annexin V or only PI. These are mandatory for setting compensation to correct for spectral overlap between the fluorescence channels.
- Positive Control: Cells treated with an apoptosis inducer (e.g., 1 µM Staurosporine for 4-6 hours). This validates the staining protocol.
- Negative Control: Untreated, healthy cells to establish the baseline for Annexin V and PI negativity.
- Titration: The optimal amount of Annexin V can vary by cell line. It is recommended to titrate Annexin V on both healthy and apoptotic cells to find the concentration that provides the maximum separation between positive and negative populations with the lowest non-specific binding [3].
Gating Strategy for Data Analysis
A logical, step-wise gating strategy is essential to isolate the target cell population and accurately analyze apoptosis.
Sequential Gating Workflow
The following diagram outlines a standard sequential gating approach to cleanly identify lymphocytes or other target cells for final quadrant analysis.
- Light Scatter Gate (FSC vs. SSC): Plot Forward Scatter (FSC, indicative of cell size) against Side Scatter (SSC, indicative of cell granularity/complexity). Draw a gate (R1) around the population of interest (e.g., lymphocytes, PBMCs) to exclude debris and other non-target cells like red blood cells or granulocytes [64] [65].
- Singlets Gate (FSC-A vs. FSC-H): From the light scatter-gated population, plot Forward Scatter-Area (FSC-A) against Forward Scatter-Height (FSC-H). Gate on the population that forms a diagonal line. This excludes cell doublets or aggregates, ensuring that each "event" analyzed corresponds to a single cell, which is critical for accurate quantification [63].
- Viability Gate (Optional but Recommended): If a fixable viability dye (FVD) is used in addition to or instead of PI, this is the step to gate on the FVD-negative (viable) population. This further refines the final population to healthy, intact cells before assessing apoptosis.
- Final Analysis Population: The cells that have passed through the previous gates are now used for the definitive Annexin V/PI quadrant analysis.
Quadrant Analysis and Data Interpretation
Setting Quadrants and Identifying Populations
The final step involves plotting the fluorescence of Annexin V (typically on the x-axis) against PI (typically on the y-axis) for the gated "Final Analysis Population." The use of biexponential scaling is often helpful for visualizing populations that fall on the axes [63]. Quadrants are set based on the negative and positive controls:
- The Annexin V-negative/PI-negative population from the untreated healthy cells defines the lower left quadrant.
- The Annexin V-positive population from the induced apoptotic cells helps set the boundary on the x-axis.
- The PI-positive population (which can be from the induced late apoptotic sample or a mechanically killed sample) helps set the boundary on the y-axis.
Table 2: Interpretation of Annexin V/PI Quadrant Analysis
| Quadrant | Annexin V | Propidium Iodide (PI) | Cell Population | Biological Interpretation |
|---|---|---|---|---|
| Lower Left (Q3) | Negative | Negative | Viable / Healthy | Cells with intact membranes and no PS externalization [10]. |
| Lower Right (Q4) | Positive | Negative | Early Apoptotic | Cells undergoing early apoptosis; PS is externalized, but the plasma membrane remains intact, excluding PI [10] [62]. |
| Upper Right (Q2) | Positive | Positive | Late Apoptotic | Cells in late-stage apoptosis or "secondary necrosis"; PS is externalized and the membrane integrity has been lost, allowing PI to enter and stain the DNA [10]. |
| Upper Left (Q1) | Negative | Positive | Necrotic / Damaged | Cells that have died via necrosis; the membrane is permeable to PI, but PS has not been systematically externalized. This population can also result from mechanical damage during cell harvesting [10] [3]. |
Visualizing Quadrant Analysis
The following diagram provides a visual summary of the quadrant analysis, correlating the staining profile with the biological state of the cell.
Data Presentation and Publication Standards
To ensure clarity, reproducibility, and facilitate the peer-review process, adhere to the following guidelines when presenting flow cytometry data [63] [66]:
- Axis Labels: Label axes with the antibody/ligand and the fluorochrome (e.g., "Annexin V-FITC") rather than instrument-specific parameters (e.g., "FL1"). Including the laser line and band-pass filter used is ideal (e.g., "FITC 530/40 488nm") [66].
- Scale Indication: Clearly indicate whether axes are logarithmic or linear, and provide tick marks with corresponding numbers [66].
- Gating Information: Display the percentage of cells within each gate or quadrant. The number of total events in a plot should be displayed in the figure or legend [63].
- Plot Type: Use density dot plots or contour plots instead of single-color dot plots to better convey the density and distribution of events [63] [65].
- Control Data: The inclusion of representative plots for controls, particularly the positive apoptosis control and the unstained/compensation controls, is highly recommended in supplemental data.
Troubleshooting Common Issues
- High Background in Healthy Cells (False Positives): This is often due to rough cell harvesting damaging membranes, allowing Annexin V to access internal PS [3]. Use gentler detachment methods and avoid enzymatic digestion where possible. Also, titrate your Annexin V reagent to minimize non-specific binding [3].
- Low Signal in Apoptotic Cells: Ensure the binding buffer contains sufficient calcium (2.5 mM CaCl₂ is standard) and is free of EDTA or other chelators [5]. Analyze samples promptly after staining, as Annexin V binding is reversible and delays can lead to loss of signal [62].
- Poor Separation of Populations: Verify that instrument compensation was set correctly using single-stained controls. Improper compensation can lead to measurement artifacts and misidentification of cell populations [63].
- Inability to Fix Cells: Unlike antibody staining, Annexin V binding is calcium-dependent and reversible. Fixing cells will disrupt this binding and is therefore not compatible with the standard protocol. Cells must be analyzed live and in suspension immediately after staining [62].
Assessing Assay Limitations and Specificity Boundaries
This application note provides a critical examination of the Annexin V staining protocol for flow cytometry, focusing on its technical limitations and boundaries in specificity for apoptosis detection. We present a structured framework for researchers to optimize experimental parameters, mitigate false positives, and accurately interpret data within the broader context of cell death research. Designed for scientists and drug development professionals, this guide integrates quantitative data comparisons, detailed methodologies, and visual workflows to enhance assay reliability and reproducibility in diverse experimental settings.
Annexin V is a 35-36 kDa calcium-dependent phospholipid-binding protein with high affinity for phosphatidylserine (PS), a phospholipid normally confined to the inner leaflet of the plasma membrane in healthy cells [11] [67]. During the early stages of apoptosis, cells undergo a loss of membrane phospholipid asymmetry, resulting in the translocation of PS from the inner to the outer leaflet [10] [67]. This exposure of PS on the cell surface serves as an "eat-me" signal for phagocytic cells in vivo and provides a specific binding site for Annexin V conjugates in vitro [10] [11]. The binding is strictly calcium-dependent, requiring Ca²⁺ concentrations typically between 2.5-5 mM in the binding buffer [10] [6].
The fundamental principle underlying the Annexin V affinity assay is this specific recognition of externalized PS, which serves as a universal marker for early apoptotic cells across most mammalian cell types [67]. When conjugated to fluorochromes such as FITC, PE, or Alexa Fluor dyes, Annexin V enables the detection and quantification of apoptotic cells through flow cytometry [11]. The typical fluorescence intensity difference between apoptotic and non-apoptotic cells stained with fluorescent Annexin V conjugates is approximately 100-fold, providing excellent signal-to-noise ratio for detection [11].
Table 1: Key Characteristics of the Annexin V Binding Mechanism
| Characteristic | Description | Experimental Implication |
|---|---|---|
| Protein Molecular Weight | 35-36 kDa | Small enough for efficient conjugation to fluorochromes without significantly impacting binding affinity |
| Binding Specificity | High affinity for phosphatidylserine (PS) | Specific detection of PS externalization, a hallmark of early apoptosis |
| Cofactor Requirement | Calcium-dependent (requires 2.5 mM CaCl₂) | Binding buffers must contain calcium and avoid chelators like EDTA |
| Binding Kinetics | Rapid association with exposed PS | Short incubation times sufficient (5-15 minutes) |
| Cellular Target | Phosphatidylserine in plasma membrane | Detection limited to cells with accessible PS in outer leaflet |
Key Limitations of Annexin V Staining
Specificity Boundaries and False Positives
The Annexin V staining assay faces significant specificity challenges that researchers must recognize. A primary concern is the inability to distinguish between apoptosis and other forms of programmed cell death that involve PS externalization, such as necroptosis, pyroptosis, and ferroptosis [1]. Furthermore, any cellular process that compromises plasma membrane integrity can permit Annexin V access to internal PS residues, creating false positive signals [11] [1]. This is particularly problematic in mechanically stressed cells or those undergoing primary necrosis. The assay provides no information about upstream apoptotic pathways or caspase activation, limiting its mechanistic insights [1]. Additionally, PS exposure can occur in non-apoptotic contexts, including cell activation, platelet stimulation, and cellular stress responses, further complicating interpretation [68].
Recent studies utilizing high-content live-cell imaging have revealed that traditional Annexin V binding buffers may themselves induce cellular stress, synergizing with pro-apoptotic agents to exaggerate apoptotic measurements [69]. For instance, vehicle-treated cells cultured in standard Annexin Binding Buffer demonstrated a twofold increase in basal apoptosis rates, while treatment with apoptosis inducers in ABB revealed eightfold higher apoptosis compared to cells in standard culture media [69]. This buffer-induced stress represents a previously underappreciated source of false positives that can significantly impact data interpretation.
Technical and Methodological Constraints
The Annexin V assay presents several technical limitations that affect its implementation and interpretation. The binding is reversible, which can affect signal stability during extended analysis periods and necessitates prompt sample processing [1]. Most protocols recommend analyzing samples within 1 hour of staining to prevent signal degradation [10] [6]. The assay is also highly sensitive to calcium concentration fluctuations, requiring precise buffer conditions that can be disrupted by residual EDTA from cell culture media or washing buffers [5] [11].
For adherent cells, the harvesting process itself presents substantial challenges, as mechanical or enzymatic detachment can artificially induce PS externalization or membrane damage [3]. Gentle detachment methods using non-enzymatic alternatives like EDTA are recommended, though these may still impact membrane integrity [10]. The requirement for flow cytometry equipment limits accessibility for some laboratories, though microscopy applications are possible with appropriate protocols [1] [67]. Finally, the transient nature of PS externalization during apoptosis means that timing of assessment is critical, and the assay provides only a snapshot of a dynamic process without kinetic context unless performed with live-cell imaging approaches [69].
Table 2: Quantitative Comparison of Annexin V Assay Limitations
| Limitation Category | Specific Issue | Impact on Data Quality | Recommended Mitigation Strategy |
|---|---|---|---|
| Specificity | Cannot distinguish apoptosis from other PS-exposing cell death pathways | May overestimate apoptotic population | Combine with caspase activation assays or morphological analysis |
| False Positives | Membrane damage allows Annexin V access to internal PS | False identification of healthy cells as apoptotic | Include viability dyes and optimize cell handling techniques |
| Technical Constraints | Reversible binding nature | Signal instability with delayed analysis | Analyze samples within 1 hour of staining |
| Buffer Effects | Standard binding buffers may induce cellular stress | Exaggerated apoptosis measurements | Consider using culture media instead of specialized buffers for live-cell assays |
| Cell Type Variability | Differential PS externalization kinetics | Inconsistent staining between cell types | Titrate Annexin V for each cell line and include appropriate controls |
Experimental Protocols for Specificity Assessment
Standard Annexin V/Propidium Iodide Staining Protocol
Materials Needed:
- Cells: Cultured cells or cell suspension from tissues (0.2-1 × 10⁶ cells per sample)
- Annexin V conjugate: Fluorescently labeled Annexin V (e.g., Annexin V-FITC, Annexin V-PE)
- Propidium Iodide (PI) solution: 50 µg/mL stock concentration, or 7-AAD as an alternative
- Binding Buffer: 10 mM HEPES, 140 mM NaCl, 2.5 mM CaCl₂, pH 7.4
- Flow cytometer with appropriate lasers and filters
- Round-bottom tubes (12 × 75 mm)
Procedure:
- Cell Preparation: Harvest cells gently to preserve membrane integrity. For adherent cells, use non-enzymatic detachment methods when possible. Collect both supernatant (containing floating cells) and adherent cells [3].
- Washing: Centrifuge cells at 300-500 × g for 5 minutes at room temperature. Discard supernatant and resuspend cells in cold PBS. Repeat wash to remove residual media and serum proteins that may contain calcium chelators [10].
- Buffer Resuspension: Resuspend cell pellet in 1X Binding Buffer at a concentration of 1 × 10⁶ cells/mL [6].
- Staining: Transfer 100 µL of cell suspension to a flow cytometry tube. Add 5 µL of Annexin V conjugate and 5 µL of PI solution (adjust volume based on titration results) [10] [7].
- Incubation: Mix gently and incubate at room temperature for 15 minutes in the dark [10] [6].
- Analysis: Add 400 µL of 1X Binding Buffer to each tube and analyze by flow cytometry within 1 hour [10] [6].
Critical Controls:
- Unstained cells: For setting flow cytometer baseline [6]
- Single-stained controls: Cells stained with Annexin V only or PI only for compensation [10] [6]
- Positive control: Cells treated with apoptosis inducer (e.g., 1-10 µM camptothecin for 4 hours or 1 µM staurosporine) [11] [3]
- Negative control: Untreated healthy cells to establish baseline staining [6]
- Specificity control: Annexin V blocking with unconjugated Annexin V (5-15 µg) to demonstrate binding competition [6]
Annexin V Titration Protocol for Optimization
Different cell types exhibit varying PS density and accessibility during apoptosis, necessitating reagent titration for optimal results [3].
Procedure:
- Prepare apoptotic cells (e.g., treat with 1 µM staurosporine for 4-6 hours) and healthy untreated cells.
- Harvest and wash both cell populations as described in section 3.1.
- Resuspend cells at 1 × 10⁶ cells/mL in 1X Binding Buffer.
- Aliquot 100 µL of apoptotic cell suspension into 5 tubes and 100 µL of healthy cell suspension into 5 tubes.
- Add varying amounts of Annexin V conjugate (e.g., 0.1 µL, 0.3 µL, 0.5 µL, 1.0 µL, 2.0 µL) to both apoptotic and healthy cells.
- Incubate for 15 minutes at room temperature in the dark, then add 400 µL of Binding Buffer.
- Analyze by flow cytometry and determine the optimal Annexin V concentration that provides maximum separation between positive (apoptotic) and negative (healthy) populations with minimal nonspecific binding [3].
Live-Cell Imaging Protocol with Annexin V
Traditional flow cytometry-based Annexin V protocols only provide endpoint data. This live-cell imaging approach enables real-time kinetic analysis of apoptosis while minimizing handling-induced artifacts [69].
Materials:
- Recombinant Annexin V conjugated to FITC or Alexa Fluor dyes
- Compatible viability dye (e.g., YOYO-3 for prolonged imaging)
- High-content live-cell imager or time-lapse fluorescence microscope
- Appropriate cell culture vessels for imaging
Procedure:
- Seed cells in appropriate imaging vessels and allow to adhere overnight.
- Add Annexin V conjugate at optimized concentration (as low as 0.25 µg/mL, approximately 10-fold less than flow cytometry concentrations) directly to culture media [69].
- Add viability dye at non-toxic concentration (YOYO-3 preferred over DRAQ7 for faster staining kinetics) [69].
- Place vessels in live-cell imager and acquire images at regular intervals (e.g., every 2 hours for 24-48 hours).
- Analyze data for kinetic parameters of apoptosis onset and progression.
This method eliminates extensive sample processing and perturbation, demonstrates greater detection sensitivity compared to flow cytometry, and provides both single-cell and population-level resolution of apoptotic kinetics [69].
The Scientist's Toolkit: Essential Research Reagent Solutions
Table 3: Key Reagent Solutions for Annexin V Assays
| Reagent Category | Specific Examples | Function & Importance | Technical Considerations |
|---|---|---|---|
| Annexin V Conjugates | Annexin V-FITC, Annexin V-PE, Annexin V-APC, Annexin V-Alexa Fluor dyes | Binds externalized phosphatidylserine on apoptotic cells | Choice of fluorophore should consider laser lines available and other channels in multicolor panels |
| Viability Dyes | Propidium Iodide (PI), 7-AAD, DRAQ7, YOYO-3, Fixable Viability Dyes | Identifies cells with compromised membrane integrity | PI and 7-AAD incompatible with live-cell imaging; fixable dyes required for intracellular staining |
| Binding Buffers | 1X Annexin Binding Buffer (10 mM HEPES, 140 mM NaCl, 2.5 mM CaCl₂, pH 7.4) | Provides calcium-dependent binding environment for Annexin V-PS interaction | Must be calcium-containing and free of EDTA/EGTA; osmolarity must be maintained to prevent artifactual staining |
| Apoptosis Inducers (Controls) | Staurosporine (pan-kinase inhibitor), Camptothecin (topoisomerase inhibitor), ABT-737 (BCL-2 inhibitor) | Generate positive control samples for assay validation | Concentration and duration must be optimized for each cell type |
| Specificity Controls | Unconjugated Annexin V (for blocking), Isotype controls, Calcium chelators (EGTA) | Verify binding specificity and minimize false positives | Blocking control should demonstrate >80% reduction in fluorescence |
Data Interpretation and Analysis Framework
Gating Strategy and Population Discrimination
Proper data interpretation requires a systematic gating approach to distinguish between viable, early apoptotic, late apoptotic, and necrotic populations. The standard analysis involves creating a two-dimensional dot plot with Annexin V fluorescence on one axis and viability dye (e.g., PI) fluorescence on the other [10].
Quadrant Analysis:
- Q1 (Annexin V-negative/PI-positive): Represents necrotic cells or cells that have lost membrane integrity without PS externalization. This population may also include late apoptotic cells that have undergone secondary necrosis [10].
- Q2 (Annexin V-positive/PI-positive): Characterizes late apoptotic cells or secondary necrotic cells with both PS externalization and compromised membrane integrity [10] [11].
- Q3 (Annexin V-negative/PI-negative): Identifies viable, healthy cells with intact membranes and no PS externalization [10].
- Q4 (Annexin V-positive/PI-negative): Represents early apoptotic cells with PS externalization but intact membranes that exclude viability dyes [10].
It is crucial to note that the classification of Q1 (Annexin V-negative/PI-positive) cells as purely necrotic is controversial, as this population may also result from handling-induced membrane damage or late-stage apoptotic cells that have lost Annexin V binding capacity due to advanced degradation [10].
Kinetic Analysis and Normalization Strategies
For accurate quantification of treatment-induced apoptosis, researchers must account for basal apoptosis rates in untreated populations. The percentage of cells specifically induced to undergo apoptosis is calculated by subtracting the percentage of apoptotic cells in the untreated control from the treated population [6]. When using kinetic approaches like live-cell imaging, normalization to initial cell numbers is essential, as treatments may affect both proliferation and cell death simultaneously [69].
Advanced analysis methods incorporate multiplex adaptations to account for variability in cell number due to treatment-induced proliferation changes and the detachment of dying cells [69]. Real-time kinetic data reveals that Annexin V positivity typically precedes viability dye incorporation by several hours, providing a clear temporal distinction between early and late apoptotic events [69]. This kinetic resolution is lost in traditional endpoint flow cytometry assays, potentially leading to misclassification of cell death stages.
Diagram 1: Apoptosis Detection Pathway
Diagram 2: Experimental Workflow
The Annexin V staining protocol remains a cornerstone technique for apoptosis detection in biomedical research, yet its limitations and specificity boundaries must be carefully considered in experimental design and data interpretation. While the assay provides sensitive detection of PS externalization as an early marker of apoptosis, researchers must acknowledge its inability to distinguish between different forms of programmed cell death and its susceptibility to false positives from membrane damage. The integration of complementary assays, such as caspase activation measurements or morphological analysis, provides a more comprehensive assessment of cell death mechanisms.
Emerging methodologies, particularly real-time live-cell imaging with Annexin V, offer promising avenues for enhanced sensitivity and kinetic resolution while minimizing handling artifacts. These approaches demonstrate approximately 10-fold greater sensitivity compared to traditional flow cytometry methods and eliminate the synergistic stress caused by standard binding buffers [69]. As the field advances, the development of next-generation Annexin V conjugates with improved stability and specificity, combined with standardized validation approaches, will further enhance the reliability and applicability of this essential technique in both basic research and drug development contexts.
Conclusion
The Annexin V staining protocol remains a cornerstone technique for apoptosis detection, offering reliable identification of early apoptotic events when properly executed. Mastery of this method requires understanding its molecular basis, meticulous attention to protocol details—especially gentle cell handling and calcium-dependent binding conditions—and rigorous validation using appropriate controls. The integration of troubleshooting modifications, such as RNase treatment to eliminate false-positive PI staining, significantly enhances data accuracy. As research progresses, the continued refinement of this assay, particularly through multiplexing with other markers and adaptation for novel cell models, will further empower its application in drug discovery, toxicology, and fundamental biological research, providing critical insights into cellular life-and-death decisions.
References
- 1. staining assay Annexin for V | Abcam protocol apoptosis [https://www.abcam.com/en-us/technical-resources/protocols/annexin-v-for-apoptosis]
- 2. Protocol for Apoptosis Assay by Flow Cytometry Using Annexin V Staining Method - PubMed [https://pubmed.ncbi.nlm.nih.gov/27430005/]
- 3. | Annexin Core | ECU V Stain Protocol Flow Cytometry [https://medicine.ecu.edu/flow-core/annexin-v-stain-protocol/]
- 4. | USF Health Apoptosis Protocols [https://health.usf.edu/medicine/corefacilities/flowcytometry/methods-apoptosis]
- 5. BestProtocols: Annexin for V Staining Protocol Flow Cytometry [https://www.thermofisher.com/us/en/home/references/protocols/cell-and-tissue-analysis/protocols/annexin-v-staining-flow-cytometry.html]
- 6. Annexin V Staining Protocol [https://www.bdbiosciences.com/en-us/resources/protocols/annexin-v-staining-protocol]
- 7. for Protocol Assay by Apoptosis Using Flow ... Cytometry Annexin [https://pmc.ncbi.nlm.nih.gov/articles/PMC4943750/]
- 8. Designing a multicolour flow protocol | Abcam cytometry [https://www.abcam.com/en-us/technical-resources/guides/flow-cytometry-guide/designing-a-multicolor-protocol]
- 9. redistribution of plasma membrane Early is... phosphatidylserine [https://pubmed.ncbi.nlm.nih.gov/7595224/]
- 10. Annexin V PI Staining Guide for Apoptosis Detection | Boster Bio [https://www.bosterbio.com/blog/post/methods/flow-cytometry-with-annexin-v-pi-staining]
- 11. Annexin V Staining | Thermo Fisher Scientific - US [https://www.thermofisher.com/us/en/home/life-science/cell-analysis/cell-viability-and-regulation/apoptosis/annexin-v-staining.html]
- 12. Quantitative analysis of annexin V-membrane interaction by flow cytometry - PubMed [https://pubmed.ncbi.nlm.nih.gov/25921613/]
- 13. Flow cytometry-based quantitative analysis of cellular protein expression in apoptosis subpopulations: A protocol - ScienceDirect [https://www.sciencedirect.com/science/article/pii/S2405844024096968]
- 14. Comprehensive analysis of cellular metrics: From proliferation to mitochondrial membrane potential and cell death in a single sample | Cell Death Discovery [https://www.nature.com/articles/s41420-025-02391-2]
- 15. Annexin V and PI Staining Protocol for Apoptosis by Flow Cytometry | Bio-Techne [https://www.bio-techne.com/resources/protocols-troubleshooting/apoptosis-flow-annexin-v-protocol]
- 16. Annexin V | AAT Bioquest [https://www.aatbio.com/products/annexin-v]
- 17. bio-techne.com/resources/ protocols -troubleshooting/ annexin - v -and-pi... [https://www.bio-techne.com/resources/protocols-troubleshooting/annexin-v-and-pi-staining-flow-cytometry]
- 18. From Basics to Mastery: A Comprehensive Guide to Annexin ... [https://www.linkedin.com/pulse/from-basics-mastery-comprehensive-guide-annexin-v-apoptosis]
- 19. My 3-step approach to gating Annexin V data appropriately | Cytometry and Antibody Technology [https://voices.uchicago.edu/ucflow/2012/07/08/my-3-step-approach-to-gating-annexin-v-data-appropriately/]
- 20. for Analyzing Apoptosis & Cell Death TUNEL Assay [https://opentrons.com/applications/flow-cytometry/tunel-assay]
- 21. Kumc measuring apoptosis using flow | PPTX cytometry [https://www.slideshare.net/slideshow/kumc-measuring-apoptosis-using-flow-cytometry/41230765]
- 22. | Thermo Fisher Scientific - US TUNEL Assays [https://www.thermofisher.com/us/en/home/life-science/cell-analysis/cell-viability-and-regulation/apoptosis/tunel-assays.html]
- 23. | Thermo Fisher Scientific - ZA Annexin V Staining [https://www.thermofisher.com/za/en/home/life-science/cell-analysis/cell-viability-and-regulation/apoptosis/annexin-v-staining.html]
- 24. MicroRNA-1 induces apoptosis by targeting prothymosin alpha in... [https://jbiomedsci.biomedcentral.com/articles/10.1186/1423-0127-18-80]
- 25. FITC Annexin Apoptosis Detection V I Kit [https://www.bdbiosciences.com/en-eu/products/reagents/flow-cytometry-reagents/research-reagents/panels-multicolor-cocktails-ruo/fitc-annexin-v-apoptosis-detection-kit-i.556547]
- 26. Apoptosis Assay Annexin | RayBiotech V Kit [https://www.raybiotech.com/raybior-annexin-v-apoptosis-kit-137-08010]
- 27. ANNEXIN V [http://www.cyto.purdue.edu/sites/default/files/__subsites__/archive/flowcyt/research/cytotech/apopto/data/chap16.htm]
- 28. Quantitation of Apoptosis and Necrosis by Annexin V Binding, Propidium Iodide Uptake, and Flow Cytometry - PubMed [https://pubmed.ncbi.nlm.nih.gov/27803250/]
- 29. Modified Annexin V/Propidium Iodide Apoptosis Assay For Accurate Assessment of Cell Death - PMC [https://pmc.ncbi.nlm.nih.gov/articles/PMC3169266/]
- 30. | Thermo Fisher Scientific - DE Annexin V Staining [https://www.thermofisher.com/de/de/home/life-science/cell-analysis/cell-viability-and-regulation/apoptosis/annexin-v-staining.html]
- 31. Fixable Viability Dyes for Flow Cytometry | Thermo Fisher Scientific - US [https://www.thermofisher.com/us/en/home/life-science/cell-analysis/flow-cytometry/flow-cytometry-assays-reagents/cell-viability-assays-flow-cytometry/fixable-viability-dyes-flow-cytometry.html]
- 32. Viability Dyes for Flow Cytometry: It’s Not Just a Matter of Life and Death [https://bitesizebio.com/22353/viability-dyes-for-flow-cytometry-its-not-just-a-matter-of-life-and-death/]
- 33. VIV-ON Fixable Viability Dyes for Flow Cytometry - Cyanagen [https://www.cyanagen.com/product_lines/viv-on-fixable-viability-dyes-for-flow-cytometry/]
- 34. GloCell™ - Fixable Viability Dyes [https://www.stemcell.com/products/brands/glocell-fixable-viability-dyes.html]
- 35. -based Flow analysis of cellular protein... cytometry quantitative [https://pmc.ncbi.nlm.nih.gov/articles/PMC11260931/]
- 36. A novel assay for apoptosis. Flow cytometric detection of phosphatidylserine expression on early apoptotic cells using fluorescein labelled Annexin V - PubMed [https://pubmed.ncbi.nlm.nih.gov/7622868/]
- 37. Principles of Advanced Flow Cytometry: A Practical Guide - PMC [https://pmc.ncbi.nlm.nih.gov/articles/PMC10802916/]
- 38. Cytometer Preferences - FlowJo Documentation | FlowJo Documentation - Documentation for FlowJo, SeqGeq, and FlowJo Portal [https://docs.flowjo.com/flowjo/setting-your-preferences/tools/prefs-cytometers/]
- 39. Avoiding False Positive Antigen Detection by Flow Cytometry on Blood Cell Derived Microparticles: The Importance of an Appropriate Negative Control - PMC [https://www.ncbi.nlm.nih.gov/pmc/articles/PMC4433223/]
- 40. Cell Harvesting Method Influences Results of Apoptosis Analysis by Annexin V Staining | Anticancer Research [https://ar.iiarjournals.org/content/33/8/3201]
- 41. FAQ Annexin V [https://www.linkedin.com/pulse/annexin-v-faq-elabscience]
- 42. Common Problems and Solutions in Annexin V-Based Flow Cytometry Apoptosis Assays [https://www.yeasenbio.com/blogs/cell/common-problems-and-solutions-in-annexin-v-based-flow-cytometry-apoptosis-assays]
- 43. PE Annexin V [https://www.bdbiosciences.com/en-us/products/reagents/flow-cytometry-reagents/research-reagents/single-color-antibodies-ruo/pe-annexin-v.556421]
- 44. Experimental Control Groups Setting Annexin V [https://www.elabscience.com/resources/cell-function-guidelines-and-q-a/984]
- 45. Analysis of T-cell Receptor-Induced Calcium Influx in Primary Murine T-cells by Full Spectrum Flow Cytometry - PMC [https://pmc.ncbi.nlm.nih.gov/articles/PMC11032009/]
- 46. Calcium Indicators | Thermo Fisher Scientific - US [https://www.thermofisher.com/us/en/home/life-science/cell-analysis/cell-viability-and-regulation/ion-indicators/calcium-indicators.html]
- 47. with Flow | Abcam cytometry PI staining [https://www.abcam.com/en-us/technical-resources/protocols/flow-cytometry-with-propidium-iodide-staining]
- 48. DNA Content for Cell Cycle Analysis of Fixed Cells With Propidium... [https://med.virginia.edu/flow-cytometry-facility/equipment/resources1/protocols/dna-content-for-cell-cycle-analysis-of-fixed-cells-with-propidium-iodide/]
- 49. Sorting Large and Materials by Cells Flow Cytometry [https://bitesizebio.com/13694/sorting-large-cells-by-flow-cytometry/]
- 50. Protocols for Surface and Intracellular Antigen... Flow Cytometry [https://www.jove.com/t/52241/flow-cytometry-protocols-for-surface-intracellular-antigen-analyses]
- 51. Recommended controls for flow | Abcam cytometry [https://www.abcam.com/en-us/technical-resources/guides/flow-cytometry-guide/recommended-controls-for-flow-cytometry]
- 52. Beyond annexin V: fluorescence response of cellular membranes to apoptosis - PMC [https://pmc.ncbi.nlm.nih.gov/articles/PMC3560882/]
- 53. Annexin V for flow cytometric detection of phosphatidylserine expression on B cells undergoing apoptosis - PubMed [https://pubmed.ncbi.nlm.nih.gov/8068938/]
- 54. Frontiers | Cell Cytometry: Review and Perspective on Biotechnological Advances [https://www.frontiersin.org/journals/bioengineering-and-biotechnology/articles/10.3389/fbioe.2019.00147/full]
- 55. Critical assessment of automated flow cytometry data analysis techniques | Nature Methods [https://www.nature.com/articles/nmeth.2365]
- 56. The Importance Of Accurate Cell Counting In Flow Cytometry And Cell Sorting | Thermo Fisher Scientific - US [https://www.thermofisher.com/us/en/home/life-science/cell-analysis/cell-analysis-learning-center/cell-analysis-resource-library/cell-analysis-application-notes/importance-accurate-cell-counting-flow-cytometry-cell-sorting.html]
- 57. The Detailed Comparison of Cell Death Detected by Annexin V-PI... [https://link.springer.com/article/10.1007/s10895-018-2306-4]
- 58. of the Comparison fluorescence automated viability test... microscopic [https://pubmed.ncbi.nlm.nih.gov/21437999/]
- 59. Annexin A5 - Wikipedia [https://en.wikipedia.org/wiki/Annexin_A5]
- 60. The Detailed Comparison of Cell Death Detected by Annexin -PI... V [https://pubmed.ncbi.nlm.nih.gov/30343360/]
- 61. Rapid detection of neutral lipid in green microalgae by flow cytometry in combination with Nile red staining—an improved technique | Annals of Microbiology | Full Text [https://annalsmicrobiology.biomedcentral.com/articles/10.1007/s13213-014-0937-5]
- 62. Locating Your Cellular Apoptosis Squad: Annexin Staining Assays V [https://bitesizebio.com/28356/locating-your-cellular-apoptosis-squad-annexin-v-staining-assays/]
- 63. Publishing flow cytometry data - PMC [https://www.ncbi.nlm.nih.gov/pmc/articles/PMC2822558/]
- 64. for flow-cytometry ( Gating ) experiment. strategy Annexin V [https://figshare.com/articles/figure/The_first_i_in_vivo_i_multiparametric_comparison_of_different_radiation_exposure_biomarkers_in_human_blood/5922256/1]
- 65. How to Interpret Flow Cytometry Data | Fortis Life Sciences [https://www.fortislife.com/resources/antibody-resources/how-to-interpret-flow-cytometry-data]
- 66. Spot the Difference: 5 Ways to Improve the Presentation of Your Flow Cytometry Data [https://bitesizebio.com/26007/spot-the-difference-5-ways-to-improve-the-presentation-of-your-flow-cytometry-data/]
- 67. Annexin V-affinity assay: a review on an apoptosis detection system based on phosphatidylserine exposure - PubMed [https://pubmed.ncbi.nlm.nih.gov/9450519/]
- 68. as a probe of aminophospholipid exposure and platelet... Annexin V [https://pubmed.ncbi.nlm.nih.gov/8490169/]
- 69. Robust high-throughput kinetic analysis of apoptosis with real-time high-content live-cell imaging | Cell Death & Disease [https://www.nature.com/articles/cddis2016332]