Automated vs. Manual Apoptosis Detection: A Comparative Guide for Modern Biomedical Research
This article provides a comprehensive analysis of automated algorithmic methods versus traditional manual counting for apoptosis detection, tailored for researchers and drug development professionals.
Automated vs. Manual Apoptosis Detection: A Comparative Guide for Modern Biomedical Research
Abstract
This article provides a comprehensive analysis of automated algorithmic methods versus traditional manual counting for apoptosis detection, tailored for researchers and drug development professionals. It explores the foundational principles of programmed cell death, details cutting-edge methodological applications from high-content imaging to machine learning, addresses critical troubleshooting and optimization strategies, and offers a rigorous validation framework for comparing technique performance. The synthesis of current data aims to equip scientists with the knowledge to select appropriate detection methodologies, enhance experimental reproducibility, and accelerate therapeutic discovery in areas including oncology, neurodegeneration, and toxicology.
The Critical Foundation: Understanding Apoptosis Mechanisms and Detection Imperatives
The Biological Significance of Apoptosis in Health and Disease
Apoptosis, or programmed cell death, is a fundamental biological process crucial for development, tissue homeostasis, and defense against disease. Its dysregulation is implicated in various pathologies, including cancer, autoimmune disorders, and neurodegenerative diseases. Accurately detecting and quantifying apoptosis is therefore essential in both basic research and drug development. This guide provides an objective comparison of established and emerging methods for apoptosis detection, framing the analysis within the broader thesis of automated algorithms versus manual counting in research. We summarize experimental data and provide detailed protocols to inform researchers, scientists, and drug development professionals in selecting the most appropriate methodology for their specific applications.
Apoptosis Signaling Pathways
Apoptosis proceeds through two main pathways that converge on a common execution phase. The diagram below illustrates the key molecular events in these processes.
Diagram 1: Core apoptotic signaling pathways. The extrinsic pathway begins with external death signals, while the intrinsic pathway responds to internal damage. Both converge on caspase-3 activation [1] [2].
The extrinsic pathway is activated by external signals binding to death receptors on the cell membrane, leading to the formation of the death-inducing signaling complex and activation of caspase-8 [1]. In some cell types (Type I), caspase-8 directly activates the executioner caspase-3. In others (Type II), it cleaves Bid, which activates Bax, connecting to the intrinsic pathway [1].
The intrinsic pathway responds to internal cellular damage, such as DNA damage or oxidative stress. This leads to Bax activation and mitochondrial outer membrane permeabilization, resulting in cytochrome c release [1]. Cytochrome c forms the apoptosome complex with Apaf-1 and procaspase-9, leading to caspase-9 activation, which then activates caspase-3 [1].
The execution phase, mediated primarily by caspase-3, involves the cleavage of key cellular components, resulting in the characteristic morphological changes of apoptosis, including cell shrinkage, chromatin condensation, and DNA fragmentation [1] [2].
Comparative Analysis of Apoptosis Detection Methods
The following table provides a quantitative and qualitative comparison of major apoptosis detection techniques, highlighting the performance differences between manual and automated approaches.
Table 1: Performance comparison of apoptosis detection methods
| Method | Primary Readout | Throughput | Key Advantages | Key Limitations | Reported Precision/Sensitivity |
|---|---|---|---|---|---|
| Manual Fluorescence Microscopy | Visual cell counting based on fluorescent stains (e.g., Annexin V, 6-CFDA) [3]. | Low (hundreds to thousands of cells) [3]. | Direct imaging; low initial cost. | Prone to user bias; labor-intensive; low throughput; difficult to distinguish apoptosis from necrosis [3] [4]. | Subjective, highly variable; strong correlation (r=0.94) with FCM but can overestimate viability under high cytotoxicity [4]. |
| Automated Image Analysis (ApoNecV) | Automated quantification of viable, apoptotic, and necrotic cells from fluorescent images [3]. | Medium (processes large datasets automatically) [3]. | Unbiased; high reproducibility; processes large datasets; faster than manual counting [3]. | Requires specific staining kits (APOAC) and imaging conditions (10x objective) [3]. | High correlation with manual counts; specific precision/sensitivity not quantified in the provided source [3]. |
| Automated Algorithm (MATLAB) | Quantification of biomarker translocation (e.g., Cytochrome C, Caspase-3/8) in reporter cells [1] [2]. | High (single or multiple cells, scalable) [1]. | Robust, tunable; forgoes simple image statistics; suitable for high-throughput screening [1]. | Requires generation of specialized reporter cell lines [1]. | Precision >90%; Sensitivity >85% [1] [2]. |
| Flow Cytometry (FCM) | Multiparametric analysis of fluorescent markers (e.g., Annexin V, PI, Hoechst) in cell suspension [4]. | High (thousands of cells per second). | High-throughput; quantitative; distinguishes viable, early/late apoptotic, and necrotic populations [4]. | Requires cell suspension; cannot provide spatial information; high instrument cost [4]. | High precision; revealed 0.2-0.7% viability where FM showed 9-10% under high cytotoxic stress [4]. |
| AI-Based Sensing (MSA-RCNN) | Analysis of subtle nuclear texture changes (chromatin condensation) from stained micrographs [5]. | Potentially High (once validated). | Label-free; uses standard light microscopy; detects early apoptotic changes [5]. | Model in conceptual stage; challenges in interpretability and generalization [5]. | Performance metrics not yet available for the proposed MSA-RCNN model [5]. |
Key Experimental Data Supporting the Comparison
Flow Cytometry vs. Fluorescence Microscopy: A direct comparison study treating SAOS-2 cells with Bioglass 45S5 particles found a strong correlation (r = 0.94) between viability measurements from fluorescence microscopy (FM) and flow cytometry (FCM). However, under high cytotoxic stress (<38 µm particles at 100 mg/mL), FCM measured viability at 0.2-0.7%, while FM measurements were 9-10%, demonstrating FCM's superior sensitivity in detecting severe cytotoxicity [4].
Automated Algorithms vs. Manual Analysis: The development of a MATLAB-based algorithm for analyzing biomarker translocation in reporter cell lines demonstrated the superior robustness of automation. The optimized algorithm achieved a precision greater than 90% and a sensitivity higher than 85%, outperforming manual or simpler statistical analyses which are more prone to bias and misinterpretation [1] [2].
Detailed Experimental Protocols
Protocol 1: Apoptosis/Necrosis Detection via ApoNecV Macro
This protocol uses the ApoNecV macro for the Fiji platform to automatically distinguish between viable, apoptotic, and necrotic cells [3].
1. Cell Culture and Treatment:
- Culture cells (e.g., HeLa cells) in an appropriate medium (e.g., high-glucose DMEM with 10% FBS) on a cover glass bottom plate designed for confocal microscopy [3].
- Treat cells with the apoptotic or necrotic stimulus of choice (e.g., for necrosis induction: 5 µM ZnPc and 5 min of irradiation with 21 mW/cm² red LED light) [3].
2. Staining:
- Stain cell samples using the Annexin V-CY3TM Apoptosis Detection Kit (APOAC, Sigma Aldrich) according to the official protocol [3].
- Incubate control and treated samples simultaneously with both probes: Annexin-Cy3.18 (AnnCy3) and 6-Carboxyfluorescein diacetate (6-CFDA), for 15 minutes at room temperature without light exposure [3].
3. Imaging:
- Image cells immediately after staining in Phosphate Buffer Saline (PBS) using a confocal spinning disk microscope.
- Use a 10x objective (e.g., EC Plan-Neofluar 10x/0.3 NA) as required for ApoNecV compatibility [3].
- Set filters for the probes: 6-CF (ex 495nm/em 520 nm), excited with a 488 nm laser, and AnnCy3 (ex 550 nm/em 570 nm), excited with a 561 nm laser [3].
- Acquire multiple images per sample to ensure reproducibility [3].
4. Automated Image Analysis with ApoNecV:
- Open the stack image (green, red, and transmitted light channels) in the Fiji platform with the ApoNecV macro installed.
- The macro automatically performs background subtraction using the Rolling Ball Radius algorithm (50 for 6-CF, 30 for AnnCy3) [3].
- Deconvolution is then performed using an automatically generated Diffraction PSF to correct for optical distortions [3].
- The macro then quantifies and classifies cells based on their fluorescence patterns, outputting the counts of viable, apoptotic, and necrotic cells.
Protocol 2: Analysis of Biomarker Translocation using a MATLAB Algorithm
This protocol uses a vision-based, tunable, automated algorithm in MATLAB to analyze apoptosis via signal translocation in reporter cells [1] [2].
1. Reporter Cell Line Generation:
- Construct reporter cell lines for key apoptotic events. For example:
- Cytochrome C (Cyt-C) Reporter: Tag cytochrome C with Green Fluorescent Protein (GFP). The translocation of Cyt-C-GFP from the mitochondria to the cytosol is a marker of intrinsic pathway activation [1].
- Caspase-3/8 Reporter: Use a plasmid where a Caspase-specific cleavage site (DEVD for caspase-3, IETD for caspase-8) bridges a Nuclear Export Signal (NES) to a Nuclear Localization Sequence (NLS) tagged to EYFP. Caspase activation cleaves the EYFP-NLS, allowing its transport into the nucleus [1].
- Stably transfect cancer cell lines (e.g., PC9 lung cancer or T47D breast cancer cells) with these reporter constructs [1].
2. Live-Cell Imaging:
- Expose the reporter cells to apoptotic stimuli (e.g., chemotherapeutic drugs, TRAIL).
- Perform live-cell imaging on a conventional epifluorescence microscope over time to track the fluorescent signal dynamics without the need for fixation or additional dyes [1].
3. Automated Algorithm Analysis:
- Process the acquired time-lapse images using the custom MATLAB algorithm.
- The algorithm is designed to identify and quantify the spatial translocation patterns of the fluorescent signals (e.g., the dispersion of Cyt-C-GFP from punctate mitochondrial patterns, or the accumulation of EYFP in the nucleus) [1].
- It uses robust, tunable feature extraction to avoid the pitfalls of simple image statistics, making it suitable for high-throughput analysis of single cells or cell populations [1].
The workflow for these automated analysis methods is summarized below.
Diagram 2: Automated analysis workflow. After sample preparation, imaging, and processing, analysis can proceed via the ApoNecV or MATLAB pathway for quantitative classification [3] [1].
The Scientist's Toolkit: Essential Reagents and Materials
Table 2: Key research reagents and solutions for apoptosis detection
| Reagent/Material | Function in Apoptosis Detection | Example Application |
|---|---|---|
| Annexin V-CY3TM Kit | Contains Annexin-Cy3.18 (binds phosphatidylserine) and 6-CFDA (metabolized in live cells) to distinguish viable, apoptotic, and necrotic cells by fluorescence microscopy or flow cytometry [3]. | Used with the ApoNecV macro for automated classification of cell death types [3]. |
| Caspase-3/8 Reporter Plasmid | Genetic construct that expresses a fluorescent protein (EYFP) fused to an NLS via a caspase-cleavable linker. Caspase activation releases the NLS, causing nuclear accumulation of the fluorescence [1]. | Enables live-cell monitoring of caspase activation without fixation or staining; used with automated translocation algorithms [1]. |
| Cytochrome C-GFP Reporter | A fusion protein of cytochrome C and GFP. Its release from mitochondria into the cytosol during apoptosis is visualized as a change from a punctate to a diffuse fluorescence pattern [1]. | Serves as a reporter for the activation of the intrinsic apoptotic pathway in live cells [1]. |
| Flow Cytometry Staining Panel | A combination of dyes and antibodies for multiparametric analysis. Example: Hoechst (viability), DiIC1 (mitochondrial membrane potential), Annexin V-FITC (phosphatidylserine exposure), PI (membrane integrity) [4]. | Allows simultaneous quantification of viable, early apoptotic, late apoptotic, and necrotic cell populations in a high-throughput manner [4]. |
| Novel Caspase-3 Reporter (GFN2) | A genetically encoded GFP-based biosensor where insertion of a caspase-3 cleavage sequence (DEVDG) causes a loss of fluorescence upon caspase-3 activation during apoptosis [6]. | Allows real-time, sensitive, and specific monitoring of apoptosis in living cells and animal models without the need for additional staining [6]. |
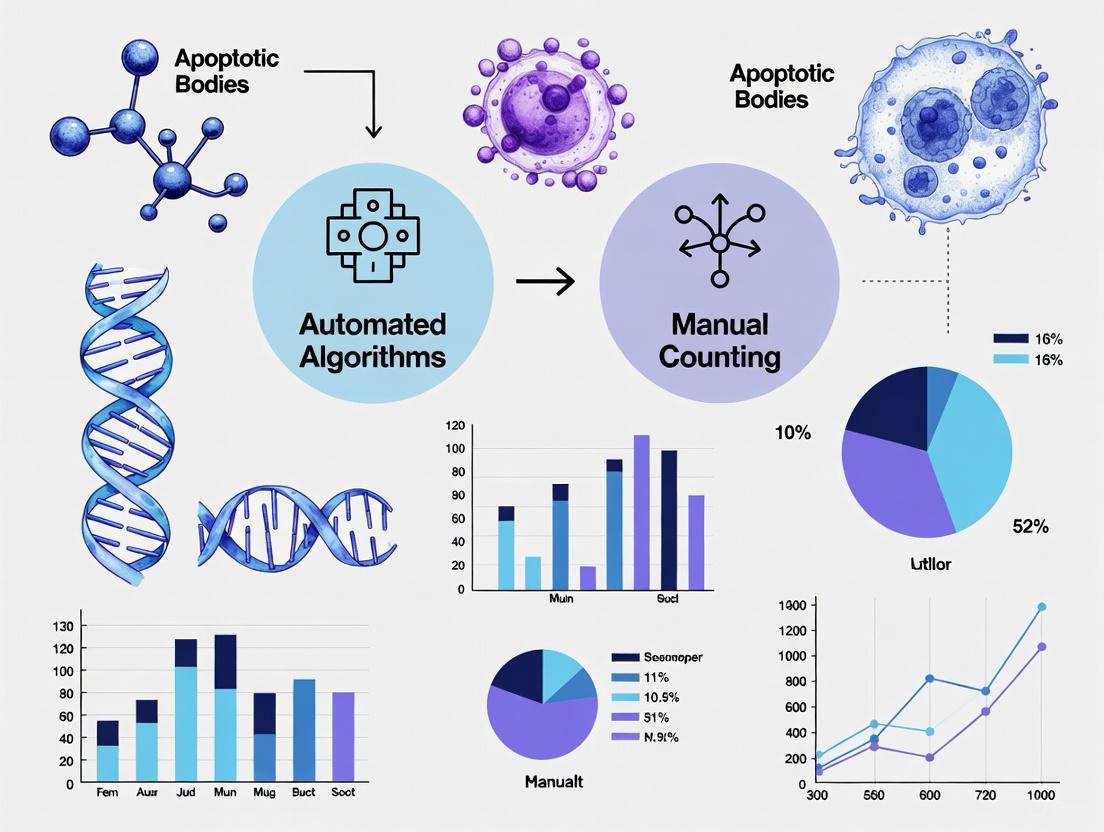
The move from manual counting to automated algorithms represents a paradigm shift in apoptosis research. Manual methods, while providing direct visualization, are plagued by low throughput, subjectivity, and an inability to capture complex spatial dynamics [3] [4]. Automated solutions, including image analysis macros like ApoNecV [3], specialized MATLAB algorithms for translocation analysis [1] [2], and the gold-standard throughput of flow cytometry [4], offer enhanced reproducibility, quantitation, and scalability essential for drug discovery and detailed mechanistic studies.
The future of apoptosis detection is being shaped by artificial intelligence and novel biosensors. AI models, such as the proposed Multi-Scale Attention Residual CNN, promise label-free, early apoptosis detection by identifying subtle, pre-lethal changes in nuclear texture from standard micrographs [5]. Concurrently, the development of sophisticated fluorescent reporters, like the caspase-3-activated GFP sensor, enables highly sensitive real-time monitoring of apoptosis in living systems [6]. These advancements, coupled with the growing integration of AI in the apoptosis assays market [7], are set to further automate workflows, improve predictive capabilities, and deepen our understanding of the biological significance of apoptosis in health and disease.
Core Morphological and Biochemical Hallmarks of Apoptosis
Apoptosis, a form of programmed cell death (PCD), is a tightly regulated process essential for tissue development, homeostasis, and the elimination of damaged cells. Unlike necrotic cell death, which results from acute injury and triggers inflammatory responses, apoptosis is characterized by a series of distinctive morphological and biochemical changes that allow for clean and controlled cellular disposal. This process is crucial in numerous physiological contexts, and its dysregulation is implicated in various diseases, including cancer, neurodegenerative disorders, and autoimmune conditions [8] [9]. The precise detection and quantification of apoptosis are therefore paramount in basic biological research and drug development, particularly in oncology, where the effectiveness of many chemotherapeutic agents is gauged by their ability to induce apoptotic cell death in cancer cells.
Within the context of a broader thesis on apoptosis detection methodologies, this guide provides a foundational understanding of the core hallmarks of apoptosis. It objectively frames these hallmarks as the fundamental biomarkers that both manual and automated detection algorithms are designed to identify and quantify. The shift from traditional, low-throughput manual counting to advanced, automated algorithms represents a significant evolution in life sciences research, enabling higher precision, reproducibility, and scalability in experimental data. This guide will compare these approaches, providing supporting experimental data to illustrate the ongoing transformation in cellular analysis.
Core Hallmarks: Morphology and Biochemistry
The execution of apoptosis is mediated by a family of cysteine proteases known as caspases, which selectively cleave vital cellular substrates, leading to the systematic dismantling of the cell [8]. The process can be triggered by various internal (mitochondrial) or external signals, culminating in a cascade of characteristic events.
Key Morphological Hallmarks
The physical changes during apoptosis are sequential and definitive, designed to package the cell for efficient clearance by phagocytes.
- Cell Shrinkage and Chromatin Condensation: One of the earliest morphological changes is the compaction of the cell and its organelles. The nucleus undergoes chromatin condensation, where nuclear material aggregates into dense, marginal masses [9].
- Membrane Blebbing and Apoptotic Body Formation: The cell membrane undergoes dynamic changes, forming small protrusions known as blebs. Ultimately, the cell fragments into small, membrane-bound vesicles called apoptotic bodies (ABs) [8] [9]. These apoptotic bodies contain fragmented DNA, shrunken organelles, and portions of the cytoplasm. The formation of apoptotic bodies was once thought to be limited to multicellular animals, but evidence has shown it also occurs in unicellular eukaryotes like the cryptophyte alga Guillardia theta, suggesting a more ancient evolutionary origin for this process [9].
- Rapid Phagocytosis: The final morphological stage is the swift engulfment of the apoptotic bodies by neighboring phagocytic cells. This process prevents the release of cellular contents into the surrounding tissue, thereby avoiding an inflammatory response [8].
Key Biochemical Hallmarks
The morphological features are underpinned by specific biochemical events that serve as primary targets for detection assays.
- Caspase Activation: The activation of a cascade of caspase enzymes is a central biochemical event in apoptosis. These enzymes cleave key cellular proteins, inactivating some and activating others, to orchestrate the cell's demise [8].
- Phosphatidylserine Externalization: In healthy cells, the phospholipid phosphatidylserine (PS) is restricted to the inner leaflet of the plasma membrane. During early apoptosis, PS is translocated to the outer membrane leaflet, where it serves as an "eat-me" signal for phagocytes [10].
- DNA Fragmentation: Caspase-activated DNases catalyze the cleavage of nuclear DNA into internucleosomal fragments of 180-200 base pairs. This results in a characteristic "DNA ladder" pattern when separated by gel electrophoresis [8].
The diagram below illustrates the logical sequence of these key hallmarks, connecting the initiating stimulus to the final phagocytic outcome.
Detection Methodologies: Manual vs. Automated Algorithms
The hallmarks of apoptosis form the basis for its detection. Traditionally, researchers relied on manual microscopy and counting. However, technological advances have introduced automated, algorithm-driven platforms that offer significant improvements in throughput and objectivity.
Experimental Protocols for Key Assays
The following are standard protocols for common apoptosis detection methods, which can be performed either manually or in an automated fashion.
Annexin V Staining Assay (for PS Externalization)
- Principle: Fluorescently labeled Annexin V protein binds with high affinity to externalized phosphatidylserine on the cell surface.
- Protocol: Cells are harvested and washed in cold buffer. A pellet of (1 \times 10^5) to (1 \times 10^6) cells is resuspended in 100 µL of binding buffer. Annexin V-FITC (e.g., 5 µL) and a viability dye like Propidium Iodide (PI, 5 µL) are added. The cell suspension is incubated for 15 minutes in the dark at room temperature. Finally, 400 µL of binding buffer is added, and the cells are analyzed by flow cytometry or fluorescence microscopy within one hour [10]. Viable cells are Annexin V-/PI-; early apoptotic cells are Annexin V+/PI-; and late apoptotic/necrotic cells are Annexin V+/PI+.
TUNEL Assay (for DNA Fragmentation)
- Principle: The Terminal deoxynucleotidyl transferase dUTP Nick End Labeling (TUNEL) assay enzymatically labels the 3'-hydroxyl termini of fragmented DNA with a fluorescent probe.
- Protocol: Cells or tissue sections are fixed with 4% paraformaldehyde for 15-30 minutes and permeabilized with a detergent (e.g., 0.1% Triton X-100 in sodium citrate) on ice. After washing, the sample is incubated with the TUNEL reaction mixture containing terminal deoxynucleotidyl transferase (TdT) and fluorescently labeled dUTP for 60 minutes at 37°C in a humidified atmosphere. The sample is washed and analyzed by flow cytometry or fluorescence microscopy. Positive TUNEL staining is a hallmark of apoptotic cells [8] [9].
Caspase Activity Assay
- Principle: This assay uses synthetic substrates that become fluorescent upon cleavage by active caspase enzymes.
- Protocol: Cells are lysed, and the lysate is incubated with a caspase-specific substrate (e.g., DEVD-AFC for caspase-3/7). The release of the fluorescent moiety (e.g., AFC) is measured over 1-2 hours using a fluorescence microplate reader with excitation/emission wavelengths specific to the fluorochrome. The increase in fluorescence intensity is proportional to caspase activity in the sample.
Comparison of Manual and Automated Analysis
The core difference between methodologies lies in how the data from the above assays is processed and quantified.
Table 1: Comparison of Manual Counting and Automated Algorithm-Based Analysis
| Feature | Manual Microscopy & Counting | Automated Algorithm-Based Platforms |
|---|---|---|
| Principle | Visual inspection and manual tallying of stained cells by a researcher. | Automated image capture and analysis using defined algorithms for cell segmentation and classification. |
| Throughput | Low; time-consuming and limited by human stamina. | High; capable of analyzing >10,000 cells per test rapidly [11]. |
| Objectivity | Subject to user bias and inter-observer variability. | High reproducibility; results are independent of user experience [11]. |
| Quantitative Rigor | Semi-quantitative; often based on a limited number of cells and fields of view. | Highly quantitative; provides robust statistical data on large sample sizes. |
| Key Applications | Low-throughput experiments, educational settings, initial pilot studies. | High-throughput drug screening, validation studies, reproducible quantitative research. |
Supporting the advantages of automation, a study validating the Quantella smartphone-based cell analysis platform demonstrated its capability to analyze over 10,000 cells per test. The platform's adaptive image-processing pipeline, which employs multi-exposure fusion and morphological filtering, achieved deviations of less than 5% compared to the gold standard, flow cytometry. This high level of accuracy, achieved without user-defined parameters or deep learning, highlights the potential of automated algorithms to deliver reproducible and statistically reliable results [11].
Furthermore, in the field of immunohistochemistry (IHC), deep learning algorithms are now being applied for fully automated quantitative analysis. One such method uses the CellViT nuclear segmentation algorithm combined with a region-growing algorithm to precisely identify and quantify staining intensities in whole-slide images. This approach has been shown to achieve greater accuracy in specific quantitative metrics compared to traditional manual interpretation [12], underscoring the growing dominance of computational methods in cellular analysis.
The Scientist's Toolkit: Essential Reagents & Materials
Successful apoptosis detection, regardless of the analytical method, relies on a suite of essential reagents and kits.
Table 2: Key Research Reagent Solutions for Apoptosis Detection
| Reagent / Material | Function & Application |
|---|---|
| Annexin V-Based Kits | Used for flow cytometry or microscopy to detect PS externalization on the outer leaflet of the plasma membrane, an early apoptosis marker. Often includes a viability dye like PI. |
| Caspase Activity Assay Kits | Fluorometric or colorimetric kits that measure the enzymatic activity of specific caspases (e.g., caspase-3, -8, -9) central to the apoptotic pathway. |
| TUNEL Assay Kits | Labels fragmented DNA in apoptotic cells, detectable by fluorescence microscopy, flow cytometry, or colorimetry. Considered a marker for mid-to-late apoptosis. |
| Antibodies to Apoptotic Markers | Includes antibodies against cleaved/active forms of caspases (e.g., cleaved caspase-3) and other proteins like PARP for detection by Western blot or IHC. |
| DNA Staining Dyes | Dyes like DAPI or Hoechst stain all nuclei, while PI stains nuclei of dead/dying cells with compromised membranes. Used for cell cycle analysis and viability. |
| Flow Cytometer / Fluorescence Microscope | Essential instrumentation for analyzing fluorescently labeled samples from Annexin V, TUNEL, and other fluorescence-based assays. |
| High-Content Imaging Systems | Automated microscopes integrated with sophisticated analysis software for high-throughput, multi-parameter analysis of apoptosis in cell populations. |
The core morphological and biochemical hallmarks of apoptosis—from caspase activation and phosphatidylserine externalization to DNA fragmentation and apoptotic body formation—provide a definitive roadmap for identifying this form of programmed cell death. While manual detection methods based on these hallmarks have been foundational to the field, the rising demands of modern drug discovery and precision medicine are driving a definitive shift toward automation.
Automated algorithms, whether integrated into platforms like Quantella for cell counting or deep learning models for IHC analysis, offer unparalleled advantages in throughput, objectivity, and quantitative power. The experimental data confirms that these methods can achieve accuracy comparable to gold-standard techniques. As these technologies continue to evolve with AI and real-time analytics, they are poised to become the indispensable toolkit for researchers and drug development professionals seeking to understand and quantify cell death with precision and efficiency.
In the context of a broader thesis on apoptosis detection, understanding conventional manual techniques is fundamental for appreciating the advancements offered by automated algorithms. Apoptosis, or programmed cell death, is a critical process in development, tissue homeostasis, and disease pathogenesis, particularly in cancer and neurodegenerative disorders [13]. Accurate detection of this process remains a cornerstone of biomedical research and drug development. This guide provides an objective comparison of conventional manual detection techniques, outlining their core principles, workflows, advantages, and limitations when compared to emerging automated technologies.
Core Principles of Apoptosis and Manual Detection
Apoptosis progresses through distinct phases characterized by specific morphological and biochemical changes, which form the basis for manual detection techniques.
Morphological Hallmarks
The execution of apoptosis involves a series of conserved morphological events observable via microscopy. In Phase I, cells undergo shrinkage, cytoplasm condensation, and disappearance of surface microvilli. Phase IIa features nuclear changes, including chromatin condensation (pyknosis) and marginalization along the nuclear membrane, followed by nuclear fragmentation. In Phase IIb, the cell membrane forms protrusions that break apart into membrane-bound vesicles called apoptotic bodies, which are then phagocytosed by neighboring cells without causing inflammation [13].
Biochemical Hallmarks
The key biochemical event is the activation of caspases, a family of cysteine proteases, and endonucleases. This leads to the cleavage of cellular proteins and the internucleosomal fragmentation of genomic DNA into oligonucleosomal fragments of 180-200 base pairs and their multiples, a biochemical hallmark of apoptosis [14] [13].
Established Manual Techniques: Principles and Protocols
Manual detection methods leverage these morphological and biochemical hallmarks, each with specific protocols and applications. The table below summarizes the key manual techniques used by researchers.
Table 1: Manual Apoptosis Detection Techniques
| Method Category | Specific Technique | Principle / Basis | Key Experimental Steps | Primary Detection Phase |
|---|---|---|---|---|
| Morphological | Light Microscopy (e.g., H&E, Giemsa) | Observation of cell shrinkage, nuclear condensation, and apoptotic bodies [13]. | 1. Fix cells/tissue. 2. Stain with H&E, Giemsa, or Wright's stain. 3. Observe under light microscope. | Middle to Late (Phase IIb) [13] |
| Morphological | Fluorescence/Confocal Microscopy (e.g., Hoechst, DAPI) | Fluorescent dyes bind DNA; apoptotic cells show brighter, condensed nuclei [13]. | 1. Stain cells with Hoechst 33342, DAPI, or Acridine Orange. 2. Observe nuclear morphology via fluorescence/confocal microscope. | Middle to Late (Phase IIb) [13] |
| Molecular Biological | DNA Gel Electrophoresis | Detection of DNA laddering (180-200 bp fragments) from endonuclease cleavage [13]. | 1. Extract genomic DNA. 2. Run DNA on agarose gel. 3. Visualize with UV light after ethidium bromide staining. | Middle to Late [13] |
| Molecular Biological | TUNEL Assay (TdT dUTP Nick-End Labeling) | Enzymatic labeling of 3'-OH ends of DNA fragments in situ [13]. | 1. Fix and permeabilize cells/tissue. 2. Incubate with TdT enzyme and labeled dUTP (e.g., FITC). 3. Detect label via fluorescence microscopy or flow cytometry. | Late [13] |
| Immunological | Flow Cytometry with Annexin V/PI | Annexin V binds phosphatidylserine (PS) externalized on the cell membrane; Propidium Iodide (PI) stains DNA in dead cells with compromised membranes [15]. | 1. Harvest and wash cells. 2. Stain with FITC-Annexin V and PI. 3. Analyze by flow cytometry within 1 hour. | Early (Annexin V+/PI-) to Late (Annexin V+/PI+) |
The following diagram illustrates the relationship between the apoptotic timeline, the detectable hallmarks, and the manual techniques that exploit them.
Experimental Data: Manual vs. Automated Performance
Quantitative comparisons reveal critical differences in performance and reliability between manual and automated methods.
Accuracy and Variability
A primary challenge with manual techniques is subjective interpretation, leading to significant user-to-user variability. In a comparison of cell counting methods, results from a hemocytometer showed "much higher" user-to-user variability compared to an automated cell counter (Countess II) [16]. Manual counts often suffer from insufficiently small sample sizes, as researchers frequently count only one or two squares on a hemocytometer grid to save time, resulting in high standard deviations [16]. Furthermore, manual analysis of clumped cells is highly challenging and prone to inaccuracy [16].
Throughput and Efficiency
The time investment required is a major limitation of manual workflows. Counting cells with a hemocytometer can take up to 5 minutes per sample, whereas an automated counter can complete the same task in approximately 10 seconds [16]. This translates to significant time savings; a researcher counting five slides per day could save around 10-15 hours per month by switching to an automated system [16].
Table 2: Subjective Variability and Throughput in Cell Counting
| Performance Metric | Manual Hemocytometer | Automated Cell Counter |
|---|---|---|
| User-to-User Variability | High ("much higher") [16] | Significantly Reduced [16] |
| Typical Counting Time | Up to 5 minutes [16] | ~10 seconds [16] |
| Time Saved per Month* | Baseline | ~10 to 15 hours [16] |
| Counting Area | Often 1-2 grid squares (to save time) [16] | Equivalent of ~4 grid squares (standardized) [16] |
| Accuracy with Clumped Cells | Low (difficult to discern borders) [16] | High (algorithms resolve cell boundaries) [16] |
| Data Captured | Basic counts (total, live, dead) [16] | Counts, average size, size distribution, fluorescence intensity [16] |
| *Assumes five slides (two samples each) counted per day. |
The Scientist's Toolkit: Key Reagents and Materials
Successful execution of manual apoptosis assays requires specific reagents and instruments.
Table 3: Essential Research Reagents and Materials for Manual Apoptosis Detection
| Item | Function / Application |
|---|---|
| Hemocytometer | A slide with a gridded chamber for manually counting cells under a microscope [16]. |
| Microscope | Essential for observing morphological changes (light microscope) or fluorescent stains (fluorescence microscope) [13]. |
| H&E, Giemsa, Wright's Stain | Stains for visualizing cellular and nuclear morphology under a light microscope [13]. |
| Hoechst 33342, DAPI, Acridine Orange | Fluorescent DNA-binding dyes used to observe nuclear condensation and fragmentation [13]. |
| Annexin V-FITC/PI Kit | A standard kit for flow cytometry to distinguish early apoptotic (Annexin V+/PI-) from late apoptotic/necrotic (Annexin V+/PI+) cells [15]. |
| TUNEL Assay Kit | A kit containing TdT enzyme and labeled nucleotides for in situ labeling of DNA strand breaks [13]. |
| Caspase Activity Assay Kits | Kits to measure the enzymatic activity of caspases (e.g., Caspase-3) using colorimetric or fluorometric substrates. |
| JC-1 Dye | A fluorescent dye used to measure mitochondrial membrane potential; it shifts from red (high potential) to green (low potential) during early apoptosis [13]. |
| Agarose | For gel electrophoresis to separate and visualize the characteristic DNA ladder [13]. |
Conventional manual techniques for apoptosis detection are grounded in well-established biological principles and remain widely used. However, objective performance data highlights their inherent limitations, including significant user-to-user variability, low throughput, and susceptibility to error with complex samples like clumped cells. These shortcomings present a strong rationale for the development and adoption of automated algorithms, which offer enhanced reproducibility, efficiency, and analytical depth, thereby accelerating research and drug development workflows.
The Driving Need for Automation in Modern Apoptosis Research
Apoptosis, or programmed cell death, is a fundamental biological process crucial for tissue homeostasis, development, and immune system regulation. Its dysregulation is implicated in numerous pathologies, including cancer, neurodegenerative disorders, and autoimmune diseases [1]. In the field of drug development, particularly for oncology, inducing apoptosis in tumor cells is a primary therapeutic goal, making accurate detection and quantification of cell death responses essential for evaluating treatment efficacy [3]. For decades, manual microscopy and counting served as the cornerstone of apoptosis assessment. However, these methods are increasingly inadequate for modern research demands, plagued by subjectivity, low throughput, and an inability to capture complex dynamic processes. This guide objectively compares traditional manual approaches with emerging automated algorithms, providing researchers with experimental data and methodological insights to inform their analytical workflows.
Performance Comparison: Manual vs. Automated Apoptosis Analysis
The transition from manual to automated analysis is driven by quantifiable improvements in accuracy, efficiency, and reproducibility. The following comparison synthesizes data from multiple experimental validations.
Table 1: Quantitative Performance Comparison of Apoptosis Detection Methods
| Analysis Method | Reported Precision | Reported Sensitivity | Sample Throughput | Key Limitations |
|---|---|---|---|---|
| Manual Microscopy & Counting | Variable; subject to user bias [17] | Underestimates apoptosis by 2-3 fold [17] | Low (hundreds of cells/sample) [3] | Subjective, labor-intensive, low statistical power |
| Fluorescence Macro (ApoNecV) | High correlation with manual count (R² confirmed) [3] | Accurately processes 500-1000 cells/sample [3] | High (processes large datasets automatically) [3] | Requires specific staining kit and 10x objective [3] |
| Vision-Based Algorithm (MATLAB) | >90% [1] | >85% [1] | High (single to multiple cells) [1] | Requires generation of reporter cell lines [1] |
| AI-Powered Imaging (Nikon ECLIPSE Ji) | Enables EC50 calculation [18] | Quantifies dose-dependent induction [18] | Fully automated, from acquisition to analysis [18] | Platform-specific solution |
| Multi-Scale Attention RCNN | High (PCA shows distinct clustering) [5] | Detects early nuclear texture changes [5] | Potential for high-throughput, label-free analysis [5] | "Black box" model, requires technical validation [5] |
Key Insights from Comparative Data
- Throughput and Objectivity: Automated methods fundamentally transform experimental scale. While manual counting is constrained to hundreds of cells, automated algorithms can process thousands of cells in a single run, providing robust statistical power and eliminating inter-observer variability [3] [1].
- Accuracy and Sensitivity: Manual counts significantly underestimate apoptosis rates, a critical flaw for therapeutic efficacy assessment. Automated vision-based algorithms demonstrate superior precision (>90%) and sensitivity (>85%), ensuring more reliable data [1] [17].
- Functional Depth: Beyond counting, automation unlocks advanced functional analysis. AI-driven systems can calculate half-maximal effective concentration (EC50) for drug potency, while advanced algorithms detect early, subtle apoptotic events through nuclear texture analysis, a feat impossible with manual observation [18] [5].
Experimental Protocols for Automated Apoptosis Analysis
Protocol 1: Automated Analysis with ApoNecV Macro for Fiji
The ApoNecV macro provides an accessible entry into automated analysis using the widely adopted Fiji/ImageJ platform.
- 1. Cell Preparation and Staining: Culture and treat cells (e.g., HeLa cells). Subsequently, stain samples using the Annexin V-CY3TM Apoptosis Detection Kit (APOAC), which employs Annexin-Cy3.18 (AnnCy3) and 6-Carboxyfluorescein diacetate (6-CFDA) to distinguish viable, apoptotic, and necrotic populations based on fluorescence patterns [3].
- 2. Image Acquisition: Image cells in phosphate buffer saline using a confocal microscope. For ApoNecV, a 10x objective (e.g., EC Plan-Neofluar 10x/0.3 NA) is required. Acquire images for the 6-CF channel (ex 495nm/em 520 nm, excited with 488 nm laser) and the AnnCy3 channel (ex 550 nm/em 570 nm, excited with 561 nm laser). Acquire multiple images per sample to ensure reproducibility [3].
- 3. Image Preprocessing: The ApoNecV macro automates critical preprocessing steps. It employs a Rolling Ball Radius algorithm for background subtraction (50 pixels for 6-CF; 30 pixels for AnnCy3) and performs deconvolution using a generated point spread function to correct optical distortions and enhance image clarity [3].
- 4. Automated Classification and Quantification: Execute the ApoNecV macro on a stack image containing green, red, and transmitted light channels. The software automatically classifies cells based on fluorescence profiles: viable cells show green fluorescence (6-CF), apoptotic cells show both red and green fluorescence (AnnCy3 and 6-CF), and necrotic cells show red fluorescence (AnnCy3) [3].
Protocol 2: Caspase Activity Monitoring with Reporter Cell Lines and Automated Algorithms
This method uses engineered cell lines for live, dynamic monitoring of caspase activation.
- 1. Reporter Cell Line Construction:
- For cytochrome-C (Cyt-C) release, construct a reporter by fusing Cyt-C with Green Fluorescent Protein (GFP). Validate that the fusion protein correctly localizes to mitochondria and does not disrupt apoptotic function [1].
- For caspase-3/8 activation, use a plasmid where a nuclear export signal (NES) is linked to Enhanced Yellow Fluorescent Protein (EYFP) and a nuclear localization signal (NLS) via a caspase-specific cleavage site (DEVD for caspase-3, IETD for caspase-8). Caspase activation cleaves the tether, allowing EYFP-NLS to translocate to the nucleus [1].
- 2. Live-Cell Imaging and Analysis: Seed reporter cells and treat with apoptotic inducers. Perform time-lapse imaging on a conventional epifluorescence microscope. The automated algorithm in MATLAB then processes the images by [1]:
- Segmenting individual cells or nuclei.
- Quantifying the spatial distribution of fluorescence intensity (e.g., cytosol-to-nucleus translocation for caspase reporters).
- Classifying cells as apoptotic based on user-defined, tunable thresholds for signal translocation, forgoing simplistic and biased statistical measures.
The Scientist's Toolkit: Essential Reagents and Materials
Successful implementation of automated apoptosis assays relies on a foundation of specific reagents and tools.
Table 2: Key Research Reagent Solutions for Apoptosis Detection
| Reagent / Material | Function / Principle of Detection | Example Application |
|---|---|---|
| Annexin V-CY3TM Kit (APOAC) | Binds phosphatidylserine exposed on the outer membrane of apoptotic cells. Propidium iodide (PI) is often added to distinguish late apoptotic/necrotic cells. [3] [10] | Standard for flow cytometry and fluorescence microscopy (e.g., ApoNecV macro). [3] |
| Caspase Reporter Plasmids | Genetically encoded biosensors with caspase-specific cleavage sites (DEVD/IETD). Cleavage induces fluorescent protein translocation from cytoplasm to nucleus. [1] | Live-cell, dynamic monitoring of caspase-3/8 activation in reporter cell lines. [1] |
| Cytochrome-C-GFP Reporter | GFP-tagged cytochrome-C for visualizing its release from mitochondria during intrinsic apoptosis activation. [1] | Tracking early intrinsic pathway events via live-cell imaging. [1] |
| ApoNecV Macro (Fiji) | Open-source software macro for automated classification and quantification of viable, apoptotic, and necrotic cells from fluorescent images. [3] | High-throughput analysis of cells stained with the APOAC kit. [3] |
| AI-Pretrained Imaging System | Fully automated microscope systems (e.g., Nikon ECLIPSE Ji) with pre-trained AI models for acquisition and analysis. [18] | Hands-off, high-content screening and dose-response (EC50) analysis. [18] |
The driving need for automation in apoptosis research is unequivocally justified by the data. Automated algorithms consistently outperform manual counting in throughput, accuracy, and functional depth, directly addressing the bottlenecks of modern drug discovery and mechanistic studies. While manual methods provide a foundational understanding, they are ill-suited for the scalable, reproducible, and nuanced analysis required today. The future of apoptosis research lies in the continued integration of robust reporter systems, open-source analysis tools like ApoNecV, and sophisticated AI-driven platforms. These technologies empower researchers to move beyond simple quantification towards dynamic, systems-level insights into cell death, ultimately accelerating the development of novel therapeutics for cancer and other devastating diseases.
Next-Generation Methodologies: Implementing Automated Apoptosis Detection Systems
High-Content Live-Cell Imaging with FRET-Based Caspase Reporters
The study of apoptotic signaling flow requires tools that can capture the dynamic nature of caspase activation with high spatiotemporal resolution. Among the various technologies developed for this purpose, Förster Resonance Energy Transfer (FRET)-based biosensors have emerged as powerful tools for monitoring real-time caspase activity in live cells. These biosensors operate on the principle of non-radiative energy transfer from a donor fluorophore to an acceptor fluorophore when they are in close proximity (typically 1-10 nm), which is significantly affected by caspase-mediated cleavage of specific recognition sequences [19] [20].
The integration of FRET-based caspase reporters into high-content live-cell imaging platforms represents a significant advancement over traditional endpoint apoptosis assays such as Annexin V binding or TUNEL staining [21]. Where conventional methods provide static snapshots of cell death, FRET-based live-cell imaging enables researchers to track the precise timing, sequence, and heterogeneity of caspase activation across entire cell populations, capturing critical transitional states that were previously inaccessible to scientific observation [22] [23]. This technological evolution aligns with the growing recognition that apoptosis is not a uniform process but exhibits considerable cell-to-cell variability, which can be crucial for understanding therapeutic resistance and tumor repopulation mechanisms [21] [22].
Comparative Analysis of Caspase Detection Methodologies
Technology Comparison Table
Table 1: Comparison of caspase detection technologies and their performance characteristics
| Technology | Spatial Resolution | Temporal Resolution | Throughput | Key Applications | Limitations |
|---|---|---|---|---|---|
| FRET-Based Biosensors | Single-cell (subcellular possible) | Real-time (seconds to minutes) | Medium to High (with automation) | Kinetic studies, signaling dynamics, drug screening | Requires specialized equipment, spectral bleed-through |
| ZipGFP Caspase Reporter | Single-cell | Real-time (hours to days) | High (compatible with HCS) | Long-term tracking, 3D models, apoptosis-induced proliferation | Irreversible signal, limited to caspase-3/7 |
| Flow Cytometry FRET | Population-level (single-cell resolved) | Endpoint or multi-timepoint | Very High | High-throughput screening, statistical analysis | Limited spatial information, lower temporal resolution |
| Immunofluorescence | Single-cell (subcellular) | Endpoint | Medium to High | Fixed tissue, subcellular localization, multiplexing | No live-cell kinetics, fixation artifacts |
| Western Blot | Population-level | Endpoint | Low | Protein confirmation, cleavage detection | No single-cell resolution, requires cell lysis |
Experimental Performance Data
Table 2: Experimental performance metrics of featured caspase sensing platforms
| Platform/Study | Caspase Targets | Dynamic Range | Signal-to-Noise Ratio | Temporal Resolution | Validation Methods |
|---|---|---|---|---|---|
| ZipGFP Reporter [21] | Caspase-3/7 (DEVD) | >10-fold increase | High (minimal background) | 80+ hours continuous | Western blot (cleaved PARP, caspase-3), Annexin V/PI |
| FRET Bioprobes [22] | Caspase-9 (LEHD) & Caspase-3 (DEVD) | Customizable via fluorophore choice | High (FRET efficiency-based) | Minutes to hours | TNF-α/cycloheximide induction, specific inhibitors |
| Flow Cytometry FRET [20] | Multiple (customizable) | Dependent on FRET pair | Medium (population averaging) | Rapid sampling (multiple timepoints) | Fluorescence compensation, positive controls |
Technical Architectures and Experimental Implementation
Fundamental FRET Biosensor Architecture
FRET-based caspase biosensors typically employ a modular design consisting of donor and acceptor fluorophores connected by a caspase-specific cleavage sequence. The structural configuration ensures that before caspase activation, the proximity between fluorophores enables efficient FRET, while cleavage separates the fluorophores, reducing FRET efficiency and increasing donor emission [19] [24]. This molecular design can be implemented using several strategic approaches:
- Fluorescent Protein Pairs: Genetically encoded biosensors using CFP-YFP or newer red-shifted variants (mCherry, mRuby) with improved photostability and reduced phototoxicity [20].
- Fluorophore-Fluorescent Protein Chimeras: Hybrid sensors combining the brightness of synthetic dyes with the genetic encodability of fluorescent proteins, as demonstrated in tunable combinatorial FRET bioprobes [22].
- Split-Fluorescent Protein Systems: Designs such as the ZipGFP caspase-3/-7 reporter, which utilizes split-GFP fragments connected via a DEVD cleavage motif that reassembles upon caspase activation [21].
The critical consideration in FRET pair selection involves optimizing the Förster distance (R0), which represents the distance at which energy transfer efficiency is 50%. This parameter is influenced by the spectral overlap integral, quantum yield of the donor, extinction coefficient of the acceptor, and the relative orientation of dipole moments [20] [24]. Advanced implementations now employ multiplexed FRET configurations enabling simultaneous monitoring of multiple caspases, providing systems-level insights into apoptotic signaling hierarchies [22].
Caspase Activation Signaling Pathway
Diagram 1: Caspase activation signaling pathway and FRET reporter mechanism. The diagram illustrates the convergence of extrinsic and intrinsic apoptotic pathways on executioner caspases-3/7, which cleave the DEVD sequence in FRET reporters, resulting in measurable signal changes.
Experimental Workflow for High-Content Analysis
Diagram 2: Comprehensive workflow for high-content live-cell imaging with FRET-based caspase reporters, covering from cell preparation to quantitative data analysis.
Research Reagent Solutions and Essential Materials
Core Research Toolkit
Table 3: Essential reagents and materials for implementing FRET-based caspase imaging
| Category | Specific Examples | Function/Application | Experimental Considerations |
|---|---|---|---|
| FRET Reporters | DEVD-based ZipGFP [21], LEHD-based Caspase-9 bioprobe [22] | Specific caspase activity detection | Optimize expression levels; confirm cleavage specificity with inhibitors |
| Fluorescent Proteins/Dyes | CFP-YFP pairs, mCherry-mTurquoise, Alexa Fluor derivatives [22] [20] | FRET donor-acceptor pairs | Consider spectral overlap, photostability, and compatibility with imaging system |
| Cell Culture Models | HeLa, Jurkat, MCF-7 (caspase-3 deficient) [21] [22] | Cellular context for apoptosis studies | Validate model relevance to biological question; consider 2D vs 3D formats |
| Apoptosis Inducers | Carfilzomib, Oxaliplatin, TNF-α + Cycloheximide [21] [22] | Positive controls for caspase activation | Titrate concentration to achieve graded response; monitor toxicity kinetics |
| Caspase Inhibitors | zVAD-FMK (pan-caspase), specific caspase inhibitors [21] | Specificity controls and mechanistic studies | Use multiple concentrations to confirm target engagement |
| Validation Reagents | Annexin V/PI, antibodies to cleaved PARP/caspase-3 [21] | Orthogonal verification of apoptosis | Correlate endpoint measurements with live-cell kinetics |
| Imaging Equipment | Confocal microscopes, high-content screening systems [25] [26] | Image acquisition | Ensure environmental control; optimize temporal resolution vs. phototoxicity |
Comparative Experimental Data and Validation
Protocol for ZipGFP Caspase-3/7 Reporter Assay
The ZipGFP caspase reporter system employs a split-GFP design where the eleventh β-strand is tethered to β-strands 1-10 via a flexible linker containing the DEVD caspase-3/7 cleavage motif. In the uncleaved state, forced proximity prevents proper GFP folding, minimizing background fluorescence. Upon caspase activation, cleavage at DEVD enables spontaneous GFP refolding and fluorescence emission [21].
Experimental Protocol:
- Cell Line Development: Generate stable reporter lines using lentiviral transduction with ZipGFP-DEVD construct and constitutive mCherry marker for normalization.
- Culture Conditions: Maintain cells in appropriate medium; adapt to both 2D monolayer and 3D organoid cultures as needed.
- Treatment Protocol: Apply apoptosis inducers (e.g., 10-100 nM carfilzomib) alongside DMSO vehicle controls and 20-50 µM zVAD-FMK caspase inhibitor controls.
- Image Acquisition: Conduct time-lapse imaging over 48-80 hours using automated live-cell imaging systems with environmental control (37°C, 5% CO₂).
- Image Analysis: Quantify GFP/mCherry fluorescence ratio using automated segmentation; apply algorithms to track single-cell caspase activation kinetics.
Validation Data: This system demonstrated robust GFP signal induction following carfilzomib treatment, with 8.3-fold increase in fluorescence compared to controls, effectively suppressed by zVAD-FMK co-treatment [21]. Specificity was confirmed in caspase-3 deficient MCF-7 cells, where residual activation indicated caspase-7 activity.
Protocol for Multiplexed FRET Bioprobe Caspase Detection
The combinatorial FRET bioprobe approach utilizes customized molecular sensors with dye-fluorescent protein conjugates optimized for specific caspase recognition sequences (LEHD for caspase-9, DEVD for caspase-3) [22].
Experimental Protocol:
- Bioprobe Preparation: Customize caspase-9 bioprobe using GFP-Alexa Fluor 532 conjugate with LEHD recognition sequence; combine with established caspase-3 sensors.
- Cell Loading: Introduce bioprobes into cells (HeLa, Jurkat, or primary cells) via protein delivery systems or direct mixing with culture supernatant.
- Stimulation: Induce apoptosis using TNF-α (10-100 ng/mL) through death receptors with cycloheximide (1-10 µg/mL) to sensitize cells.
- Multiplexed Imaging: Acquire simultaneous FRET measurements for multiple caspases using appropriate filter sets; collect data at 2-5 minute intervals.
- FRET Quantification: Calculate normalized FRET efficiency from donor/acceptor intensity ratios; track spatiotemporal activation patterns.
Validation Data: This approach revealed that cumulative caspase-9 activity, rather than reaction rate, inversely regulated caspase-3 execution times, providing insights into apoptotic signaling hierarchy unavailable through conventional methods [22].
Integration with Automated Analysis and High-Content Screening
The integration of FRET-based caspase reporters with automated imaging and analysis platforms has dramatically enhanced their utility in drug discovery and mechanistic studies. Modern high-content screening systems equipped with environmental control and automated liquid handling enable continuous monitoring of caspase dynamics across thousands of experimental conditions [25] [27].
Advanced image analysis algorithms now address the critical challenge of data management and interpretation in high-content experiments. Machine learning approaches can automatically identify and track individual cells through division and death, classifying temporal activation patterns and quantifying heterogeneity in caspase activation [25] [26]. These automated systems demonstrate remarkable concordance with traditional methods, with some platforms reporting deviations of less than 5% compared to flow cytometry, while providing significantly richer kinetic information [11].
The implementation of AI-powered analytical tools has further enhanced the extraction of meaningful biological insights from complex multiparameter datasets. These tools can identify subtle patterns in caspase activation kinetics that correlate with downstream phenotypic outcomes, enabling predictive modeling of cell fate decisions and therapeutic responses [25] [26] [27]. This represents a significant advancement over manual counting methods, which are limited in scale, objectivity, and ability to capture multidimensional relationships in apoptotic signaling networks.
Machine Learning and Feature Selection for Imaging Flow Cytometry Data
Imaging flow cytometry (IFC) represents a revolutionary advancement in cellular analysis, merging the high-throughput, multi-parametric capabilities of conventional flow cytometry with the high-resolution morphological detail of microscopy [28]. This synergy creates a powerful platform for apoptosis detection, generating complex, high-dimensional datasets on a single-cell level. The manual analysis of such rich data, however, presents a significant bottleneck, subject to human bias and impractical for large-scale studies [29] [30].
The application of machine learning (ML) for feature selection and analysis of IFC data is transforming this landscape. By automating the identification of the most informative cellular features, ML enables robust, reproducible, and objective detection of subtle apoptotic events [30]. This guide provides a comparative analysis of automated computational approaches versus traditional manual methods within the specific context of apoptosis research, offering researchers and drug development professionals a framework for evaluating these powerful tools.
Technical Foundation of Imaging Flow Cytometry
Core Principles and Workflow
Imaging flow cytometry operates on an integrated system designed for simultaneous quantitative and morphological analysis [28]. The general workflow begins with cell preparation and fluorescent labeling, followed by analysis on an IFC instrument. The core components of such a system are illustrated below.
- Fluidic System: Hydrodynamically focuses a cell suspension into a single-file stream, ensuring cells pass through the detection zone one by one [28].
- Optical System: Utilizes lasers to interrogate cells, generating scattered light and fluorescence signals from conjugated probes [28].
- Imaging System: A core differentiator from conventional flow cytometers, this component captures high-resolution images of each cell via a high-precision camera (e.g., CCD) as it flows through the detection area [28].
- Electronic System: Converts the captured optical signals into digital data, resulting in a complex data table for each event (cell) that includes both quantitative fluorescence intensities and high-resolution image data [30] [28].
IFC's Unique Value in Apoptosis Detection
The primary advantage of IFC in apoptosis research lies in its morpho-functional integration [28]. While conventional flow cytometry can quantify fluorescence intensity for markers like phosphatidylserine externalization (Annexin V) or caspase activity, it cannot visualize the associated morphological hallmarks of apoptosis, such as chromatin condensation, nuclear fragmentation, and membrane blebbing [29] [28]. IFC bridges this gap, providing:
- Visual Intuition: Direct visualization confirms the cellular origin of signals and allows for the identification of morphological subtypes of cell death [28].
- High-Throughput Precision: The technology enables the analysis of thousands of cells per second, providing statistically powerful data while capturing critical morphological details, which is essential for detecting rare apoptotic events in a heterogeneous population [31] [28].
- Objective Analysis: Advanced software automates image processing and multi-dimensional data integration, minimizing the human bias inherent in manual gating and microscopy-based counting [29] [28].
Comparative Analysis: Automated Algorithms vs. Manual Counting
The quantification of apoptosis-like programmed cell death (A-PCD) in multicellular or complex systems like filamentous fungi is particularly challenging [29]. Manual counting, while considered a traditional standard, is laborious, subjective, and suffers from low throughput. The table below summarizes the critical differences between the two methodologies.
Table 1: Performance Comparison of Apoptosis Detection Methods
| Feature | Manual Counting & Traditional Gating | Automated ML Algorithms for IFC Data |
|---|---|---|
| Throughput | Low; limited by human speed [29] | High; capable of analyzing thousands of cells per second [28] |
| Objectivity | Low; susceptible to user bias and inter-operator variability (>20% common) [32] | High; applies consistent, predefined rules for every cell [29] [30] |
| Information Depth | Limited to a few pre-gated parameters; spatial context is often lost [31] | High-dimensional; can integrate dozens of quantitative and morphological features simultaneously [30] [28] |
| Morphological Insight | Dependent on separate, low-throughput microscopy [29] | Integral; high-resolution imaging is part of the core data acquisition [28] |
| Reproducibility | Low; CV often ≥15% due to human factors [32] | High; automated processes ensure minimal run-to-run variation [29] |
| Key Advantage | Simple, requires no specialized computational skills | Uncovers complex, non-linear patterns invisible to manual analysis [30] |
A seminal study developing the SCAN (System for Counting and Analysis of Nuclei) software highlights these advantages. The software was designed to automatically quantify nuclei with condensed chromatin (a key apoptotic marker) in fungal hyphae based on fluorescent staining. When compared to manual counting, the software provided equally accurate but significantly faster and more reproducible results, proving especially superior in complex, hypernucleated samples where overlapping signals complicate manual scoring [29].
Machine Learning Framework for IFC Data Analysis
A Primer on Machine Learning Categories
Machine learning offers a suite of tools to handle the complexity of IFC data. The choice of algorithm depends on the nature of the available data and the research question. The methodologies can be categorized by their degree of supervision, each with distinct applications in apoptosis detection.
- Supervised Learning: Relies on labeled data (e.g., "apoptotic" or "healthy" as determined by a pathologist) to train classifiers. Common algorithms include logistic regression, support vector machines (SVM), and neural networks [30]. These models are highly performant for known classification tasks when high-quality labeled data is available. For instance, a study on acute myeloid leukemia (AML) used a GMM-SVM model to achieve 98.15% accuracy in classifying malignant cells, demonstrating the power of supervised learning for well-defined diagnostic problems [33].
- Unsupervised Learning: Used to identify hidden patterns or group cells without pre-defined labels. Techniques like k-means clustering, FlowSOM, UMAP, and t-SNE are valuable for discovering novel cell populations or identifying unique apoptotic sub-states [30].
- Weakly/Semi-Supervised Learning: These newer paradigms leverage partially labeled datasets, which are often more feasible to obtain in a clinical setting, to improve model performance and generalizability [30].
The Feature Selection and Model Training Pipeline
A critical step in managing IFC data's high dimensionality is feature selection, which improves model performance and interpretability. The following workflow outlines a standardized pipeline for developing a robust ML model for apoptosis detection.
Table 2: Experimental Protocol for ML Model Development on IFC Data
| Stage | Protocol Description | Key Considerations |
|---|---|---|
| 1. Sample Preparation & Staining | Cells are treated with apoptogenic agents and stained with fluorescent probes (e.g., Hoechst 33342 for DNA/chromatin, Annexin V for PS exposure, FLICA for caspase activity) [29]. | Use appropriate viability controls. Confirm staining specificity using known positive and negative controls. |
| 2. Data Acquisition on IFC | Acquire a statistically significant number of events (e.g., 10,000+ cells per condition) using an IFC system (e.g., Luminex ImageStream, Thermo Fisher Attune CytPix) [28]. | Standardize laser powers, exposure times, and magnification across all samples to ensure data consistency. |
| 3. Data Preprocessing | Apply spectral compensation and data transformation (e.g., arcsinh, logicle). Perform quality control (e.g., doublet exclusion, debris filtering) [30]. | Use raw data formats (FCS) that preserve metadata. Preprocessing is critical for data quality. |
| 4. Feature Extraction | Extract features from each cell image: • Morphological: Cell/nuclear area, circularity, texture. • Intensity: Mean & max fluorescence intensity per channel. • Texture: Haralick features, granularularity [29]. | The SCAN software used parameters like nucleolus presence, fluorescence distribution, and nuclear area to define chromatin condensation [29]. |
| 5. Feature Selection | Apply algorithms (e.g., Recursive Feature Elimination, PCA) to identify the most discriminative features for apoptosis. | Reduces dimensionality, mitigates overfitting, and leads to a more interpretable model. |
| 6. Model Training & Validation | Split data into training and validation sets. Train a classifier (e.g., SVM, Random Forest) using cross-validation. Evaluate using precision, recall, and AUC [33] [30]. | Independent validation on a separate dataset is crucial to confirm generalizability and avoid overfitting [33] [30]. |
The Scientist's Toolkit: Essential Research Reagents and Solutions
The successful implementation of an IFC apoptosis assay relies on a carefully selected set of reagents and instruments.
Table 3: Key Research Reagent Solutions for IFC-based Apoptosis Detection
| Item | Function/Biological Target | Example Application |
|---|---|---|
| Hoechst 33342 / DAPI | Cell-permeable (Hoechst) and -impermeable (DAPI) DNA-binding dyes. Stain total and dead cell nuclei, respectively; allow assessment of chromatin condensation and nuclear fragmentation [29] [32]. | Used in the SCAN software to quantify nuclei with condensed chromatin, a key apoptotic marker [29]. |
| Annexin V (FITC, PE conjugates) | Binds to phosphatidylserine (PS), which is externalized to the outer leaflet of the plasma membrane during early apoptosis [29]. | Distinguishes early apoptotic (Annexin V+/PI-) from late apoptotic/necrotic (Annexin V+/PI+) cells. |
| LIVE/DEAD Fixable Stains | Amine-reactive dyes that covalently bind to proteins in dead cells with compromised membranes. Superior to trypan blue for accurate viability measurement [34]. | Provides a more reliable measure of cell viability than trypan blue, which is toxic and can underestimate viability [34] [32]. |
| FLICA Caspase Assays | Fluorescently labeled inhibitors of caspases (FLICA) that bind activated caspases in live cells. | Marker for mid-stage apoptosis; indicates engagement of the executive death machinery. |
| Imaging Flow Cytometer | Instrument for acquiring high-throughput, image-based single-cell data. | Systems like the ImageStreamX or Attune CytPix are essential for generating the primary data for ML analysis [28]. |
| NucleoCounter NC-3000 | Automated image cytometer for rapid cell counting and viability analysis using fluorescent dyes like acridine orange and DAPI [32]. | Useful for quick assessment of overall cell health and concentration before proceeding to full IFC analysis. |
The integration of machine learning with imaging flow cytometry data represents a paradigm shift in apoptosis research. As demonstrated, automated algorithms consistently outperform manual counting in throughput, objectivity, and the ability to extract deeply hidden, multi-parametric information from complex cellular samples [29] [30]. While manual methods retain a role for initial assay setup and validation, the future of robust, scalable, and insightful apoptosis detection lies in computational approaches.
The field continues to evolve rapidly, with trends pointing towards increased use of AI-driven analysis tools, more sophisticated weakly supervised learning models that efficiently leverage clinical annotations, and the integration of IFC data into multi-omics workflows [35] [30]. For researchers and drug development professionals, adopting these machine learning frameworks is no longer a niche advantage but a fundamental requirement for unlocking the full potential of imaging flow cytometry in advancing our understanding of programmed cell death.
Automated Algorithms for Biomarker Translocation Analysis
The accurate detection of biomarker translocation is a cornerstone of modern apoptosis research. Apoptosis, or programmed cell death, is a fundamental biological process critical for maintaining tissue homeostasis and its dysregulation is implicated in a range of diseases, including cancer and neurodegenerative disorders [7]. A key event in the early stages of apoptosis is the translocation of phosphatidylserine (PS) from the inner to the outer leaflet of the plasma membrane. This physiological change serves as a clear "eat-me" signal for phagocytic cells. For researchers, detecting this translocation is vital for understanding cell death mechanisms, screening for new therapeutics, and evaluating drug efficacy and toxicity [7] [15].
The central challenge in this field lies in the method of detection. For decades, manual microscopy and counting have been the standard, relying on visual identification of fluorescently labelled markers like Annexin V. However, this method is inherently constrained by human subjectivity and limited throughput. The emergence of automated algorithms for image analysis and data interpretation is fundamentally transforming this area of research. These algorithms, often integrated with artificial intelligence (AI), are enhancing the precision, efficiency, and scalability of apoptosis detection, making them indispensable tools for contemporary drug development and basic research [7] [15]. This guide provides an objective comparison of these evolving automated methodologies against traditional manual techniques.
Comparative Analysis of Detection Methods
The choice between manual and automated methods for biomarker translocation analysis significantly impacts the reliability, scalability, and reproducibility of experimental data. The following section details the core principles of each approach and presents a direct comparison of their performance.
Manual Counting and Analysis
The traditional manual method relies on a researcher using a microscope to visually identify and count cells that exhibit signs of apoptosis, typically after staining with a fluorescent dye such as Annexin V in combination with a viability probe like propidium iodide (PI). The process involves preparing blood smears or cell suspensions, staining them with supravital stains, and manually enumerating the cells in a counting chamber like a hemocytometer [36] [32]. The key limitations of this approach are its subjectivity and statistical vulnerability. Human perception of what defines a cell versus debris can vary, even among trained personnel, leading to inconsistencies [32]. Furthermore, manual counting is typically limited to a small sample size (e.g., ~100 cells), which introduces high statistical variability due to the Poisson distribution; even without human error, counting only 100 cells carries a minimum expected standard deviation of 10% [32]. Studies have also shown that the accuracy of manual counts degrades with sample storage time, with significant differences observed after 6 hours [36].
Automated Algorithms and Systems
Automated systems replace human visual inspection with hardware and software designed to objectively identify and quantify apoptotic cells. These systems range from sophisticated flow cytometers to advanced image-based cytometers and even smartphone-integrated platforms [11] [15].
- Flow Cytometry: This technology represents a gold standard in automation, where cells in a suspension are passed single-file past a laser beam. Fluorescent detectors measure the light emitted from labelled cells, allowing for the high-throughput, multi-parametric analysis of thousands of cells per second. Its strength lies in its high sensitivity and ability to perform complex analyses [11].
- Image-Based Cytometry: Platforms like the NucleoCounter use fluorescent microscopy and proprietary cassettes that automatically stain the sample. A built-in camera captures images, and a software algorithm analyzes them to calculate viability and concentration, eliminating human bias in defining a cell and pipetting errors [32].
- Smartphone-Integrated Platforms: Emerging technologies like Quantella demonstrate the ongoing innovation in this field. Quantella integrates low-cost optics with a smartphone, using an adaptive image-processing pipeline that employs multi-exposure fusion and morphological filtering for accurate, morphology-independent cell segmentation without requiring deep learning. This platform can analyze over 10,000 cells per test and has been validated to show deviations of less than 5% compared to flow cytometry [11].
- AI-Powered Analytics: A major trend is the integration of artificial intelligence. AI algorithms are now being used to process vast amounts of data from high-throughput screening, identifying patterns difficult for human analysis. They automate image analysis, reduce manual errors, and can even predict cellular responses to various stimuli [7] [15]. This revolutionizes data analysis by enabling features like automated gating in flow cytometry and real-time image processing.
Table 1: Key Performance Indicators - Manual vs. Automated Analysis
| Performance Indicator | Manual Analysis | Automated Analysis |
|---|---|---|
| Typical Sample Size | ~100 cells [32] | >10,000 cells [11] |
| Inherent Statistical Variation (Poisson) | High (~10% for 100 cells) [32] | Low (<5% deviation vs. gold standard) [11] |
| Subjectivity / Human Bias | High (User-dependent cell definition) [32] | Low (Algorithm-defined criteria) [11] [32] |
| Throughput | Low (Laborious and time-consuming) [32] | High (Rapid, parallel processing) [11] [15] |
| Reproducibility | Low to Moderate (High inter-operator variance) [32] | High (Standardized, consistent analysis) [11] |
| Viability Stain Used | Often Trypan Blue (can underestimate viability) [32] | Fluorescent dyes (e.g., Acridine Orange/DAPI; more precise) [32] |
Table 2: Impact of Sample Storage on Count Accuracy (Reticulocyte Study Example)
| Time After Blood Collection | Manual Method (Freshly Prepared Slide) | Manual Method (Stored Slide) | Automated Method |
|---|---|---|---|
| 2 hours | 1.6% (Baseline) [36] | - | 1.73% (Not Significant vs. Fresh Manual) [36] |
| 6 hours | 1.6% (Not Significant vs. 2h) [36] | 1.0% (Significantly Lower) [36] | 1.75% (Not Significant vs. Fresh Manual) [36] |
| 24 hours | 1.0% (Significantly Lower vs. 2h) [36] | 0.60% (Significantly Lower) [36] | 1.60% (Not Significant vs. Fresh Manual) [36] |
| 48 hours | 0.75% (Significantly Lower vs. 2h) [36] | 0.20% (Significantly Lower) [36] | 1.57% (Significantly Different vs. Fresh Manual) [36] |
Experimental Protocols for Method Validation
To ensure the reliability of data when comparing manual and automated methods, rigorous experimental protocols must be followed. The following section outlines a standard procedure for a comparative validation study, leveraging commonly used reagents.
Sample Preparation and Staining
The foundation of any accurate analysis is consistent sample preparation. A cell suspension, such as CHO DG44 or MCF-7 cells, is prepared and divided into aliquots. The cells are then stained using a common apoptosis detection kit, typically containing Annexin V conjugated to a fluorophore (e.g., FITC) and a viability dye like propidium iodide (PI) [15]. This dual-staining strategy is crucial for distinguishing early apoptotic cells (Annexin V-positive, PI-negative) from late apoptotic or necrotic cells (Annexin V-positive, PI-positive). It is critical that the same stained sample is used for both manual and automated analyses to enable a direct comparison. For manual counting, an aliquot of the stained cell suspension is loaded into a hemocytometer. For automated analysis, another aliquot from the same tube is used in the respective platform (e.g., flow cytometer or image-based cytometer) [32].
Data Acquisition and Analysis
In the manual method, a researcher counts the cells in a defined volume of the hemocytometer under a fluorescence microscope, classifying them based on their staining characteristics. The total number of cells counted is typically low, around 100 cells, due to practical constraints [32]. For automated analysis, the process is hands-off. In flow cytometry, the instrument acquires data from tens of thousands of cells in a few minutes, while an image-based cytometer like the NucleoCounter or a platform like Quantella automatically captures and analyzes images using its embedded software [11] [32]. The key is to run all samples in a single session to minimize technical variation.
Validation and Statistical Assessment
To validate the automated method against the manual one, a statistical correlation analysis is performed. A strong positive correlation (e.g., Spearman's correlation coefficient rs > 0.95) is expected if the methods are comparable [36]. Furthermore, the coefficient of variation (CV) between different operators counting the same sample manually should be calculated. A CV of ≥15% is considered average for manual counting, highlighting its inherent variability, while automated systems demonstrate significantly lower CVs due to the removal of human bias and the analysis of much larger cell numbers [11] [32].
Diagram 1: Experimental workflow for validating automated versus manual apoptosis analysis methods.
The Scientist's Toolkit: Essential Research Reagents and Solutions
Successful biomarker translocation analysis depends on a suite of reliable reagents and tools. The table below details key materials essential for conducting these experiments.
Table 3: Key Research Reagent Solutions for Apoptosis Translocation Assays
| Reagent / Material | Function in Assay | Key Considerations |
|---|---|---|
| Annexin V Conjugates (e.g., FITC, PE) | Binds to phosphatidylserine (PS) on the outer membrane of apoptotic cells. The primary detector of biomarker translocation. | Requires calcium-containing buffer for binding. Allows multiplexing with other fluorophores [15]. |
| Viability Probes (e.g., Propidium Iodide, DAPI) | Membrane-impermeable dyes that stain DNA in dead cells with compromised membranes. Distinguishes late apoptosis/necrosis. | DAPI is considered more precise than trypan blue for viability determination in automated systems [32]. |
| Apoptosis Induction Kits (e.g., Staurosporine, Camptothecin) | Positive controls used to reliably induce apoptosis in cell cultures for assay validation and optimization. | Essential for establishing a positive control to ensure the assay is functioning correctly. |
| Cell Staining Buffer | Provides the optimal ionic and pH environment for Annexin V binding and cell viability. | Must contain calcium and be serum-free to prevent inhibition of Annexin V binding. |
| Standardized Assay Kits | Commercial kits (e.g., from Thermo Fisher, Merck) that provide pre-optimized, validated reagents for reproducible results. | Widely used in pharmaceutical and academic labs to ensure consistency and save development time [15]. |
| Via-Cassettes / Pre-calibrated Disposables | Specialized cartridges for instruments like the NucleoCounter that contain immobilized dyes and a pre-calibrated measurement chamber. | Eliminates pipetting and volume errors, enhancing reproducibility [32]. |
The comparative analysis clearly demonstrates that automated algorithms for biomarker translocation analysis offer significant advantages over traditional manual counting. The transition to automation is driven by the compelling need for higher precision, greater throughput, and enhanced reproducibility in apoptosis research, particularly within drug discovery and development [7] [15]. While manual methods may still have a place in resource-limited or preliminary studies, their inherent subjectivity and statistical limitations make them unsuitable for the rigorous demands of modern, data-driven science.
The future of this field is intrinsically linked to technological advancement. The integration of artificial intelligence and machine learning is set to further revolutionize automated algorithms, enhancing predictive analytics and enabling the automated interpretation of complex datasets [7] [37]. Furthermore, the development of accessible, scalable platforms like smartphone-based cytometers promises to democratize high-quality cell analysis, making it available in resource-limited settings and for point-of-care diagnostics [11]. As multi-omics approaches and liquid biopsy technologies continue to evolve, the role of automated, robust apoptosis detection will only become more critical in understanding disease mechanisms and developing personalized, effective therapies [38] [37].
Integration with High-Throughput Screening and Drug Discovery Pipelines
The accurate measurement of programmed cell death, or apoptosis, is a critical component in evaluating the efficacy of potential therapeutic compounds, especially in oncology and neurodegenerative disease research. As drug discovery pipelines increasingly prioritize efficiency and reproducibility, automated detection algorithms are systematically replacing traditional manual counting methods. This shift is driven by the growing integration of high-throughput screening (HTS) platforms across pharmaceutical and biotechnology industries, where HTS instrument product and services currently hold a dominant 49.3% market share [39]. The global apoptosis assay market, valued at $2.6 billion in 2024 and projected to reach $5.8 billion by 2034, reflects this technological transition [40]. Within this evolving landscape, automated systems are demonstrating significant advantages in objectivity, throughput, and data quality for apoptosis detection, directly addressing the needs of researchers and drug development professionals seeking more predictive and human-relevant models [41].
Comparative Analysis: Automated Algorithms vs. Manual Counting
Performance Metrics and Experimental Validation
Rigorous validation studies across diverse cell types and experimental conditions provide quantitative evidence of performance differences between detection methodologies.
Table 1: Quantitative Performance Comparison of Apoptosis Detection Methods
| Detection Method | Throughput | Correlation with Gold Standard | Key Advantage | Reported Accuracy/Precision | Typical Application Context |
|---|---|---|---|---|---|
| Semi-Automated ASC Speck Assay [42] | High (batched analysis) | Significant correlation with manual counting (r=0.964, p<0.0001) [42] | Objective, machine-learning based counting | High sensitivity/specificity for disease detection | Functional validation of gene variants (e.g., MEFV in Familial Mediterranean Fever) |
| Quantella Smartphone Platform [43] | High (>10,000 cells/test) | <5% deviation from flow cytometry [43] | Integrated viability, density, and confluency analysis | >90% accuracy in cell identification | Accessible cell analysis for resource-limited settings |
| Manual Counting | Low | Subject to human variability | Low initial equipment cost | High inter-operator variability | Low-throughput academic labs, validation checks |
Analysis of Comparative Data
The data reveals a clear performance differential. Automated systems demonstrate a critical balance of high throughput and high accuracy, as evidenced by the semi-automated ASC speck assay's near-perfect correlation with manual counts and the Quantella platform's minimal deviation from the flow cytometry gold standard [42] [43]. This performance is achieved while analyzing vastly larger cell populations (>10,000 cells/test), enhancing statistical reliability and reducing sampling error common in manual analysis of smaller cell numbers [43].
A primary advantage of automation is the elimination of subjective interpretation. Manual counting is inherently vulnerable to inter-operator variability, while automated algorithms apply consistent, predefined parameters across all data points. Furthermore, platforms like Quantella integrate multiple analytical functions—viability, density, and confluency—into a single streamlined workflow, increasing data richness and operational efficiency [43].
Detailed Experimental Protocols
Protocol 1: Semi-Automated ASC Speck Assay for Pyrin Inflammasome Activation
This protocol is designed for functional validation of gene variants and screening for inflammasome overactivity [42].
- Step 1: Cell Preparation and Stimulation. Isolate Peripheral Blood Mononuclear Cells (PBMCs) from fresh or frozen blood samples. Seed cells into appropriate tissue culture plates. Stimulate the pyrin inflammasome by treating cells with a low, discriminating concentration (e.g., 0.1 μg/mL) of Clostridium difficile toxin A (TcdA) for a specified duration.
- Step 2: Immunofluorescence Staining. Fix cells, typically using paraformaldehyde. Permeabilize cells with a detergent like Triton X-100 to allow antibody access. Incubate with a primary antibody specific for the ASC protein. Follow with a fluorescently-labeled secondary antibody. Mount slides using a mounting medium containing a DAPI counterstain to visualize cell nuclei.
- Step 3: Image Acquisition and Automated Analysis. Capture high-resolution fluorescence microscopy images of multiple random fields. Process images using a custom, semi-automated graphical user interface (GUI) program. The algorithm performs live cell counting and identifies bright, discrete ASC specks within cells. The final output is calculated as the percentage of ASC speck-positive cells (%ASC Speck) [42].
Protocol 2: Automated Cell Viability and Density Analysis via Quantella
This protocol outlines the use of an integrated smartphone-based platform for routine, high-throughput cell analysis [43].
- Step 1: Sample Preparation. Create a 1:1 mixture of a cell suspension (e.g., CHO DG44, MCF-7) with trypan blue stain. Trypan blue differentially stains non-viable cells with compromised membranes.
- Step 2: Platform Setup and Loading. Ensure the Quantella hardware, including its optofluidic flow cell and smartphone interface, is calibrated. Use the integrated piezoelectric pump and Bluetooth-controlled system to load the prepared sample mixture into the rinsable flow cell.
- Step 3: Automated Imaging and Analysis. The Qtouch smartphone application automatically controls image capture via the phone's camera and an auxiliary lens. The platform's adaptive image-processing pipeline executes without user-defined parameters, performing multi-exposure fusion and morphological filtering to segment and identify individual cells. Live cells (unstained) are encircled in green and dead cells (trypan blue-positive) in red within the application interface. The algorithm automatically calculates cell density (cells/mL) and viability (%) [43].
Signaling Pathways and Experimental Workflows
Apoptosis Signaling Pathways
The following diagram illustrates the key molecular pathways of apoptosis, highlighting genes and proteins relevant to cancer research and therapy development.
Diagram 1: Apoptosis Signaling Pathways. This figure outlines the intrinsic (mitochondrial) and extrinsic (death receptor) pathways of apoptosis, which converge on the activation of executioner caspases to orchestrate programmed cell death. Key regulatory nodes, such as the BCL-2 family, TP53, and IAP proteins (e.g., BIRC3), are implicated in therapy resistance and are active areas of drug discovery [44].
High-Throughput Screening Workflow with Automated Readout
The following workflow diagram integrates automated apoptosis detection into a modern, AI-informed drug discovery pipeline.
Diagram 2: HTS Workflow with Automated Apoptosis Detection. This workflow illustrates a synergistic, iterative discovery cycle. Data from automated apoptosis assays, which can include viability, density, and confluency metrics, feeds into AI models to refine subsequent rounds of compound design and screening, significantly accelerating the hit-to-lead process [41] [45] [46].
The Scientist's Toolkit: Essential Research Reagents and Solutions
Table 2: Key Reagents and Materials for Apoptosis Assays
| Reagent/Material | Function in Assay | Example Application |
|---|---|---|
| Annexin V | Binds to phosphatidylserine (PS) externalized on the outer leaflet of the plasma membrane in early apoptosis. | Flow cytometry or fluorescence microscopy to detect early apoptotic cells. |
| Caspase Activity Kits | Measure the catalytic activity of initiator (e.g., Caspase-8, -9) and executioner (e.g., Caspase-3, -7) caspases using colorimetric, fluorometric, or luminescent substrates. | Quantifying the induction and progression of the apoptotic cascade in response to a drug. |
| TUNEL Assay Kits | Labels DNA strand breaks, a hallmark of late-stage apoptosis, using terminal deoxynucleotidyl transferase (TdT). | Identifying apoptotic cells in tissue sections or cell cultures. |
| Anti-ASC Antibody | Specifically labels the adaptor protein ASC to visualize inflammasome activation and ASC speck formation. | Functional assays for inflammasome activity, as in the semi-automated ASC speck assay [42]. |
| Trypan Blue | A vital dye that is excluded by live cells with intact membranes but stains dead cells with compromised membranes. | Routine cell viability and density analysis, as used in the Quantella platform [43]. |
| Clostridium difficile Toxin A (TcdA) | Specific activator of the pyrin inflammasome pathway by inhibiting RhoA GTPase. | Stimulating pyrin-dependent ASC speck formation in functional assays [42]. |
The integration of automated apoptosis detection algorithms into high-throughput screening pipelines represents a definitive shift toward more efficient, data-driven, and reproducible drug discovery. Automated systems address the critical limitations of manual counting—subjectivity, low throughput, and high variability—while providing rich, multi-parametric data that aligns with the industry's move toward human-relevant biology and AI-powered analytics [41]. As the field continues to evolve, the synergy between automated HTS, advanced cell models like 3D organoids, and generative AI will further accelerate the identification and validation of novel therapeutic candidates, solidifying the role of automated analysis as an indispensable tool in modern biomedical research [45] [39] [46].
Overcoming Implementation Hurdles: Troubleshooting and Optimizing Automated Assays
Addressing Overfitting and Data Bias in Machine Learning Models
In the field of apoptosis detection, the transition from manual counting to automated machine learning (ML) algorithms represents a significant leap toward objectivity and throughput. However, this evolution introduces a critical challenge: ensuring that these sophisticated models are robust and reliable, not artifacts of overfitting or biased data. This guide objectively compares the performance of emerging ML-based apoptosis detection methods against traditional manual counting, focusing on their susceptibility to overfitting and data bias, and provides supporting experimental data to inform researchers and drug development professionals.
Manual vs. Automated Apoptosis Detection: A Core Comparison
The fundamental differences between manual and automated approaches set the stage for their respective vulnerabilities to error and bias.
| Feature | Traditional Manual Counting | Automated ML-Based Algorithms |
|---|---|---|
| Basic Principle | Visual identification of morphological changes by a human expert using a microscope. [5] [47] | Pattern recognition by a computational model trained on image-derived features. [5] |
| Primary Source of Bias | High inter-operator and intra-operator subjectivity. [48] [49] | Bias inherent in the training dataset (e.g., under-represented cell types, staining variations). [5] |
| Typical Throughput | Low and time-consuming, limiting sample size. [48] [49] | High, enabling the analysis of large cell populations. [5] |
| Key Strengths | Low initial cost; intuitive for experts. [49] | High speed, objectivity, and ability to detect subtle, multi-scale patterns. [5] |
| Key Limitations | Subjectivity (≥20% user-to-user variability), [48] labor-intensive, difficult to standardize. [49] | Risk of overfitting, requires large, diverse datasets, "black box" interpretability challenges. [5] |
Experimental Protocols for Model Validation
To objectively assess ML model performance and its pitfalls, researchers employ rigorous experimental workflows. Below are detailed methodologies for key experiments cited in the literature.
Protocol for Training a Multi-Scale Attention Residual CNN
This protocol is based on a novel concept for detecting early apoptosis using nuclear textural features. [5]
- Aim: To train and validate a convolutional neural network for identifying early apoptotic cells based on nuclear chromatin patterns, while guarding against overfitting.
- Materials:
- Microscopy Images: Digital micrographs of control and pro-apoptotic toxin-treated cells (e.g., stained with 6-hydroxydopamine).
- Software: Python environment with TensorFlow/Keras or PyTorch libraries.
- Computing Hardware: GPU-enabled workstation for accelerated deep learning.
- Method Steps:
- Data Preparation: Isolate and extract regions of interest (ROIs) of cell nuclei from the micrographs.
- Feature Extraction: Calculate four key textural parameters for each nucleus ROI:
- Run-Length Matrix (RLM) Short Run Emphasis: Measures the prevalence of short runs of similar pixels, indicating fine-scale structure.
- RLM Long Run Emphasis: Measures the prevalence of long runs, indicating coarse-scale structure.
- Gray-Level Entropy Matrix (GLEM) Entropy: Quantifies the randomness and complexity of the nuclear texture.
- Discrete Fourier Transform (DFT) Magnitude Spectrum Mean: Captures periodic patterns in the chromatin distribution.
- Model Architecture: Construct a Multi-Scale Attention Residual Convolutional Neural Network (MSA-RCNN). This architecture uses residual connections to facilitate training of deep networks and attention mechanisms to help the model focus on the most relevant features.
- Training with Anti-Overfitting Measures:
- Data Splitting: Divide the dataset into training (80%), validation (10%), and hold-out test (10%) sets.
- Regularization: Apply L2 regularization (weight decay) to the model's layers to penalize overly complex weights.
- Early Stopping: Halt training when the validation loss stops improving to prevent the model from memorizing the training data.
- Validation: Evaluate the final model on the held-out test set to obtain an unbiased estimate of its performance using metrics like accuracy and Area Under the Curve (AUC). [5]
Protocol for Comparative Validation Against Manual Counting
This protocol outlines how to rigorously benchmark an ML algorithm against the traditional standard.
- Aim: To compare the classification accuracy and consistency of an ML-based apoptosis detector against manual counting by multiple expert pathologists.
- Materials:
- A set of pre-annotated cell images with a confirmed apoptosis status (e.g., via gold-standard TUNEL assay).
- An established ML model (e.g., the MSA-RCNN from the previous protocol).
- Access to 3-5 board-certified pathologists or experienced cell biologists.
- Method Steps:
- Blinding: Present the same set of test images to both the ML algorithm and the human experts without revealing the ground truth or each other's results.
- Execution:
- The ML algorithm processes the images and outputs its classification (apoptotic vs. non-apoptotic) for each cell.
- Each human expert independently counts and classifies the cells in the same images using standard morphological criteria (e.g., chromatin condensation, nuclear fragmentation). [47]
- Data Analysis:
- Calculate the accuracy, sensitivity, and specificity for both the ML model and each human expert against the ground truth.
- Calculate the inter-observer variability (e.g., standard deviation) among the human experts.
- Perform a statistical analysis (e.g., paired t-test) to determine if the performance difference between the ML model and the human average is significant. [50]
Performance Data and Quantitative Comparison
The table below summarizes quantitative findings from studies that highlight the performance and challenges of both manual and ML-based approaches.
| Method / Model | Reported Performance Metric | Evidence of Overfitting/Bias Mitigation | Key Limitations & Strengths |
|---|---|---|---|
| Manual Counting with Hemocytometer | User-to-user variability commonly exceeds 20% for identical samples. [48] | N/A - The variability is the bias. | Strength: Low equipment cost. [49]Limitation: High subjectivity and low throughput. [48] [49] |
| Random Forest Classifier | ~79.8% accuracy detecting hyperosmotic stress-induced nuclear alterations. [5] | Use of cross-validation during training. [5] | Strength: More interpretable than deep learning.Limitation: May fail to capture complex spatial relationships in nuclear architecture. [5] |
| Multi-Scale Attention RCNN (Proposed Concept) | High classification performance on synthetic test data; PCA showed distinct clustering. [5] | Use of a held-out test set, regularization, and data standardization. Model noted to have challenges in interpretability and generalization. [5] | Strength: Can learn complex, hierarchical feature representations from texture data.Limitation: "Black box" nature; requires future explainability analyses and validation on diverse datasets. [5] |
| Deep Learning-based AI for Ultrasound | AUC of 0.89 on external validation across different patient demographics and ultrasound systems. [50] | Robust performance on external validation cohorts is a key indicator of generalizability and reduced bias. [50] | Strength: Demonstrated stability across real-world clinical heterogeneity. [50]Limitation: Requires extensive multi-center validation to ensure broad applicability. |
The Scientist's Toolkit: Essential Research Reagents and Materials
The following reagents and tools are fundamental for conducting rigorous apoptosis detection experiments and building reliable ML models.
| Item | Function in Apoptosis Detection |
|---|---|
| Trypan Blue | A vital dye used to exclude dead cells in manual and basic automated cell counters. It is toxic and can affect viability, making it suboptimal for precise apoptosis work. [48] [49] |
| Invitrogen LIVE/DEAD Fixable Stains | Single-color viability assays that provide a more precise and flexible alternative to trypan blue for flow cytometry and fluorescent automated counters. [48] |
| Annexin V / Propidium Iodide (PI) | A classic flow cytometry assay for distinguishing early apoptotic (Annexin V+/PI-), late apoptotic (Annexin V+/PI+), and necrotic (Annexin V-/PI+) cells. [47] |
| Pro-apoptotic Toxins (e.g., 6-hydroxydopamine) | Chemical inducers used in research to reliably trigger apoptosis in cell cultures for model training and experimental studies. [5] |
| GPU-Accelerated Workstation | Essential computing hardware for training complex deep learning models like CNNs in a reasonable timeframe. [5] |
Workflow and Algorithmic Diagrams
MSA-RCNN Apoptosis Detection Workflow
Anti-Overfitting Strategies in Model Training
Discussion and Future Directions
The integration of ML into apoptosis detection holds immense promise for overcoming the limitations of manual counting. The primary advantage of advanced models like the MSA-RCNN is their capacity to identify subtle, multi-parametric textural changes in nuclear chromatin that are invisible to the human eye, enabling earlier and more objective detection of apoptosis. [5]
However, this power comes with the responsibility of rigorous validation. As our comparison shows, an algorithm's excellent performance on a single, curated dataset is not a guarantee of its real-world utility. The core challenges remain:
- Generalizability: Models must be validated on external, multi-center datasets representing different cell types, equipment, and experimental conditions. [50] [5]
- Interpretability: Moving beyond "black box" models to explainable AI is crucial for building trust with researchers and clinicians. Future work should incorporate attribution maps that highlight which nuclear features the model used for its decision. [5]
- Data Bias Actively Addressed: Proactive steps, such as collecting diverse training data from the outset and employing techniques like domain adaptation, will be key to developing robust, unbiased algorithms that truly advance the field of apoptosis research and drug discovery.
Optimizing Signal-to-Noise in Live-Cell Reporter Systems
In the study of programmed cell death, or apoptosis, live-cell imaging provides an unparalleled window into dynamic cellular processes. The fidelity of this window, however, is governed by a single crucial parameter: the signal-to-noise ratio (SNR). For researchers and drug development professionals investigating apoptotic pathways, optimizing SNR is not merely a technical exercise but a fundamental prerequisite for generating reliable, quantifiable data. Low SNR obscures critical morphological hallmarks of apoptosis—such as membrane blebbing, chromatin condensation, and cytochrome-C release—leading to inaccurate quantification and potentially flawed biological conclusions [51]. This guide provides a comprehensive comparison of manual and automated approaches for apoptosis detection, with a focused examination of how each method impacts the SNR in live-cell reporter systems. We will objectively analyze their performance through experimental data, detailed methodologies, and visualizations of the core signaling pathways involved.
Apoptotic Signaling Pathways: A Visual Guide
Understanding the sources of signal in live-cell imaging requires a firm grasp of the apoptotic pathways themselves. The following diagram illustrates the key intrinsic and extrinsic pathways, highlighting points commonly targeted by fluorescent reporters.
This diagram shows the convergence of extrinsic (e.g., death receptor ligands) and intrinsic (e.g., cellular stress) pathways on the executioner caspases-3/7. Key detection points for reporters include cytochrome-C release and caspase activation [1] [22].
Manual vs. Automated Counting: A Quantitative Comparison
The method used to quantify apoptosis from imaging data directly impacts the effective SNR, directly influencing data accuracy and reproducibility. The table below summarizes a core quantitative comparison between manual and automated approaches.
Table 1: Performance Comparison of Manual vs. Automated Apoptosis Detection Methods
| Feature | Manual Counting (Hemocytometer/Trypan Blue) | Semi-Automated Algorithm (Image Analysis) | Fully Automated Deep Learning (ADeS) |
|---|---|---|---|
| Correlation with Gold Standard | N/A (Is the baseline) | Pearson's r = 0.978 [52] | Surpasses human performance [51] |
| Key Limiting Factor | Human perception of cell definition; low counted volume (~0.4 µL) [32] | Pre-processing and blob analysis parameters [52] | Training data quality and diversity [51] |
| Viability Determination | Trypan blue (toxic, can underestimate viability) [32] | DAPI staining (more precise) [32] | Probe-free based on morphology [51] |
| Inter-Operator Variability | High (CV ≥ 15% is average) [32] | Minimized (ICC = 0.986) [52] | Eliminated |
| Throughput & Speed | Laborious and time-consuming [53] [52] | Fast and reproducible [52] | High-throughput for full timelapses [51] |
| Best Use Case | Quick, low-cost viability checks | Accurate quantification of stained samples in high-throughput screens | Complex in vivo settings, large datasets, probe-free detection |
The data demonstrates that automated methods significantly enhance effective SNR by reducing human-introduced "noise" in the form of subjective judgment, volumetric errors, and low counting statistics [32] [52]. Advanced deep learning models like ADeS achieve classification accuracy above 98%, effectively filtering morphological signals from complex background noise in intravital microscopy data [51] [54].
Experimental Protocols for Apoptosis Detection
Protocol: Manual Cell Counting with Hemocytometer
This traditional protocol is prone to several sources of error that degrade SNR [32].
- Cell Staining: Mix cell suspension with Trypan blue dye in a 1:1 ratio. Incubate for a short period (5-30 minutes), as prolonged exposure is toxic to cells and can skew viability results.
- Chamber Loading: Pipette a specific volume (e.g., 10-20 µL) of the stained cell suspension into a hemocytometer chamber. Pipetting errors can lead to significant volume inaccuracies.
- Microscopy and Counting: Place the hemocytometer on a microscope stage. Using a bright-field microscope, count the viable (unstained) and non-viable (blue) cells in predetermined squares. The subjective human definition of a cell versus debris is a major source of variability.
- Calculation:
- Cell Concentration (cells/mL) = (Total cells counted / Number of squares counted) × Dilution Factor × Hemocytometer Conversion Factor (10^4)
- Percentage Viability = (Number of viable cells / Total number of cells) × 100
Protocol: Automated Analysis with a Semi-Automated Algorithm
This protocol, adapted from Bizrah et al., uses computational pre-processing to enhance SNR for more robust detection [52].
- Image Acquisition: Capture images of cells stained with a fluorescent apoptosis marker (e.g., Annexin-5) using a confocal microscope.
- Image Pre-processing (SNR Optimization):
- Cropping and Resizing: Crop to the region of interest and resize to standardize processing.
- Local Contrast "Gain Control": Flatten local luminance and contrast fluctuations by converting pixel intensities to local z-scores. This is calculated using Gaussian spatial filters:
Z = (I - μ) / σ, whereμis the local mean andσis the local standard deviation. This step ensures uniform filter response across the entire image.
- Cell Identification:
- Spatial Filtering: Apply a Laplacian-of-Gaussian (LoG) band-pass filter to the pre-processed image (
Z) to highlight isotropic structures like cells. - Thresholding and Blob Analysis: Isolate structures by global thresholding (e.g., 1.8 × standard deviation of the image). Use "blob analysis" to extract features (e.g., area, major/minor axis length) of each isolated region.
- Classification: Apply specific criteria (e.g., combined 'size' and 'aspect ratio') to differentiate apoptosing cells from debris or vessels.
- Spatial Filtering: Apply a Laplacian-of-Gaussian (LoG) band-pass filter to the pre-processed image (
Protocol: Live-Cell Imaging with FRET-Based Bioprobes
This protocol uses FRET-based molecular sensors to track caspase activity in live cells, leveraging ratiometric measurements to inherently reduce noise [22].
- Bioprobe Design and Preparation:
- Design a chimeric bioprobe with a donor fluorescent protein (e.g., GFP), a caspase-specific cleavage site (e.g., LEHD for caspase-9, DEVD for caspase-3), and an acceptor organic dye (e.g., Alexa Fluor 532).
- Produce and purify the bioprobe protein.
- Cell Preparation and Bioprobe Introduction:
- Culture adherent cells (e.g., HeLa) in glass-bottom dishes suitable for microscopy.
- Introduce the bioprobes into cells via a protein delivery system or direct mixing into the culture medium. The ratio of bioprobes can be adjusted based on their sensitivity.
- Apoptosis Induction and Live Imaging:
- Induce apoptosis using a stimulus (e.g., TNF-α and cycloheximide).
- Immediately place the dish on a live-cell imaging system. Acquire time-lapse images using filters appropriate for the donor and acceptor fluorophores.
- Image and Data Analysis:
- For each time point, calculate the net FRET efficiency simply as the ratio of donor to acceptor fluorescence intensity at a single excitation setting.
- Plot the normalized FRET ratio over time. A decrease in the FRET ratio indicates caspase activation and cleavage of the bioprobe. This ratiometric readout is self-correcting for variations in probe concentration and excitation intensity, thereby enhancing functional SNR.
The Scientist's Toolkit: Essential Research Reagents & Materials
Table 2: Key Reagent Solutions for Apoptosis Detection Assays
| Item | Function/Description | Application Context |
|---|---|---|
| Trypan Blue | A dye that stains dead cells with compromised membranes; can be toxic to cells over time [32]. | Manual cell counting and basic viability assessment. |
| Annexin V (Fluorescent Conjugate) | Binds to phosphatidylserine exposed on the outer leaflet of the cell membrane during early apoptosis [53] [52]. | Labeling apoptosing cells for imaging (e.g., in the DARC assay). |
| DAPI (4',6-diamidino-2-phenylindole) | A membrane-impermeable DNA-binding dye that defines dead cells with higher precision than Trypan Blue [32]. | Automated cell counters (e.g., NucleoCounter) and fluorescence microscopy for viability. |
| Acridine Orange | A cell-permeable nucleic acid binding dye that stains the total cell population [32]. | Automated cell counters (e.g., NucleoCounter) for total cell count. |
| FRET-Based Bioprobes | Chimeric molecular sensors (FP + dye) that lose FRET upon cleavage by specific proteases (e.g., caspases) [22]. | Multiplexed, quantitative live-cell imaging of enzymatic activity in signaling pathways. |
| Cyt-C-GFP Reporter | Genetically encoded construct where cytochrome-C is fused to GFP to monitor its release from mitochondria [1]. | Live-cell imaging of the intrinsic apoptotic pathway. |
| Caspase Reporter Cell Lines | Genetically encoded constructs with NES-NLS-EYFP and a caspase cleavage site; cleavage leads to nuclear translocation of EYFP [1]. | Live-cell imaging of specific caspase activation (e.g., caspase-3 or -8). |
The journey from manual to automated counting represents a paradigm shift in optimizing SNR for apoptosis detection. Manual methods, while accessible, introduce significant subjective and statistical noise. Semi-automated algorithms enhance SNR through computational pre-processing and objective blob analysis, offering excellent correlation with gold standards. The advent of deep learning models like ADeS marks the frontier, enabling probe-free detection of apoptosis based purely on morphological signatures in complex, in vivo environments with accuracy surpassing human capabilities [51]. The choice of method should be guided by the required balance between throughput, accuracy, and biological context, with the understanding that advanced automated systems provide the most robust and noise-resistant approach for modern drug development and high-content biological research.
Managing Computational Load and Data Storage for High-Throughput Imaging
In the field of apoptosis research, the shift from manual counting to automated algorithms represents a significant evolution, enabling the high-throughput analysis essential for modern drug discovery and biological studies. However, this transition introduces substantial challenges in computational load and data storage management. Automated imaging platforms can now analyze over 10,000 cells per test, generating massive datasets that demand sophisticated computational resources and storage infrastructure [43]. The efficient handling of these resources becomes a critical factor in determining the feasibility, cost, and success of large-scale apoptosis studies. This guide objectively compares the performance of different computational approaches and provides researchers with a framework for optimizing their image analysis workflows within the specific context of apoptosis detection research.
Computational Load Analysis: Automated Algorithms vs. Manual Counting
Performance Comparison of Analysis Methods
The computational requirements for apoptosis detection vary dramatically between manual and automated approaches, each with distinct implications for research throughput, scalability, and resource allocation.
| Feature | Manual Counting | Basic Automated Algorithms | Advanced Vision-Based Algorithms |
|---|---|---|---|
| Processing Speed | Minutes to hours per sample | Seconds to minutes per sample | Near real-time (seconds per sample) |
| Scalability | Poor; limited by human bandwidth | Good for moderate datasets | Excellent for high-throughput screening |
| Personnel Cost | High (requires trained technicians) | Low after initial setup | Low after development and validation |
| Hardware Requirements | Basic microscope | Standard workstation | High-performance computing (HPC) resources |
| Throughput Capacity | Low (10s of samples) | Mid (100s of samples) | High (1000s of samples) |
| Quantitative Data Output | Limited primarily to cell counts | Multiple parameters per cell | Multiple parameters with spatial and temporal context |
Manual counting remains a time-consuming process that requires extensive personnel training and is prone to human error and subjectivity [1]. While it demands minimal computational power, its limitations in scalability and throughput make it unsuitable for large-scale apoptosis studies, such as those required in modern drug screening pipelines.
Advanced automated algorithms represent a transformative approach, with studies demonstrating precision greater than 90% and sensitivity higher than 85% in detecting apoptotic events [1]. These vision-based systems employ sophisticated feature extraction to analyze fluorescent signal translocation patterns indicative of apoptosis, such as cytochrome-C release and caspase activation. This capability to monitor dynamic apoptotic events temporally and intracellularly provides a significant advantage over endpoint assays.
Experimental Protocol for Algorithm Validation
To objectively compare manual and automated apoptosis detection methods, researchers can implement the following validation protocol:
Sample Preparation:
- Utilize reporter cell lines (e.g., Cyt-C-GFP, caspase-3/-8 reporters) constructed from relevant cancer cell lines such as PC9 lung cancer or T47D breast cancer cells [1].
- Induce apoptosis using appropriate stimuli (e.g., TRAIL for extrinsic pathway activation or chemotherapeutic agents like doxorubicin for intrinsic pathway activation).
Image Acquisition:
- Capture images using conventional epifluorescence microscopy or high-content imaging systems.
- Ensure consistent imaging parameters across all samples for valid comparison.
Parallel Analysis:
- Process samples manually by trained technicians blinded to the experimental conditions.
- Analyze the same samples using the automated algorithm (e.g., the MATLAB-based tunable algorithm described in the research) [1].
- For additional validation, compare results with flow cytometry data where feasible.
Performance Metrics Calculation:
- Calculate precision: TP / (TP + FP) × 100
- Calculate sensitivity: TP / (TP + FN) × 100
- Assess analysis time for each method
- Evaluate inter-observer and intra-observer variability for manual counting
- Quantify algorithm consistency across multiple runs
This protocol enables direct comparison between methods, providing the experimental data necessary to validate automated systems for specific apoptosis detection applications.
Data Storage Infrastructure for Imaging Workloads
Storage Solutions Comparison
High-throughput imaging generates enormous datasets that require robust storage solutions. The table below compares different storage approaches relevant to apoptosis research:
| Storage Type | Typical Capacity | Relative Speed | Cost Efficiency | Best Suited For |
|---|---|---|---|---|
| On-Premise HDD Arrays | Petabytes | Moderate | High for cold storage | Archived raw images, backup data |
| On-Premise All-Flash Arrays | Terabytes to Petabytes | Very High | Lower for active projects | Active analysis workloads, frequent access |
| Cloud Object Storage | Effectively unlimited | Variable (depends on connection) | Pay-as-you-go | Collaborative projects, data sharing |
| DNA-Based Storage | Extremely high density (theoretical) | Very slow (read/write) | Developing technology | Medical cold data, long-term archiving |
Emerging Storage Technologies
The data burden from healthcare and life sciences is anticipated to constitute 36% of the global data volume by 2025, with much of this classified as "cold data" that is infrequently accessed but must be preserved for long periods [55]. This is particularly relevant for apoptosis research data that must be retained for regulatory compliance or future re-analysis.
DNA storage presents a promising solution for long-term archival of medical and research data, offering exceptional durability, data density, and cost-effectiveness for cold storage scenarios [55]. While currently emerging, this technology could become relevant for preserving massive image datasets from large-scale apoptosis studies.
For active research workloads, High-Performance Computing (HPC) storage solutions are evolving to meet demands, with the market projected to grow at a CAGR of 15% from 2025-2033 [56]. These systems increasingly leverage NVMe-based storage architectures and parallel file systems (e.g., Lustre, IBM Spectrum Scale) to provide the high throughput and low latency required for processing large imaging datasets.
The cloud vs. on-premise decision remains relevant for research institutions. Cloud solutions offer superior scalability, cost flexibility (OPEX vs. CAPEX), and built-in disaster recovery, while on-premise systems provide localized control and can be more cost-effective for predictable, long-term workloads [57].
Experimental Workflow and Signaling Pathways
Apoptosis Detection Workflow
The following diagram illustrates the integrated experimental and computational workflow for high-throughput apoptosis detection, highlighting points of computational load and data generation:
Apoptosis Signaling Pathways
Understanding the molecular pathways of apoptosis provides context for the biomarkers used in automated detection algorithms. The following diagram outlines the key pathways:
The Researcher's Toolkit: Essential Materials and Reagents
| Reagent/Kit | Primary Function | Application in Apoptosis Detection |
|---|---|---|
| Annexin V Assays | Binds to externalized phosphatidylserine | Early apoptosis detection by flow cytometry [58] |
| Caspase Reporter Cell Lines | Visualize caspase activation via fluorescence | Live monitoring of caspase-3/8 activity [1] |
| Mitochondrial Membrane Potential Dyes | Detect loss of mitochondrial membrane potential | Early apoptosis detection (intrinsic pathway) [58] |
| Cytochrome C-GFP Reporter | Track cytochrome C release from mitochondria | Monitor intrinsic pathway activation [1] |
| Propidium Iodide/7-AAD | Membrane integrity assessment | Necrotic cell discrimination [58] |
| TUNEL Assay Kits | Label DNA fragmentation | Late apoptosis detection |
| Trypan Blue | Cell viability staining | Cell density and viability assessment [43] |
The management of computational load and data storage represents a critical consideration in high-throughput apoptosis imaging. Automated algorithms offer substantial advantages in throughput, objectivity, and analytical depth compared to manual counting, but require significant computational resources and sophisticated storage infrastructure. As imaging technologies advance and dataset sizes grow, researchers must carefully evaluate their computational strategies, considering hybrid approaches that leverage both cloud and on-premise resources. The implementation of robust, scalable computational workflows will continue to be essential for unlocking the full potential of automated apoptosis detection in drug development and basic research.
Navigating the Trade-offs Between Multiplexing, Cost, and Throughput
In the fields of apoptosis research and drug development, the ability to simultaneously analyze multiple samples or parameters—known as multiplexing—has become a critical capability. For researchers and scientists investigating programmed cell death, the strategic selection of a multiplexing approach directly influences experimental cost, data quality, and throughput. The growing adoption of automated algorithms for apoptosis detection further compounds the importance of these decisions, as the input data quality fundamentally determines algorithmic performance. Modern multiplexing technologies present researchers with a complex landscape of trade-offs where no single solution optimizes all parameters. This guide provides an objective comparison of prevailing multiplexing strategies, their experimental requirements, and their performance characteristics to inform selection for apoptosis detection studies.
Multiplexing Technology Landscape
Multiplexing technologies for biological analysis generally fall into several categories, each with distinct mechanisms and applications. Spatial multiplexing preserves the spatial context of molecules within tissues, combining molecular analysis with spatial coordinates to address biological questions across multiple dimensions [59]. Flow cytometry-based approaches enable high-throughput, multiparametric analysis at the single-cell level and are extensively utilized in immunology, oncology, and stem cell research [60]. For single-cell sequencing workflows, several specialized multiplexing strategies have emerged, including on-chip multiplexing, cell hashing, and genetic variant-based demultiplexing [61].
The fundamental advantage shared across all multiplexing approaches is the ability to process multiple samples in a single reaction or run, which significantly reduces per-sample costs and batch effects while increasing throughput [61]. In apoptosis research specifically, multiplexing enables researchers to simultaneously assess multiple cell death parameters across different treatment conditions, time points, or cell types, providing more comprehensive insights into death mechanisms.
Technology Comparison Framework
To objectively compare multiplexing technologies, we evaluate them across several key parameters:
- Multiplexing capacity: Number of samples that can be processed simultaneously
- Species compatibility: Applicability across model organisms
- Additional reagent requirements: Need for specialized tags or antibodies
- Implementation complexity: Technical expertise and workflow steps required
- Cost structure: Both initial investment and per-sample costs
- Data quality: Impact on sensitivity, specificity, and reproducibility
Comparative Analysis of Multiplexing Technologies
Technology Performance Metrics
Table 1: Comparative Performance of Multiplexing Technologies in Single-Cell Analysis
| Technology | Max Samples/Lane | Species Support | Extra Reagents? | Implementation Complexity | Cell Input Requirements |
|---|---|---|---|---|---|
| GEM-X Flex | 16 (128 per chip) | Human/Mouse only | No | Moderate | >25,000 cells [61] |
| 10x CellPlex (Lipid Hashing) | 12 (96 per chip) | Species agnostic | Yes (lipid tags) | Moderate | >100,000 cells [61] |
| Antibody Hashing | Determined by targeted cell number | Human/Mouse only | Yes (antibodies) | High | >200,000 cells [61] |
| Genetic Deconvolution | Determined by targeted cell number | Species agnostic | No | High (bioinformatics) | Varies [61] |
| OCM (GEM-X Universal) | n/a (8 per chip) | Species agnostic | No | Low | Up to 5,000 per sample [61] |
Cost and Throughput Analysis
Table 2: Cost and Throughput Trade-offs Across Multiplexing Platforms
| Technology | Equipment Costs | Reagent Costs per Sample | Hands-on Time | Theoretical Maximum Samples per Run | Best-Suited Applications |
|---|---|---|---|---|---|
| GEM-X Flex | High (specialized chip) | Low | Moderate | 128 | High-throughput studies, FFPE samples [61] |
| Cell Hashing | Moderate (standard platform) | Moderate to High | High | 96 | Multiomics experiments, species-agnostic studies [61] |
| Genetic Deconvolution | Low (computational) | None | Low (post-sequencing) | Unlimited in theory | Genetically diverse populations, no additional labeling [61] |
| OCM | High (specialized chip) | Low | Low | 8 | Low-input samples, cost-sensitive studies [61] |
| Flow Cytometry | High ($300,000-$500,000 for advanced systems) [60] | Moderate (antibodies, dyes) | Moderate | Limited by panel design | Immunophenotyping, clinical diagnostics [60] [62] |
Market Adoption and Growth Trends
The expanding adoption of multiplexing technologies is reflected in market growth trajectories. The global flow cytometry market, a key multiplexing platform, was valued at USD 5.75 billion in 2024 and is anticipated to grow at a CAGR of 10.5% to reach USD 14.10 billion by 2033 [60]. Similarly, the North America apoptosis assay market, where multiplexing plays a crucial role, is projected to grow from USD 2.7 billion in 2024 to USD 6.1 billion by 2034, expanding at a CAGR of 8.4% [15]. This growth is fueled by rising chronic disease prevalence, increasing demand for personalized medicine, and technological advancements that enhance multiplexing capabilities [15].
Experimental Protocols for Multiplexed Apoptosis Detection
Automated Fluorescence Microscopy with ApoNecV Macro
The ApoNecV macro provides an automated approach for distinguishing viable, apoptotic, and necrotic cells from fluorescent microscopy images, offering significant advantages over manual counting [3].
Key Reagents and Materials:
- Annexin V-CY3TM Apoptosis Detection Kit (APOAC, Sigma Aldrich) containing:
- Annexin-Cy3.18 (AnnCy3): Binds to phosphatidylserine exposed on apoptotic and necrotic cells
- 6-Carboxyfluorescein diacetate (6-CFDA): Measures viable cells through esterase activity [3]
- Cell culture samples (e.g., HeLa cell line)
- High performance #1.5 cover glass bottom 24-well plate (Cellvis #P24-1.5H-N)
- Confocal spinning disk microscope (e.g., Yokogawa CSU-X1) with 10× objective (0.3 NA)
Experimental Workflow:
- Cell Culture and Treatment: Seed 50,000 cells per well and adhere for 24 hours. Apply experimental treatments to induce apoptosis or necrosis [3].
- Staining: Incubate cells with both AnnCy3 and 6-CFDA probes simultaneously for 15 minutes at room temperature without light exposure [3].
- Imaging: Acquire images using 488 nm laser for 6-CF (ex 495nm/em 520 nm) and 561 nm laser for AnnCy3 (ex 550 nm/em 570 nm). Capture 3 images per sample with approximately 500-1000 cells [3].
- Image Processing: Process images through the ApoNecV macro which performs:
- Background subtraction using Rolling Ball Radius algorithm
- Deconvolution using generated Point Spread Function
- Automated classification of viable, apoptotic, and necrotic cells [3]
- Validation: Compare automated results with manual counting to ensure reliability [3].
Diagram 1: ApoNecV Apoptosis Detection Workflow
Flow Cytometry with Multiplexed Apoptosis Assays
Flow cytometry enables highly multiplexed apoptosis detection through multicolor panels, allowing simultaneous assessment of multiple apoptotic parameters.
Key Reagents and Materials:
- Fluorochrome-conjugated Annexin V (e.g., Annexin V-FITC, Annexin V-APC)
- Viability dyes (e.g., propidium iodide, 7-AAD)
- Caspase activity probes (e.g., FLICA reagents)
- Mitochondrial membrane potential dyes (e.g., JC-1, TMRM)
- Antibodies for cell surface markers (for immunophenotyping)
- Binding buffer appropriate for Annexin V staining
- Flow cytometer capable of multicolor detection (e.g., BD FACSymphony, Cytek Aurora)
Experimental Workflow:
- Sample Preparation: Harvest cells and wash with cold PBS. Divide into aliquots for different staining conditions including unstained and single-color controls.
- Staining: Incubate cells with Annexin V in binding buffer for 15-20 minutes at room temperature. Add viability dye shortly before analysis. For intracellular staining (caspases), permeabilization may be required.
- Data Acquisition: Acquire data on flow cytometer, ensuring appropriate compensation using single-stained controls. Collect sufficient events for statistical power (typically 10,000 events per sample minimum).
- Data Analysis: Use flow cytometry software to identify cell populations based on light scattering and marker expression. Analyze Annexin V and viability dye staining to distinguish viable (AnnV-/PI-), early apoptotic (AnnV+/PI-), and late apoptotic/necrotic (AnnV+/PI+) populations.
- Multiplexed Analysis: For complex panels, use sequential gating strategies to analyze apoptosis within specific cell subtypes identified by surface markers.
The Scientist's Toolkit: Essential Research Reagents
Table 3: Key Research Reagent Solutions for Multiplexed Apoptosis Detection
| Reagent/Material | Function | Example Applications | Considerations |
|---|---|---|---|
| Annexin V-Cy3.18 | Binds externalized phosphatidylserine on apoptotic cells | Fluorescent microscopy with ApoNecV macro [3] | Requires calcium-containing buffer |
| 6-Carboxyfluorescein diacetate (6-CFDA) | Viability marker converted to fluorescent 6-CF by esterases in live cells | Distinguishing viable vs. non-viable cells [3] | Signal lost in necrotic cells due to membrane integrity loss |
| TotalSeq Hashing Antibodies (BioLegend) | Oligo-tagged antibodies for sample multiplexing | Cell hashing in single-cell RNA sequencing [61] | Compatible with 10x Genomics 3' and 5' assays |
| CellPlex Kit (10x Genomics) | Lipid-based tags for sample multiplexing | Species-agnostic sample pooling for scRNA-seq [61] | Not compatible with GEM-X workflows |
| Fluorochrome-conjugated Annexin V | Flow cytometry-based apoptosis detection | Multiparameter flow cytometry panels | Requires appropriate buffer conditions |
| Caspase Activity Probes | Detection of caspase activation in apoptotic cells | Multiplexed apoptosis signaling analysis | Timing critical for accurate detection |
Strategic Implementation Considerations
Selection Criteria for Multiplexing Approaches
Choosing the appropriate multiplexing strategy requires careful consideration of experimental goals and constraints. The following decision framework can guide selection:
Sample Type Considerations:
Throughput Requirements:
Budget Constraints:
Diagram 2: Multiplexing Strategy Selection Framework
Integration with Automated Analysis Platforms
The growing adoption of automated algorithms for apoptosis detection creates both opportunities and considerations for multiplexed experimental design:
Data Quality Requirements: Automated algorithms typically require consistent, high-quality input data. Multiplexing approaches that minimize batch effects (such as OCM that processes samples under identical conditions) provide superior data for automated analysis [61].
Scalability for Large Datasets: High-throughput multiplexing methods like GEM-X Flex generate data at scales that necessitate automated analysis, creating synergistic benefits [61].
Standardization Needs: Automated algorithms perform best with standardized protocols. Bead-based flow cytometry technology offers advantages such as higher throughput, better sensitivity, and the ability to analyze multiple parameters simultaneously, supporting more consistent automated analysis [60].
Multiplexing technologies present researchers with a fundamental trade-off triangle between cost, throughput, and data quality. No single solution optimizes all three parameters, requiring strategic selection based on experimental priorities. For apoptosis researchers implementing automated detection algorithms, the choice of multiplexing approach will significantly influence both experimental outcomes and analytical performance.
Low-to-moderate throughput studies with limited budgets may benefit from On-Chip Multiplexing or genetic deconvolution approaches, while large-scale cohort studies demand the high-plex capabilities of GEM-X Flex. Flow cytometry remains the gold standard for multiparameter single-cell analysis in clinical applications, despite higher instrumentation costs. As multiplexing technologies continue to evolve alongside automated analysis platforms, researchers should regularly reassess these trade-offs to leverage the most appropriate technology for their specific apoptosis research applications.
Benchmarking Performance: A Rigorous Comparison of Automated vs. Manual Detection
In the field of apoptosis research, the accurate detection and quantification of programmed cell death is a cornerstone for advancing our understanding of cancer biology, neurodegenerative diseases, and drug development. For decades, manual analysis by experts has been the gold standard for interpreting complex cellular data, particularly in flow cytometry where "gating" strategies separate cellular populations based on biomarker expression. However, this manual process is inherently subjective, time-consuming, and vulnerable to human bias. The emergence of automated algorithms promises to overcome these limitations by offering rapid, unbiased, and reproducible analysis. This guide provides a objective comparison of these two methodologies, quantifying their performance in terms of accuracy, precision, and sensitivity, to aid researchers and drug development professionals in selecting the most appropriate tool for their apoptosis detection workflows.
Performance Metrics Comparison
The following tables summarize quantitative performance data for automated algorithms and, where available, comparative benchmarks for manual expert gating.
Table 1: Performance Metrics of Featured Automated Algorithms
| Algorithm / Approach | Reported Accuracy | Reported Sensitivity | Reported Precision | Key Methodology |
|---|---|---|---|---|
| ApoBD Detection via ResNet50 [63] | 92% | Information Not Provided | Information Not Provided | Deep learning-based identification of apoptotic bodies in label-free phase-contrast images. |
| Biomarker Translocation Analysis [64] | >90% (Precision) | >85% | >90% | Automated analysis of cytochrome-C and caspase-3/8 signal translocation in reporter cells. |
| Fluorescent Caspase-3 Reporter [6] | High (Qualitative) | High (Qualitative) | High (Qualitative) | Real-time fluorescence switch-off upon caspase-3 activation. |
Table 2: Comparative Analysis of Methodological Characteristics
| Characteristic | Automated Algorithms | Expert Manual Gating |
|---|---|---|
| Throughput | High (suitable for 1000s of samples/images) [64] | Low to Medium (time-intensive) |
| Objectivity | High (rules-based, minimizes human bias) | Variable (subjective to researcher's experience) |
| Reproducibility | High (consistent parameters applied to all data) | Moderate (prone to inter-observer variability) |
| Multiplexing Capability | High (can integrate multiple data streams and biomarkers) [63] | Limited by human analytical capacity |
| Early Apoptosis Detection | Can detect events earlier than some fluorescent markers (e.g., Annexin-V) [63] | Dependent on the sensitivity of the staining protocol used |
Detailed Experimental Protocols
To contextualize the performance data, below are the detailed methodologies from key studies developing automated apoptosis detection algorithms.
Protocol 1: Label-Free Apoptotic Body Detection with Deep Learning
This protocol outlines a method for detecting apoptosis by directly identifying apoptotic bodies (ApoBDs) using a convolutional neural network, without the need for fluorescent labels [63].
1. Cell Culture & Assay Setup:
- Co-culture effector cells (e.g., tumor-infiltrating lymphocytes) and target cells (e.g., Mel526 melanoma cell line) within polydimethylsiloxane (PDMS) nanowell arrays.
- For identification, differentially label the cell types with fluorescent linkers like PKH67 (green) for effector cells and PKH26 (red) for target cells.
2. Image Acquisition:
- Use a high-throughput time-lapse imaging system, such as TIMING (Time-lapse Imaging Microscopy In Nanowell Grids).
- Acquire images every 5 minutes using an automated microscope equipped with phase-contrast and fluorescence channels.
- Maintain the imaging chamber at controlled humidity and CO₂ levels.
3. Data Preprocessing:
- Process raw images to identify individual nanowells and isolate multi-channel image sequences for each well.
- Use existing pipeline modules for cell detection and counting within each nanowell.
4. Algorithm Training & Apoptosis Detection:
- Model Architecture: Employ a pre-trained ResNet50 network for image classification.
- Training: Train the model to classify frames based on the presence or absence of ApoBDs in the phase-contrast images.
- Event Detection: Apply a temporal constraint (e.g., detection of ApoBDs in three consecutive frames) to define the onset of apoptosis and reduce false positives from sporadic noise.
- Validation: Compare the algorithm's detection events with parallel Annexin-V staining to quantify performance.
Protocol 2: Automated Analysis of Biomarker Translocation
This protocol describes the use of an automated algorithm to analyze the translocation of key apoptotic biomarkers, such as cytochrome-C and caspases, in reporter cell lines [64].
1. Reporter Cell Line Development:
- Engineer stable reporter cell lines using lung (PC9) or breast (T47D) cancer cells.
- Construct genetic reporters so that the activation of apoptotic events (e.g., cytochrome-C release from mitochondria or caspase-3/8 activation) triggers a fluorescent signal translocation within the cell, observable with a single fluorophore.
2. Apoptosis Induction & Live-Cell Imaging:
- Expose reporter cells to specific apoptotic stimuli (e.g., chemotherapeutic agents).
- Perform live-cell imaging over time to capture the dynamic translocation of the fluorescent signal without the need for fixation or additional staining.
3. Image Analysis with Automated Algorithm:
- Platform: Develop a tunable, vision-based algorithm in an environment like MATLAB.
- Analysis Method: Move beyond simple image statistics. The algorithm is designed to robustly quantify the spatial movement of fluorescent signals within single or multiple cells.
- Output: The algorithm outputs quantitative data on the timing and extent of biomarker translocation, which serves as a direct measure of apoptotic activity.
4. Performance Validation:
- Validate the algorithm's performance by comparing its readouts to established apoptotic markers or morphological changes.
- Report key metrics including precision (>90%) and sensitivity (>85%) for detecting apoptotic events.
Signaling Pathways and Experimental Workflows
The following diagrams illustrate the core apoptosis signaling pathway targeted by detection technologies and a generalized workflow for comparing automated versus manual analysis methods.
Core Apoptosis Signaling Pathway
Core Apoptosis Pathway & Detection
Algorithm vs. Gating Workflow
Analysis Workflow Comparison
The Scientist's Toolkit
This section details key reagents, tools, and technologies used in the featured experiments for apoptosis detection.
Table 3: Essential Research Reagent Solutions
| Item | Function / Application |
|---|---|
| Annexin V Conjugates (e.g., FITC, PE) | Binds to phosphatidylserine (PS) exposed on the outer leaflet of the cell membrane during early apoptosis. A cornerstone for flow cytometry-based apoptosis assays [58]. |
| Viability Stains (e.g., Propidium Iodide, 7-AAD) | Membrane-impermeable dyes that distinguish late apoptotic and necrotic cells (stain-positive) from early apoptotic and viable cells (stain-negative) in combination with Annexin V [58]. |
| Caspase-3 Fluorescent Reporter | Genetically encoded biosensor that loses fluorescence upon cleavage by activated caspase-3, enabling real-time monitoring of apoptosis in live cells [6]. |
| MitoStep Kits | Utilizes dyes like DilC1(5) to measure mitochondrial membrane potential ((\Delta\psi_m)), loss of which is an early event in the intrinsic apoptotic pathway [58]. |
| Reporter Cell Lines | Engineered cells (e.g., cytochrome-C, caspase-3/8 reporters) where apoptosis activation causes a measurable signal translocation, facilitating automated, live-cell analysis [64]. |
| Nanowell Array Chips | Microfabricated platforms for high-throughput, time-lapse imaging of single-cell or cell-cell interactions, ideal for collecting data for automated analysis [63]. |
Comparative Analysis of Throughput and Temporal Resolution
Within the broader research on apoptosis detection, the shift from manual counting to automated algorithms represents a pivotal technological transition. This evolution is primarily driven by the need to overcome critical limitations in throughput and temporal resolution that have long constrained experimental design and data quality in cell death research. Automated methods are not merely incremental improvements but constitute a fundamental change in how researchers quantify and characterize programmed cell death. This guide provides an objective comparison of the performance between traditional manual counting and modern automated algorithms, presenting supporting experimental data to inform researchers, scientists, and drug development professionals in their methodological selections.
Performance Comparison: Quantitative Metrics
The following tables summarize key quantitative differences between manual and automated apoptosis detection methods based on current experimental data from peer-reviewed studies.
Table 1: Overall Performance Metrics of Apoptosis Detection Methods
| Method Type | Temporal Resolution | Throughput (Samples/Time) | Detection Accuracy | Key Applications |
|---|---|---|---|---|
| Manual Counting | Hours to days (endpoint) | 10-100 samples/day | Subject to user variability (~70-80% consensus) | Basic research, endpoint analysis |
| Automated Imaging + AI Analysis | 5-minute frames [63] | 10,000+ cells/test [43] | 92-98% classification accuracy [63] [54] | High-content screening, kinetic studies |
| Flow Cytometry | Minutes per sample | 96-well plates in 1-2 hours | High for population analysis | Drug screening, multiparametric analysis |
| Smartphone-based Systems | Near real-time | >10,000 cells per test [43] | <5% deviation vs. flow cytometry [43] | Resource-limited settings, point-of-care |
Table 2: Technical Specifications of Automated Apoptosis Detection Systems
| System/Algorithm | Detection Principle | Temporal Features | Spatial Resolution | Experimental Validation |
|---|---|---|---|---|
| ADeS (Transformer-based) | Activity recognition from morphology [54] | Tracks full apoptosis duration (~8 frames median) [54] | Single-cell in complex tissues | >10,000 apoptotic instances [54] |
| ResNet50 ApoBD Detection | Apoptotic body identification [63] | 5 min/frame error in onset prediction [63] | 0.5-2.0 μm ApoBDs [63] | 70% detection of Annexin-V-negative events [63] |
| ZipGFP Caspase Reporter | Real-time caspase-3/7 activation [65] | Continuous monitoring over 120 hours [65] | Single-cell in 2D & 3D models [65] | Correlation with Annexin V/PI staining [65] |
| AI-based ICD Detector | Morphological changes in ICD [66] | Real-time optical analysis [66] | Subtle morphological differences [66] | Identification of 3 ICD inducers from 8 candidates [66] |
Experimental Protocols and Methodologies
Manual Apoptosis Counting Protocols
Traditional manual counting relies primarily on fluorescent markers or morphological assessment using hemocytometers. The standard protocol involves staining with Annexin V conjugated to fluorophores like Alexa Fluor 647 at recommended dilutions (e.g., 1:60) to detect phosphatidylserine exposure [63]. For viability assessment, trypan blue exclusion remains common, though it presents limitations including cytotoxicity with prolonged incubation and potential under-counting of dead cells [67]. Cell density and viability calculations follow established formulas: viability (%) = (live cell count / total cell count) × 100. These methods typically analyze 100-300 cells per sample across technical replicates, requiring 5-10 minutes per sample, creating a significant bottleneck for large-scale experiments [67].
Automated AI-Based Detection Workflow
Advanced automated systems employ sophisticated deep learning architectures trained on extensive datasets. The ADeS system, for instance, utilizes a transformer-based deep learning architecture for apoptosis detection system (ADeS) that employs activity recognition principles [54]. The model was trained on more than 10,000 apoptotic instances collected both in vitro and in vivo, achieving classification accuracy above 98% [54]. The training incorporated spatial-temporal detection capabilities, enabling the system to process full microscopy time-lapses and deliver location and duration data for multiple apoptotic events simultaneously [54].
High-Content Screening Protocol
For high-throughput applications, automated systems like the TIMING (Time-lapse Imaging Microscopy In Nanowell Grids) platform image cells within polydimethylsiloxane nanowell arrays using an Axio fluorescent microscope equipped with a 20× 0.8 NA objective and scientific CMOS camera [63]. Images are typically captured every 5 minutes in a controlled chamber, with data processing pipelines consisting of deep CNN models for nanowell detection and cell detection [63]. The system applies an image classifier to detect frames demonstrating release of apoptotic bodies (ApoBDs), with a three-frame temporal constraint to distinguish actual death events from noise [63]. This approach has demonstrated the capability to detect apoptosis events where 70% were not detected by conventional Annexin-V staining [63].
Real-Time Caspase Reporter System
The ZipGFP-based caspase-3/7 reporter system provides an alternative automated approach for dynamic apoptosis tracking [65]. This system utilizes a lentiviral-delivered caspase-3/7 reporter carrying ZipGFP alongside a constitutive mCherry marker, enabling real-time monitoring of apoptosis through fluorescence reconstitution specifically upon caspase-3/7 activation [65]. Validation experiments typically involve treatment with apoptosis inducers like carfilzomib or oxaliplatin, with co-treatment using pan-caspase inhibitor zVAD-FMK as a negative control [65]. The system has been adapted for both 2D and 3D culture systems, including organoids, enabling dynamic tracking of apoptotic events and viability loss at single-cell resolution over extended periods (up to 120 hours) [65].
Visualization of Workflows
Automated vs Manual Apoptosis Detection Workflows
Apoptosis Pathway with Detection Methods
The Scientist's Toolkit: Essential Research Reagents
Table 3: Key Reagents and Materials for Apoptosis Detection assays
| Reagent/Assay | Function | Detection Method | Throughput Compatibility |
|---|---|---|---|
| Annexin V conjugates (e.g., Alexa Fluor 647) | Detects phosphatidylserine exposure on cell membrane [63] | Flow cytometry, fluorescence microscopy | Medium (plate-based systems) |
| Trypan Blue | Membrane integrity assessment for viability [43] [67] | Brightfield microscopy, automated cell counters | Low to medium (morbidity concerns) |
| ZipGFP caspase-3/7 reporter | Real-time caspase activity monitoring [65] | Live-cell fluorescence imaging | High (kinetic studies) |
| PKH26/PKH67 fluorescent linkers | Cell tracking and differentiation [63] | Multi-channel fluorescence | High (TIMING platform) |
| Acridine Orange/Propidium Iodide | Viability staining with DNA binding [67] | Fluorescence microscopy, image cytometry | High (automated systems) |
| Cellaca MX counter | High-throughput cell counting [67] | Brightfield and fluorescence imaging | Very high (24 samples in 1-3 min) |
| Polydimethylsiloxane (PDMS) nanowell arrays | Single-cell confinement for imaging [63] | Phase-contrast/fluorescence microscopy | High (TIMING platform) |
The comparative analysis of throughput and temporal resolution clearly demonstrates that automated algorithms represent a significant advancement over manual counting methods for apoptosis detection. Automated systems provide substantially improved temporal resolution, enabling real-time kinetic analysis of apoptosis progression with frame intervals as brief as 5 minutes, compared to endpoint measurements typical of manual approaches [63]. Throughput capabilities are equally enhanced, with automated systems capable of analyzing over 10,000 cells per test compared to the limited sample processing capacity of manual methods [43]. The emergence of deep learning approaches like ADeS and ResNet50-based detection has achieved classification accuracy exceeding 92-98%, while detecting apoptosis events that conventional methods miss [63] [54]. These technological advances enable researchers to capture the dynamic nature of apoptosis with unprecedented resolution and scale, supporting more sophisticated experimental designs in both basic research and drug development applications.
Evaluating Objectivity and Reproducibility Across Techniques
In the fields of biomedical research and drug development, the accurate detection of apoptosis, or programmed cell death, is fundamental to understanding disease mechanisms and evaluating therapeutic efficacy. The choice of detection technique directly influences the objectivity, reproducibility, and ultimate reliability of experimental data. This guide provides a comparative analysis of established and emerging methodologies, focusing on their operational principles, performance metrics, and suitability for different research applications.
The most common apoptosis detection methods can be broadly categorized into manual, instrument-based, and emerging algorithmic-driven techniques. The following table summarizes their key characteristics for direct comparison.
Table 1: Comparative Overview of Core Apoptosis Detection Techniques
| Technique | Primary Readout / Principle | Throughput | Key Objectivity & Reproducibility Considerations |
|---|---|---|---|
| Hemocytometer [68] | Manual cell counting via microscopy. | Low | Low objectivity & reproducibility; highly susceptible to human error and operator experience. |
| Flow Cytometry [68] [69] | Multiparametric analysis (e.g., Annexin V/PI) of individual cells in a fluid stream. | High | High reproducibility for large cells; sensitivity can vary with cell type and sample handling; data analysis requires expertise to avoid subjective gating [70]. |
| Fluorescent Microscopy & High-Content Live-Cell Imaging [69] | Kinetic imaging of fluorescent reporters (e.g., Annexin V, caspase sensors) in live cells. | Medium to High | Superior objectivity for kinetic data; provides single-cell and population-level resolution; minimizes handling artifacts seen in flow cytometry [69]. |
| Automated Image Analysis [11] [71] | Software-based identification and counting of cells or plaques from digital images. | High | High objectivity & reproducibility; eliminates human counting fatigue; performance depends on algorithm and image quality [11] [71]. |
| Novel Fluorescent Reporters [6] | Caspase-activated fluorescence "switch-off" in live cells. | Medium | High objectivity; enables real-time, label-free kinetic analysis in live cells, reducing fixation and staining artifacts [6]. |
Quantitative Performance Data
To facilitate an evidence-based selection of methods, the following table consolidates quantitative performance data from validation studies.
Table 2: Quantitative Performance Comparison of Apoptosis Detection Methods
| Technique | Reported Sensitivity / Accuracy | Sample Throughput | Key Experimental Findings from Literature |
|---|---|---|---|
| High-Content Live-Cell Imaging (Annexin V) [69] | 10-fold more sensitive than flow cytometry in detecting early apoptosis. | Kinetic data from multi-well plates over 24+ hours. | Eliminates sample processing stress of flow cytometry; provides real-time kinetic data showing Annexin V positivity markedly precedes viability dye uptake [69]. |
| Quantella (Smartphone-Based Platform) [11] | <5% deviation from flow cytometry; >90% accuracy in cell identification across 12 cell types. | >10,000 cells per test. | Adaptive image-processing pipeline enables accurate, morphology-independent segmentation without deep learning or user-defined parameters [11]. |
| plaQuest (Automated Plaque Counting) [71] | Strong correlation (R²) with manual counting by four analysts. | Rapid analysis of a 24-well plate image. | Automated counting reduces workload and subjectivity; accuracy validated via inhibitor assay, yielding identical IC₅₀ values to manual counting [71]. |
| Novel Caspase-3 GFP Reporter [6] | Enables real-time, highly sensitive monitoring of apoptosis. | Applicable to various cell lines and animal models. | Fluorescence switch-off at apoptosis onset allows tracking under various conditions, including exposure to toxic substances and anticancer drugs [6]. |
Detailed Experimental Protocols
Protocol: Kinetic Analysis of Apoptosis with Real-Time High-Content Live-Cell Imaging
This protocol, adapted from a validated study, details a highly sensitive method for kinetic analysis of apoptosis [69].
Key Reagents & Materials:
- Recombinant Annexin V conjugated to a fluorophore (e.g., Annexin V-488 or Annexin V-594).
- A compatible viability dye (e.g., YOYO3), noted for low toxicity and stability in long-term imaging.
- Appropriate cell culture medium (e.g., DMEM), which contains sufficient Ca²⁺ for Annexin V binding without the need for supplemental buffers that can synergistically stress cells.
- Multi-well plates suitable for imaging.
- High-content live-cell imaging system.
Procedure:
- Cell Preparation & Plating: Plate cells in the multi-well plate and allow them to adhere and grow to the desired confluency.
- Reagent Addition: Add the recombinant Annexin V and the viability dye (YOYO3) directly to the culture medium. The concentrations used can be as low as 0.25 μg/mL, which is approximately 10-fold less than traditional flow cytometry protocols [69].
- Treatment & Imaging: Introduce the apoptotic inducer (e.g., drug, toxin) to the cells. Immediately place the plate in the live-cell imager and commence time-lapse imaging, acquiring images at defined intervals (e.g., every 2 hours) for the duration of the experiment (e.g., 24-48 hours).
- Data Analysis: Use the imager's software to quantify the fluorescence signals over time. Apoptotic cells (Annexin V-positive) will be detected first, followed by late-stage apoptotic/necrotic cells which become positive for both Annexin V and the viability dye.
Protocol: Automated Plaque Counting with plaQuest for Virus-Induced Cytopathy
This protocol describes the use of an automated, open-source algorithm to quantify virus-induced cell death (a form of necrosis) in a plaque assay, highlighting the principles of automated image analysis [71].
Key Reagents & Materials:
- Cell culture plates (e.g., 24-well plate) with confluent monolayers of susceptible cells (e.g., Vero cells).
- Virus stock (e.g., Chikungunya virus, SARS-CoV-2).
- Crystal violet or other staining solutions.
- Flatbed scanner.
- plaQuest software (built using OpenCV library algorithms).
Procedure:
- Plaque Assay Execution: Infect cell monolayers with serially diluted virus stock. Overlay with a semi-solid medium to limit viral spread. Incubate until visible plaques (areas of dead cells) form.
- Staining and Image Acquisition: Fix the cells and stain with crystal violet. Scan the entire plate at a high resolution (e.g., 1200 dpi) using a flatbed scanner.
- Software-Based Plaque Counting:
- Import the scanned image into plaQuest.
- Select the appropriate plate type and analysis mode ("CPE" for cytopathic effect assays).
- The software automatically recognizes well outlines and performs initial plaque detection using a four-step process: gray conversion, binarization, denoising with a Gaussian filter, and clustering via connected component labeling [71].
- Optimize detection parameters ("Threshold" for plaque size, "Overlap" parameters for clustered plaques) based on the initial results.
- Run the "Count in all wells" function to obtain the final plaque counts for the entire plate.
Signaling Pathways and Experimental Workflows
Apoptosis Signaling Pathways
The following diagram illustrates the two main pathways of apoptosis, highlighting key molecular events that are targets for detection methods.
Automated Image Analysis Workflow
This diagram outlines the logical workflow of an automated image analysis algorithm for cell counting or plaque detection, as implemented in platforms like Quantella [11] and plaQuest [71].
The Scientist's Toolkit: Essential Research Reagents and Materials
Table 3: Key Reagent Solutions for Apoptosis Detection
| Reagent / Material | Function in Apoptosis Detection | Example Application |
|---|---|---|
| Recombinant Annexin V (Fluorophore-conjugated) | Binds to phosphatidylserine (PS) exposed on the outer leaflet of the cell membrane during early apoptosis. | Gold-standard marker for detecting early apoptotic cells in flow cytometry and high-content live-cell imaging [69]. |
| Caspase-Sensitive Fluorescent Reporters | Engineered proteins (e.g., GFP) containing a caspase-3 cleavage motif (DEVD). Fluorescence is lost ("switch-off") upon caspase activation. | Enables real-time, kinetic monitoring of apoptosis in live cells without the need for staining or fixation [6]. |
| Cell Impermeant Viability Dyes (e.g., YOYO3, DRAQ7) | Stains nucleic acids in cells that have lost plasma membrane integrity, indicating late-stage apoptosis or necrosis. | Used in conjunction with Annexin V in multiplex assays to distinguish early from late apoptotic events [69]. |
| Automated Image Analysis Software (e.g., plaQuest) | Stand-alone programs that use algorithms for gray conversion, binarization, denoising, and object identification to count cells or plaques. | Provides high-throughput, objective quantification of viral plaques or cytopathic effects, reducing manual labor and subjectivity [71]. |
| Adaptive Image-Processing Pipeline | Integrated software that employs multi-exposure fusion and morphology-independent segmentation for cell analysis. | Core component of platforms like Quantella for accurate cell identification and counting without user-defined parameters or deep learning [11]. |
The accurate detection and quantification of apoptotic cells is a cornerstone of biomedical research, particularly in fields like oncology, neurobiology, and drug discovery. The method chosen for this detection—traditional manual counting or modern automated algorithms—carries significant implications for research outcomes, operational efficiency, and resource allocation. Manual counting, typically performed using a hemocytometer and microscope, relies heavily on technician expertise and subjective judgment. In contrast, automated algorithms leverage sophisticated image analysis and artificial intelligence to identify and classify cells based on predefined parameters. This analysis provides a comprehensive comparison of these approaches within the context of a research environment, evaluating financial costs, technical requirements, personnel training, and overall return on investment to guide researchers and laboratory managers in making evidence-based decisions.
Experimental Protocols for Method Comparison
Protocol for Manual Apoptosis Counting via Fluorescent Microscopy
Principle: This protocol involves staining cells with fluorescent dyes that distinguish viable, apoptotic, and necrotic cell populations based on membrane integrity and phosphatidylserine exposure, followed by visual identification and counting under a microscope [3].
Materials:
- Cell sample (e.g., HeLa cells treated with apoptosis-inducing agent)
- Annexin V-CY3TM Apoptosis Detection Kit (or equivalent) containing Annexin-Cy3.18 (AnnCy3) and 6-Carboxyfluorescein diacetate (6-CFDA) [3]
- Phosphate Buffer Saline (PBS)
- #1.5 cover glass bottom multi-well plate (e.g., Cellvis)
- Fluorescent or confocal microscope with appropriate filter sets: 488 nm excitation/520 nm emission for 6-CF, and 561 nm excitation/570 nm emission for AnnCy3 [3]
Procedure:
- Cell Culture and Treatment: Seed approximately 50,000 cells per well in a 24-well plate and allow to adhere for 24 hours. Treat cells with the apoptotic stimulus according to experimental design [3].
- Staining: Incubate treated and control cell samples with both AnnCy3 and 6-CFDA probes simultaneously for 15 minutes at room temperature, protected from light [3].
- Imaging: Image cells immediately after staining in PBS. Using a 10x objective, acquire multiple images per sample to ensure statistically significant cell numbers (typically 500-1,000 cells per sample) [3].
- Manual Counting and Classification:
- Viable cells: Exhibit only green fluorescence (6-CF).
- Early apoptotic cells: Exhibit both green (6-CF) and red fluorescence (AnnCy3).
- Necrotic cells: Exhibit only red fluorescence (AnnCy3).
- Systematically count cells in each category across multiple fields of view.
Protocol for Automated Apoptosis Analysis Using the ApoNecV Macro
Principle: This automated method uses a custom macro (ApoNecV) for the Fiji image analysis platform to process fluorescent microscopy images, applying background subtraction, deconvolution, and signal quantification to classify cell death types without manual intervention [3].
Materials:
- Cell sample prepared identically to the manual method (steps 1-3 above)
- Fiji software platform with ApoNecV macro installed
- Computer system capable of running image analysis software
Procedure:
- Sample Preparation and Imaging: Prepare, stain, and image cells exactly as described in Steps 1-3 of the manual protocol, ensuring consistent imaging parameters [3].
- Image Processing: Open the stack image (green, red, and transmitted light channels) in Fiji and run the ApoNecV macro.
- Automated Analysis: The macro automatically executes:
- Background subtraction using the Rolling Ball Radius algorithm (50 pixels for 6-CF channel, 30 pixels for AnnCy3 channel).
- Deconvolution using generated Point Spread Functions (PSF) to enhance image resolution.
- Cell identification and classification based on fluorescence intensity thresholds [3].
- Data Output: The macro generates quantitative data on the percentages and absolute counts of viable, apoptotic, and necrotic cells, which can be exported for statistical analysis.
Quantitative Data Comparison
Performance and Efficiency Metrics
Table 1: Comparative Performance of Manual vs. Automated Apoptosis Detection
| Parameter | Manual Counting | Automated Algorithm (ApoNecV) |
|---|---|---|
| Cell Processing Time | 5 minutes per sample (hemocytometer) [34] | 10 seconds per sample (Countess II FL) [34] |
| User Variability | 10-20% variability between technicians [34] | <2% variability between users [34] |
| Throughput Capacity | Limited by technician stamina and focus; typically 10-20 samples per hour | High-throughput; potentially hundreds of samples per hour with automation |
| Accuracy in Cell Classification | Subject to human error and subjective interpretation | Standardized classification based on predefined fluorescence thresholds [3] |
| Sample Volume Required | 10-20 μL for hemocytometer [34] | 10 μL for automated chamber slides [34] |
| Correlation with Gold Standard | Moderate (depends on technician expertise) | Strong correlation with manual counts (R² >0.95 in validation studies) [3] |
Cost Analysis and Resource Requirements
Table 2: Cost-Benefit Analysis of Manual vs. Automated Apoptosis Detection
| Cost Factor | Manual Counting | Automated Algorithm |
|---|---|---|
| Initial Equipment Investment | ~$5,000 (basic microscope) | ~$15,000-$50,000 (automated cell counter or imaging system) [34] |
| Consumables Cost Per Test | ~$2-5 (hemocytometer, slides, stains) | ~$3-7 (specialized chamber slides, reagents) [34] |
| Personnel Time Cost Per Sample | ~$4-8 (based on 5 minutes/sample, $50-100/hour technician rate) | ~$0.15-0.30 (based on 10 seconds/sample) |
| Training Requirements | Extensive (weeks to months for proficiency) | Moderate (days to one week for software operation) |
| Annual Maintenance Costs | ~$500-1,000 (microscope maintenance) | ~$2,000-5,000 (service contracts, software licenses) |
| Space Requirements | 10-15 sq. ft. (microscope station) | 10-20 sq. ft. (instrument + computer station) |
| Typical Return on Investment Period | Immediate (but with ongoing high personnel costs) | 12-24 months (based on personnel time savings) |
The Scientist's Toolkit: Essential Research Reagents and Materials
Table 3: Key Reagent Solutions for Apoptosis Detection
| Reagent/Material | Function in Apoptosis Detection | Example Product |
|---|---|---|
| Annexin V-CY3 Conjugate | Binds to phosphatidylserine externalized on the outer leaflet of the plasma membrane in apoptotic cells [3] | Annexin V-CY3TM Apoptosis Detection Kit (Sigma-Aldrich APOAC) [3] |
| 6-Carboxyfluorescein diacetate (6-CFDA) | Cell-permeant viability marker; converted to green fluorescent 6-CF by intracellular esterases in living cells [3] | Included in Annexin V-CY3TM Apoptosis Detection Kit [3] |
| Propidium Iodide | DNA stain that enters cells with compromised membrane integrity (necrotic/late apoptotic cells) | Various suppliers (e.g., Thermo Fisher Scientific) |
| Caspase Activity Assays | Measure activation of caspase enzymes, key mediators of apoptosis | Caspase-Glo Assays (Promega Corporation) |
| Trypan Blue Stain | Distinguishes live from dead cells for basic viability counting [34] | Invitrogen Trypan Blue Stain (Thermo Fisher T10282) [34] |
| LIVE/DEAD Fixable Stains | Amine-reactive dyes for accurate dead cell discrimination in flow cytometry and imaging [34] | LIVE/DEAD Fixable Dead Cell Stain Kit (Thermo Fisher L34969) [34] |
| Countess Chamber Slides | Specialized slides for automated cell counting instruments [34] | Countess Cell Counting Chamber Slides (Thermo Fisher C10228) [34] |
Workflow Visualization and Signaling Pathways
Apoptosis Detection Workflow Comparison
Apoptosis Detection Workflow Comparison: This diagram illustrates the sequential steps in both manual and automated apoptosis detection workflows, highlighting the increased automation and reduced human intervention in the algorithmic approach.
Apoptosis Signaling Pathway and Detection Basis
Apoptosis Signaling and Detection Basis: This diagram shows the key biochemical events in apoptosis and how they correspond to common detection methods, highlighting the scientific basis for the reagents and approaches discussed in this analysis.
The choice between manual counting and automated algorithms for apoptosis detection involves careful consideration of research goals, operational scale, and available resources. Manual methods, while lower in initial equipment costs, incur substantial long-term expenses in personnel time and exhibit significant inter-operator variability that can compromise data reproducibility [34]. Automated systems require higher upfront investment but offer superior consistency, dramatically increased throughput, and long-term cost savings in high-volume settings [3] [34].
For laboratories with lower sample volumes or limited budgets, manual counting remains a viable option, particularly if staff expertise is well-established. However, for core facilities, pharmaceutical development, and research programs requiring high-throughput screening or exceptional reproducibility, automated algorithms present a compelling value proposition. The integration of artificial intelligence and machine learning into these platforms continues to enhance their accuracy and application range, suggesting an increasingly favorable cost-benefit ratio for automated apoptosis detection in the future [12] [72].
Conclusion
The evolution from manual counting to automated algorithms represents a paradigm shift in apoptosis detection, offering unparalleled gains in throughput, objectivity, and single-cell resolution. While traditional methods provide a foundational understanding, automated systems based on machine learning, reporter cells, and high-content imaging are indispensable for the scale and precision required in modern drug discovery and personalized medicine. Future directions will focus on enhancing algorithm interpretability, developing more robust multiplexed assays, and integrating real-time apoptosis monitoring into dynamic disease models. The judicious selection and validation of detection methodologies will continue to be critical for accurately evaluating apoptotic indices, predicting therapeutic outcomes, and advancing our fundamental understanding of cell death in complex biological systems.
References
- 1. Apoptosis detection via automated algorithms to analyze ... [https://pmc.ncbi.nlm.nih.gov/articles/PMC7703573/]
- 2. Apoptosis detection via automated algorithms to analyze ... [https://pubmed.ncbi.nlm.nih.gov/31956989/]
- 3. ApoNecV: A macro for cell death type differentiation - PMC [https://pmc.ncbi.nlm.nih.gov/articles/PMC11891952/]
- 4. Evaluating cell viability assessment techniques [https://pmc.ncbi.nlm.nih.gov/articles/PMC12492793/]
- 5. Advanced concept for identifying chemico-biological ... [https://www.sciencedirect.com/science/article/abs/pii/S0010482525015392]
- 6. "Reading cell death with light: Real-time visualization of ... [https://www.eurekalert.org/news-releases/1096590]
- 7. How will Apoptosis Assays Market Growth Accelerate ... [https://www.linkedin.com/pulse/how-apoptosis-assays-market-growth-accelerate-between-dpztf/]
- 8. Morphologic and biochemical hallmarks of apoptosis [https://pubmed.ncbi.nlm.nih.gov/10728374/]
- 9. Apoptotic bodies in phytoplankton suggest evolutionary ... [https://pmc.ncbi.nlm.nih.gov/articles/PMC12462507/]
- 10. Apoptosis Assay Market Size Report, 2025 – 2034 [https://www.gminsights.com/industry-analysis/apoptosis-assay-market]
- 11. Automated smartphone based cell analysis platform - PMC [https://pmc.ncbi.nlm.nih.gov/articles/PMC12546929/]
- 12. A fully automated quantitative analysis method based on ... [https://www.sciencedirect.com/science/article/pii/S2950261625000342]
- 13. Apoptosis detection: a purpose-dependent approach ... [https://pmc.ncbi.nlm.nih.gov/articles/PMC8208110/]
- 14. A new way of measuring apoptosis by absolute quantitation of ... [https://pmc.ncbi.nlm.nih.gov/articles/PMC3424536/]
- 15. North America Apoptosis Assay Market Trends 2025–2034 [https://www.gminsights.com/industry-analysis/north-america-apoptosis-assay-market]
- 16. Comparison of Cell Counting Using Countess II Automated ... [https://www.thermofisher.com/us/en/home/life-science/cell-analysis/cell-analysis-learning-center/cell-analysis-resource-library/cell-analysis-application-notes/comparison-cell-counting-countess-ii-automated-cell-counters-hemocytometers.html]
- 17. Identifying and Quantifying Apoptosis: Navigating ... [https://www.nature.com/articles/3880776]
- 18. Apoptosis assay using AI-driven fully automated ECLIPSE Ji [https://www.microscope.healthcare.nikon.com/resources/application-notes/apoptosis-assay-using-ai-driven-fully-automated-eclipse-ji]
- 19. Expanding Horizons in Advancements of FRET Biosensing ... [https://pmc.ncbi.nlm.nih.gov/articles/PMC12293601/]
- 20. Flow cytometry based-FRET: basics, novel developments ... [https://link.springer.com/article/10.1007/s00018-022-04232-2]
- 21. Integrated real-time imaging of executioner caspase dynamics ... [https://pmc.ncbi.nlm.nih.gov/articles/PMC12328661/]
- 22. Live imaging of apoptotic signaling flow using tunable ... [https://www.nature.com/articles/s41598-022-25286-z]
- 23. Coupling live-cell imaging and in situ isolation of the same ... [https://www.sciencedirect.com/science/article/pii/S2666166722004804]
- 24. Exploring the landscape of FRET-based molecular sensors [https://www.sciencedirect.com/science/article/abs/pii/S0734975024001605]
- 25. Live Cell Imaging Market Growth, Drivers, and Opportunities [https://www.marketsandmarkets.com/Market-Reports/live-cell-imaging-market-163914483.html]
- 26. Live Cell Imaging Market Report 2025, with Competitor ... [https://finance.yahoo.com/news/live-cell-imaging-market-report-095700674.html]
- 27. High Content Screening Market Size & Outlook 2025 to 2035 [https://www.futuremarketinsights.com/reports/high-content-screening-market]
- 28. Imaging flow cytometry: from high - resolution ... [https://www.frontiersin.org/journals/bioengineering-and-biotechnology/articles/10.3389/fbioe.2025.1580749/full]
- 29. Measurement of apoptosis by SCAN©, a system for counting ... [https://pmc.ncbi.nlm.nih.gov/articles/PMC5349136/]
- 30. Machine Learning Methods in Clinical Flow Cytometry - PMC [https://pmc.ncbi.nlm.nih.gov/articles/PMC11816335/]
- 31. Comparing Flow Cytometry with Imaging Cytometry [https://www.labx.com/resources/comparing-flow-cytometry-with-imaging-cytometry/5523]
- 32. Automated vs. Manual Cell Counting - The Complete Guide [https://chemometec.com/manual-vs-automated-cell-counting/]
- 33. A machine learning framework for cross-institute ... [https://www.sciencedirect.com/science/article/pii/S0010482525007450]
- 34. The Importance Of Accurate Cell Counting In Flow ... [https://www.thermofisher.com/us/en/home/life-science/cell-analysis/cell-analysis-learning-center/cell-analysis-resource-library/cell-analysis-application-notes/importance-accurate-cell-counting-flow-cytometry-cell-sorting.html]
- 35. Top Imaging Flow Cytometry Companies & How to ... [https://www.linkedin.com/pulse/top-imaging-flow-cytometry-companies-how-compare-qjosc/]
- 36. Comparison Between Manual and Automated Methods of ... [https://pmc.ncbi.nlm.nih.gov/articles/PMC8804130/]
- 37. Challenges and Future Trends in Biomarker Analysis for ... [https://blog.crownbio.com/challenges-and-future-trends-in-biomarker-analysis-for-clinical-research-whats-ahead-in-2025]
- 38. What Are Biomarkers? Definition, Applications and ... [https://blog.omni-inc.com/blog/what-are-biomarkers-and-whats-new-in-2025]
- 39. High Throughput Screening Market Forecast, 2025-2032 [https://www.coherentmarketinsights.com/industry-reports/high-throughput-screening-market]
- 40. U.S. Apoptosis Assay Market Size, Share & Forecast, 2025- ... [https://www.gminsights.com/industry-analysis/us-apoptosis-assay-market]
- 41. Inside ELRIG's Drug Discovery 2025 [https://www.drugtargetreview.com/article/190237/inside-elrigs-drug-discovery-2025/]
- 42. A semi‐automated ASC speck assay to evaluate pyrin ... [https://pmc.ncbi.nlm.nih.gov/articles/PMC12549213/]
- 43. Automated smartphone based cell analysis platform [https://www.nature.com/articles/s44303-025-00093-z]
- 44. Genes Associated with Apoptosis in an Experimental Breast ... [https://pmc.ncbi.nlm.nih.gov/articles/PMC12524443/]
- 45. Advances in high-throughput drug screening based on ... [https://www.sciencedirect.com/science/article/pii/S2090123225006897]
- 46. Integrating Generative AI with High-Throughput Screening ... [https://papers.ssrn.com/sol3/papers.cfm?abstract_id=5317101]
- 47. of Detection : A review of conventional and novel... apoptosis [https://pubs.rsc.org/en/content/articlehtml/2010/ay/c0ay00247j]
- 48. The Importance Of Accurate Cell Counting In Flow Cytometry And Cell... [https://www.thermofisher.com/de/de/home/life-science/cell-analysis/cell-analysis-learning-center/cell-analysis-resource-library/cell-analysis-application-notes/importance-accurate-cell-counting-flow-cytometry-cell-sorting.html]
- 49. . Manual Cell vs Automated Counters [https://www.denovix.com/manual-vs-automated-cell-counters/]
- 50. Validation of a deep learning–based AI system for HER2 ... [https://pmc.ncbi.nlm.nih.gov/articles/PMC12392118/]
- 51. Transformer-based spatial–temporal detection of apoptotic ... [https://pmc.ncbi.nlm.nih.gov/articles/PMC10948145/]
- 52. A semi-automated technique for labeling and counting of ... [https://bmcbioinformatics.biomedcentral.com/articles/10.1186/1471-2105-15-169]
- 53. A Semi-Automated Technique for Labeling and Counting of ... [https://pubmed.ncbi.nlm.nih.gov/24902592/]
- 54. Transformer-based spatial-temporal detection of apoptotic ... [https://elifesciences.org/reviewed-preprints/90502]
- 55. DNA storage: The future direction for medical cold data storage [https://pmc.ncbi.nlm.nih.gov/articles/PMC11999466/]
- 56. High Performance Computing (HPC) Storage [https://www.datainsightsmarket.com/reports/high-performance-computing-hpc-storage-1665243]
- 57. Cloud vs On-Premise in Healthcare IT: What's Best for 2025? [https://healthcluster.co/cloud-vs-on-premise-in-healthcare-it-whats-best-for-2025/]
- 58. Apoptosis Detection with Immunostep: Advanced Tools for ... [https://immunostep.com/2025/02/28/apoptosis-detection-with-immunostep-advanced-tools-for-cellular-research/]
- 59. Spatial Multiplexing and Omics - PMC - PubMed Central - NIH [https://pmc.ncbi.nlm.nih.gov/articles/PMC12382484/]
- 60. Flow Cytometry Market Size, Share & Report, 2033 [https://www.marketdataforecast.com/market-reports/global-flow-cytometry-market]
- 61. The Multiplexing Power of 10x Genomics Single Cell Assays [https://diagnostech.co.za/the-multiplexing-power-of-10x-genomics-single-cell-assays/]
- 62. Flow Cytometry Market Hits US$10.3B by 2032 [https://www.globenewswire.com/news-release/2025/06/13/3098996/0/en/Flow-Cytometry-Market-Hits-US-10-3B-by-2032-Why-Every-Lab-Needs-a-FACS-Flow-Cytometer.html]
- 63. Automated detection of apoptotic bodies and cells in label-free ... [https://pmc.ncbi.nlm.nih.gov/articles/PMC10563152/]
- 64. Apoptosis detection via automated algorithms to analyze ... [https://mdanderson.elsevierpure.com/en/publications/apoptosis-detection-via-automated-algorithms-to-analyze-biomarker/]
- 65. Integrated real-time imaging of executioner caspase ... [https://www.nature.com/articles/s41420-025-02662-y]
- 66. High-throughput screening system for immunogenic cell ... [https://www.sciencedirect.com/science/article/pii/S0010482525010789?dgcid=rss_sd_all]
- 67. Characterization of a novel high-throughput, high-speed ... [https://www.insights.bio/cell-and-gene-therapy-insights/journal/article/2056/characterization-of-a-novel-highthroughput-highspeed-and-highprecision-platebased-image-cytometric-cell-counting-method]
- 68. Challenges of Cell Counting in Cell Therapy Products - PMC [https://pmc.ncbi.nlm.nih.gov/articles/PMC11520012/]
- 69. Robust high-throughput kinetic analysis of apoptosis with real-time... [https://www.nature.com/articles/cddis2016332?error=cookies_not_supported&code=f4ac6976-301e-48e4-8b71-e10fed959846]
- 70. Chapter 24 Difficulties and pitfalls in analysis of apoptosis [https://www.sciencedirect.com/science/article/pii/S0091679X01630280]
- 71. Development of an automated plaque-counting program ... [https://www.nature.com/articles/s41598-025-97590-3]
- 72. Validation of an intelligent automated workflow for accurate ... [https://www.sciencedirect.com/science/article/pii/S0009898125003936]