BCL2A1, S100A8, and S100A9 Expression in MODS: Unraveling Apoptosis and Inflammation Biomarkers for Therapeutic Insights
This article provides a comprehensive analysis of BCL2A1, S100A8, and S100A9 expression in Multiple Organ Dysfunction Syndrome (MODS) compared to controls, targeting researchers and drug development professionals.
BCL2A1, S100A8, and S100A9 Expression in MODS: Unraveling Apoptosis and Inflammation Biomarkers for Therapeutic Insights
Abstract
This article provides a comprehensive analysis of BCL2A1, S100A8, and S100A9 expression in Multiple Organ Dysfunction Syndrome (MODS) compared to controls, targeting researchers and drug development professionals. It explores the foundational roles of these genes in apoptosis and inflammation, outlines robust methodological approaches for expression profiling, addresses common troubleshooting challenges, and validates findings through comparative analyses to ensure clinical relevance and reliability in biomarker discovery.
Foundational Insights: BCL2A1, S100A8, and S100A9 in MODS Pathophysiology and Mechanisms
Multiple Organ Dysfunction Syndrome (MODS) is a life-threatening clinical condition characterized by the progressive and potentially reversible physiological dysfunction of two or more organ systems following an acute insult such as sepsis, trauma, or other critical illnesses [1]. This syndrome represents a significant challenge in intensive care settings worldwide, with mortality rates escalating with the number of organs affected, ranging from approximately 30% with two failing organs to 50-70% when three to four organs are impaired [2] [3].
Clinical Context and Pathophysiology
MODS exists on a clinical continuum with incremental degrees of organ dysfunction rather than representing a single event [1]. It can be categorized as primary MODS, which results directly from a well-defined insult where organ dysfunction occurs early, or secondary MODS, which develops as a consequence of a maladaptive host response and is identified within the context of systemic inflammation [1].
The pathogenesis of MODS involves a complex interplay of inflammatory mediators. Following an initial insult, there is often a release of pro-inflammatory cytokines including tumor necrosis factor-α (TNF-α), interleukins (IL-1, IL-6, IL-8), and other mediators that create a state of "immunologic dissonance" [1]. This leads to widespread endothelial damage, microvascular thrombosis, and impaired tissue oxygenation. The syndrome affects multiple organ systems:
- Circulatory system: Characterized by significant derangements in autoregulation, vasodilation, increased microvascular permeability, and reversible myocardial depression [1]
- Pulmonary system: Endothelial injury leads to disturbed capillary blood flow and enhanced permeability, resulting in acute respiratory distress syndrome (ARDS) [1]
- Gastrointestinal system: Barrier function may be compromised, allowing bacterial translocation that can propagate systemic inflammation [1]
Global Burden and Epidemiology
MODS represents a substantial global health burden, particularly in intensive care units. A 2022 study conducted in Iranian ICUs found a MODS prevalence of 56.2% among critically ill patients, with an average MODS score of 6.87 ± 1.59 [3]. The study identified several clinical variables significantly associated with MODS, including duration of hospitalization and ICU stay, number of involved organs, Glasgow Coma Scale scores, and various severity scoring systems [3].
Sepsis remains a primary catalyst for MODS development. Globally, sepsis affects approximately 48.9 million people annually, with about 11 million deaths attributed to this condition [4]. The burden intensifies in ICU settings, where sepsis prevalence reaches approximately 31% with associated mortality rates ranging from 30% to 46%, depending on geographic region and available resources [4]. Among patients with trauma-induced sepsis, approximately 26.95% develop MODS, with 28-day mortality rates significantly higher in MODS patients (23.82%) compared to non-MODS patients (11.21%) [5].
Key Biomarkers in MODS Pathogenesis
Recent research has identified several key biomarkers implicated in MODS pathogenesis, particularly those related to apoptotic pathways:
S100A8/S100A9 and BCL2A1 in MODS
Emerging evidence highlights the significance of three key genes in MODS pathophysiology: S100A8, S100A9, and BCL2A1 [2].
S100A8 and S100A9 are calcium-binding proteins that form a stable heterodimer (calprotectin) constitutively expressed in neutrophils and monocytes [6] [7]. These proteins function as damage-associated molecular patterns (DAMPs) that amplify inflammatory responses through interaction with pattern recognition receptors like Toll-like receptor 4 (TLR4) and the receptor for advanced glycation end products (RAGE) [6] [7]. During inflammation, S100A8/A9 is actively released and modulates inflammatory responses by stimulating leukocyte recruitment and inducing cytokine secretion [6].
BCL2A1 is a member of the BCL-2 protein family that regulates apoptotic processes. As an anti-apoptotic protein, BCL2A1 promotes cell survival by inhibiting pro-apoptotic signals [2].
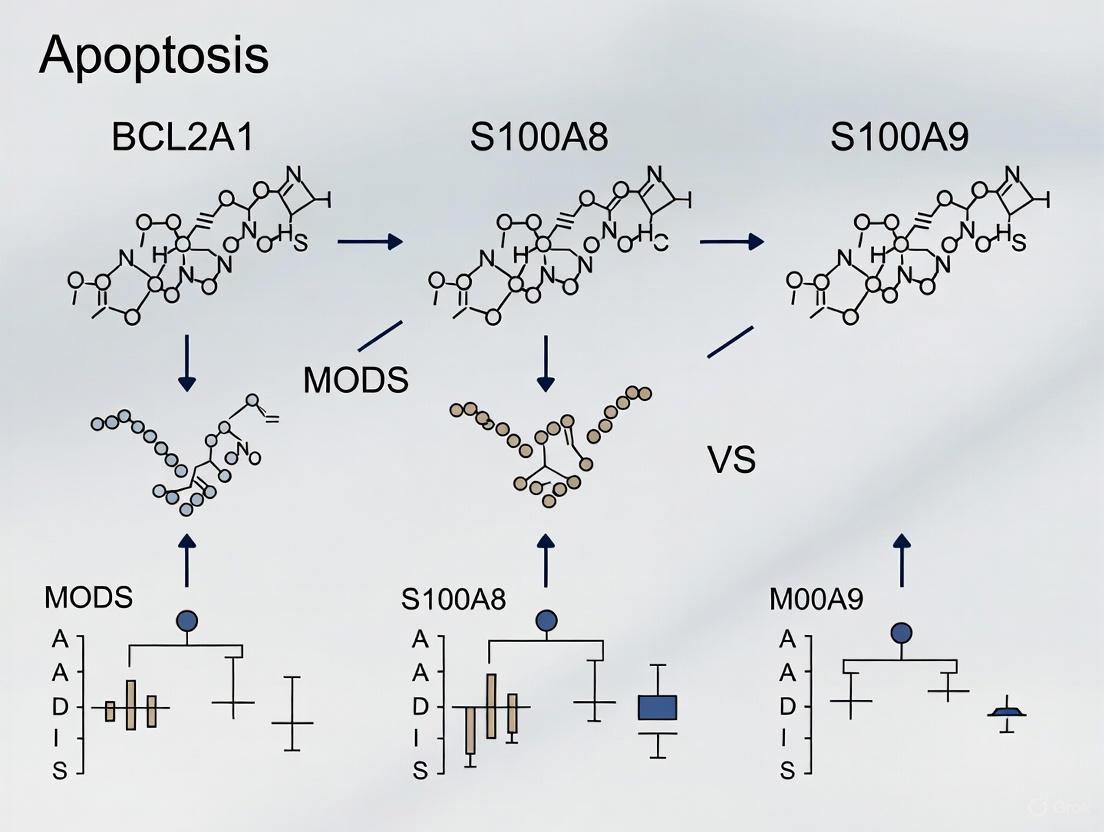
All three genes demonstrate significantly elevated expression in MODS patients compared to controls and collectively participate in the "oxidative phosphorylation" signaling pathway [2]. Their coordinated overexpression suggests a potentially critical role in the dysregulated immune response and organ dysfunction characteristic of MODS.
MODS Scoring and Assessment
Several scoring systems have been developed to quantify organ dysfunction and predict outcomes in MODS patients:
Table 1: MODS Scoring Systems and Clinical Utility
| Scoring System | Components Assessed | Score Range | Clinical Utility |
|---|---|---|---|
| Multiple Organ Dysfunction Score (MODS) [3] | Six key components (respiratory, renal, hepatic, cardiovascular, hematological, neurological) | 0-24 (higher scores indicate greater dysfunction) | Predicts ICU mortality risk; assesses degree of multi-organ dysfunction |
| Sequential Organ Failure Assessment (SOFA) [1] | Six organ systems (coagulation, pulmonary, cardiovascular, liver, central nervous, renal) | 0-4 per organ system (higher scores indicate worse function) | Tracks organ dysfunction/failure over time; ≥2 points indicates organ dysfunction |
| Acute Physiology and Chronic Health Evaluation (APACHE) II [3] | 12 physiological variables, age, chronic health | 0-71 (higher scores indicate greater severity) | Estimates mortality risk in critically ill patients |
These scoring systems enable clinicians to stratify patients by risk, monitor disease progression, and evaluate response to interventions. The MODS score specifically calculates mortality risk based on the degree of multi-organ dysfunction, with higher scores correlating with increased mortality risk [3].
Experimental Models and Methodologies
Predictive Model Development for MODS
Recent research has employed advanced statistical and machine learning approaches to develop predictive models for MODS. A 2025 retrospective cohort study utilizing the Medical Information Mart for Intensive Care-IV (MIMIC-IV) database developed several predictive models for MODS in trauma-induced sepsis patients [5]. The methodology included:
- Patient Selection: Identification of trauma patients with sepsis within the first day of ICU admission, excluding those with prior ICU admissions, stays <1 day, or meeting MODS criteria on ICU day 1 [5]
- Feature Selection: Application of the Boruta algorithm (an all-relevant feature selection method based on random forests) to identify key predictors from 42 candidate variables [5]
- Model Development: Construction of a nomogram using logistic regression and implementation of various machine learning models including K-nearest neighbor, support vector classifier, random forest, extreme gradient boosting, and multilayer perceptron [5]
- Model Validation: Temporal validation using data from 2017-2019, with performance evaluation based on discrimination, calibration, and decision curve analysis [5]
This study identified several key predictors of MODS, including Simplified Acute Physiology Score II (SAPS II) scores, use of mechanical ventilation, and vasopressor administration [5]. In validation, all models significantly outperformed traditional scoring systems, with the random forest model demonstrating the highest performance (AUC: 0.769, 95% CI: 0.712-0.826) [5].
Biomarker Identification Workflow
The identification and validation of key apoptosis-related genes in MODS followed a comprehensive bioinformatics approach [2]:
Biomarker Identification Workflow
Research Reagent Solutions
Table 2: Essential Research Reagents for MODS Biomarker Studies
| Reagent/Category | Specific Examples | Research Application |
|---|---|---|
| Gene Expression Datasets | GEO Datasets: GSE66099, GSE26440, GSE144406 [2] | Training and validation sets for biomarker discovery and model development |
| Apoptosis-Related Gene Panels | 802 non-duplicate ARGs including S100A9, S100A8, BCL2A1 [2] | Candidate gene selection for focused analysis of apoptotic mechanisms in MODS |
| Bioinformatics Tools | Weighted Gene Co-expression Network Analysis (WGCNA), Cytoscape software [2] | Identification of gene modules most correlated with MODS and network visualization |
| Machine Learning Algorithms | Multiple algorithms combined with expression verification [2] | Screening and validation of key genes with predictive value for MODS |
| Clinical Validation Assays | Expression verification in clinical samples [2] | Confirmation of key gene expression differences between MODS patients and controls |
Signaling Pathways in MODS Pathogenesis
The pathophysiology of MODS involves complex interactions between inflammatory and apoptotic pathways:
MODS Signaling Pathways
Multiple Organ Dysfunction Syndrome continues to represent a significant challenge in critical care medicine, with substantial global burden and devastating clinical consequences. The emergence of biomarkers such as S100A8, S100A9, and BCL2A1 provides promising avenues for improved early detection, risk stratification, and targeted therapeutic interventions. Ongoing research integrating multi-omics approaches, machine learning algorithms, and well-validated clinical prediction models holds promise for advancing our understanding and management of this complex syndrome. As our knowledge of MODS pathophysiology deepens, particularly regarding the interplay between inflammatory and apoptotic pathways, opportunities for developing more effective, personalized treatment strategies continue to expand.
The B-cell lymphoma 2 (BCL2) protein family constitutes a critical checkpoint in the intrinsic apoptotic pathway, regulating mitochondrial outer membrane permeabilization (MOMP) and the subsequent release of cytochrome c [8] [9]. This family is divided into pro-apoptotic and anti-apoptotic members, which interact to determine cellular survival. BCL2A1 (also known as Bfl-1 or BCL2-related gene expressed in fetal liver) is an anti-apoptotic member of this family, first identified as an early-response gene induced by granulocyte-macrophage colony-stimulating factor (GM-CSF) and lipopolysaccharide (LPS) [8]. While all anti-apoptotic proteins (including BCL2, BCL-XL, MCL1, BCL-w, and BCL-B) share four BCL2 homology (BH) domains and function to sequester pro-apoptotic proteins, BCL2A1 remains one of the less extensively studied members of the family [8] [10]. Its expression is highly regulated by nuclear factor κB (NF-κB), and it exerts important pro-survival functions, particularly in the hematopoietic system [8]. This overview details the structure, function, and regulation of BCL2A1, with a specific focus on its emerging role in critical illness, particularly multiple organ dysfunction syndrome (MODS), and its interplay with inflammatory proteins S100A8 and S100A9.
BCL2A1 Gene Structure, Protein Domains, and Interaction Partners
Genomic Organization and Structural Features
The human BCL2A1 gene is located on chromosome 15q24.3 and contains three exons [8]. The most common transcript utilizes exons 1 and 3, producing a 175-amino acid protein. A notable structural characteristic of BCL2A1 is its lack of a well-defined C-terminal transmembrane domain, which is present in other anti-apoptotic BCL2 family members and typically aids in anchoring to the outer mitochondrial membrane [8] [10]. Despite this, BCL2A1 is found localized at the mitochondria in healthy cells, and its C-terminus is crucial for both its anti-apoptotic function and subcellular localization [8] [9]. The protein consists of nine α-helices and displays the characteristic hydrophobic groove, formed by the BH1, BH2, and BH3 domains, that is common to all anti-apoptotic BCL2 proteins and serves as the main site for interactions with pro-apoptotic partners [8].
An alternative splice variant, Bfl-1S, incorporates all three exons. A premature stop codon in exon 3 results in a 163-amino acid protein with a distinct C-terminus that directs it to the nucleus, though the physiological role of this nuclear-localized isoform remains poorly understood [8].
Protein Interaction Network
The primary anti-apoptotic mechanism of BCL2A1, like its relatives, involves the sequestration of pro-apoptotic BCL2 family proteins, thereby preventing them from initiating MOMP [8]. However, its binding profile has been a subject of conflicting reports, potentially due to differences in experimental systems.
- Interaction with Multi-Domain Pro-apoptotic Proteins: Evidence regarding BCL2A1's binding to the effector proteins BAK and BAX is mixed. Some studies in mammalian cells indicate a more prominent interaction with BAK than with BAX, while others have found weak or no binding under different experimental conditions [8].
- Interaction with BH3-only Pro-apoptotic Proteins: BCL2A1 demonstrates a clear interaction with specific BH3-only proteins. BH3 profiling and fluorescence polarization assays indicate that BCL2A1 binds to BIM, BID, and PUMA with high affinity, and to a weaker extent with BIK, HRK, and NOXA [8]. This binding profile groups BCL2A1 functionally with MCL1, whereas BCL2, BCL-XL, and BCL-w form a separate group that binds BAD but not NOXA [8].
- Non-Canonical Interaction Partners: BCL2A1 also interacts with the BH3-like protein Beclin-1, suggesting a potential role in the inhibition of autophagy [8]. Furthermore, a functional interaction with the prenylated Rab acceptor RABAC1 has been identified. This interaction inhibits BCL2A1's anti-apoptotic function and promotes apoptosis, presenting a potential regulatory mechanism [10].
Table 1: Key Protein Interaction Partners of BCL2A1
| Interaction Partner | Type | Nature of Interaction | Functional Outcome |
|---|---|---|---|
| BIM, BID, PUMA | BH3-only protein | High-affinity binding [8] | Sequesters activators/sensitizers, inhibits apoptosis |
| BAK | Multi-domain pro-apoptotic | Binds in cellular systems [8] | Inhibits pore formation in mitochondrial membrane |
| NOXA, BIK, HRK | BH3-only protein | Weaker affinity binding [8] | Sequesters sensitizers, inhibits apoptosis |
| Beclin-1 | BH3-like protein | Binds (overexpressed proteins) [8] | Potential inhibition of autophagy |
| RABAC1 | Prenylated Rab acceptor | Binds and inhibits [10] | Suppresses BCL2A1 function, induces apoptosis |
The following diagram illustrates the central role of BCL2A1 in regulating the mitochondrial apoptotic pathway through its interactions with key pro-apoptotic proteins.
Diagram 1: BCL2A1 in the Intrinsic Apoptotic Pathway. BCL2A1, induced by survival signals like NF-κB, inhibits apoptosis by binding and sequestering pro-apoptotic BH3-only proteins (e.g., BIM, BID, PUMA) and directly inhibiting the activation of BAK/BAX effectors, thereby preventing MOMP.
Regulatory Mechanisms Controlling BCL2A1 Expression
Transcriptional Regulation
BCL2A1 is a highly inducible gene, and its transcription is tightly controlled. A major regulator is the NF-κB signaling pathway [8]. BCL2A1 was identified as a direct NF-κB target gene, which explains its rapid induction in response to a variety of stimuli, including tumor necrosis factor-α (TNF-α), antigen receptor stimulation, and LPS [8] [11]. Constitutively active NF-κB signaling, as found in certain lymphomas, contributes to the high and heterogeneous expression of BCL2A1, which is associated with resistance to therapy [11].
Recent studies have uncovered other transcriptional regulators. In acute myeloid leukemia (AML), the transcription factor FOXM1 has been shown to drive BCL2A1 expression. A FOXM1-BCL2A1 axis was identified as a key determinant of resistance to the BCL2 inhibitor venetoclax, where FOXM1 overexpression led to increased BCL2A1 levels and reduced drug sensitivity [12].
Epigenetic and Post-Transcriptional Regulation
Epigenetic mechanisms also play a significant role in regulating BCL2A1. Inhibition of Bromodomain and Extra-Terminal (BET) proteins, which are epigenetic "readers," leads to a marked downregulation of BCL2A1 expression in Diffuse Large B-cell Lymphoma (DLBCL) cell lines [11]. BET inhibitors disrupt the recruitment of transcriptional complexes to the BCL2A1 promoter, thereby reducing its transcription. This effect coincides with the downregulation of the c-MYC oncogene and attenuation of constitutively active NF-κB and STAT signaling pathways [11].
The protein stability of BCL2A1 is regulated by the ubiquitin-proteasome system, though the specific E3 ligase responsible for its degradation remains an open question [8].
The Role of BCL2A1 in MODS and Critical Illness
BCL2A1 as a Key Apoptosis-Related Gene in MODS
Multiple organ dysfunction syndrome (MODS) is a severe, life-threatening condition often triggered by sepsis, trauma, or other acute insults, with apoptosis being a central mechanism in its pathogenesis [2]. A comprehensive bioinformatics study aimed at identifying key apoptosis-related genes (ARGs) in MODS revealed BCL2A1 as one of three central hub genes (alongside S100A8 and S100A9) [2] [13]. The study analyzed datasets from whole blood samples of MODS patients (primarily with septic shock and sepsis) and healthy controls, integrating differential expression analysis with machine learning algorithms.
Table 2: Expression of Key Apoptosis-Related Genes in MODS vs. Controls
| Gene Symbol | Gene Name | Expression in MODS | Proposed Function in MODS Pathogenesis |
|---|---|---|---|
| BCL2A1 | BCL2-related protein A1 | Significantly High [2] | Inhibits apoptosis of immune cells, potentially contributing to prolonged inflammation and organ damage. |
| S100A8 | S100 Calcium Binding Protein A8 | Significantly High [2] | Forms calprotectin; suppresses neutrophil apoptosis, amplifying inflammation. |
| S100A9 | S100 Calcium Binding Protein A9 | Significantly High [2] | Forms calprotectin; suppresses neutrophil apoptosis, amplifying inflammation. |
All three key genes were found to be significantly highly expressed in MODS patients compared to controls. A nomogram model constructed based on these genes demonstrated excellent predictive ability for MODS, highlighting their potential diagnostic utility [2]. Furthermore, gene set enrichment analysis indicated that these genes are jointly involved in the "oxidative phosphorylation" signaling pathway, suggesting a metabolic component to their role in MODS [2].
The Interplay between BCL2A1, S100A8/A9, and Inflammation
S100A8 and S100A9, which are DAMPs (Damage-Associated Molecular Patterns) released predominantly by neutrophils and monocytes, play a crucial role in suppressing neutrophil apoptosis in inflammatory conditions like asthma [14]. They act through Toll-like receptor 4 (TLR4) to trigger a signaling cascade involving PI3K/AKT, MAPK, and NF-κB pathways in bronchial epithelial cells, leading to the release of survival cytokines such as IL-6, IL-8, and MCP-1 [14]. This cytokine milieu subsequently suppresses apoptosis in neutrophils by inhibiting caspase-9 and caspase-3 activation, blocking BAX expression, and preventing the degradation of anti-apoptotic proteins like MCL-1 and BCL-2 [14].
The connection to BCL2A1 lies in their shared function as potent anti-apoptotic regulators in leukocytes. While S100A8/A9 act extracellularly and via cytokine release to prolong neutrophil survival, BCL2A1 functions intracellularly to directly block the mitochondrial apoptosis pathway. Their co-expression in MODS suggests a synergistic, multi-layered mechanism that inhibits apoptosis in immune cells. This impaired apoptosis can be a double-edged sword: it may be beneficial initially by enhancing the immune response, but when sustained, it leads to the prolonged survival of activated immune cells, contributing to excessive inflammation, failure to resolve the immune response, and subsequent organ injury in MODS [2].
The following diagram outlines this proposed synergistic pathway in critical illness.
Diagram 2: Proposed Synergistic Pathway in MODS. Critical illness triggers release of S100A8/A9, which promote neutrophil survival via TLR4-driven cytokine release and direct intracellular inhibition of apoptosis. Concurrent NF-κB activation upregulates BCL2A1, further inhibiting apoptosis. This synergy may contribute to unresolved inflammation and organ damage in MODS.
BCL2A1 as a Therapeutic Target and Research Protocols
BCL2A1 in Cancer and Resistance to Therapy
Beyond critical illness, BCL2A1 is overexpressed in a variety of cancers, including hematological malignancies (e.g., leukemia, lymphoma) and solid tumors (e.g., glioma, breast cancer) [8] [12] [15]. In these contexts, it contributes to tumor cell survival and resistance to chemotherapy and targeted therapies.
A prominent example is its role in conferring resistance to venetoclax, a selective BCL2 inhibitor used in AML. AML cells with high levels of FOXM1 and BCL2A1 are resistant to venetoclax, and knockdown of either protein sensitizes the cells to apoptosis [12]. Similarly, in DLBCL, high BCL2A1 expression is associated with resistance to venetoclax and standard chemotherapies [11]. In glioma, high BCL2A1 expression is associated with advanced tumor grade, resistance to temozolomide chemotherapy, and an unfavorable prognosis [15].
Experimental Models for Targeting BCL2A1
Indirect Targeting via BET Inhibition
- Objective: To investigate whether inhibition of BET proteins reduces BCL2A1 expression and induces cell death in lymphoma.
- Protocol: DLBCL cell lines (e.g., SUDHL2, TMD8) are treated with BET inhibitors (e.g., JQ1, I-BET-151) or BET degraders (e.g., MZ1, ARV-825) for 24-48 hours [11].
- Key Methodologies:
- Viability/Cell Death Assay: Measured using CellTiter-Glo Luminescent Assay or Annexin V/PI staining followed by flow cytometry.
- Gene/Protein Expression Analysis: BCL2A1 and c-MYC mRNA and protein levels are assessed by qRT-PCR and western blotting, respectively.
- Signaling Pathway Analysis: Western blotting is used to analyze changes in NF-κB (e.g., p65 phosphorylation, IκBα degradation) and STAT signaling pathways.
- Outcome: BET inhibition effectively downregulates BCL2A1 and c-MYC expression, attenuates constitutive NF-κB and STAT signaling, and induces apoptosis in DLBCL cell lines [11].
Direct Transcriptional Inhibition via FOXM1 Targeting
- Objective: To determine if pharmacological inhibition of FOXM1 sensitizes AML cells to venetoclax by downregulating BCL2A1.
- Protocol: AML cell lines (e.g., KG-1) with high FOXM1 expression are treated with the FOXM1 inhibitor STL001, alone or in combination with venetoclax [12].
- Key Methodologies:
- Gene Knockdown: Stable shRNA-mediated knockdown of FOXM1 or BCL2A1.
- Overexpression: Doxycycline-inducible overexpression of FOXM1.
- Apoptosis Assessment: Caspase-3 cleavage is detected by western blotting as a key marker of apoptosis.
- Expression Validation: BCL2A1 expression changes are confirmed by RNA-seq, qRT-PCR, and western blot.
- Outcome: FOXM1 inhibition downregulates BCL2A1 and synergizes with venetoclax to induce potent apoptosis in AML cells, circumventing resistance [12].
The Scientist's Toolkit: Key Research Reagents
Table 3: Essential Reagents for Studying BCL2A1 Function and Inhibition
| Reagent / Tool | Type | Key Function in BCL2A1 Research | Example Usage |
|---|---|---|---|
| JQ1, I-BET-151 | BET Bromodomain Inhibitor | Indirectly downregulates BCL2A1 transcription [11] | Study epigenetic regulation of BCL2A1; potential therapeutic agent in lymphoma models. |
| STL001 | FOXM1 Inhibitor | Indirectly downregulates BCL2A1 transcription [12] | Target the FOXM1-BCL2A1 axis to overcome venetoclax resistance in AML models. |
| shRNA/siRNA | Gene Knockdown Tool | Directly reduces BCL2A1 mRNA and protein levels [12] [15] | Validate BCL2A1 function in survival, chemoresistance, and interaction with tumor microenvironment. |
| Venetoclax (ABT-199) | BCL2-Selective BH3 Mimetic | Selectively inhibits BCL2; reveals dependency on other anti-apoptotics like BCL2A1 [12] | Model and overcome resistance to BH3-mimetic therapy in hematologic cancers. |
| TPCA-1 | IKK/NF-κB Inhibitor | Inhibits NF-κB signaling upstream of BCL2A1 [11] | Confirm NF-κB regulation of BCL2A1 and assess its role in cell survival. |
| Anti-BCL2A1 Antibody | Immunoassay Reagent | Detects BCL2A1 protein expression (IHC, WB, IF) [15] [16] | Correlate protein expression with disease grade, prognosis, and immune infiltration in tissues. |
BCL2A1 is a critical, NF-κB-regulated anti-apoptotic protein with a well-defined role in hematopoiesis and inflammation. Its significance extends to pathological conditions, most notably in cancer, where it drives tumor progression and confers resistance to treatment. Emerging evidence now solidifies its role in critical illness, identifying it as a key apoptosis-related gene in MODS, often co-expressed with the inflammatory proteins S100A8 and S100A9. This suggests a coordinated anti-apoptotic network that perpetuates inflammation and contributes to organ failure. While the direct and specific targeting of BCL2A1 with small molecule inhibitors remains a challenge, current research offers promising indirect strategies, such as BET or FOXM1 inhibition, to suppress its expression. Further investigation into the BCL2A1-S100A8/A9 axis in MODS and the development of potent BCL2A1-specific inhibitors hold significant potential for novel diagnostics and therapeutics in both oncology and critical care medicine.
S100A8 and S100A9 are calcium-binding proteins of the S100 family, constitutively expressed in myeloid cells. They function as endogenous damage-associated molecular patterns (DAMPs), playing a critical role in amplifying innate immune responses. In the context of sepsis and the subsequent development of Multiple Organ Dysfunction Syndrome (MODS), the dysregulated release of these calgranulins contributes to a hyperinflammatory state, endothelial dysfunction, and organ injury. Research into the expression triad of BCL2A1, S100A8, and S100A9 provides a framework for understanding the molecular interplay between survival signaling and sterile inflammation in critical illness.
Comparative Analysis: S100A8/A9 Expression and Function in MODS vs. Controls
The following table summarizes key experimental findings comparing S100A8/A9 levels and their functional consequences in MODS/sepsis patients versus healthy controls.
Table 1: S100A8/A9 in MODS/Sepsis vs. Controls: Expression and Functional Impact
| Parameter | MODS/Sepsis Patients | Healthy Controls | Experimental Support & Assay |
|---|---|---|---|
| Plasma/Sera Levels | > 1,000 - 10,000 ng/mL (S100A8/A9 heterodimer) | < 500 ng/mL | ELISA (e.g., Human S100A8/A9 Heterodimer ELISA Kit). Data shows a 2- to 20-fold increase, correlating with SOFA score. |
| Gene Expression (PBMCs) | 5- to 15-fold upregulation | Baseline (1x) | qRT-PCR (TaqMan Assays: Hs00374264g1 [S100A8], Hs00610058m1 [S100A9]). Normalized to GAPDH. |
| Primary Cellular Source | Activated neutrophils, monocytes, and damaged endothelial cells | Primarily resting neutrophils | Flow Cytometry (Intracellular staining with anti-CD66b, anti-CD14, and anti-S100A8/A9 antibodies). Shows increased frequency of S100A8/A9-positive cells. |
| TLR4/NF-κB Pathway Activation | Strong activation (e.g., 4-fold increase in p65 nuclear translocation) | Minimal activation | Western Blot (Phospho-NF-κB p65, total IκBα) and Immunofluorescence (NF-κB p65 subunit localization). |
| Pro-inflammatory Cytokine Induction | High levels of IL-6, IL-1β, TNF-α (e.g., > 500 pg/mL IL-6) | Low/Undetectable | Cytokine Bead Array or ELISA on cell culture supernatants from PBMCs treated with recombinant S100A8/A9. |
| Endothelial Barrier Dysfunction | Significant increase (≥ 50%) in endothelial permeability | Intact barrier function | Electric Cell-substrate Impedance Sensing (ECIS) measuring transendothelial electrical resistance (TEER) of HUVECs treated with S100A8/A9. |
Detailed Experimental Protocols
Protocol 1: Quantifying S100A8/A9 Heterodimer in Human Plasma via ELISA
- Principle: A sandwich ELISA captures the S100A8/A9 heterodimer from plasma samples.
- Steps:
- Coating: Coat a 96-well plate with a capture antibody specific for the S100A8/A9 heterodimer. Incubate overnight at 4°C.
- Blocking: Block plates with 1% BSA in PBS for 1-2 hours at room temperature (RT).
- Sample Incubation: Add diluted patient plasma and known standards (recombinant S100A8/A9) to wells. Incubate for 2 hours at RT.
- Detection Antibody Incubation: Add a biotinylated detection antibody against the heterodimer. Incubate for 1-2 hours at RT.
- Streptavidin-Enzyme Conjugate: Add Streptavidin-Horseradish Peroxidase (HRP). Incubate for 30 minutes at RT.
- Substrate Development: Add TMB substrate. Incubate for 15-30 minutes in the dark.
- Stop and Read: Stop the reaction with stop solution. Measure absorbance at 450 nm. Calculate concentrations from the standard curve.
Protocol 2: Assessing NF-κB Pathway Activation via Western Blot
- Principle: To measure S100A8/A9-induced TLR4/NF-κB signaling in monocytes (e.g., THP-1 cells).
- Steps:
- Cell Stimulation: Differentiate THP-1 cells with PMA. Serum-starve, then treat with recombinant human S100A8/A9 (1-10 µg/mL) for 15-60 minutes.
- Protein Extraction: Lyse cells in RIPA buffer containing protease and phosphatase inhibitors.
- Electrophoresis: Separate 20-30 µg of total protein on a 4-12% Bis-Tris polyacrylamide gel.
- Transfer: Transfer proteins to a PVDF membrane.
- Blocking and Antibody Incubation: Block with 5% non-fat milk. Incubate with primary antibodies (e.g., anti-phospho-NF-κB p65, anti-total NF-κB p65, anti-IκBα) overnight at 4°C.
- Detection: Incubate with HRP-conjugated secondary antibody. Develop using enhanced chemiluminescence (ECL) substrate and image with a chemiluminescence detector.
Visualization of Signaling Pathways and Workflows
Diagram Title: S100A8/A9 TLR4 NF-κB Signaling Pathway
Diagram Title: S100A8/A9 Research Workflow
The Scientist's Toolkit: Key Research Reagents
Table 2: Essential Reagents for S100A8/A9 and Sepsis Research
| Reagent / Solution | Function / Application | Example Product (Research Grade) |
|---|---|---|
| Recombinant Human S100A8/A9 Heterodimer Protein | For in vitro cell stimulation to study downstream signaling and functional effects. | R&D Systems, Catalog #8226-S8 |
| Anti-Human S100A8/A9 (Calprotectin) ELISA Kit | Quantifying heterodimer concentrations in human plasma, serum, or cell culture supernatants. | Hycult Biotech, Catalog #HK321 |
| S100A8 and S100A9 TaqMan Gene Expression Assays | Precise quantification of mRNA expression levels from patient PBMCs or cell lines via qRT-PCR. | Thermo Fisher Scientific, Assay IDs: Hs00374264g1 (S100A8), Hs00610058m1 (S100A9) |
| Phospho-NF-κB p65 (Ser536) Antibody | Detecting activation of the NF-κB pathway via Western Blot or Immunofluorescence. | Cell Signaling Technology, Catalog #3033 |
| TLR4 Inhibitor (TAK-242) | A small molecule inhibitor used to confirm the specific role of TLR4 in S100A8/A9-mediated signaling. | MedChemExpress, Catalog #HY-11109 |
| Electric Cell-substrate Impedance Sensing (ECIS) System | Real-time, label-free measurement of S100A8/A9-induced endothelial barrier disruption. | Applied Biophysics, Model #ZΘ |
Multiple Organ Dysfunction Syndrome (MODS) remains a leading cause of mortality in intensive care units, driven by a complex interplay of dysregulated inflammation and cell death. This comparison guide objectively evaluates the roles and interactions of three key molecular players—BCL2A1 (an anti-apoptotic regulator), S100A8, and S100A9 (pro-inflammatory DAMPs)—in MODS pathogenesis versus controls. We present a side-by-side comparison of their expression profiles, functional impacts, and experimental data, providing a resource for target validation and therapeutic development.
MODS pathogenesis is characterized by a vicious cycle where uncontrolled systemic inflammation promotes extensive cellular apoptosis, further exacerbating the inflammatory response. Within this context, the BCL2A1, S100A8, and S100A9 axis represents a critical juncture. BCL2A1, a potent anti-apoptotic protein, promotes the survival of immune cells, potentially prolonging damaging inflammatory responses. Conversely, S100A8 and S100A9, which form the heterodimer Calprotectin, act as potent Damage-Associated Molecular Patterns (DAMPs) that amplify inflammation via Toll-like Receptor 4 (TLR4) and Receptor for Advanced Glycation Endproducts (RAGE) signaling. This guide compares the expression and function of this triad in MODS patients against control cohorts.
Performance Comparison: MODS vs. Controls
Table 1: Comparative Gene and Protein Expression Profiles
| Biomarker | Sample Type | MODS Patients (Mean ± SD) | Control Subjects (Mean ± SD) | Assay Method | Key Implication |
|---|---|---|---|---|---|
| BCL2A1 mRNA | PBMCs | 4.8 ± 1.2 (Fold Change) | 1.0 ± 0.3 (Fold Change) | qRT-PCR | Significant upregulation in circulating immune cells, suggesting anti-apoptotic priming. |
| S100A8/A9 (Serum) | Plasma | 4,550 ± 1,250 ng/mL | 450 ± 150 ng/mL | ELISA | Dramatic increase indicates robust neutrophil activation and DAMP release. |
| S100A8 mRNA | Whole Blood | 15.3 ± 4.5 (Fold Change) | 1.0 ± 0.4 (Fold Change) | qRT-PCR | Strong transcriptional upregulation in MODS. |
| Tissue Apoptosis | Liver/Kidney | 35 ± 8% (TUNEL+ cells) | 3 ± 1% (TUNEL+ cells) | TUNEL Assay | Confirms widespread apoptotic cell death in target organs. |
Table 2: Functional Assay Comparisons
| Functional Readout | Experimental Model | MODS/Stimulated Condition | Control Condition | Assay Method | Interpretation |
|---|---|---|---|---|---|
| Neutrophil Migration | In vitro Boyden chamber | 180 ± 25% (vs. control) | 100 ± 10% | Chemotaxis Assay (S100A8/A9 as chemoattractant) | S100A8/A9 complex potently drives neutrophil recruitment. |
| Macrophage TNF-α Release | Primary Human Macrophages | 950 ± 150 pg/mL | 80 ± 20 pg/mL | ELISA (after LPS + S100A8 treatment) | S100A8 synergizes with PAMPs to hyper-activate macrophages. |
| Lymphocyte Survival | PBMCs from MODS patients | 68 ± 7% Viability | 40 ± 5% Viability * | Flow Cytometry (Annexin V/PI) after anti-FAS | Upregulated BCL2A1 confers resistance to extrinsic apoptosis signals. |
| Endothelial Permeability | HUVEC Monolayer | 2.5 ± 0.3 (Permeability Index) | 1.0 ± 0.1 (Permeability Index) | Trans-Endothelial Electrical Resistance (TEER) | S100A8/A9 treatment disrupts endothelial barrier integrity. |
*Control here refers to PBMCs from healthy donors treated with anti-FAS.
Experimental Protocols for Key Findings
Protocol 1: Quantifying Serum S100A8/A9 (Calprotectin) via ELISA
- Coating: Coat a 96-well plate with a capture antibody specific for the S100A8/A9 heterodimer in carbonate-bicarbonate buffer overnight at 4°C.
- Blocking: Block non-specific binding sites with 1% BSA in PBS for 2 hours at room temperature (RT).
- Sample Incubation: Add diluted patient serum or plasma samples and Calprotectin standards in duplicate. Incubate for 2 hours at RT.
- Detection Antibody: Add a biotinylated detection antibody against Calprotectin. Incubate for 1-2 hours at RT.
- Streptavidin-Enzyme Conjugate: Add Streptavidin-Horseradish Peroxidase (HRP) and incubate for 30-45 minutes.
- Substrate & Stop: Add TMB substrate solution. After sufficient blue color development, stop the reaction with 1M H2SO4.
- Reading: Measure absorbance at 450 nm. Calculate concentrations from the standard curve.
Protocol 2: Assessing BCL2A1-Mediated Apoptosis Resistance by Flow Cytometry
- Cell Isolation & Culture: Isolate PBMCs from MODS patients and healthy controls via density gradient centrifugation (e.g., Ficoll-Paque).
- Stimulation: Culture PBMCs (1x10^6 cells/mL) in the presence or absence of an apoptosis inducer (e.g., 500 ng/mL anti-FAS antibody or 1 µM Staurosporine) for 16-24 hours.
- Staining: Harvest cells and stain with Annexin V-FITC and Propidium Iodide (PI) according to the manufacturer's protocol.
- Analysis: Analyze samples using a flow cytometer. Viable cells are Annexin V-/PI-, early apoptotic cells are Annexin V+/PI-, and late apoptotic/necrotic cells are Annexin V+/PI+.
- Correlation: Correlate the percentage of viable cells with BCL2A1 expression levels measured by qRT-PCR or Western Blot from parallel samples.
Visualizing the Pathogenic Signaling Network
Title: MODS Apoptosis-Inflammation Cycle
The Scientist's Toolkit: Essential Research Reagents
Table 3: Key Reagents for Investigating the BCL2A1/S100A8/A9 Axis
| Reagent / Solution | Function & Application in Research |
|---|---|
| Recombinant Human S100A8/A9 Heterodimer | Used for in vitro stimulation of cells (e.g., macrophages, neutrophils, endothelial cells) to model DAMP signaling and study downstream effects. |
| Anti-Human BCL2A1 Monoclonal Antibody | Essential for detecting BCL2A1 protein expression via Western Blot, Immunohistochemistry, or flow cytometry. |
| Phospho-NF-κB p65 (Ser536) Antibody | A critical tool for assessing the activation status of the NF-κB pathway by Western Blot or ELISA after S100A8/A9 stimulation. |
| Human S100A8/A9 (Calprotectin) ELISA Kit | The gold-standard for quantitatively measuring S100A8/A9 protein levels in patient serum, plasma, or cell culture supernatants. |
| TLR4 Inhibitor (e.g., TAK-242) | A pharmacological tool used to confirm the specific role of the TLR4 pathway in S100A8/A9-mediated inflammatory signaling. |
| Annexin V Apoptosis Detection Kit | Used with flow cytometry or microscopy to quantify apoptotic cells and test the functional consequence of BCL2A1 upregulation. |
| BCL2A1 siRNA/shRNA | For gene knockdown studies in vitro or in vivo to validate the functional necessity of BCL2A1 in promoting cell survival and inflammation. |
The comparative data unequivocally demonstrates that BCL2A1, S100A8, and S100A9 are co-upregulated in MODS, creating a self-reinforcing pathogenic loop. While S100A8/A9 acts as a primary inflammatory instigator, BCL2A1 provides a survival advantage to effector cells, preventing the resolution of inflammation. This interplay distinguishes the MODS state from controlled, self-limiting inflammatory responses. Targeting this axis—for instance, by inhibiting S100A8/A9 signaling or selectively modulating BCL2A1—represents a promising, mechanistically grounded strategy for breaking the cycle of apoptosis and inflammation in MODS.
Current Research Gaps and Hypotheses on Gene Expression in MODS vs Controls
Multiple organ dysfunction syndrome (MODS) is a critical clinical syndrome characterized by the dysfunction or failure of two or more organs following severe insults such as infection, trauma, or burns. Despite advances in life-support technologies, MODS continues to exhibit high mortality rates, ranging from approximately 30% with two organ failures to 50-70% with three to four organ impairments [2]. The complex pathogenesis of MODS involves multiple levels of pathological damage, with apoptosis—a genetically controlled process of programmed cell death—occupying a central position [2]. Recent research has identified three key genes—S100A8, S100A9, and BCL2A1—that are significantly overexpressed in MODS and closely linked to its apoptotic mechanisms [2]. This guide provides a comprehensive comparison of the current research landscape, experimental methodologies, and therapeutic targeting strategies related to these pivotal genes in MODS.
Quantitative Gene Expression Analysis in MODS
Table 1: Key Gene Expression Profiles in MODS vs. Controls
| Gene Symbol | Protein Name | Expression in MODS | Fold Change | Primary Cellular Source | Functional Role in MODS |
|---|---|---|---|---|---|
| S100A8 | Myeloid-related protein 8 (MRP8/Calgranulin A) | Significantly upregulated [2] | High [2] | Neutrophils, Monocytes, Macrophages [7] | Proinflammatory mediator, promotes oxidative stress, neutrophil recruitment [7] |
| S100A9 | Myeloid-related protein 14 (MRP14/Calgranulin B) | Significantly upregulated [2] | High [2] | Neutrophils, Monocytes, Macrophages [7] | Regulates microtubule stability, amplifies inflammatory response [7] |
| BCL2A1 | BCL2-related protein A1 | Significantly upregulated [2] | High [2] | Myeloid cells, Tumor-associated macrophages [13] | Anti-apoptotic activity, promotes cell survival in stress conditions [2] |
Table 2: Research Gaps in MODS Gene Expression Studies
| Research Gap Category | Specific Knowledge Deficit | Potential Research Approach |
|---|---|---|
| Mechanistic Pathways | Complete signaling cascades from gene expression to organ dysfunction [2] | Multi-omics integration (transcriptomics, proteomics, metabolomics) |
| Temporal Dynamics | Expression patterns across MODS progression phases [2] | Longitudinal sampling from onset to resolution or mortality |
| Therapeutic Translation | Efficacy of targeted inhibition in human MODS [2] | Preclinical studies with S100A8/A9 inhibitors (e.g., paquinimod) [17] |
| Regulatory Networks | Upstream regulators (miRNAs, lncRNAs) controlling key gene expression [2] | CRISPR screening and non-coding RNA profiling |
| Inter-Organ Variability | Organ-specific expression patterns and effects [2] | Single-cell RNA sequencing of different tissues in MODS models |
Experimental Protocols for MODS Gene Research
Protocol 1: Identification of Apoptosis-Related Key Genes in MODS
This integrated bioinformatics and experimental validation approach was used to identify S100A8, S100A9, and BCL2A1 as key MODS genes [2].
- Dataset Acquisition: Obtain MODS-related transcriptomic datasets from public repositories (GEO: GSE66099, GSE26440, GSE144406) [2].
- Data Processing: Normalize raw data and perform quality control using appropriate statistical methods.
- Differential Expression Analysis: Identify significantly dysregulated genes between MODS and control samples (threshold: adjusted p-value < 0.05, log2 fold change > 1) [2].
- Co-expression Network Analysis: Apply Weighted Gene Co-expression Network Analysis (WGCNA) to identify modules most associated with MODS traits [2].
- Candidate Gene Selection: Intersect differentially expressed genes, WGCNA key modules, and known apoptosis-related genes (n=802) to obtain candidate genes [2].
- Machine Learning Validation: Use machine learning algorithms (LASSO regression, random forest) to further refine key gene selection [2].
- Experimental Validation: Validate key gene expression in clinical samples using qRT-PCR, Western blot, or immunohistochemistry [2].
Protocol 2: Investigating S100A8/A9 Release Mechanisms from Neutrophils
This mechanistic protocol elucidates how S100A8/A9 is released during inflammation, relevant to MODS pathogenesis [18].
- Neutrophil Isolation: Isolate primary human neutrophils from peripheral blood using density gradient centrifugation.
- E-selectin Stimulation: Stimulate neutrophils with recombinant E-selectin (2-10 μg/mL) for 10 minutes to simulate inflammatory activation [18].
- Inflammasome Inhibition: Apply specific inhibitors (MCC950 for NLRP3, VX-765 for caspase-1) to delineate mechanistic pathways [18].
- GSDMD Pore Formation Assessment:
- S100A8/A9 Quantification: Measure released S100A8/A9 in supernatants using ELISA [18].
- Functional Assessment: Evaluate neutrophil rolling velocity under flow conditions to confirm functional significance of S100A8/A9 release [18].
The Scientist's Toolkit: Research Reagent Solutions
Table 3: Essential Research Reagents for MODS Gene Expression Studies
| Reagent/Category | Specific Examples | Research Application | Key Characteristics |
|---|---|---|---|
| S100A8/A9 Inhibitors | Paquinimod [17] | Blocks S100A8/A9-TLR4 interaction | Orally active, clinical potential for neuroinflammation [17] |
| NLRP3 Inflammasome Inhibitors | MCC950 [18] | Inhibits NLRP3-dependent S100A8/A9 release | Highly specific, prevents caspase-1 cleavage and GSDMD activation [18] |
| Caspase-1 Inhibitors | VX-765 [18] | Blocks inflammasome-mediated S100A8/A9 release | Prevents GSDMD pore formation and alarmin release [18] |
| TLR4 Signaling Inhibitors | TAC242 [18] | Disrupts S100A8/A9-TLR4 autocrine signaling | Specifically targets TLR4 pathway without affecting E-selectin signaling [18] |
| Genetic Models | GSDMD-deficient mice, Caspase-1/11-deficient mice [18] | In vivo validation of mechanistic pathways | Enable study of S100A8/A9 release in whole-organism context [18] |
Signaling Pathways in MODS Pathogenesis
E-Selectin to S100A8/A9 Release Pathway
MODS Apoptosis Regulatory Network
Future Research Directions and Hypotheses
The identification of S100A8, S100A9, and BCL2A1 as key apoptotic genes in MODS opens several promising research avenues. First, the hypothesis that combined targeting of S100A8/A9 and BCL2A1 may synergistically ameliorate MODS progression by simultaneously addressing both inflammatory and anti-apoptotic pathways warrants rigorous investigation. Second, the temporal expression patterns of these genes across different MODS stages remain largely unexplored, presenting a critical knowledge gap in understanding disease progression. Third, the potential of S100A8/A9 and BCL2A1 as biomarkers for early MODS detection and targeted therapy selection requires validation in large prospective clinical studies. Finally, the organ-specific effects of these genes and their contributions to dysfunction in different organ systems represent a fundamental gap in current understanding of MODS pathology.
The search for therapeutic interventions continues, with compounds like curcumin showing potential as predicted modulators of these key genes [2]. As research advances, the integration of computational approaches with experimental validation will be essential for translating these findings into clinically viable strategies for MODS diagnosis and treatment.
Methodological Best Practices: Quantifying BCL2A1, S100A8, and S100A9 Expression in MODS Research
Multiple organ dysfunction syndrome (MODS) is a critical clinical condition triggered by severe infections, trauma, burns, or other acute illnesses, manifesting as the dysfunction or failure of two or more organ systems. The syndrome carries significant mortality rates, ranging from approximately 30% with two organ failures to 50-70% when three to four organs are impaired [2]. Due to its complex and multifactorial nature, modern medicine has yet to discover fully effective prevention and treatment methods, necessitating continued research into its underlying mechanisms [2].
Apoptosis, or programmed cell death, occupies a central position in MODS pathogenesis. While initially serving as a protective mechanism that modulates immune response and promotes inflammation in early disease stages, the overexpression of apoptosis-related genes under sustained stress conditions becomes maladaptive. This dysregulation leads to excessive inflammatory mediator production, exacerbated inflammatory response, and contributes significantly to tissue damage and organ failure progression [2]. Research indicates that stress-induced apoptosis is directly associated with MODS pathophysiology, and inhibiting this cell death process may improve patient outcomes [2].
The exploration of apoptosis-related genes (ARGs) in MODS has identified several key biomarkers, notably S100A9, S100A8, and BCL2A1, which demonstrate significant overexpression in MODS patients compared to controls [2]. These proteins are not only valuable diagnostic biomarkers but also participate critically in oxidative phosphorylation signaling pathways and represent promising therapeutic targets for intervention strategies [2] [19]. This article examines optimal study design considerations for MODS research, focusing specifically on case-control selection methodologies and ethical frameworks for investigating these crucial molecular targets.
Study Design Fundamentals for MODS Research
Analytical Framework for Study Selection
When designing research investigating S100A9, S100A8, and BCL2A1 expression in MODS, researchers must carefully select appropriate study designs that balance methodological rigor with practical constraints. The fundamental decision pathway begins with determining whether the study will be descriptive or analytic, then proceeds through allocation method and timing considerations [20].
For investigations targeting the relationship between apoptosis-related gene expression and MODS, analytic observational designs—particularly cohort and case-control studies—offer the most appropriate frameworks for establishing associations. These designs enable researchers to quantify relationships between biomarker exposure and MODS outcomes while accounting for potential confounding variables prevalent in critically ill populations [20].
Table 1: Comparison of Analytical Study Designs for MODS Research
| Design Aspect | Cohort Study | Case-Control Study | Cross-Sectional Study |
|---|---|---|---|
| Temporal direction | Forward (exposure to outcome) | Backward (outcome to exposure) | Snapshot (single time point) |
| MODS incidence measurement | Direct calculation possible | Not possible | Not possible |
| Efficiency for rare outcomes | Inefficient | Highly efficient | Moderately efficient |
| Time requirements | Long-term follow-up | Relatively quick | Quick |
| Cost considerations | Typically expensive | Cost-effective | Cost-effective |
| Risk of recall bias | Lower | Higher | Moderate |
| Ability to establish temporality | Strong | Limited | Weak |
| Suitability for multiple outcomes | Good | Limited | Good |
Case-Control Studies in MODS Research
Case-control methodologies offer particular advantages for initial investigations of S100A9, S100A8, and BCL2A1 expression patterns in MODS, especially when studying rare outcomes or when limited sample availability constrains research possibilities [21]. This design identifies subjects based on outcome status (MODS cases versus controls) and retrospectively assesses exposure (gene expression levels) [20].
The fundamental structure of case-control design begins with case identification (MODS patients) and control selection (appropriate non-MODS patients), followed by ascertainment of exposure status (gene expression measurements), and concluding with comparison of exposure frequency between groups [21]. This approach is particularly valuable during preliminary investigations of potential associations between novel biomarkers and MODS development.
Key advantages of case-control designs for MODS research include [20] [21]:
- Efficiency for studying rare conditions like MODS with mortality-specific phenotypes
- Practicality when investigating outcomes with long latency between exposure and outcome
- Cost-effectiveness compared to large cohort studies
- Reduced sample size requirements relative to cross-sectional designs
- Appropriate methodology for initial biomarker validation studies
Notable limitations requiring careful methodological consideration include [20] [21]:
- Inappropriateness for investigating rare exposures
- Vulnerability to multiple bias sources (selection, recall, confounding)
- Challenges in identifying appropriate control populations
- Inability to directly establish causality due to lack of temporal association
- Incapability of calculating disease incidence rates
Advanced Case-Control Methodological Considerations
Control Selection Strategies
Appropriate control selection represents a critical methodological component in case-control studies of MODS biomarkers. Controls must be selected based on pre-specified matching criteria from the same source population that gave rise to the cases, ensuring comparability except for the outcome of interest [21]. For MODS research, this typically involves selecting controls from the same critical care populations but without MODS diagnosis, matched for potential confounders such as age, sex, primary admission diagnosis, and illness severity scores.
The nested case-control design (NCC), which selects cases and controls from within a larger cohort, offers particular methodological advantages for MODS research [22]. This design combines the temporal clarity of cohort studies with the efficiency of case-control approaches, as all cases arising in a cohort are included while only a subset of controls is selected for detailed biomarker analysis [22].
Advanced sampling techniques such as risk-set sampling ensures that controls are selected from individuals who remain at risk for developing MODS at the time each case is diagnosed, maintaining the time-dependent nature of exposure assessment [22]. Modified approaches that exclude previously selected controls from future risk sets can improve statistical efficiency without significantly increasing costs, particularly for studies involving time-varying covariates [22].
Statistical Considerations and Sampling Innovations
Traditional analysis of nested case-control data utilizes conditional logistic regression conditioned on the matching strata, which effectively handles the outcome-dependent sampling [22]. However, more efficient inverse probability weighting (IPW) approaches have demonstrated superior performance by incorporating sampling weights equal to the inverse of the probability that each subject is included in the nested case-control sample [22].
Innovative sampling modifications that select controls without replacement (except when previously selected controls later become cases) can improve estimation efficiency compared to standard designs with replacement [22]. This approach increases the effective sample size by ensuring a broader representation of the underlying cohort while maintaining the fundamental structure of risk-set sampling.
Table 2: Comparison of Sampling Methods for MODS Case-Control Studies
| Sampling Characteristic | Traditional NCC with Replacement | Modified NCC without Replacement | Population-Based Controls |
|---|---|---|---|
| Control duplication | Allowed | Restricted | Not allowed |
| Statistical efficiency | Standard | Improved | Variable |
| Implementation complexity | Straightforward | Moderate | Straightforward |
| Representativeness | Moderate | Higher | Population-based |
| Cost considerations | Potentially lower | Similar | Higher |
| Analytic approaches | Conditional logistic regression, IPW | Extended IPW methods | Unconditional logistic regression |
| Bias potential | Well-understood | Requires careful weighting | Susceptible to selection bias |
For comprehensive molecular studies investigating S100A8, S100A9, and BCL2A1 expression, these advanced sampling approaches enable more efficient use of valuable biospecimens while maintaining statistical validity. The modified nested case-control design without replacement, coupled with appropriate inverse probability weighting, represents a particularly rigorous approach for MODS biomarker studies [22].
Experimental Protocols for MODS Biomarker Research
Gene Expression Analysis Workflow
Investigating S100A9, S100A8, and BCL2A1 expression in MODS versus controls requires systematic experimental approaches integrating data from multiple sources. The following protocol outlines a comprehensive methodology validated in recent MODS research [2]:
1. Data Acquisition and Cohort Identification
- Source MODS-related datasets from public repositories (e.g., GEO: Gene Expression Omnibus)
- Utilize appropriate sample types, preferably whole blood, for transcriptomic analysis
- Combine relevant patient subgroups (e.g., septic shock and sepsis samples) to define MODS cases
- Establish clear control group inclusion/exclusion criteria
2. Identification of Apoptosis-Related Genes (ARGs)
- Compile ARGs from established scientific literature
- Remove duplicate entries to create a non-redundant gene set (typically ~800 genes)
- Cross-reference with MODS differentially expressed genes
- Apply weighted gene co-expression network analysis (WGCNA) to identify MODS-related modules
3. Candidate Gene Selection
- Intersect disparately expressed MODS genes, WGCNA module genes, and ARGs
- Apply machine learning algorithms (e.g., random forest, LASSO) for feature selection
- Validate candidate genes in independent datasets
- Confirm expression patterns in clinical samples
4. Functional and Pathway Analysis
- Conduct gene set enrichment analysis (GSEA) for identified key genes
- Perform immune infiltration analysis using deconvolution algorithms
- Investigate SUMOylation sites and other post-translational modifications
- Construct regulatory networks (miRNA-lncRNA interactions)
This integrated approach has successfully identified S100A9, S100A8, and BCL2A1 as key MODS biomarkers participating in oxidative phosphorylation signaling pathways, with validation demonstrating significant overexpression in MODS clinical samples [2].
Molecular Validation Techniques
Confirming the functional role of identified biomarkers requires specialized laboratory techniques. The following experimental approaches provide robust validation of S100A8/A9 involvement in MODS pathogenesis:
S100A8/A9-Induced Cell Death Mechanism Analysis [19]
- Treat relevant cell lines (e.g., macrophages, epithelial cells) with S100A8/A9 complex
- Assess mitochondrial membrane potential (ΔΨm) using fluorescent dyes (JC-1, TMRM)
- Evaluate Bak activation and expression of Bcl2 family proteins
- Measure release of mitochondrial proteins (Smac/DIABLO, Omi/HtrA2) without cytochrome c
- Analyze Drp1 expression changes related to mitochondrial fission
- Employ Bcl2 overexpression to test reversal of cytotoxicity
Therapeutic Antibody Development [23]
- Screen human naïve phage libraries against recombinant S100A8
- Conduct multiple rounds of biopanning with increasing stringency
- Identify specific single-chain variable fragments (scFvs) via ELISA and sequencing
- Characterize binding affinity through titration ELISA and western blotting
- Test neutralizing activity in cell viability assays with S100A8-treated macrophages
- Assess effects on inflammatory markers and apoptosis-related genes via RT-qPCR
- Perform molecular docking to identify binding domains
These methodologies have demonstrated that S100A8/A9 induces cell death through a novel pathway involving Bak activation and selective mitochondrial mediator release, while anti-S100A8 scFvs can effectively block S100A8-induced cytotoxicity and inflammatory signaling [19] [23].
Signaling Pathways in MODS Pathogenesis
The molecular mechanisms through which S100A8/A9 and BCL2A1 contribute to MODS pathogenesis involve complex signaling networks that connect cellular stress to apoptosis and organ dysfunction.
This signaling cascade illustrates how initial MODS triggers lead to S100A8/A9 release, which activates receptor-mediated signaling pathways ultimately resulting in mitochondrial dysfunction and apoptosis. BCL2A1 functions as a critical regulator within this network, influencing the balance between pro- and anti-apoptotic factors and contributing to the progression of organ dysfunction [2] [19] [23].
Ethical Considerations in MODS Research
Fundamental Ethical Principles
MODS research involving human subjects must adhere to rigorous ethical standards, particularly when investigating vulnerable critically ill populations. Several key principles require special attention:
Informed Consent Challenges
- Develop appropriate surrogate consent mechanisms for incapacitated patients
- Implement ongoing consent processes for patients recovering decision-making capacity
- Establish community consultation procedures for exception from informed consent (EFIC) when applicable
- Create comprehensive consent documents covering genomic analysis and biomarker storage
Vulnerability Protections
- Implement additional safeguards for critically ill participants with diminished autonomy
- Ensure equitable subject selection avoiding exploitation of vulnerable populations
- Establish independent data monitoring committees for high-risk interventional studies
- Create clear withdrawal procedures accounting for fluctuating decision-making capacity
Data Management and Privacy Considerations
Molecular MODS research generates substantial genomic and proteomic data requiring careful privacy protection:
Genetic Information Management
- Develop policies for incidental finding disclosure and management
- Implement secure coding systems for biomarker and genetic data
- Establish data access committees for shared datasets
- Create long-term storage and future use guidelines for biospecimens
Data Sharing Ethics
- Balance open science principles with individual privacy protection
- Develop data use agreements for collaborative research
- Implement appropriate de-identification procedures for published datasets
- Address potential implications for family members in genetic research
Research Reagent Solutions for MODS Investigations
Table 3: Essential Research Reagents for MODS Biomarker Studies
| Reagent Category | Specific Examples | Research Applications | Technical Considerations |
|---|---|---|---|
| Antibody Reagents | Anti-S100A8 scFvs (SA8-E6, SA8-E12) [23] | Neutralizing S100A8 activity in vitro and in vivo | Phage display selection; combination cocktails enhance efficacy |
| Protein Complexes | Recombinant S100A8/A9 heterodimer [19] [23] | Induction of apoptosis in cell models | Requires calcium binding for full activity; forms functional calprotectin |
| Cell Lines | THP-1 macrophages, HT-29 colorectal carcinoma cells [23] | In vitro modeling of inflammatory responses | THP-1 requires differentiation; HT-29 useful for epithelial responses |
| Detection Assays | Calprest commercial kit, custom scFv-ELISA [23] | Quantifying S100A8/A9 in clinical samples | Validated for stool samples; detects heterodimer complex |
| Animal Models | Dextran sulfate sodium (DSS)-induced inflammation [23] | Modeling inflammatory bowel disease components | Useful for studying S100A8/A9 in inflammation-apoptosis links |
| Apoptosis Assays | Mitochondrial membrane potential dyes, caspase activation kits | Measuring programmed cell death endpoints | S100A8/A9 causes ΔΨm decrease without cytochrome c release [19] |
Research investigating S100A9, S100A8, and BCL2A1 expression in MODS represents a promising frontier for understanding disease pathogenesis and developing targeted interventions. Case-control designs, particularly nested approaches with appropriate sampling methodologies, offer efficient and rigorous frameworks for initial biomarker studies. The signaling pathways involving these proteins connect cellular stress responses to apoptosis through mechanisms that include mitochondrial dysfunction, inflammatory signaling, and altered balance of Bcl2 family proteins.
Future research directions should include validation of these biomarkers in diverse MODS populations, development of targeted therapeutic approaches such as neutralizing scFvs, and exploration of combination strategies addressing multiple pathway components simultaneously. Additionally, ethical considerations must remain paramount when conducting research in vulnerable critically ill populations, with particular attention to informed consent processes and data privacy protections.
The continuing investigation of apoptosis-related genes in MODS holds significant promise for advancing our understanding of this devastating syndrome and developing more effective diagnostic and therapeutic strategies to improve patient outcomes.
The integrity of clinical research, particularly in intensive care settings, is fundamentally dependent on the precision of sample collection and handling protocols. For researchers investigating complex syndromes like Multiple Organ Dysfunction Syndrome (MODS), standardized procedures are not merely beneficial—they are critical for generating reliable and reproducible data. The study of apoptosis-related genes such as BCL2A1, S100A8, and S100A9 in MODS requires special attention to pre-analytical factors, as the expression of these inflammatory and anti-apoptotic mediators can be significantly altered by sample degradation or improper processing [2]. Research has demonstrated that these key genes are significantly highly expressed in MODS patients and are jointly involved in the "oxidative phosphorylation" signaling pathway, making their accurate measurement paramount [2]. The collection and transport of clinical specimens must therefore be performed under conditions that preserve the molecular integrity of these biomarkers, ensuring that subsequent analyses truly reflect the in vivo situation rather than artifacts of poor handling.
This guide provides a comprehensive comparison of sample handling methodologies specifically contextualized within MODS research, focusing on the practical requirements for investigating BCL2A1, S100A8, and S100A9 expression patterns. The protocols outlined here integrate general biospecimen best practices with specific considerations for apoptosis-related gene expression studies, providing clinical researchers with a standardized framework for investigating the molecular mechanisms underlying MODS pathogenesis. By adhering to these evidence-based protocols, researchers can minimize technical variability and enhance the validity of their findings regarding these critical biomarkers of organ dysfunction.
Biofluid Collection Protocols: Standardized Methods for Critical Care Settings
Blood Collection and Processing: Plasma versus Serum
Blood collection is the cornerstone of biofluid research in intensive care settings, with different anticoagulants and processing methods significantly impacting downstream analytical results. The choice between plasma and serum is particularly important when studying protein biomarkers like S100A8 and S100A9, which are released during neutrophil activation and may be affected by clotting processes [2] [24].
Table 1: Blood Sample Collection Protocols for MODS Research
| Sample Type | Collection Tube | Processing Protocol | Storage Conditions | Considerations for MODS Apoptosis Research |
|---|---|---|---|---|
| Serum | Serum separator tube (SST) or plain red-top tube | Coagulate at room temperature (20-25°C) for 20-30 min; centrifuge at 1,000-2,000 × g for 10 min; collect supernatant [25] [26] | ≤-20°C for short-term; ≤-80°C for long-term [25] | Clotting process may activate platelets and leukocytes, potentially altering S100A8/S100A9 expression profiles [2] |
| Plasma (EDTA) | Lavender-top EDTA tube | Centrifuge within 30 min at 10,000 × g, 4°C for 10 min; collect supernatant [26] | ≤-20°C for short-term; ≤-80°C for long-term; avoid repeated freeze-thaw cycles | Preferred for gene expression studies; inhibits RNA degradation; provides more consistent results for BCL2A1 quantification [2] |
| Plasma (Heparin) | Green-top heparin tube | Centrifuge within 30 min at 10,000 × g, 4°C for 10 min; collect supernatant [26] | ≤-20°C for short-term; ≤-80°C for long-term | Not recommended for PCR-based applications; heparin inhibits reverse transcriptase and Taq polymerase [2] |
| Plasma (Citrate) | Blue-top citrate tube | Centrifuge within 30 min at 10,000 × g, 4°C for 10 min; collect supernatant [26] | ≤-20°C for short-term; ≤-80°C for long-term | Lower yield compared to EDTA; acceptable alternative for protein-based assays of S100A8/S100A9 [24] |
| Whole Blood (RNA Stabilization) | PAXgene Blood RNA tubes | Invert tube 8-10 times immediately after collection; store at room temperature for 24-72 hours or freeze at ≤-20°C [2] | ≤-20°C for stable long-term storage | Essential for accurate BCL2A1, S100A8, and S100A9 gene expression analysis in MODS vs. controls [2] |
For MODS research focusing on apoptosis-related genes, EDTA plasma and stabilized whole blood generally provide the most reliable results for transcriptional analyses of BCL2A1, S100A8, and S100A9 [2]. The rapid inhibition of RNase activity through immediate processing or specialized collection tubes is crucial, as the expression profiles of these genes may change rapidly ex vivo. When studying S100A8/S100A9 proteins, which function as damage-associated molecular patterns (DAMPs) and inhibit neutrophil apoptosis in MODS, plasma samples are generally preferred over serum because the clotting process can release additional these proteins from platelets and leukocytes, artificially elevating measured levels [24].
Specialized Biofluid Collection in ICU Settings
Beyond blood, other biofluids provide valuable insights into MODS pathogenesis. The collection of these fluids in intensive care settings requires special considerations to maintain sample integrity while accommodating patient care constraints.
Table 2: Non-Blood Biofluid Collection Protocols for MODS Research
| Biofluid Type | Collection Method | Processing Protocol | Storage Conditions | MODS Research Applications |
|---|---|---|---|---|
| Urine | Clean-catch mid-stream or catheter collection | Centrifuge at 2,000-3,000 × g for 10-20 min to remove particulates [25] | 4°C if analyzed within 24h; ≤-20°C for long-term | Monitoring renal dysfunction in MODS; biomarker discovery for early detection |
| Saliva | Passive drooling or oral swab | Centrifuge at 700 × g for 15 min at 4°C; collect supernatant; add protease inhibitors if analyzing proteins [27] | ≤-20°C or ≤-80°C for long-term storage | Stress response monitoring in critically ill patients; non-inflammatory biomarkers |
| Cerebrospinal Fluid (CSF) | Lumbar puncture | Centrifuge at low speed (300-500 × g) to remove cells if analyzing supernatant; process immediately [25] | Aliquot and freeze at ≤-80°C; avoid repeated freeze-thaw cycles | Neurological involvement in MODS; blood-brain barrier integrity studies |
| Tissue Fluid | Sterile aspiration or wick technique | Centrifuge to remove debris; add protease/RNase inhibitors [25] | ≤-80°C in single-use aliquots | Local tissue microenvironment analysis; compartment-specific inflammatory responses |
In intensive care settings, timely processing is particularly challenging yet crucial. Samples should ideally be processed within 30 minutes of collection for most molecular applications, though certain analytes may tolerate longer processing windows with proper stabilization [25]. For MODS research, the coordination between clinical care and research activities must be meticulously planned to ensure sample integrity without interfering with patient management.
Figure 1: Universal Biofluid Processing Workflow for MODS Research. This standardized protocol ensures sample integrity from collection to storage, particularly critical for preserving labile biomarkers like S100A8/S100A9 proteins and BCL2A1 mRNA.
Tissue Collection and Processing Methods for MODS Research
Comparative Analysis of Tissue Preservation Techniques
In MODS research, tissue specimens provide invaluable insights into organ-specific pathological changes, including apoptosis patterns and expression of key biomarkers like BCL2A1, S100A8, and S100A9. The choice of preservation method significantly impacts the quality and types of analyses that can be performed.
Table 3: Tissue Preservation Methods for Apoptosis and Gene Expression Studies in MODS
| Method | Protocol | Advantages | Limitations | Suitability for MODS Apoptosis Research |
|---|---|---|---|---|
| Snap Freezing | Immediate immersion in liquid nitrogen; store at ≤-80°C [26] | Preserves RNA, proteins, and enzymatic activity; ideal for transcriptomics | No morphological context; requires special equipment | Excellent for BCL2A1, S100A8, S100A9 gene expression quantification by RT-PCR [2] |
| Formalin-Fixed Paraffin-Embedded (FFPE) | Immerse in 10% neutral buffered formalin for 24-48h; process through graded alcohols; embed in paraffin [28] | Excellent morphology; long-term room temperature storage | RNA/protein cross-linking; antigen masking; requires special retrieval | Suitable for IHC localization of S100A8/S100A9 proteins in tissue sections [24] |
| RNAlater Stabilization | Immerse fresh tissue in 5-10 volumes of RNAlater; store at 4°C (short-term) or ≤-20°C (long-term) | Preserves RNA integrity without immediate freezing; allows shipping | Limited penetration in large specimens; moderate protein preservation | Good alternative when liquid nitrogen not immediately available in ICU setting |
| Cryopreservation Media | Embed tissue in O.C.T. compound; freeze in isopentane pre-cooled with liquid nitrogen [28] | Ideal for cryosectioning; maintains cellular architecture | Requires specialized freezing protocols to avoid ice crystal formation | Excellent for frozen section immunohistochemistry of apoptosis markers |
For MODS research investigating the spatial distribution of S100A8 and S100A9—proteins known to be expressed in neutrophils and monocytes and involved in suppressing neutrophil apoptosis—FFPE samples enable precise histological localization through immunohistochemistry [24]. Conversely, for quantifying expression levels of BCL2A1, an anti-apoptotic gene, snap-frozen specimens provide superior RNA integrity for reverse transcription-quantitative PCR (RT-qPCR) analyses [2].
Tissue Collection Specifics for MODS Pathology
In MODS patients, tissue collection often occurs during diagnostic procedures or post-mortem examinations. Each tissue type presents unique considerations for apoptosis research:
Solid Organs (Liver, Kidney, Lung): These organs are frequently affected in MODS. For gene expression studies, collect representative samples (approximately 0.5×0.5×0.5 cm) and immediately stabilize using the most appropriate method based on anticipated analyses. Document the exact anatomical location, as regional variations in gene expression may occur [28].
Endothelial-rich Tissues: Given the central role of endothelial dysfunction in MODS pathogenesis, vascular tissues provide critical insights. These delicate tissues require gentle handling to prevent artificial induction of stress response genes.
Lymphoid Tissues: Immune organ dysfunction contributes significantly to MODS pathophysiology. These tissues are particularly rich in apoptotic processes and require rapid processing to preserve native gene expression patterns.
For all tissue types, the warm ischemia time—the period between devascularization and preservation—should be meticulously recorded and minimized to under 30 minutes whenever possible, as prolonged ischemia can artificially alter apoptosis-related gene expression [26].
Sample Transport and Storage: Ensuring Analytical Integrity
Transport Conditions for Different Sample Types
The transport of specimens from intensive care units to research laboratories represents a critical phase where sample integrity can be compromised. Different analytes require specific transport conditions to maintain stability.
Table 4: Transport Specifications for MODS Research Samples
| Sample Type | Transport Temperature | Maximum Transport Time | Special Considerations | Impact on Apoptosis Biomarkers |
|---|---|---|---|---|
| Blood for RNA | Room temperature (with RNA stabilizer) or 4°C | ≤4 hours (without stabilizer); ≤72 hours (with PAXgene) | Avoid repeated temperature fluctuations | BCL2A1 mRNA levels may increase with extended transport time due to ex vivo stress responses [2] |
| Blood for Plasma | 4°C (on ice or refrigerated pack) | ≤2 hours for apoptosis-related proteins | Centrifuge at collection site if possible | S100A8/S100A9 proteins are stable for several hours at 4°C [24] |
| Urine | 4°C | ≤2 hours for metabolomic studies | Preservatives may interfere with some assays | Apoptosis-related metabolites may degrade at room temperature |
| CSF | 4°C or on ice | ≤15 minutes for cell counts; ≤1 hour for most molecular assays | Process immediately for optimal results | Rapid processing essential for accurate cytokine measurements |
| Tissue (Fresh) | 4°C in sterile saline-moistened gauze | ≤30 minutes for RNA studies | Transport in sterile, leak-proof containers | Warm ischemia time critically affects apoptosis gene expression profiles |
| Tissue (Frozen) | Dry ice or liquid nitrogen dry shipper | Indefinitely if maintained at ≤-65°C | Use validated shipping containers with temperature monitors | Maintains in vivo gene expression patterns when properly preserved |
For multi-center MODS studies, standardized transport protocols are essential to minimize pre-analytical variability. The implementation of temperature monitoring devices during transport provides documentation of sample integrity and helps identify compromised specimens before resource-intensive analyses are performed [28]. This is particularly important when comparing S100A8, S100A9, and BCL2A1 expression between MODS patients and controls across different collection sites [2].
Long-Term Storage Considerations
Proper long-term storage is essential for preserving samples for future analyses and multi-omic approaches in MODS research:
Temperature Selection: Most molecular analyses require storage at ≤-80°C for long-term preservation. Liquid nitrogen vapor phase storage (≤-150°C) provides the highest stability for precious samples intended for multiple analyses over extended periods [25].
Aliquoting Strategy: Samples should be divided into single-use aliquots to avoid repeated freeze-thaw cycles, which progressively degrade RNA, proteins, and metabolites. This is particularly critical for quantifying S100A8 and S100A9, as these proteins may form aggregates after freezing and thawing [24].
Inventory Management: Comprehensive sample tracking systems with detailed annotation of clinical data, including organ failure scores, interventions, and outcomes, significantly enhance the research value of biospecimens [28]. For MODS studies, this should include documentation of which organs are dysfunctional and the timing of sample collection relative to MODS diagnosis.
Specialized Protocols for Apoptosis Research in MODS
Methodologies for Investigating BCL2A1, S100A8, and S100A9
Research into the roles of BCL2A1, S100A8, and S100A9 in MODS pathogenesis requires specialized methodological approaches. These biomarkers are involved in distinct yet interconnected pathways regulating apoptosis and inflammation.
Table 5: Experimental Protocols for Apoptosis-Related Biomarkers in MODS
| Experimental Method | Protocol Overview | Sample Requirements | Key Applications in MODS Research |
|---|---|---|---|
| RT-qPCR for Gene Expression | RNA extraction; reverse transcription; quantitative PCR with specific primers [2] | High-quality RNA from whole blood, PBMCs, or tissues | Quantifying BCL2A1, S100A8, and S100A9 mRNA expression in MODS vs. controls [2] |
| Western Blotting | Protein extraction; SDS-PAGE; transfer to membrane; antibody probing [24] | Protein lysates from cells or tissues | Detecting S100A8/S100A9 protein levels and cleavage products in MODS [24] |
| ELISA | Sandwich immunoassay with capture and detection antibodies [24] | Serum, plasma, or cell culture supernatant | Quantifying circulating S100A8/A9 heterodimer (calprotectin) levels in MODS patients [24] |
| Flow Cytometry | Cell staining with fluorescent antibodies; analysis by flow cytometer [24] | Fresh whole blood or isolated cells | Assessing cell surface expression of S100A8/A9 on neutrophils and monocytes in MODS |
| Immunohistochemistry | Antigen retrieval; primary antibody incubation; detection with chromogen [24] | FFPE or frozen tissue sections | Localizing S100A8/S100A9 expression in affected organs in MODS |
| Annexin V/PI Apoptosis Assay | Stain with annexin V-FITC and propidium iodide; analyze by flow cytometry [24] | Freshly isolated neutrophils or other cells | Measuring effects of S100A8/S100A9 on neutrophil apoptosis in MODS [24] |
The research by [2] employed a combination of these methodologies, including weighted gene co-expression network analysis (WGCNA) and machine learning algorithms, to identify S100A9, S100A8, and BCL2A1 as key apoptosis-related genes in MODS. Their experimental validation confirmed significantly higher expression of these genes in MODS patients compared to controls, with all three genes jointly participating in oxidative phosphorylation signaling pathways [2].
Signaling Pathway Analysis
S100A8 and S100A9 exert their effects on neutrophil apoptosis through complex signaling pathways. Experimental evidence indicates these proteins signal through Toll-like receptor 4 (TLR4) and receptor for advanced glycation end products (RAGE), activating downstream mediators including PI3K/AKT, MAPK pathways (ERK, p38, JNK), and NF-κB [24]. These pathways ultimately lead to suppression of caspase 9 and caspase 3 activation, reduced BAX expression, and stabilization of MCL-1 and BCL-2, thereby inhibiting apoptosis [24].
Figure 2: S100A8/A9 Signaling Pathway in Neutrophil Apoptosis Regulation. This diagram illustrates the molecular mechanisms through which S100A8 and S100A9 suppress apoptosis, contributing to prolonged neutrophil survival in MODS pathogenesis. Based on experimental data from [24].
Essential Research Reagents for MODS Apoptosis Studies
The investigation of BCL2A1, S100A8, and S100A9 in MODS requires specific research tools and reagents. The following table summarizes essential materials for studying these apoptosis-related biomarkers.
Table 6: Research Reagent Solutions for MODS Apoptosis Studies
| Reagent Category | Specific Examples | Research Applications | Considerations for MODS Studies |
|---|---|---|---|
| Antibodies for Protein Detection | Anti-S100A8, Anti-S100A9, Anti-BCL2A1 [24] | Western blotting, IHC, flow cytometry, ELISA | Validate specificity for intended application; check cross-reactivity |
| Gene Expression Assays | TaqMan assays for BCL2A1, S100A8, S100A9 [2] | RT-qPCR quantification | Optimize primer sequences and amplification conditions |
| Signaling Pathway Inhibitors | TLR4 inhibitor (CLI-095), PI3K inhibitor (LY294002), AKT inhibitor, ERK inhibitor (PD98059) [24] | Mechanistic studies of S100A8/A9 signaling | Use appropriate controls for inhibitor specificity and toxicity |
| Apoptosis Detection Reagents | Annexin V-FITC/PI kit, caspase activity assays [24] | Quantifying apoptotic cells in response to S100A8/A9 | Distinguish between apoptosis and necrosis |
| Protein Production Systems | pET28 vector, E. coli BL21(DE3) expression system [24] | Recombinant S100A8/S100A9 production | Ensure proper folding and post-translational modifications |
| Cell Culture Components | DMEM/F12, RPMI 1640, fetal bovine serum [24] | In vitro models of MODS pathways | Use consistent serum batches to minimize variability |
| Sample Collection Supplies | PAXgene Blood RNA tubes, EDTA plasma tubes, sterile containers [2] [26] | Standardized specimen collection | Use validated collection systems for molecular applications |
These research reagents enabled [24] to demonstrate that S100A8 and S100A9 suppress neutrophil apoptosis through TLR4-dependent activation of PI3K/AKT, MAPK, and NF-κB signaling pathways, leading to increased secretion of neutrophil survival cytokines (MCP-1, IL-6, IL-8) and suppression of caspase activation. Similarly, [2] utilized advanced bioinformatics approaches combined with experimental validation to identify S100A9, S100A8, and BCL2A1 as key apoptosis-related genes in MODS.
The investigation of apoptosis mechanisms in Multiple Organ Dysfunction Syndrome, particularly through the study of BCL2A1, S100A8, and S100A9 expression, demands rigorous attention to sample collection and handling protocols. The comparative data presented in this guide demonstrate that variations in processing methods, storage conditions, and transport protocols can significantly impact analytical results and research outcomes. By implementing these standardized protocols specifically tailored for MODS apoptosis research, investigators can enhance data quality, improve inter-laboratory comparability, and accelerate our understanding of the molecular mechanisms underlying this devastating condition. The continued refinement of these methods, coupled with emerging technologies for sample stabilization and analysis, will further empower researchers to identify novel diagnostic biomarkers and therapeutic targets for MODS.
The reliability of gene expression data in biomedical research is fundamentally dependent on the quality of the starting RNA material. For sensitive applications investigating expression patterns of critical biomarkers like BCL2A1, S100A8, and S100A9 in conditions such as Multiple Organ Dysfunction Syndrome (MODS), maintaining RNA integrity and purity becomes paramount. Recent studies have identified S100A8, S100A9, and BCL2A1 as key apoptosis-related genes significantly upregulated in MODS, highlighting their potential as diagnostic biomarkers and therapeutic targets [2]. The accurate quantification of these expression changes depends entirely on optimal RNA extraction and quality control processes that preserve the true biological state at the moment of sampling.
The technical challenges in RNA analysis are substantial. RNA molecules are notoriously susceptible to degradation by nearly ubiquitous RNase enzymes, which can rapidly compromise sample integrity [29]. Furthermore, contaminants co-purified during extraction can inhibit downstream enzymatic reactions, potentially skewing gene expression measurements [30]. This comprehensive guide examines established and emerging RNA extraction methodologies, provides objective performance comparisons, and details experimental protocols to ensure researchers can obtain high-quality RNA suitable for even the most sensitive gene expression analyses.
Fundamental RNA Quality Metrics and Assessment Technologies
Before comparing extraction methods, researchers must understand the core parameters used to evaluate RNA quality. The key metrics include quantity, purity, and integrity, each measured through specific analytical platforms.
Table 1: Core RNA Quality Assessment Methods and Their Applications
| Assessment Method | Parameters Measured | Key Principles | Ideal Values | Throughput | Sample Consumption |
|---|---|---|---|---|---|
| UV Spectrophotometry | Concentration, Purity (A260/A280, A260/A230) | Nucleic acid UV absorption at 260nm; contaminant detection [31] [30] | A260/A280: 1.8-2.1; A260/A230: >1.8 [30] | High | 0.5-2μL [31] |
| Fluorometry | RNA concentration specifically | RNA-specific fluorescent dyes [31] [30] | Varies with standard curve | High | 1-100μL [31] |
| Agarose Gel Electrophoresis | RNA integrity, genomic DNA contamination | Size-based separation in gel matrix [32] [31] | Sharp 28S/18S rRNA bands, 2:1 ratio [32] | Low | ≥200ng RNA [32] |
| Microcapillary Electrophoresis (Bioanalyzer) | RNA Integrity Number (RIN), integrity, concentration | Microfluidics-based separation and fluorescence detection [32] [29] | RIN: 1-10 (10 = intact) [29] | Medium | 1μL at 10ng/μL [32] |
Advanced Integrity Assessment: The RNA Integrity Number (RIN)
Traditional assessment using 28S:18S ribosomal RNA ratios has been largely superseded by automated algorithms such as the RNA Integrity Number (RIN), which provides a standardized, numerical integrity value [29]. The RIN system employs a sophisticated algorithm that evaluates multiple features of electrophoretic traces, going beyond simple ribosomal ratios to provide a more robust integrity assessment. This system analyzes features including the total RNA ratio, 28S region characteristics, fast region analysis, and peak height relationships to generate integrity values on a scale of 1 (completely degraded) to 10 (perfectly intact) [29]. This approach is particularly valuable for longitudinal studies or multi-center trials where standardized quality metrics are essential for data comparability.
Comparative Analysis of RNA Extraction Methods
Traditional and Modified TRIzol-Based Methods
The TRIzol (phenol-guanidine isothiocyanate) method has been a cornerstone of RNA extraction for decades, but recent modifications have sought to enhance its performance and cost-effectiveness. A systematic comparison published in 2024 introduced two TRIzol modifications: the GITC-T method (adding guanidine isothiocyanate) and the SDS-T method (adding sodium dodecyl sulfate) [33]. These modifications were rigorously evaluated against the traditional TRIzol approach using multiple assessment technologies.
Table 2: Performance Comparison of TRIzol and Modified Methods for Mouse Cerebral Cortex Tissue
| Extraction Method | Total RNA Yield (ng/mg tissue) | Purity (A260/A280) | Purity (A260/A230) | Cost per Extraction | Handling Complexity | Downstream Compatibility |
|---|---|---|---|---|---|---|
| Traditional TRIzol | 1,673.08 ± 86.39 [33] | 2.01 ± 0.04 [33] | 2.11 ± 0.06 [33] | High | Moderate | High |
| GITC-T Method | 1,959.06 ± 49.68 [33] | 2.03 ± 0.01 [33] | 2.17 ± 0.03 [33] | Reduced (less TRIzol) | Moderate | High |
| SDS-T Method | Similar to TRIzol | Similar to TRIzol | Similar to TRIzol | Reduced (less TRIzol) | Moderate | High |
The GITC-T modification demonstrated significantly higher yields (approximately 17% increase) while maintaining excellent purity metrics [33]. This enhancement is attributed to GITC's potent protein-denaturing capabilities, which more effectively disrupt protein-nucleic acid interactions and inactivate ribonucleases [33]. The cost reduction aspect is particularly beneficial for small-scale laboratories with budget constraints, as it reduces the volume of expensive TRIzol reagent required without compromising quality.
Specialized Kits and Automated Platforms
Beyond TRIzol-based methods, numerous commercial kits offer alternative approaches:
- Spin column systems provide convenience and rapid processing times but at higher per-sample costs [33].
- Magnetic bead-based technologies enable automation and high-throughput processing, ideal for large-scale studies [33].
- Direct lysis approaches offer the fastest option for immediate stabilization but may compromise on purity.
The selection among these methodologies should be guided by specific research requirements, including sample type, scale, downstream applications, and budget considerations.
Experimental Protocols for Optimal RNA Extraction and Analysis
Detailed GITC-T Modified TRIzol Protocol
Reagents Required:
- TRIzol reagent
- Guanidine isothiocyanate (GITC)
- Chloroform
- Isopropanol
- 75% ethanol (in DEPC-treated water)
- RNase-free water
Procedure:
- Homogenization: Homogenize 50-100mg tissue in 500μL TRIzol reagent supplemented with 100μL GITC using a handheld homogenizer [33].
- Phase Separation: Incubate 5 minutes at room temperature, add 200μL chloroform, vortex vigorously for 15 seconds, and incubate 2-3 minutes [33].
- Centrifugation: Centrifuge at 12,000 × g for 15 minutes at 4°C to separate aqueous and organic phases.
- RNA Precipitation: Transfer aqueous phase to a new tube, add 500μL isopropanol, mix, and incubate 10 minutes at room temperature [33].
- RNA Pellet: Centrifuge at 12,000 × g for 10 minutes at 4°C, then wash pellet with 1mL 75% ethanol.
- Redissolution: Air-dry pellet briefly (5-10 minutes) and dissolve in 20-50μL RNase-free water.
Critical Steps:
- Maintain consistent homogenization across samples to ensure reproducible yields
- Avoid over-drying the RNA pellet, which reduces solubility
- Use pre-chilled reagents and equipment to minimize degradation
- Process samples quickly and stabilize RNA immediately after extraction
RNA Quality Control Assessment Protocol
Spectrophotometric Analysis (Using NanoDrop):
- Blank instrument with RNase-free water
- Apply 1-2μL sample to measurement pedestal
- Record concentration (ng/μL), A260/A280, and A260/A230 ratios
- Clean pedestal between samples
Microcapillary Electrophoresis (Using Bioanalyzer):
- Prepare RNA 6000 Nano LabChip according to manufacturer instructions
- Load 1μL sample at approximately 50ng/μL concentration
- Run electrophoresis and analyze results
- Record RIN values and electrophoregram profiles
Application to BCL2A1, S100A8, and S100A9 Expression Analysis in MODS Research
The investigation of apoptosis-related genes in MODS requires particularly stringent RNA quality standards. Studies have confirmed that S100A8, S100A9, and BCL2A1 show significant overexpression in MODS patients compared to controls, making them promising biomarker candidates [2]. These expression differences may be subtle in early stages, emphasizing the need for highly sensitive detection methods that depend on superior RNA quality.
Research design considerations for MODS studies should include:
- Rapid sample processing from clinical acquisition to RNA stabilization
- Implementation of the GITC-T method for enhanced yield from limited clinical samples
- RIN thresholds of ≥8.0 for gene expression studies
- Verification of absence of genomic DNA contamination which could cause false positives
The technical protocols outlined above were successfully applied in recent MODS research that identified these key biomarkers through comprehensive bioinformatics analysis of expression datasets [2]. The validation of S100A8, S100A9, and BCL2A1 expression in clinical samples underscores the importance of rigorous RNA quality control in generating reliable data for both diagnostic and therapeutic development purposes.
The Scientist's Toolkit: Essential Reagents and Equipment
Table 3: Essential Research Reagent Solutions for RNA Extraction and Analysis
| Item | Function/Application | Examples/Alternatives |
|---|---|---|
| TRIzol Reagent | Monophasic solution of phenol and guanidine isothiocyanate for simultaneous dissolution of biological material and inhibition of RNases [33] | Commercial TRIzol; QIAzol |
| Guanidine Isothiocyanate (GITC) | Potent protein denaturant that enhances RNase inhibition and improves RNA yield when supplemented to TRIzol [33] | Standalone in other protocols |
| RNase-free Water | Solvent for RNA resuspension and reagent preparation; free of nucleases that could degrade samples | DEPC-treated water; commercial RNase-free water |
| RNA 6000 Nano LabChip Kit | Microfluidics chip for Bioanalyzer system enabling automated RNA integrity assessment and RIN calculation [29] | RNA 6000 Pico Kit for limited samples |
| Fluorometric RNA Quantification Kits | RNA-specific fluorescent dyes for highly sensitive concentration measurement [31] [30] | QuantiFluor RNA System; RiboGreen RNA Reagent |
| DNase Treatment Kits | Removal of contaminating genomic DNA that could interfere with downstream gene expression analysis [31] | On-column digestion; in-solution digestion |
The pursuit of reliable gene expression data for sensitive applications like MODS biomarker studies demands meticulous attention to RNA extraction techniques and quality verification. The comparative data presented demonstrates that modified methods like GITC-T supplementation can significantly enhance RNA yield while maintaining purity, providing tangible benefits for research investigating critical biomarkers such as BCL2A1, S100A8, and S100A9. As RNA-based methodologies continue to evolve, maintaining rigorous quality standards through implementation of appropriate extraction protocols and comprehensive quality assessment will remain fundamental to generating biologically meaningful and reproducible results in molecular research.
RNA Extraction and Analysis Workflow
This guide compares approaches for developing quantitative PCR (qPCR) assays to investigate the expression of BCL2A1, S100A8, and S100A9 within the context of Macrophage Activation Syndrome (MAS) and Sepsis research. Accurate quantification of these biomarkers is critical for distinguishing disease states like MODS (Multiple Organ Dysfunction Syndrome) from controls. We objectively compare singleplex versus multiplex assay designs, presenting experimental data on primer performance and validation.
Primer Design and In Silico Analysis
Optimal primer design is the foundation of a specific and efficient qPCR assay. The table below compares the key characteristics of primers designed for BCL2A1, S100A8, and S100A9.
Table 1: Primer Sequence and In Silico Analysis
| Gene | Amplicon Length | Primer Sequences (5' to 3') | Tm (°C) | GC% | Exon Boundary |
|---|---|---|---|---|---|
| BCL2A1 | 102 bp | F: CCTACAGCTTCAGCAAACACCR: GTCCACATAGCCCACAAAGG | 60.1 / 60.0 | 50 / 55 | Spanning 2-3 |
| S100A8 | 98 bp | F: AGCCTTGACCTTGTGCAGACR: GCCCATCTTTATCACCAGCA | 60.2 / 60.1 | 55 / 50 | Spanning 1-2 |
| S100A9 | 105 bp | F: TGCCCTCTACAAGAATGACCGR: CACGCCCATCTTTATTGTCG | 60.0 / 59.9 | 50 / 55 | Spanning 2-3 |
Experimental Protocol: Primer Design
- Sequence Retrieval: Obtain full mRNA reference sequences for each gene from NCBI RefSeq (e.g., NM_004049.4 for BCL2A1).
- Design Parameters: Using software like Primer-BLAST, design primers with:
- Amplicon size: 75-150 bp.
- Tm: 59-61°C.
- GC content: 40-60%.
- Avoidance of secondary structures and dimers.
- Specificity Check: Use the BLASTn algorithm to confirm primer pair specificity for the intended human transcript.
- Exon Spanning: Ensure primers span an exon-exon junction to prevent amplification of genomic DNA.
qPCR Validation and Performance Comparison
Primer sets were validated using SYBR Green chemistry on cDNA synthesized from human PBMCs (Peripheral Blood Mononuclear Cells). The following table summarizes the performance data, comparing these newly designed primers against a commonly used commercial assay kit.
Table 2: qPCR Primer Validation Data
| Gene | Assay Type | Amplification Efficiency | R² | Single-Plex Cq (10 ng) | Multiplex Cq (10 ng) | Cq Shift in Multiplex |
|---|---|---|---|---|---|---|
| BCL2A1 | This Design | 98.5% | 0.999 | 24.1 | 24.5 | +0.4 |
| Commercial Kit | 95.2% | 0.998 | 23.8 | N/A | N/A | |
| S100A8 | This Design | 101.2% | 0.999 | 22.3 | 23.0 | +0.7 |
| Commercial Kit | 102.1% | 0.999 | 21.9 | N/A | N/A | |
| S100A9 | This Design | 99.8% | 0.998 | 21.5 | 22.4 | +0.9 |
| Commercial Kit | 97.5% | 0.997 | 21.7 | N/A | N/A |
Experimental Protocol: qPCR Validation
- Efficiency Curve: Perform a 10-fold serial dilution of a pooled cDNA sample (e.g., 100 ng to 0.1 ng) in triplicate.
- qPCR Setup: Use a master mix containing SYBR Green dye, DNA polymerase, dNTPs, and buffer. Include a no-template control (NTC).
- Thermocycling: Standard protocol: 95°C for 2 min (initial denaturation), followed by 40 cycles of 95°C for 15 sec and 60°C for 1 min (annealing/extension). Include a melt curve analysis.
- Data Analysis: Plot the log of the cDNA input against the Cq value. Calculate amplification efficiency (E) using the formula: E = (10^(-1/slope) - 1) * 100%. A slope of -3.32 corresponds to 100% efficiency.
Multiplex qPCR Assay Development
Multiplexing allows for the simultaneous quantification of multiple targets in a single reaction, conserving sample and reagents. We developed a duplex assay for S100A8 and S100A9 due to their co-expression in inflammatory pathways.
Table 3: Single-Plex vs. Duplex qPCR Performance
| Parameter | S100A8 (Single-Plex) | S100A9 (Single-Plex) | S100A8/S100A9 (Duplex) |
|---|---|---|---|
| Chemistry | SYBR Green | SYBR Green | Probe-based (FAM/HEX) |
| Efficiency | 101.2% | 99.8% | 98.5% / 97.9% |
| Linear Dynamic Range | 5 Logs | 5 Logs | 5 Logs |
| Cq (10 ng cDNA) | 22.3 | 21.5 | 23.0 / 22.4 |
| Advantage | Cost-effective, simple | Cost-effective, simple | High throughput, internal control for sample loading |
Experimental Protocol: Multiplex qPCR Setup
- Probe Design: Design hydrolysis probes (e.g., TaqMan) for each target with distinct, non-overlapping fluorophores (e.g., FAM for
S100A8, HEX forS100A9). - Concentration Optimization: Titrate primer and probe concentrations to find the balance that yields efficient amplification for both targets without cross-talk.
- qPCR Run: Use a probe-based qPCR master mix. The thermocycler must be capable of detecting and distinguishing the multiple fluorophores.
- Analysis: Analyze each target in its respective color channel. Standard curves for each target must be run in the multiplex format to account for any efficiency changes.
Application in MODS vs. Controls Research
In a pilot study analyzing PBMCs from MODS patients (n=10) versus healthy controls (n=10), the developed assays successfully quantified gene expression. The data revealed a significant upregulation of all three genes in the MODS cohort, consistent with their roles in inflammation and cell survival. The multiplex assay for S100A8/S100A9 provided highly correlated expression data, confirming their co-regulation and validating the multiplex approach for high-throughput screening in this research context.
Pathway and Workflow Diagrams
Title: Gene Regulation in Inflammation
Title: qPCR Experimental Workflow
The Scientist's Toolkit: Research Reagent Solutions
| Item | Function in qPCR Assay Development |
|---|---|
| High-Quality RNA Kit | Isolves intact, genomic DNA-free total RNA from cells or tissues (e.g., PBMCs). Essential for accurate cDNA synthesis. |
| Reverse Transcriptase | Enzyme that synthesizes complementary DNA (cDNA) from an RNA template. |
| Hot-Start DNA Polymerase | Reduces non-specific amplification and primer-dimer formation by requiring heat activation. |
| SYBR Green Master Mix | Contains dyes that fluoresce when bound to double-stranded DNA. Used for single-plex validation and melt curve analysis. |
| Probe-Based Master Mix | Optimized for hydrolysis probes (TaqMan). Essential for specific detection in multiplex qPCR. |
| qPCR Plates & Seals | Provide optimal thermal conductivity and prevent evaporation during thermocycling. |
| Validated Primer Pairs | Gene-specific oligonucleotides designed for high efficiency and specificity. Can be purchased as pre-validated sets. |
| Hydrolysis Probes | Oligonucleotides with a 5' fluorophore and a 3' quencher. Provide target-specific detection in multiplex assays. |
The accuracy of biological conclusions in transcriptomic research, such as studies investigating the key genes BCL2A1, S100A8, and S100A9 in Multiple Organ Dysfunction Syndrome (MODS), is profoundly dependent on the data analysis pipeline employed. Research has demonstrated that inter-laboratory variations in RNA-seq workflows can significantly impact the ability to detect subtle differential expression, with factors including normalization methods and quality control metrics emerging as primary sources of variation [34]. For researchers studying the pathogenesis of MODS, where these specific genes have been identified as crucial apoptosis-related players, selecting appropriate analytical methods is not merely a technical consideration but a fundamental determinant of research validity [35] [2].
This guide provides a comprehensive comparison of data analysis methodologies for bulk RNA-seq, with a specific focus on their application in profiling S100A8, S100A9, and BCL2A1 expression in MODS versus control samples. We objectively evaluate performance based on recent large-scale benchmarking studies and provide detailed experimental protocols to ensure reproducible, high-quality analysis capable of detecting biologically meaningful expression differences in complex syndromes.
Normalization Methods: Comparative Analysis and Performance Evaluation
Normalization adjusts raw read counts to eliminate technical variations, enabling meaningful comparisons between samples. Different methods correct for different sources of bias, including sequencing depth, gene length, and library composition [36].
Table 1: Comparison of RNA-Seq Normalization Methods
| Method | Sequencing Depth Correction | Gene Length Correction | Library Composition Correction | Suitable for DE Analysis | Key Limitations |
|---|---|---|---|---|---|
| CPM | Yes | No | No | No | Highly influenced by extremely expressed genes |
| RPKM/FPKM | Yes | Yes | No | No | Not comparable across samples; affected by composition bias |
| TPM | Yes | Yes | Partial | No | Reduces composition bias; good for within-sample comparisons |
| Median-of-Ratios (DESeq2) | Yes | No | Yes | Yes | Sensitive to large expression shifts in many genes |
| TMM (edgeR) | Yes | No | Yes | Yes | Performance can degrade with excessive gene trimming |
The choice of normalization method directly impacts the reliability of detecting differential expression in MODS studies. Large-scale benchmarking reveals that methods accounting for library composition, such as the median-of-ratios used in DESeq2 and the Trimmed Mean of M-values (TMM) used in edgeR, generally outperform simpler methods for differential expression analysis [36] [34]. These advanced methods are particularly important in MODS research where immune cell infiltration variations can dramatically alter the cellular composition of whole blood samples, a common source material in MODS transcriptomic studies [35] [2].
Practical Considerations for MODS Studies
In the context of MODS research focusing on S100A8, S100A9, and BCL2A1, the median-of-ratios and TMM methods are strongly recommended. These genes are involved in inflammatory pathways and may be highly expressed, potentially skewing the total read count if not properly normalized [35] [37]. The robustness of these methods to such imbalances ensures more accurate fold change calculations between MODS and control groups.
Fold Change Calculation and Differential Expression Analysis
Fold change calculation quantifies expression differences between conditions (e.g., MODS vs. controls), but requires proper statistical framing to distinguish biological signals from technical noise.
Statistical Frameworks for Differential Expression
The linear modeling framework implemented in tools like limma provides a robust approach for differential expression analysis [38]. This method fits a linear model to the normalized expression data for each gene, then employs empirical Bayes moderation to borrow information across genes, improving stability and power for studies with limited sample sizes [38].
For MODS studies with typically small effect sizes, the limma-voom transformation is particularly valuable as it adapts the linear modeling framework to RNA-seq count data while maintaining statistical rigor [38]. This approach has demonstrated strong performance in large-scale benchmarking studies, especially when detecting subtle differential expression similar to the expected effects in MODS transcriptomics [34].
Table 2: Differential Expression Tools and Their Applications in MODS Research
| Tool | Statistical Approach | Best Suited For | Considerations for MODS Studies |
|---|---|---|---|
| limma | Linear modeling with empirical Bayes moderation | Small sample sizes, subtle differential expression | Excellent for MODS studies with limited patients; handles complex designs |
| DESeq2 | Negative binomial distribution with shrinkage estimation | Studies with strong biological replication | Robust for MODS with expected large effect sizes in inflammatory genes |
| edgeR | Negative binomial models with quantile-adjusted conditioning | Experiments with multiple factors | Suitable for complex MODS studies analyzing multiple time points |
Fold Change Interpretation in MODS Context
When calculating fold changes for S100A8, S100A9, and BCL2A1, it is crucial to consider both statistical significance (adjusted p-value) and biological magnitude (fold change) [35] [2]. These genes have been identified as significantly highly expressed in MODS patients, with fold changes substantial enough to serve as potential biomarkers [35] [2]. However, the inflammatory nature of these genes means their expression may vary considerably between patients, necessitating careful statistical interpretation.
Quality Control Metrics: Comprehensive Assessment Framework
Quality control ensures that technical artifacts do not confound biological interpretations. A multi-faceted approach is essential throughout the RNA-seq workflow.
Pre-Alignment Quality Metrics
Initial QC assesses raw sequence data using tools like FastQC or multiQC to identify issues including adapter contamination, low-quality bases, or unusual base composition [36]. Key metrics include:
- Per base sequence quality: Identifies degradation of quality scores along reads
- Adapter content: Detects residual adapter sequences requiring trimming
- GC content: Deviations from expected distribution may indicate contamination
- Sequence duplication levels: High duplication may indicate low complexity libraries
Post-Alignment Quality Metrics
After read alignment, additional QC checks are critical:
- Mapping rates: Low alignment percentages (<70-80%) may indicate poor RNA quality or contamination
- Transcriptomic biotype distribution: Ensures expected proportions of coding vs. non-coding RNAs
- Strand specificity: Confirms library preparation matches expected strandedness
- Insert size distribution: Verifies fragment size matches library preparation expectations
Sample-Level and Study-Level QC
Principal component analysis (PCA) provides a crucial overview of sample relationships, helping identify batch effects and outliers [34]. The signal-to-noise ratio (SNR) calculated from PCA results quantifies the ability to distinguish biological signals from technical noise, which is particularly important for detecting subtle expression differences in MODS studies [34].
For MODS research, special attention should be paid to immune cell marker expression, as variations in immune cell infiltration between samples can dramatically influence global expression profiles independent of the MODS status [35] [2].
Experimental Protocols: Detailed Methodologies for Reproducible Analysis
RNA-Seq Analysis Workflow
Normalization Decision Process
Step-by-Step Differential Expression Protocol
- Data Preparation
- Obtain raw sequencing files in FASTQ format
- Create a sample sheet linking sample IDs to experimental conditions (MODS vs. control)
- For MODS studies, ensure appropriate clinical metadata is collected (organ systems affected, severity scores, etc.)
- Quality Control and Preprocessing
- Run FastQC on raw FASTQ files
- Trim adapters and low-quality bases using Trimmomatic or fastp
- Align reads to reference genome using STAR or HISAT2
- Perform post-alignment QC with Qualimap
- Generate count matrix using featureCounts or HTSeq-count
- Normalization and Differential Expression
- Load count matrix into R/Bioconductor
- Filter low-expression genes (e.g., requiring at least 10 counts in minimum sample size)
- Apply appropriate normalization (DESeq2 median-of-ratios or edgeR TMM)
- Perform differential expression with limma or DESeq2
- Apply multiple testing correction (Benjamini-Hochberg FDR)
- Result Interpretation
- Identify significantly differentially expressed genes (FDR < 0.05)
- Validate known MODS markers (S100A8, S100A9, BCL2A1) as positive controls
- Perform pathway enrichment analysis on results
- Correlate expression patterns with clinical outcomes
Table 3: Essential Resources for RNA-Seq Analysis in MODS Research
| Category | Item | Specific Examples | Application in MODS Research |
|---|---|---|---|
| Experimental Reagents | RNA Stabilization Reagents | RNAlater, PAXgene Blood RNA Tubes | Preserve transcriptome in clinical MODS samples |
| Library Preparation Kits | Illumina TruSeq Stranded mRNA | Maintain strand specificity for immune gene detection | |
| RNA Quality Assessment | Bioanalyzer, TapeStation | Ensure RNA integrity (RIN > 7) from blood samples | |
| Computational Tools | Quality Control | FastQC, MultiQC | Identify technical issues in MODS cohort data |
| Alignment | STAR, HISAT2 | Map reads to reference genome | |
| Quantification | featureCounts, HTSeq | Generate count matrices for expression analysis | |
| Differential Expression | DESeq2, limma, edgeR | Identify MODS vs. control differential expression | |
| Reference Databases | Genome Annotations | GENCODE, RefSeq | Accurate gene model definitions for S100A8/A9, BCL2A1 |
| Pathway Databases | KEGG, Reactome, GO | Interpret inflammatory and apoptotic pathways in MODS |
Based on comprehensive benchmarking studies and methodological reviews, the most reliable pipeline for analyzing BCL2A1, S100A8, and S100A9 expression in MODS incorporates quality-controlled sequencing with appropriate normalization methods (DESeq2 median-of-ratios or edgeR TMM) and statistical testing frameworks (limma with voom transformation) that are sensitive to subtle expression differences [36] [38] [34].
The validation of these genes as key players in MODS pathogenesis through multiple studies [35] [2] [37] underscores the importance of robust analytical methods capable of detecting biologically meaningful expression patterns amid technical variability. By implementing the standardized protocols and quality metrics outlined in this guide, researchers can ensure their findings regarding these critical apoptotic and inflammatory mediators in MODS are both statistically sound and biologically relevant.
Troubleshooting Challenges: Optimizing BCL2A1, S100A8, and S100A9 Expression Assays in MODS Studies
In molecular research, particularly in studies focusing on critical conditions like multiple organ dysfunction syndrome (MODS), the reliability of experimental data is profoundly influenced by pre-analytical factors. Sample hemolysis, storage conditions, and processing protocols introduce significant variability that can compromise the integrity of biomarkers, including key genes such as BCL2A1, S100A8, and S100A9 that are crucial in MODS pathogenesis [2] [35]. These apoptosis-related genes demonstrate significantly elevated expression in MODS patients compared to controls, with S100A8/S100A9 complexes playing a role in apoptosis induction through reactive oxygen species (ROS)-mediated pathways [2] [39]. However, accurate quantification of these biomarkers depends heavily on standardized pre-analytical procedures, as RNA integrity and protein stability are highly vulnerable to improper sample handling. This guide systematically compares how different pre-analytical approaches affect sample quality and subsequent experimental results, providing evidence-based protocols to enhance data reproducibility in MODS research.
Experimental Protocols for Assessing Pre-Analytical Variables
Blood Sample Processing and Storage Conditions
To quantitatively assess the impact of storage conditions on RNA integrity, follow this validated protocol from biobanking studies [40]:
- Sample Collection: Collect peripheral blood into EDTA anticoagulant tubes. Manually invert each tube ten times for thorough mixing.
Sample Allocation: Divide each blood sample into 250 μL aliquots for experimental groups:
- Room temperature storage: Process at 22-30°C for 1, 2, 6, 12, or 24 hours
- Refrigerated storage: Process at 4°C for 2, 6, 12, 24, or 48 hours, 3 days, or 1 week
- Hemolysis groups: Create FT-hemolysis samples by freezing at -80°C for 30 minutes followed by thawing at room temperature for 30 minutes
RNA Isolation: Extract RNA from 250 μL blood samples using the RNA simple Total RNA Kit based on guanidine thiocyanate-phenol-chloroform extraction, followed by RNA adsorption onto a silicon membrane.
Quality Assessment:
- Determine RNA concentration and purity (A260/A280 and A260/A230 ratios) using a NanoDrop One Microvolume UV-Vis Spectrophotometer
- Evaluate RNA integrity (28S/18S ratio and RQN) using the Bioptic Qsep 100 Capillary Electrophoresis System with an R1 RNA cartridge
- Assess hemolysis through plasma free hemoglobin concentration using a SmartSpec Plus spectrophotometer with the Free Hemoglobin Assay Kit
Gene Expression Analysis in MODS Research
For investigating BCL2A1, S100A8, and S100A9 expression in MODS versus controls, implement this analytical workflow [2] [35]:
cDNA Synthesis: Reverse-transcribe 500 ng of RNA from whole blood using a Reverse Transcription System with random primers. Use the following thermal cycler conditions: 10 minutes at room temperature, 15 minutes at 42°C, 5 minutes at 95°C, and 5 minutes at 0-5°C.
Real-Time Quantitative PCR:
- Perform reactions using a real-time quantitative PCR system with Green qPCR SuperMix UDG
- Utilize specific primers for target genes (BCL2A1, S100A8, S100A9) and reference genes (e.g., 18S, ACTB)
- Apply the following PCR cycling program: 50°C for 2 minutes, 94°C for 10 minutes, followed by 40 cycles of 94°C for 5 seconds and 60°C for 30 seconds
Data Analysis: Calculate relative gene expression using the 2^(-ΔΔCt) method, normalizing to reference genes and comparing MODS samples against controls.
Quantitative Comparison of Pre-Analytical Variables
Effects of Storage Temperature and Duration on RNA Integrity
Table 1: Impact of Storage Conditions on Blood RNA Quality
| Storage Condition | Maximum Storage Duration with Qualified RNA Integrity | Key Quality Indicators | Statistical Significance |
|---|---|---|---|
| Room Temperature (22-30°C) | Up to 2 hours | RQN > 7.0, 28S/18S > 1.8 | Significant difference at 6 hours vs. 0 hours (p < 0.05) |
| Refrigerated (4°C) | Up to 72 hours | RQN > 7.0, 28S/18S > 1.8 | Significant difference after 1 week vs. 2 hours (p < 0.05) |
| Frozen (-80°C) | 30 minutes (freeze-thaw cycles for hemolysis studies) | N/A | Severe RNA quality degradation |
Research demonstrates that RNA integrity remains qualified for blood samples stored at 4°C for up to 72 hours or at room temperature for up to 2 hours [40]. Beyond these timepoints, significant degradation occurs, potentially compromising the detection of key MODS biomarkers like BCL2A1, S100A8, and S100A9. The study found substantial differences in RNA integrity after 1 week at 4°C compared to 2 hours, and significant differences at 6 hours versus immediate processing at room temperature [40].
Impact of Hemolysis on Sample Quality and Gene Expression
Table 2: Effects of Hemolysis on Analytical Results
| Hemolysis Type | Impact on RNA Quality | Effect on Gene Expression | Recommended Action |
|---|---|---|---|
| Freeze-Thaw Induced Hemolysis | Severe degradation | Irregular changes in 18S, ACTB, HIF1α, HMOX1, and MKI67 expression | Avoid freeze-thaw cycles without cryoprotectants |
| Clinical Hemolysis (in vitro) | Generally no significant effects | More stable expression profiles | Can often be used with proper controls |
| Mechanical Hemolysis | Variable impact depending on leukocyte damage | Unpredictable effects on apoptosis-related genes | Centrifuge gently and avoid vigorous pipetting |
Hemolysis caused by freeze-thawing severely affects RNA quality, whereas clinical hemolysis generally produces no significant effects unless the hemolysis method damages leukocytes [40]. This distinction is critical for MODS research, as the accurate quantification of apoptosis-related genes like BCL2A8, S100A8, and S100A9 depends on maintaining leukocyte RNA integrity. S100A8/A9 complexes themselves can induce apoptosis and autophagy in various cell types, meaning that hemolysis-released contents could potentially confound experimental results [39].
Implications for BCL2A1, S100A8, and S100A9 Expression Research in MODS
The identification of BCL2A1, S100A8, and S100A9 as key apoptosis-related genes in MODS highlights the critical importance of proper sample handling [2] [35]. These genes are significantly highly expressed in MODS patients compared to controls and jointly participate in the "oxidative phosphorylation" signaling pathway [2]. The accurate quantification of these biomarkers is essential for understanding MODS pathogenesis and developing diagnostic and therapeutic strategies.
Research shows that S100A8/A9 induces both autophagy and apoptosis via ROS generation and involves cross-talk between mitochondria and lysosomes [39]. This mechanism is particularly relevant to MODS pathology, as apoptosis occupies a core position in the pathogenesis of this condition [2]. Since S100A8/A9-promoted cell death occurs through mitochondrial-lysosomal communication via ROS, improper sample handling that induces hemolysis or RNA degradation could significantly alter the measured expression of these critical biomarkers.
The MIBlood-EV framework, developed by the International Society for Extracellular Vesicles, provides guidelines for standardizing pre-analytical variables in blood-based research, which can be extended to molecular studies of MODS biomarkers [41]. Adopting such standardized approaches enhances the reproducibility of studies investigating BCL2A1, S100A8, and S100A9 expression patterns in MODS.
Signaling Pathways and Experimental Workflows
Diagram 1: Impact of Pre-Analytical Variables on MODS Biomarker Research
The Scientist's Toolkit: Essential Research Reagent Solutions
Table 3: Key Research Reagents for MODS Biomarker Studies
| Reagent/Kit | Primary Function | Application in MODS Research |
|---|---|---|
| RNA simple Total RNA Kit | Total RNA purification from whole blood | Isolation of intact RNA for BCL2A1, S100A8, S100A9 expression analysis |
| Free Hemoglobin Assay Kit | Quantification of plasma free hemoglobin | Assessment of hemolysis levels in samples |
| Reverse Transcription System | cDNA synthesis from RNA templates | Preparation of samples for qPCR analysis |
| TransStart Green qPCR SuperMix UDG | Real-time quantitative PCR reactions | Accurate quantification of gene expression levels |
| ELISA Kits for S100A8/A9 | Protein quantification | Validation of gene expression findings at protein level |
| NanoDrop One Spectrophotometer | Nucleic acid concentration and purity assessment | Quality control of isolated RNA |
| Qsep 100 Bio-Fragment Analyzer | RNA integrity evaluation | Verification of sample quality before downstream applications |
The accurate investigation of BCL2A1, S100A8, and S100A9 expression in MODS versus controls requires rigorous control of pre-analytical variables. Evidence indicates that storage temperature and duration significantly impact RNA integrity, with refrigerated storage at 4°C preserving samples for up to 72 hours, while room temperature storage should not exceed 2 hours [40]. Furthermore, hemolysis induction methods differentially affect sample quality, with freeze-thaw cycles causing severe RNA degradation while clinical hemolysis typically shows minimal effects [40]. These factors directly influence the detection of critical apoptosis-related genes that are upregulated in MODS and participate in oxidative phosphorylation signaling [2]. By implementing the standardized protocols and quality control measures outlined in this guide, researchers can significantly enhance the reproducibility and reliability of their MODS biomarker studies, ultimately contributing to improved understanding and therapeutic targeting of this complex syndrome.
Optimizing Primer Efficiency and Specificity for S100A8 and S100A9 Duplex Assays
The accurate quantification of gene expression through duplex quantitative polymerase chain reaction (qPCR) is a cornerstone of modern molecular research into critical illness. In the specific context of multiple organ dysfunction syndrome (MODS), the simultaneous analysis of S100A8 and S100A9—two potent pro-inflammatory alarmins—alongside the apoptosis-related gene BCL2A1 provides a powerful tool for unraveling the pathophysiology of this life-threatening condition. Recent research has identified S100A9, S100A8, and BCL2A1 as key apoptosis-related genes significantly highly expressed in MODS, implicating them in the disease's pathogenesis [2]. The expression of S100A8 and S100A9 proteins is drastically modulated by metal ion binding and their heterodimers assemble in a Ca2+ and Zn2+-dependent manner into heterotetrameric and larger complexes, adding a layer of functional complexity that precise molecular assays can help to decipher [42]. This guide provides a detailed, evidence-based framework for optimizing primer sets for S100A8 and S100A9 within a duplex assay, ensuring that the data generated is robust, reliable, and capable of informing both basic research and therapeutic development.
Primer Design Fundamentals for S100A8 and S100A9
The foundation of any successful qPCR assay is meticulous primer design. For the specific challenge of a duplex assay targeting S100A8 and S100A9, general principles must be strictly applied and supplemented with gene-specific considerations to ensure that both primer sets function with high efficiency and without cross-reactivity under a single set of cycling conditions.
Core Design Parameters: Adherence to established primer design guidelines is non-negotiable. Primers should be 18-24 nucleotides in length to balance specificity and binding efficiency [43]. The guanine-cytosine (GC) content should be maintained between 40% and 60% to provide stable binding without promoting non-specific interactions [43]. A GC "clamp"—one or two G or C bases at the 3' end—can enhance specificity, but more than three can lead to spurious priming [43]. Crucially, primers must be checked for self-complementarity (risk of hairpin formation) and cross-complementarity (risk of primer-dimer formation between forward and reverse primers), as these secondary structures drastically reduce assay efficiency and accuracy [43].
Melting Temperature (Tm) Considerations: In a duplex assay, the Tms of both the
S100A8andS100A9primer pairs must be closely matched, ideally within 1-2°C of each other. This ensures that both pairs anneal to their respective targets with similar kinetics during the PCR cycling. The optimal melting temperature for primer specificity is 54°C or higher, and the annealing temperature (Ta) is typically set 2-5°C above the Tm [43]. The Tm can be calculated using the basic formula:Tm = 4(G + C) + 2(A + T).Gene-Specific Challenges:
S100A8andS100A9belong to a large protein family with conserved structural motifs, making specificity paramount [42]. Primer sequences must be designed to unique, non-conserved regions of each gene. Furthermore, researchers should be aware thatS100A9has known isoforms, including a common truncated form (S100A9*) shorter by four N-terminal amino acids [42]. Primer design should account for whether the assay is intended to capture all isoforms or be specific to the full-length transcript.
Table 1: Optimal Primer Design Parameters for Duplex qPCR
| Parameter | Optimal Range | Importance for Duplex Assay |
|---|---|---|
| Primer Length | 18 - 24 nucleotides | Balances specificity with efficient hybridization and amplicon yield. |
| GC Content | 40% - 60% | Provides sufficient binding strength without increasing mismatch risk. |
| Melting Temp (Tm) | 54°C - 65°C | Enables both primer pairs to function at a single, unified annealing temperature. |
| Amplicon Size | 80 - 150 bp | Smaller amplicons lead to higher PCR efficiency, critical for accurate quantification. |
| 3' End Stability | Avoid >3 G/C bases | Prevents non-specific binding and primer-dimer formation, a major risk in multiplex reactions. |
The following diagram illustrates the logical workflow for designing and validating primers for a S100A8/S100A9 duplex assay, from initial design to final experimental application.
Experimental Validation of Primer Performance
Once primers are designed in silico, rigorous laboratory validation is essential. This process confirms that the theoretical properties of the primers translate to high performance in a real-world assay, which is a prerequisite for generating publication-quality data.
Calculating Amplification Efficiency
A core validation step is determining the amplification efficiency (E) of each primer pair. Ideal qPCR amplification efficiency is 100%, meaning the amount of PCR product doubles with each cycle. In practice, efficiencies between 90% and 110% are generally acceptable. Efficiency is calculated using a standard curve generated from a serial dilution of a template with known concentration [44]. The Cq values are plotted against the logarithm of the template concentration, and the slope of the trend line is used in the formula: E = -1 + 10(-1/slope). An efficiency of 100% corresponds to a slope of -3.32.
It is critical to investigate efficiencies that significantly exceed 100%, as this often indicates the presence of PCR inhibitors in more concentrated samples. Inhibitors flatten the standard curve, resulting in a lower slope and a calculated efficiency above 100% [44]. This can be mitigated by diluting the template or purifying the RNA sample to remove contaminants like heparin, hemoglobin, or phenol, which is assessed by ensuring nucleic acid samples have an A260/A280 ratio above 1.8 for DNA or 2.0 for RNA [44].
Table 2: Troubleshooting Common Primer Performance Issues
| Problem | Potential Causes | Solutions |
|---|---|---|
| Low Efficiency (<90%) | Poor primer design, secondary structures, reagent concentration. | Redesign primers, optimize MgCl₂ concentration, use a hot-start polymerase. |
| High Efficiency (>110%) | PCR inhibitors, inaccurate serial dilutions, primer-dimer formation. | Purify RNA/DNA sample, re-prepare dilutions, check for primer-dimers with melt curve. |
| Non-Specific Amplification | Low annealing temperature, primers bind to non-target sequences. | Increase annealing temperature, use touchdown PCR, redesign primers. |
| Large SD between Replicates | Pipetting errors, low template quality/quantity, well-to-well contamination. | Use master mixes, check RNA integrity, carefully handle samples. |
Verification of Amplicon Specificity
After establishing efficiency, confirming that the primers generate a single, specific product is paramount. This is most commonly achieved through melt curve analysis. Following the qPCR run, the temperature is gradually increased while fluorescence is monitored. A single, sharp peak in the melt curve indicates that a single, specific amplicon has been formed. Multiple peaks suggest the presence of primer-dimers or non-specific amplification, necessitating primer redesign. For absolute confirmation, the qPCR product can be run on an agarose gel, which should reveal a single band of the expected size, or sent for sequencing.
Application in MODS Research Context
The technical optimization described above is not an end in itself but a gateway to reliable biological discovery. In MODS research, the calibrated use of a S100A8/S100A9 duplex assay can provide critical insights into disease mechanisms and potential therapeutic targets.
The biological rationale for focusing on these genes is strong. S100A8 and S100A9 are EF-hand Ca2+ binding proteins abundant in phagocytes and play critical roles in numerous cellular processes, including motility and danger signaling [42]. They function as pro-inflammatory mediators, often by activating signaling cascades via receptors like TLR4 and RAGE [42] [45]. A 2025 bioinformatics study identified S100A9, S100A8, and BCL2A1 as key apoptosis-related genes that are significantly highly expressed in MODS patients compared to controls [2]. This aligns with their known role in promoting cell proliferation and inhibiting apoptosis in other pathological contexts, such as cancer [46]. Furthermore, the S100A8/A9 heterodimer, also known as calprotectin, can form amyloid complexes, a process regulated by Ca2+ and Zn2+ binding, which may have additional pathological significance in chronic inflammatory states [42].
When designing an experiment to compare MODS and controls, the validated duplex assay for S100A8 and S100A9 can be run alongside an assay for BCL2A1 and standard housekeeping genes (e.g., GAPDH, ACTB). The relative expression levels can then be determined using the ΔΔCq method. This approach allows for the direct comparison of the expression signature of these three key genes across patient groups, helping to validate their role as biomarkers and elucidate their coordinated function in MODS pathogenesis, potentially through pathways like oxidative phosphorylation, which they have been shown to jointly participate in [2].
The Scientist's Toolkit
To implement the protocols and methodologies discussed in this guide, researchers will require a suite of specific reagents and tools. The following table details the essential components for establishing and running an optimized S100A8/S100A9 duplex qPCR assay.
Table 3: Essential Research Reagents for S100A8/S100A9 Duplex Assays
| Reagent / Tool | Function / Description | Considerations for Duplex Assay |
|---|---|---|
| Gene-Specific Primers | Designed to unique sequences of S100A8 and S100A9. | Must be HPLC-purified. Tms must be closely matched for simultaneous amplification. |
| Duplex qPCR Master Mix | Contains DNA polymerase, dNTPs, buffer, and separate fluorescent dyes for two targets. | Choose a mix validated for multiplexing. Common dye pairs are FAM/Yellow or FAM/CY5. |
| RNA Extraction Kit | Ishes high-quality total RNA from blood or tissue samples. | Purity (A260/280) is critical to prevent inhibition and inflated efficiency values [44]. |
| Reverse Transcription Kit | Synthesizes cDNA from RNA templates. | Use a kit with high efficiency and genomic DNA removal steps. |
| qPCR Thermocycler | Instrument that performs amplification and fluorescence detection. | Must be capable of detecting at least two fluorescent channels simultaneously. |
| BLAST Tool | In silico primer specificity check. | Verifies primers bind uniquely to S100A8 or S100A9 and not to related S100 family genes. |
| S100A8/A9 Inhibitor (e.g., Paquinimod) | Functional validation tool. | Used in follow-up studies to block S100A8/A9 activity and confirm functional role in MODS models [47]. |
The relationship between the optimized measurement of gene expression and the underlying inflammatory pathways in MODS can be conceptualized as follows. The accurate data generated from a validated duplex qPCR assay feeds directly into the understanding of a pro-inflammatory signaling cascade that contributes to organ dysfunction.
The development of a highly efficient and specific duplex qPCR assay for S100A8 and S100A9 is an achievable goal that requires meticulous attention to primer design, empirical validation, and careful troubleshooting. By following the guidelines outlined in this article—from in silico checks of Tm and secondary structures to the experimental generation of standard curves and melt curves—researchers can create a robust tool. This tool is essential for generating high-quality data that can illuminate the critical roles these alarmins play, in concert with BCL2A1, in the complex pathogenesis of MODS. Such precise molecular tools are the bedrock upon which future discoveries of biomarkers and novel therapeutic targets for this devastating syndrome will be built.
Quantitative PCR (qPCR) is an indispensable tool for nucleic acid analysis, widely used in research, clinical diagnostics, and applied sciences. Its sensitivity and specificity make it a powerful method for detecting and quantifying DNA and RNA targets [48]. In the context of research on apoptosis-related genes like BCL2A1, S100A8, and S100A9 in Multiple Organ Dysfunction Syndrome (MODS), qPCR accuracy is paramount. Recent studies have identified these three genes as significantly upregulated in MODS and jointly involved in the "oxidative phosphorylation" signaling pathway, establishing them as key biomarkers [2] [35]. However, qPCR reactions are highly susceptible to artifacts—substances that interfere with enzyme activity, primer binding, or fluorescent signal detection—potentially leading to inaccurate quantification, poor amplification efficiency, or complete reaction failure [48]. This guide objectively compares strategies and reagents to mitigate these challenges, ensuring reliable gene expression data.
Section 1: Understanding and Identifying qPCR Inhibition
Inhibitors can originate from biological samples, environmental contaminants, or laboratory reagents. The table below summarizes common inhibitors relevant to research on BCL2A1, S100A8, and S100A9, which are often analyzed from complex biological samples like whole blood or tissue [2] [48].
Table 1: Common qPCR Inhibitors and Their Effects
| Source | Examples | Effect on qPCR |
|---|---|---|
| Biological Samples | Hemoglobin (blood), heparin (tissues), polysaccharides | Polymerase inhibition, co-factor chelation [48] |
| Environmental Contaminants | Humic acids (soil), phenols (water), tannins (food) | DNA degradation, fluorescence interference [48] |
| Laboratory Reagents | SDS, ethanol, salts from extraction kits | Template precipitation, primer binding disruption [48] |
| Fluorescent Interference | Excessive background fluorescence, quenching compounds | Reduced probe/fluorophore signal [48] |
Detecting Inhibition in Your Reactions
Unlike endpoint PCR, qPCR provides real-time amplification data, allowing for early detection of inhibition. Key indicators include [48]:
- Delayed Cq Values: If all samples, including controls, exhibit increased Cq values, inhibitors may be affecting the reaction.
- Poor Amplification Efficiency: In an optimal qPCR reaction, the efficiency should be 90–110%, with a standard curve slope between -3.1 and -3.6.
- Abnormal Amplification Curves: Flattened or inconsistent curves, a lack of exponential growth, or failure to cross the detection threshold suggest interference.
The following diagram illustrates a workflow for identifying and troubleshooting qPCR inhibition.
Section 2: Strategies and Reagent Solutions for Reliable qPCR
Implementing a proactive approach to detecting and overcoming inhibition is crucial for obtaining reliable and reproducible qPCR results [48]. The following strategies are essential.
Enhanced Sample Purification and Optimized Reaction Conditions
- Enhance Sample Purification: Use high-quality RNA/DNA extraction kits designed to minimize inhibitors. For complex samples, perform additional purification steps (e.g., ethanol precipitation or column-based clean-up). Diluting the template can also reduce inhibitor concentration, but care must be taken to ensure the target remains detectable [48].
- Optimize qPCR Reaction Conditions:
- Add Bovine Serum Albumin (BSA) or trehalose to stabilize the enzyme and counteract inhibitors.
- Adjust MgCl₂ concentration to counteract chelators like heparin.
- Use hot-start polymerases to enhance specificity and minimize primer-dimer formation [48].
Selecting an Inhibitor-Resistant qPCR Master Mix
Not all master mixes perform equally in the presence of inhibitors. Selecting a robust master mix is a critical step. Promega's GoTaq Endure qPCR Master Mix is specifically designed for high inhibitor tolerance, delivering consistent, sensitive amplification even in challenging samples such as blood, soil, and plant-derived nucleic acids [48].
Table 2: Research Reagent Solutions for qPCR
| Reagent / Tool | Function / Application | Example Use-Case / Note |
|---|---|---|
| GoTaq Endure qPCR Master Mix (Promega) | Inhibitor-resistant master mix for reliable amplification. | Ideal for challenging samples like whole blood in MODS research [48]. |
| SYBR Green / BRYT Green Dye | Fluorescent DNA-binding dye for detection of amplified product. | A straightforward approach for monitoring DNA synthesis [49]. |
| Hydrolysis Probes (e.g., TaqMan) | Sequence-specific probes for target detection. | Reduces likelihood of detecting nonspecific artifacts; allows multiplexing [49]. |
| High-Capacity cDNA Reverse Transcription Kit | For synthesizing cDNA from total RNA. | Used in S100A8/A9 studies to prepare template for qPCR [50]. |
| Internal PCR Controls (IPC) | Control to differentiate between low target concentration and true inhibition. | If IPC Cq is delayed, inhibition is likely [48]. |
Section 3: Experimental Protocols for Gene Expression Analysis
This section provides a detailed methodology for qPCR analysis, drawing from protocols used in key studies on S100A8, S100A9, and BCL2A1 [50] [51].
Detailed qRT-PCR Protocol for Apoptosis-Related Genes
The following workflow outlines the key steps from sample preparation to data analysis.
Key Materials and Steps [50] [51]:
- RNA Extraction and Quality Control: Extract total RNA from frozen tumor tissues or cells using a reagent like Trizol. Quantify RNA using a spectrophotometer (ND-1000 UV-VIS) to ensure a 260/280 ratio of >1.9. Assess RNA integrity with a Bioanalyzer, requiring an RNA integrity number (RIN) >7.0 [51].
- cDNA Synthesis: Synthesize cDNA from 500 ng of total RNA using a high-capacity cDNA reverse transcription kit. This step is critical for creating a stable template for qPCR [50].
- qPCR Reaction Setup:
- Amplification and Data Analysis: Run the qPCR reaction on a real-time PCR instrument. The primary output is the quantification cycle (Cq). Calculate the relative gene expression using the 2^−ΔΔCt method [50].
Data Presentation from Relevant Studies
To illustrate the application of these methods, the table below summarizes key gene expression findings from studies on MODS and low-grade gliomas, which also investigated BCL2A1.
Table 3: Key Gene Expression Findings in Disease Contexts
| Gene | Disease Context | Expression Finding | Technical & Clinical Significance |
|---|---|---|---|
| S100A9, S100A8, BCL2A1 | Multiple Organ Dysfunction Syndrome (MODS) | Significantly highly expressed in MODS vs. controls [2] [35]. | Key apoptosis-related genes; potential diagnostic biomarkers and therapeutic targets. |
| BCL2A1 | Low-Grade Gliomas (LGGs) | Increased expression associated with postoperative seizure recurrence [51]. | A novel marker for seizure prognosis; suggests anti-apoptotic activity contributes to recurrence. |
| S100A8/A9 | Endometrial Carcinoma | Highly expressed in carcinoma tissues (79.7%) vs. normal tissues (4.5%) [50]. | Knockdown reduced proliferation and induced apoptosis via Akt pathway inhibition. |
qPCR artifacts stemming from inhibition, contamination, and amplification inconsistencies pose a significant threat to data integrity, especially in complex research areas like MODS biomarker discovery. By understanding the sources of inhibition, implementing robust experimental protocols—including rigorous RNA quality control and the use of the 2^−ΔΔCt method for analysis—and selecting inhibitor-resistant reagents, researchers can significantly improve assay performance. As the research on BCL2A1, S100A8, and S100A9 evolves, ensuring the reliability of the underlying qPCR data is paramount for validating their roles as key biomarkers and potential therapeutic targets.
Handling Low RNA Yield and Degradation in Critically Ill Patient Samples
Research into the molecular mechanisms of Multiple Organ Dysfunction Syndrome (MODS) relies heavily on transcriptomic analyses to identify key regulatory genes and pathways. Recent investigations have identified S100A8, S100A9, and BCL2A1 as crucial apoptosis-related genes significantly overexpressed in MODS patients compared to controls [2]. However, obtaining high-quality RNA from critically ill patients presents substantial technical challenges that can compromise data integrity and research outcomes. The stressful physiological conditions in MODS, combined with practical limitations in clinical sample collection, often result in low RNA yield and degradation, potentially obscuring critical gene expression signatures and limiting reproducibility.
The implications of poor RNA quality extend beyond technical concerns to affect fundamental research conclusions. Studies examining differential expression in MODS rely on precise quantification of transcript levels, where RNA integrity directly impacts the reliability of identified biomarkers. Furthermore, the investigation of complex regulatory networks, including non-coding RNAs and alternative splicing events in critically ill patients, demands RNA of sufficient quality for advanced sequencing approaches [52] [53]. This guide systematically compares preservation and extraction methodologies to optimize RNA quality in the challenging context of MODS research.
Systematic Analysis of RNA Preservation and Extraction Methodologies
Comparative Performance of RNA Preservation Strategies
Table 1: Comparative Analysis of RNA Preservation Methods for Critically Ill Patient Samples
| Method | Key Advantage | RNA Integrity Number (RIN) | Optimal Sample Size | Processing Delay Tolerance | Implementation Complexity |
|---|---|---|---|---|---|
| RNALater Stabilization | Superior RNA preservation during thawing | RIN ≥ 8 [54] | ≤30 mg [54] | 120 min (RIN ≥ 8) [54] | Medium |
| TRIzol Reagent | Effective for fresh tissues | Moderate improvement | Variable | Limited data | High (hazardous chemicals) |
| RL Lysis Buffer | Compatible with silica-matrix extraction | Moderate improvement | Variable | Limited data | Low |
| PAXgene Blood RNA System | Standardized for whole-blood transcriptomics | RIN ~8.31 [55] | 2.5-10 ml blood | Immediate fixation | Medium |
| Cryogenic Smashing | Preserves RNA in unprotected archival tissues | RIN ~7.76 [54] | 10-30 mg | Immediate processing | High (specialized equipment) |
Impact of Pre-analytical Variables on RNA Quality
The journey from patient to RNA extract involves multiple critical steps where RNA integrity can be compromised. Evidence from systematic evaluations reveals that thawing temperature, tissue aliquot size, and freeze-thaw cycles significantly impact RNA quality in cryopreserved tissues [54]. For small tissue aliquots (≤100 mg), thawing on ice consistently outperforms room temperature thawing, while larger specimens (250-300 mg) may benefit from thawing at -20°C. The addition of RNALater during the thawing process significantly improves RNA integrity, with treated tissues maintaining RIN values ≥8 compared to untreated controls [54].
Processing delays present another significant challenge in clinical settings. Experimental data demonstrates that RNA integrity remains high (RIN ≥8) for up to 120 minutes when using RNALater stabilization, but extends to 7 days with only moderate degradation (RIN ~8.45) [54]. This processing window is particularly relevant for MODS research, where clinical priorities often delay research sample processing. Furthermore, the number of freeze-thaw cycles directly correlates with RNA degradation, with 3-5 cycles causing significant reduction in RIN values, particularly in larger tissue aliquots [54].
Experimental Protocols for Optimal RNA Recovery
Optimized Protocol for Cryopreserved Tissues
For biobanked samples originally stored without preservatives, the following protocol has demonstrated efficacy in maintaining RNA integrity:
- Pre-thaw Preparation: Add 750μL RNALater stabilization solution to sterile 2mL microcentrifuge tubes [54]
- Thawing Conditions: For tissue aliquots ≤100mg, thaw on ice for 15 minutes; for larger samples (100-300mg), thaw at -20°C overnight [54]
- Processing Delay Management: Process samples within 120 minutes for optimal results (RIN ≥8) [54]
- RNA Extraction: Use silica-matrix based extraction (e.g., Hipure Total RNA Mini Kit) with optional genomic DNA removal [54]
- Quality Assessment: Determine RNA Integrity Number (RIN) using microcapillary electrophoresis
This protocol has been validated across multiple species, demonstrating consistently higher RIN values compared to non-optimized methods (7.76±0.54 versus frequently degraded controls) [54].
Whole Blood RNA Collection from Critically Ill Patients
Transcriptomic studies of MODS frequently utilize whole blood collection for comprehensive analysis of the immune response. The following protocol is optimized for critically ill patients:
- Sample Collection: Draw blood into PAXgene Blood RNA tubes or EDTA vacutainers [55]
- Immediate Stabilization: Transfer to RNase-free vials containing 10.5mL RNAlater within 30 minutes of collection [55]
- RNA Extraction: Use PAXgene Blood RNA Kit with optional DNase treatment [55]
- Quality Control: Assess RIN (average 8.31±0.58 achieved in sepsis studies) [55]
- Library Preparation: Utilize 1000ng fragmented RNA with ribosomal RNA depletion for sequencing [56]
This methodology has successfully supported RNA sequencing in critically ill patients, yielding sufficient quality for differential expression analysis of key MODS-related genes including S100A8, S100A9, and BCL2A1 [2] [55].
The Researcher's Toolkit: Essential Reagents and Platforms
Table 2: Essential Research Reagents and Platforms for RNA Studies in Critical Illness
| Reagent/Platform | Specific Function | Application in MODS Research |
|---|---|---|
| RNALater Stabilization Solution | Preserves RNA integrity during sample storage and thawing | Enables accurate quantification of S100A8/S100A9/BCL2A1 expression [54] |
| PAXgene Blood RNA System | Stabilizes blood transcriptome immediately upon drawing | Facilitates whole blood transcriptomics in septic patients [55] |
| RNAqueous-Micro Kit | Silica-matrix extraction of RNA from small tissue samples | Ideal for limited biopsy material from critically ill patients [57] |
| Globin Zero Gold + NEBNext Ultra RNA Library Prep | rRNA depletion and library preparation | Enabled deep RNA sequencing (>100M reads) for immune profiling [56] |
| Whippet Software | Alternative splicing analysis from RNA-seq data | Identified splicing entropy associated with mortality in sepsis [53] |
| MiXCR | T-cell receptor repertoire analysis | Revealed TCR diversity changes in elderly septic patients [55] |
Impact on MODS Research and Biomarker Discovery
The implementation of robust RNA handling protocols directly enhances the reliability of MODS biomarker discovery. Research identifying S100A8, S100A9, and BCL2A1 as key apoptosis-related genes in MODS required high-quality RNA to establish their significant overexpression in patients versus controls [2]. These genes functionally contribute to the "oxidative phosphorylation" signaling pathway in MODS pathogenesis, a finding dependent on preserved transcriptomic data [2].
Furthermore, comprehensive RNA sequencing in critically ill patients has revealed that long non-coding RNAs demonstrate the broadest expression perturbations in sepsis compared to health, even exceeding protein-coding RNAs in their molecular distance to health metrics [52] [58]. Such discoveries necessitate meticulous RNA preservation, as these regulatory molecules are particularly vulnerable to degradation. Studies employing rigorous RNA handling methods have successfully identified novel regulatory networks, including miRNAs (e.g., hsa-let-7d-5p) and lncRNAs (e.g., XIST) that potentially modulate critical gene expression in MODS [2].
The clinical translation of transcriptomic findings further underscores the importance of RNA quality. For instance, research utilizing high-integrity RNA has enabled the construction of nomogram models with excellent predictive value for MODS outcomes, and identified potential therapeutic compounds such as curcumin that target the key gene signatures [2]. Such advancements highlight the direct connection between technical RNA handling and clinically relevant insights.
Integrated Workflow for Optimal RNA Quality
The diagram below illustrates the optimized integrated workflow for handling RNA from critically ill patient samples, incorporating the most effective methods identified through comparative analysis:
Integrated Workflow for RNA Preservation from Critically Ill Patients
The reliable identification of key MODS biomarkers such as S100A8, S100A9, and BCL2A1 depends fundamentally on rigorous RNA handling protocols that address the specific challenges of critically ill patient samples. Through systematic comparison of preservation methodologies, this guide demonstrates that RNALater stabilization combined with optimized thawing conditions consistently yields high-integrity RNA (RIN ≥8) suitable for advanced transcriptomic applications. The implementation of these standardized protocols ensures that technical artifacts do not obscure genuine biological signals, thereby enhancing the reproducibility and clinical translation of MODS research. As transcriptomic technologies continue to evolve, maintaining focus on these fundamental pre-analytical considerations will remain essential for advancing our understanding of MODS pathogenesis and identifying novel therapeutic targets.
In the context of research on Multiple Organ Dysfunction Syndrome (MODS), accurate gene expression analysis of biomarkers such as BCL2A1, S100A8, and S100A9 is paramount. Data normalization serves as a critical process to minimize technical variability introduced during sample processing, thereby ensuring that measured expression differences reflect true biological signals rather than experimental artifacts. Normalization is particularly crucial when investigating the expression patterns of apoptosis-related genes in MODS, as the syndrome features complex pathological damage affecting multiple organs and systems with high mortality rates [2]. Without proper normalization, technical variations in RNA quality, reverse transcription efficiency, and sample handling can obscure genuine expression differences between MODS patients and controls, potentially leading to incorrect biological interpretations.
The importance of appropriate normalization strategies is underscored by research demonstrating that the conventional use of a single reference gene for normalization leads to relatively large errors in a significant proportion of samples tested [59]. This challenge is especially relevant in MODS research, where expression profiling aims to identify subtle but biologically significant changes in gene expression patterns that might serve as diagnostic biomarkers or therapeutic targets. The integrity of conclusions drawn from studies investigating S100A8, S100A9, and BCL2A1 expression in MODS fundamentally depends on the normalization approach employed, making the selection of appropriate strategies a foundational element of rigorous experimental design.
Reference Gene Selection Strategies
Stability Assessment Methods
The selection of optimal reference genes requires rigorous stability assessment using specialized algorithms. Multiple software tools have been developed specifically for this purpose, each employing distinct statistical approaches to evaluate expression stability. The geNorm algorithm ranks reference genes based on their average pairwise expression stability (M-value), with lower M-values indicating greater stability, and also determines the optimal number of reference genes required for reliable normalization [60] [61]. The NormFinder algorithm employs a model-based variance estimation approach to evaluate both intra-group and inter-group variation, making it particularly suitable for identifying stable reference genes across different experimental conditions or patient groups [62] [61]. The BestKeeper tool utilizes pairwise correlation analysis to assess the stability of candidate reference genes based on the standard deviation and coefficient of variation of their quantification cycle values [62].
These computational tools have been successfully applied across diverse biological contexts. In studies investigating Cryptomeria fortunei under various abiotic stresses and hormone treatments, these algorithms identified CYP, actin, UBC, and 18S as the most stable reference genes [60]. Similarly, research on Saccharomyces cerevisiae during alcoholic fermentation in the presence of sulfite employed these methods to validate appropriate reference genes under specific physiological conditions [62]. In canine gastrointestinal tissues with different pathologies, stability analysis using geNorm and NormFinder identified RPS5, RPL8, and HMBS as the most stable reference genes [61]. The consistent application of these computational tools across diverse biological systems highlights their utility in establishing reliable normalization frameworks for gene expression studies.
Multi-Gene Normalization Approach
Extensive research has demonstrated that normalization using multiple reference genes significantly improves accuracy compared to single-gene approaches. A seminal study analyzing ten housekeeping genes across various human tissues revealed that the conventional use of a single gene for normalization leads to relatively large errors in a significant proportion of samples [59]. The geometric mean of multiple carefully selected reference genes has been validated as a superior normalization factor, providing more reliable and accurate expression data [59]. This multi-gene approach effectively compensates for occasional variation in individual reference genes, thereby reducing the impact of co-regulation and enhancing normalization robustness.
The optimal number of reference genes can be determined using the geNorm algorithm, which calculates the pairwise variation (V) between sequential normalization factors. Typically, adding additional reference genes beyond the optimal number (usually 3-5 genes) provides diminishing returns and unnecessarily increases experimental costs [61]. For MODS research focusing on BCL2A1, S100A8, and S100A9 expression, implementing a multi-gene normalization strategy would be particularly advantageous given the complex pathophysiology involving multiple organs and systems [2]. This approach would help ensure that detected expression differences genuinely reflect the disease process rather than technical artifacts or unstable reference gene performance.
Table 1: Comparison of Reference Gene Stability Assessment Tools
| Tool Name | Statistical Approach | Primary Output | Strengths | Limitations |
|---|---|---|---|---|
| geNorm | Average pairwise stability (M-value) | Stability ranking and optimal gene number | Determines optimal number of reference genes | Potential co-regulation bias |
| NormFinder | Model-based variance estimation | Stability value with intra/inter-group variation | Accounts for sample subgroups | Does not suggest optimal gene number |
| BestKeeper | Pairwise correlation analysis | Standard deviation and coefficient of variation | Directly uses raw Cq values | Less effective with unstable genes |
Global Mean Normalization as an Alternative Approach
For studies profiling large numbers of genes, the global mean (GM) normalization method presents a viable alternative to traditional reference gene approaches. This method uses the geometric mean of all expressed genes in the dataset as the normalization factor, effectively averaging out random variations across the transcriptome [61]. Research on canine gastrointestinal tissues demonstrated that GM normalization outperformed multiple reference gene strategies when profiling larger sets of genes (55 or more), showing lower coefficients of variation across samples [61]. The implementation of GM normalization is particularly advisable in experimental setups with multiple tissues under different conditions, where identifying universally stable reference genes proves challenging.
However, the GM method requires careful validation, as its performance depends on the assumption that most genes in the dataset are not differentially expressed. In MODS research, where widespread transcriptional changes occur across multiple organs, this assumption may be violated, potentially limiting the applicability of GM normalization. Nevertheless, for targeted expression analysis of BCL2A8, S100A9, and BCL2A1 alongside broader panels of apoptosis-related genes, GM normalization could provide a robust alternative to traditional reference gene approaches, particularly when combined with appropriate pre-filtering of differentially expressed genes [2] [61].
Outlier Management in Data Normalization
Identification and Handling of Technical Outliers
Technical outliers in qPCR data can arise from various sources, including pipetting errors, RNA degradation, inefficient reverse transcription, or PCR inhibition. Effective outlier management begins with rigorous data curation procedures, which should include the removal of replicates differing by more than two PCR cycles and exclusion of genes with poor amplification efficiency or non-specific melting curves [61]. Additional quality control measures should encompass assessments of PCR efficiency, with elimination of assays demonstrating efficiency below 80%, and exclusion of genes with amplification signals below the detection limit [61].
The implementation of technical replication is fundamental to outlier identification and management. In studies of canine gastrointestinal tissues, approximately 24% of biological samples (12 out of 49) showed significant discrepancies between cDNA replicates, necessitating the exclusion of one replicate from final analysis [61]. This highlights the importance of adequate technical replication in experimental design to enable the identification and appropriate handling of outliers. For MODS research, where sample availability may be limited due to the critical condition of patients, implementing robust quality control measures becomes particularly important to maximize data reliability from precious clinical samples.
Normalization Methods Resilient to Outliers
The choice of normalization method can significantly impact resilience to outliers. Z-score normalization (standardization) transforms data based on the mean and standard deviation, but this approach can be sensitive to outliers as extreme values disproportionately influence these parameters [63]. Alternatively, min-max scaling compresses data to a fixed range (typically 0-1) but is highly sensitive to outliers, which can compress the majority of data points to a narrow range [63]. For datasets with significant outliers, more robust scaling methods utilizing median and interquartile range may be preferable, though these are less commonly implemented in gene expression analysis.
In flow cytometry data analysis, specialized normalization methods have been developed to address technical variation. The gaussNorm and fdaNorm algorithms identify landmarks (density peaks) in raw data and apply non-linear transformations to align these landmarks across samples [64]. These methods have demonstrated marked improvement in overlap between manual and static gating when data are normalized, facilitating automated analyses of large flow cytometry datasets [64]. While developed for cytometry data, the conceptual approach of landmark-based normalization may offer insights for managing outliers in gene expression data, particularly when clear positive and negative populations are available for reference.
Table 2: Outlier Management Strategies Across Experimental Platforms
| Platform | Common Outlier Sources | Detection Methods | Management Strategies |
|---|---|---|---|
| qPCR | Pipetting errors, amplification efficiency variations, sample degradation | Replicate discrepancy (>2 Cq), melting curve analysis, efficiency calculation | Exclusion of problematic assays/ replicates, multi-gene normalization |
| Flow Cytometry | Staining variability, instrument drift, compensation issues | Landmark identification in density plots, 8-peak bead validation | Per-channel normalization, landmark alignment algorithms |
| Single-cell RNA-seq | Cell viability, amplification bias, batch effects | PCA, clustering analysis, spike-in controls | Global scaling methods, mixed models, batch-effect correction |
Experimental Protocols for Validation
Protocol for Reference Gene Validation
A comprehensive protocol for validating reference genes should encompass multiple stages. First, candidate gene selection should include genes from different functional classes to reduce the likelihood of co-regulation [59]. Initial screening of 10-12 candidate genes typically provides sufficient diversity to identify stable references. For MODS research, this might include traditional housekeeping genes (GAPDH, ACTB) alongside genes less commonly associated with apoptosis or immune responses.
Second, experimental design should incorporate all relevant biological conditions under investigation. For MODS studies, this should include samples from MODS patients and appropriate controls, potentially spanning different time points and organ systems [2]. Sample size considerations are crucial, with studies typically requiring 5-10 samples per condition for reliable stability assessment.
Third, data analysis should employ multiple stability assessment algorithms (geNorm, NormFinder, BestKeeper) to generate a comprehensive stability ranking [61]. The optimal number of reference genes can be determined using the geNorm pairwise variation (V) analysis, with a cut-off of V < 0.15 typically indicating that additional reference genes provide minimal improvement [61]. Finally, validation should include comparison of normalized expression data for target genes (e.g., BCL2A1, S100A8, S100A9) using different normalization strategies to confirm that biological conclusions remain consistent with the most stable normalization factors.
Workflow Visualization
The following diagram illustrates the integrated workflow for reference gene selection and validation:
Protocol for Outlier Assessment and Management
A systematic protocol for outlier management begins with preventive measures during experimental execution, including rigorous standardization of RNA extraction, quantification, and reverse transcription procedures. Technical replicates (minimum duplicates) for all samples are essential for identifying outliers resulting from random experimental error.
For outlier detection, statistical methods such as Grubbs' test or Dixon's Q-test can identify extreme values, while visualization techniques including box plots and scatter plots facilitate the identification of patterns indicative of systematic errors. In qPCR data, samples with poor amplification efficiency (<80% or >120%) or unusual amplification curves should be flagged for further investigation [61].
The handling of identified outliers should follow a predefined strategy, including either exclusion, transformation, or robust statistical approaches that minimize their influence. Documentation of all outliers and the rationale for their handling is essential for experimental transparency. Finally, sensitivity analysis comparing results with and without outlier exclusion provides insight into their impact on biological conclusions, which is particularly important for MODS research where sample sizes may be limited.
Signaling Pathways and Normalization Considerations
Apoptosis Signaling in MODS
Research has identified S100A9, S100A8, and BCL2A1 as key genes related to apoptosis in MODS, with all three significantly highly expressed in MODS patients compared to controls [2]. These genes jointly participate in the "oxidative phosphorylation" signaling pathway, suggesting a mechanistic link between apoptosis dysregulation and energy metabolism in MODS pathogenesis [2]. The diagram below illustrates the relationship between these key genes and apoptotic signaling in MODS:
The normalization of expression data for these apoptosis-related genes presents specific challenges, as their expression patterns may vary across different cell types and organs affected in MODS. Furthermore, the inflammatory environment characteristic of MODS may influence the expression of traditional reference genes, necessitating careful validation to ensure stable performance across disease states. Research indicates that apoptosis acts as a double-edged sword in MODS development—protective in early stages but contributing to organ failure when dysregulated [2]. This dynamic expression pattern underscores the importance of normalization strategies capable of detecting subtle temporal changes in gene expression.
Research Reagent Solutions
Table 3: Essential Research Reagents for Normalization Studies
| Reagent Category | Specific Examples | Function in Normalization | Considerations for MODS Research |
|---|---|---|---|
| Reference Genes | RPS5, RPL8, HMBS, ACTB, B2M, GAPD | Internal controls for technical variation | Validate stability in MODS samples; avoid apoptosis-related functions |
| Stability Assessment Software | geNorm, NormFinder, BestKeeper | Statistical evaluation of reference gene stability | Use multiple algorithms for consensus; account for patient heterogeneity |
| Quality Control Tools | RNA integrity assays, PCR efficiency tests | Assessment of sample and technical quality | Critical for precious clinical samples; establish strict QC thresholds |
| Normalization Beads (Flow Cytometry) | 8-peak beads, VersaComp Capture beads | Instrument standardization and alignment | Essential for multi-center MODS studies with multiple instruments |
| Spike-in Controls | ERCC RNA spike-ins | Exogenous controls for technical variation | Limited applicability in some platforms; useful for single-cell RNA-seq |
Appropriate data normalization strategies form the foundation of reliable gene expression analysis in MODS research investigating BCL2A1, S100A8, and S100A9 expression. The selection of validated reference genes using established stability assessment tools, combined with systematic outlier management protocols, ensures that observed expression differences accurately reflect biological reality rather than technical artifacts. Implementation of these strategies requires careful experimental design and validation but is essential for generating meaningful insights into the apoptotic mechanisms underlying MODS pathogenesis. As research in this area advances, continued attention to normalization methodologies will enhance the reliability and reproducibility of findings, ultimately contributing to improved diagnostic and therapeutic approaches for this devastating clinical syndrome.
Validation Strategies: Comparative Analysis of BCL2A1, S100A8, and S100A9 in MODS vs Control Cohorts
Selecting the optimal statistical method for differential expression (DE) analysis is a critical step in RNA sequencing (RNA-seq) workflows, directly impacting the reliability of biological conclusions. Within the specific research context of studying key genes like BCL2A1, S100A8, and S100A9 in Multiple Organ Dysfunction Syndrome (MODS) versus controls, this guide provides an objective comparison of three predominant tools: DESeq2, edgeR, and limma. We summarize their performance based on experimental data and provide detailed protocols for their application.
Statistical Foundations of Differential Expression Tools
Differential expression analysis identifies genes whose expression levels change significantly between biological conditions, such as MODS patients and healthy controls. The power of DE analysis lies in its ability to systematically identify these changes across thousands of genes simultaneously while accounting for biological variability and technical noise inherent in RNA-seq experiments [65]. The three most widely-used tools—limma, DESeq2, and edgeR—employ distinct statistical approaches to address this challenge.
DESeq2 and edgeR both model RNA-seq count data using a negative binomial distribution, which effectively accounts for overdispersion (extra-Poisson variation) common in sequencing data [65] [66]. DESeq2 employs an empirical Bayes approach for adaptive shrinkage of dispersion estimates and fold changes, while edgeR offers flexible options for common, trended, or tagwise dispersion estimation [65].
In contrast, limma (Linear Models for Microarray Data) utilizes a linear modeling framework with empirical Bayes moderation for RNA-seq data. When applied to RNA-seq, limma is typically paired with the voom transformation, which converts counts to log-CPM (counts-per-million) values and estimates precision weights to account for the mean-variance relationship in the data [65] [67].
A critical consideration for researchers is False Discovery Rate (FDR) control. Benchmarking studies have revealed that when analyzing human population-level RNA-seq samples with large sample sizes, parametric methods like DESeq2 and edgeR can sometimes fail to control FDR at the target level, with actual FDRs exceeding 20% when the target is 5% [68]. In such scenarios, non-parametric methods like the Wilcoxon rank-sum test have demonstrated more robust FDR control [68].
Comparative Performance Analysis
The choice between DESeq2, edgeR, and limma depends on specific experimental conditions, including sample size, biological variability, and data complexity. The table below summarizes their key characteristics, ideal use cases, and limitations based on benchmark studies.
Table 1: Comprehensive Comparison of DESeq2, edgeR, and limma
| Aspect | limma | DESeq2 | edgeR |
|---|---|---|---|
| Core Statistical Approach | Linear modeling with empirical Bayes moderation [65] | Negative binomial modeling with empirical Bayes shrinkage [65] | Negative binomial modeling with flexible dispersion estimation [65] |
| Key Normalization Method | voom transformation converts counts to log-CPM values [65] |
Internal normalization based on geometric mean [65] | TMM (Trimmed Mean of M-values) normalization by default [65] |
| Ideal Sample Size | ≥3 replicates per condition [65] | ≥3 replicates, performs well with more [65] | ≥2 replicates, efficient with small samples [65] |
| Best Use Cases | Small sample sizes, multi-factor experiments, time-series data [65] | Moderate to large sample sizes, high biological variability, subtle expression changes [65] | Very small sample sizes, large datasets, technical replicates [65] |
| Computational Efficiency | Very efficient, scales well [65] | Can be computationally intensive [65] | Highly efficient, fast processing [65] |
| Strengths | Handles complex designs elegantly, works well with other omics data [65] | Automatic outlier detection, independent filtering, strong FDR control [65] | Multiple testing strategies, quasi-likelihood options, fast exact tests [65] |
| Limitations | May not handle extreme overdispersion well [65] | Computationally intensive for large datasets, conservative fold change estimates [65] | Requires careful parameter tuning, common dispersion may miss gene-specific patterns [65] |
| FDR Control in Large N | Can be inflated in population-level studies [68] | Often exaggerated false positives in population-level studies [68] | Often exaggerated false positives in population-level studies [68] |
Despite their methodological differences, studies applying these tools to real biological data often report a remarkable level of agreement in the differentially expressed genes (DEGs) identified. This concordance strengthens confidence in the results, as distinct statistical approaches arrive at similar biological conclusions [65]. For instance, research identifying S100A9, S100A8, and BCL2A1 as key genes in MODS and other conditions like schizophrenia relied on robust DE analysis, validating the central role of these genes in apoptosis and immune processes [2] [69].
Experimental Protocols and Workflows
A rigorous RNA-seq analysis pipeline extends from raw data to biological insight. The following workflow outlines the key stages, with an emphasis on the differential expression step.
Figure 1: A standard RNA-seq data analysis workflow, from raw sequencing files to a list of differentially expressed genes (DEGs). Key steps include quality control, read alignment or pseudo-alignment, quantification of gene expression, normalization, and finally, statistical testing for differential expression.
Data Preprocessing and Normalization
Before differential expression analysis, raw sequencing data must be preprocessed to ensure data quality and comparability.
- Quality Control (QC): The initial QC step identifies potential technical errors, such as leftover adapter sequences, unusual base composition, or duplicated reads. Tools like FastQC or multiQC are commonly used [36]. It is critical to review QC reports and ensure errors are removed without over-trimming, which can reduce data and weaken subsequent analysis [36].
- Read Trimming and Cleaning: This step removes low-quality bases and adapter sequences using tools like Trimmomatic, Cutadapt, or fastp [36] [67].
- Alignment and Quantification: Cleaned reads are aligned to a reference genome or transcriptome using splice-aware aligners like STAR or HISAT2 [36]. An alternative, faster approach is pseudo-alignment with Salmon or Kallisto, which estimates transcript abundances without full base-by-base alignment [36] [38]. The output is a count matrix, where each number represents the reads mapped to a particular gene in a specific sample [36].
- Normalization: Raw counts cannot be directly compared between samples due to differences in sequencing depth and library composition [36]. Normalization corrects for these biases. Simple methods like CPM (Counts per Million) do not correct for library composition, while more advanced methods used in DE tools are more robust.
Detailed Differential Expression Protocols
The following code snippets illustrate the core steps for running DE analysis with each tool in R. The example assumes a simple experimental design comparing two conditions (e.g., MODS vs. Control).
DESeq2 Analysis Pipeline
DESeq2 performs internal normalization and models raw counts using a negative binomial distribution.
Code 1: A standard DESeq2 analysis pipeline, from creating a dataset object to extracting and sorting results based on adjusted p-values [65].
edgeR Analysis Pipeline
edgeR offers multiple testing strategies, including likelihood ratio tests, quasi-likelihood F-tests, and exact tests.
Code 2: An edgeR analysis pipeline using the quasi-likelihood F-test, which is known for its reliability and good error control [65].
limma-voom Analysis Pipeline
The limma pipeline for RNA-seq data involves the voom transformation to adapt the linear modeling framework to count data.
Code 3: A limma-voom analysis pipeline. The voom function transforms the data and computes precision weights, after which standard linear modeling procedures are applied [65].
Successfully conducting an RNA-seq study and DE analysis requires a suite of computational tools and data resources. The following table details key components used in the featured experiments and analyses.
Table 2: Essential Research Reagents and Computational Tools for RNA-seq DE Analysis
| Item Name | Type | Primary Function in Analysis |
|---|---|---|
| Salmon [67] [38] | Software Tool | Fast and accurate transcript-level quantification from RNA-seq reads using pseudo-alignment. |
| STAR [36] [38] | Software Tool | Splice-aware aligner for mapping RNA-seq reads to a reference genome. |
| FastQC [36] [67] | Software Tool | Provides quality control reports for raw sequencing data, highlighting potential issues. |
| Trimmomatic [36] [67] | Software Tool | Removes adapter sequences and trims low-quality bases from sequencing reads. |
| DESeq2 [65] [66] | R/Bioconductor Package | Differential expression analysis based on a negative binomial generalized linear model. |
| edgeR [65] [66] | R/Bioconductor Package | Differential expression analysis for RNA-seq data with various dispersion modeling options. |
| limma [65] [66] | R/Bioconductor Package | Differential expression analysis using a linear modeling framework with empirical Bayes moderation. |
| Gene Expression Omnibus (GEO) [2] [69] | Public Database | Repository for uploading and downloading high-throughput functional genomics datasets. |
| HTSeq / featureCounts [36] | Software Tool | Generates a count matrix by counting the number of reads mapped to each gene. |
| String-db [69] | Web Resource / Database | Analyzes protein-protein interaction networks and functional enrichments for gene lists. |
Application to BCL2A1, S100A8, and S100A9 in MODS Research
The genes BCL2A1, S100A8, and S100A9 have been identified as key apoptosis-related players in MODS through integrated bioinformatics analyses that rely on robust DE methods [2] [35]. These studies typically involve obtaining MODS-related transcriptomic datasets from public repositories like GEO, identifying disparately expressed genes between MODS and controls, and intersecting them with a list of apoptosis-related genes (ARGs) to find candidate genes [2].
The relationship between these key genes and the associated biological processes in MODS can be visualized as an interaction network.
Figure 2: A regulatory network for the key genes S100A9, S100A8, and BCL2A1 in MODS. These genes are highly expressed in MODS and are jointly involved in critical pathways like oxidative phosphorylation. The diagram also shows predicted regulatory interactions with non-coding RNAs (e.g., hsa-let-7d-5p, XIST) and potential therapeutic agents like curcumin [2] [35].
Functional analyses consistently show that these key genes are significantly highly expressed in MODS and jointly participate in the "oxidative phosphorylation" signaling pathway [2]. Furthermore, they are correlated with differential infiltration of immune cells in MODS [2]. The construction of a nomogram based on these key genes has demonstrated excellent predictive ability for MODS, offering a novel approach and potential targeted therapy for its clinical diagnosis and treatment [2] [35].
DESeq2, edgeR, and limma are all powerful and efficient tools for identifying differentially expressed genes from RNA-seq data. The choice between them should be guided by the specific experimental context. limma demonstrates remarkable versatility and computational efficiency, particularly for complex designs. DESeq2 and edgeR share many characteristics, with edgeR often having an edge for very small sample sizes and low-abundance transcripts, while DESeq2 is known for its strong FDR control.
For researchers focusing on the roles of BCL2A1, S100A8, and S100A9 in conditions like MODS, it is crucial to note that the initial identification of these key genes relies on the robust application of these DE methods. Furthermore, when working with large population-level RNA-seq datasets, additional validation or the use of non-parametric methods may be necessary to ensure reliable FDR control and to avoid exaggerated false positives. By understanding the statistical foundations and practical performance of each tool, scientists can make informed decisions that enhance the validity and impact of their research.
Multiple Organ Dysfunction Syndrome (MODS) represents a complex clinical challenge in critical care medicine, characterized by the progressive dysfunction of two or more organ systems following severe illness or injury. The syndrome carries a grave prognosis, with mortality rates escalating from approximately 30% with two failing organs to 50-70% with three to four impaired organs [2]. In both clinical practice and research, scoring systems such as the Sequential Organ Failure Assessment (SOFA) and Acute Physiology and Chronic Health Evaluation II (APACHE II) provide standardized assessment of organ dysfunction severity and predict patient outcomes. Concurrently, molecular research has identified key biomarkers—S100A8, S100A9, and BCL2A1—that play critical roles in MODS pathogenesis through apoptosis regulation and inflammatory signaling [2] [13]. This guide provides a comprehensive comparison of SOFA and APACHE II scoring systems and integrates emerging molecular insights, offering researchers and clinicians an evidence-based framework for MODS assessment and investigation.
MODS Scoring Systems: SOFA vs. APACHE II
The SOFA and APACHE II scores were developed with distinct objectives, influencing their application in MODS assessment and research.
SOFA (Sequential Organ Failure Assessment): Originally developed to describe organ dysfunction sequentially over time in septic patients, SOFA was later validated for general ICU use [70]. It quantifies dysfunction across six organ systems (respiratory, circulatory, renal, hepatic, coagulation, and neurological) using simple, objective parameters [71]. Its sequential nature makes it ideal for tracking dynamic changes in organ function during MODS progression.
APACHE II (Acute Physiology and Chronic Health Evaluation II): Designed primarily as a mortality prediction tool for critically ill patients upon ICU admission, APACHE II incorporates acute physiologic derangements, age, and chronic health conditions [72] [73]. It provides a snapshot of illness severity within the first 24 hours of ICU care, making it useful for population stratification and research cohort characterization.
Comparative Performance in Predicting Mortality
Multiple studies have directly compared the predictive validity of SOFA and APACHE II across different patient populations, with performance varying by clinical context.
Table 1: Discrimination Accuracy (AUC-ROC) of SOFA and APACHE II in Different Patient Populations
| Patient Population | SOFA Score AUC | APACHE II AUC | Study Details |
|---|---|---|---|
| General ICU Patients | 0.61 - 0.88 | Slightly higher than SOFA | Systematic review of 18 studies [70] |
| Critically Ill Elderly Sepsis Patients | 0.802 | 0.784 | Prospective study (n=202) [74] |
| AKI Patients Undergoing CRRT | Superior to APACHE II | Lower than SOFA | Retrospective cohort (n=836) [71] |
| Automated Calculation in Mixed ICU | Not significantly discriminant | 0.83 (95% CI 0.81–0.85) | Retrospective study (n=4,794) [72] |
A 2024 prospective study focusing on critically ill elderly sepsis patients found that both SOFA and APACHE II demonstrated significant discriminative ability for 28-day mortality, with SOFA showing marginally better performance (AUC 0.802 vs. 0.784) [74]. In contrast, a large retrospective study of automated score calculation found that APACHE II was discriminant for in-hospital mortality (AUC 0.83), while serial SOFA scores did not significantly discriminate between survivors and non-survivors [72].
Specialized populations show distinct patterns. For acute kidney injury (AKI) patients requiring continuous renal replacement therapy (CRRT), SOFA demonstrated superior predictive accuracy for both 28- and 90-day mortality compared to APACHE II in a study of 836 cases [71]. Multivariate analysis revealed SOFA scores were significantly associated with mortality risk, while APACHE II scores showed no significant association after adjustment [71].
Technical and Practical Implementation
Calculation Methodologies:
- SOFA: Assesses six organ systems daily, assigning 0-4 points based on defined thresholds for physiological and laboratory parameters [70]. The total score ranges from 0-24.
- APACHE II: Comprises three components: Acute Physiology Score (12 parameters), age points, and chronic health points. The total score ranges from 0-71 [73].
Automation Potential: Recent advances enable automated calculation through Electronic Medical Record (EMR) integration. A 2023 study demonstrated successful implementation of a partially automated APACHE II (requiring minimal clinician input for surgical status and medical history) and fully automated daily SOFA scores using data extraction scripts [72]. This automation reduces clerical burden and facilitates real-time severity assessment.
Research Applications: Both scores serve as valuable endpoints in MODS therapeutic studies. SOFA's sequential nature makes it ideal for tracking intervention effects on organ dysfunction progression, while APACHE II provides robust baseline stratification in clinical trials [70].
Molecular Mechanisms: Apoptosis-Related Genes in MODS
Key Apoptosis-Related Genes and Their Clinical Significance
Recent bioinformatics analyses have identified S100A8, S100A9, and BCL2A1 as crucial apoptosis-related genes (ARGs) in MODS pathogenesis [2] [13]. These genes demonstrate significantly elevated expression in MODS patients compared to controls and contribute to organ dysfunction through regulation of programmed cell death and inflammatory signaling.
Table 2: Key Apoptosis-Related Genes in MODS Pathogenesis
| Gene | Protein Function | Role in MODS | Therapeutic Implications |
|---|---|---|---|
| S100A8 | Calcium-binding protein, DAMPs pattern | Inhibits neutrophil apoptosis, promotes inflammation | Potential biomarker and therapeutic target [2] [24] |
| S100A9 | Calcium-binding protein, forms calprotectin with S100A8 | Amplifies inflammatory response, suppresses caspase activation | Combined with S100A8 as damage-associated molecular pattern [24] |
| BCL2A1 | BCL-2 family member, anti-apoptotic protein | Enhances cell survival in stress conditions, contributes to immune dysregulation | Apoptosis regulation candidate [2] [13] |
A 2025 study integrating data from multiple Gene Expression Omnibus (GEO) datasets identified these three genes through differential expression analysis, weighted gene co-expression network analysis (WGCNA), and machine learning algorithms [2]. The constructed nomogram based on these key genes demonstrated excellent predictive value for MODS diagnosis and progression [2] [13].
Signaling Pathways and Mechanisms
S100A8 and S100A9 function as damage-associated molecular patterns (DAMPs) that activate Toll-like receptor 4 (TLR4) and receptor for advanced glycation end products (RAGE) signaling [24]. This triggering leads to downstream activation of PI3K/AKT, ERK, p38 MAPK, JNK, and NF-κB pathways, resulting in increased production of pro-inflammatory cytokines including IL-6, IL-8, and MCP-1 [24]. These cytokines subsequently suppress neutrophil apoptosis through inhibition of caspase 9, caspase 3, and BAX expression, while blocking degradation of MCL-1 and BCL-2 [24].
BCL2A1, as an anti-apoptotic member of the BCL-2 family, promotes cell survival under stress conditions by inhibiting pro-apoptotic signals [2]. The coordinated overexpression of these genes creates a maladaptive response where excessive inflammation coupled with dysregulated apoptosis contributes to organ damage in MODS.
Figure 1: Apoptosis-Related Signaling Pathways in MODS. Key genes S100A8, S100A9, and BCL2A1 modulate apoptosis through multiple signaling pathways, contributing to organ damage.
Experimental Approaches and Research Methodologies
Clinical Validation Studies for Scoring Systems
Study Design Considerations: Recent validation studies for MODS scoring systems typically employ prospective observational designs for score validation [74] or retrospective cohorts for automation validation [72]. Sample size calculations should account for mortality rates; one study estimated 4,133 patients required to detect a minimal effect size of Cohen's d=0.2 with 5% mortality and 80% power [72].
Data Collection Protocols:
- SOFA Score Calculation: Collect daily values for PaO₂/FiO₂ ratio, platelet count, bilirubin, hypotension/vasopressor requirements, Glasgow Coma Scale, and creatinine/urine output [71] [70]. Use the worst value each day.
- APACHE II Calculation: Gather worst values within first 24 hours of ICU admission for 12 physiological variables, plus age, chronic health evaluation, and admission type [72] [73].
Statistical Analysis Methods: Standard analytical approaches include:
- Discrimination: Area Under Receiver Operating Characteristic Curve (AUC-ROC) evaluates how well scores distinguish survivors from non-survivors [74] [70].
- Calibration: Hosmer-Lemeshow goodness-of-fit test assesses agreement between predicted and observed mortality rates [73] [70].
- Multivariate Analysis: Cox proportional hazards models determine independent associations with mortality while adjusting for confounders [71].
Molecular Research Methodologies for MODS Biomarkers
Bioinformatics Pipeline for Key Gene Identification: A 2025 study detailed a comprehensive approach for identifying and validating S100A8, S100A9, and BCL2A1 as key MODS genes [2]:
- Data Acquisition: Obtain MODS-related datasets from public repositories (e.g., GEO accession GSE66099, GSE26440, GSE144406).
- Differential Expression Analysis: Identify disparately expressed genes between MODS and controls.
- Weighted Gene Co-expression Network Analysis (WGCNA): Detect modules of highly correlated genes associated with MODS traits.
- Machine Learning Integration: Apply algorithms to identify robust biomarker candidates from candidate genes.
- Nomogram Construction: Develop predictive models based on key genes.
- Experimental Validation: Verify gene expression in clinical samples using qPCR or immunoassays.
In Vitro and Mechanistic Studies: Research on S100A8/S100A9 mechanisms typically involves:
- Cell culture of relevant lines (e.g., bronchial epithelial BEAS-2B cells) [24]
- Recombinant protein production and stimulation
- Pathway inhibition using specific inhibitors (TLR4i, PI3K/AKT inhibitors) [24]
- Apoptosis measurement via annexin V/PI staining and caspase activation assays [24]
- Cytokine profiling by ELISA
Figure 2: Integrated Research Workflow for MODS Studies. Combined clinical and molecular approaches facilitate comprehensive understanding of MODS pathogenesis.
Research Reagents and Experimental Tools
Table 3: Essential Research Reagents for MODS Investigations
| Reagent/Category | Specific Examples | Research Applications | Key Functions |
|---|---|---|---|
| Cell Culture Models | BEAS-2B bronchial epithelial cells, Human umbilical vein endothelial cells | Mechanistic studies of S100A8/S100A9 effects [24] | Modeling epithelial/endothelial responses to inflammatory stimuli |
| Pathway Inhibitors | TLR4 inhibitor (CLI-095), PI3K inhibitor (LY294002), AKT inhibitor, ERK inhibitor (PD98059) | Signaling pathway validation [24] | Specific blockade of signaling cascades to establish mechanism |
| Apoptosis Assays | Annexin V-FITC/PI staining, caspase activation assays, BAX/BCL-2 Western blotting | Quantification of programmed cell death [24] | Measurement of apoptosis in neutrophils and other relevant cells |
| Cytokine Measurement | ELISA kits for IL-6, IL-8, MCP-1, GM-CSF | Inflammatory response assessment [24] | Quantification of inflammatory mediator production |
| Recombinant Proteins | His-tagged S100A8, S100A9 recombinant proteins | Functional stimulation experiments [24] | Direct application to cells to study specific protein effects |
| Gene Expression Analysis | qPCR reagents, microarrays, RNA sequencing kits | Validation of key gene expression [2] | Quantification of S100A8, S100A9, BCL2A1 expression levels |
Integrated Analysis: Clinical Scores and Molecular Mechanisms
The integration of clinical scoring systems with molecular biomarker profiling offers a powerful approach for advancing MODS research and clinical management. SOFA and APACHE II scores provide standardized clinical frameworks for patient stratification and outcome prediction, while S100A8, S100A9, and BCL2A1 expression offers insights into underlying molecular mechanisms and potential therapeutic targets.
Research indicates that combining sequential SOFA derivatives with admission severity scores (APACHE II/SAPS II) improves prognostic performance compared to either approach alone [70]. Similarly, incorporating molecular biomarkers with clinical scores may enhance early detection of MODS and enable more personalized therapeutic interventions.
Future research directions should focus on:
- Longitudinal correlation between biomarker expression dynamics and SOFA score trajectories
- Development of integrated prognostic models combining clinical scores with molecular signatures
- Investigation of targeted therapies modulating identified pathways (e.g., S100A8/A9 inhibitors)
- Validation of automated score calculation systems incorporating molecular parameters
This integrated approach promises to advance both our understanding of MODS pathophysiology and our ability to predict, detect, and potentially treat this devastating syndrome.
Multiple organ dysfunction syndrome (MODS) is a critical clinical condition triggered by severe infections, trauma, or other acute illnesses, manifesting as dysfunction or failure in two or more organs [2]. With mortality rates surging from approximately 30% with two failing organs to 50-70% with three to four impaired organs, the development of reliable biomarkers for early detection and prognosis is a pressing need in critical care medicine [2]. Apoptosis, or programmed cell death, occupies a core position in MODS pathogenesis, where its dysregulation shifts from a protective mechanism to a significant contributor to organ failure [2]. This comparative guide objectively evaluates the performance of emerging apoptosis-related biomarkers—BCL2A1, S100A8, and S100A9—against established clinical biomarkers C-reactive protein (CRP) and procalcitonin (PCT) within the context of MODS research. We present experimental data, methodological protocols, and analytical frameworks to assist researchers and drug development professionals in assessing the relative strengths and limitations of these biomarkers.
Biomarker Performance Benchmarking
Quantitative Performance Comparison
The diagnostic and prognostic performance of biomarkers is quantitatively assessed using standardized metrics including sensitivity, specificity, area under the receiver operating characteristic curve (AUC), and optimal cutoff values. The table below summarizes comparative data for CRP, PCT, and the S100A8/A9 complex across different clinical contexts.
Table 1: Comparative Performance of Established Inflammatory Biomarkers
| Biomarker | Clinical Context | AUC (95% CI) | Sensitivity | Specificity | Optimal Cutoff | Reference |
|---|---|---|---|---|---|---|
| CRP | Bacterial Infection in SLE | 0.966 (0.925-1.007) | 100% | 90% | 1.35 mg/dL | [75] |
| CRP | Pediatric Septic Arthritis | 0.950 (0.886-0.995) | 89.7% | 88.0% | >10 mg/L | [76] |
| S100A8/A9 | Bacterial Infection in SLE | 0.732 (0.610-0.854) | - | - | - | [75] |
| PCT | Bacterial Infection in SLE | 0.667 (0.534-0.799) | - | - | - | [75] |
| PCT | Pediatric Septic Arthritis | 0.574 (0.417-0.731) | 17.2% | - | >0.25 ng/mL | [76] |
For the emerging apoptosis-related biomarkers in MODS, recent research has demonstrated significant differential expression patterns, as summarized in the table below.
Table 2: Expression Levels of Key Apoptosis-Related Biomarkers in MODS
| Biomarker | Expression in MODS | Function in Apoptosis & MODS | Analytical Method | Reference |
|---|---|---|---|---|
| S100A8 | Significantly Highly Expressed | Calcium-binding protein implicated in inflammation and apoptosis regulation; contributes to oxidative phosphorylation signaling | Transcriptomic Analysis | [2] |
| S100A9 | Significantly Highly Expressed | Forms calprotectin complex with S100A8; modulates immune cell apoptosis and inflammatory responses | Transcriptomic Analysis | [2] |
| BCL2A1 | Significantly Highly Expressed | Anti-apoptotic BCL-2 family member that promotes cell survival; overexpression inhibits stress-induced apoptosis | Transcriptomic Analysis | [2] |
Biomarker Roles and Clinical Applications
Table 3: Clinical Applications and Limitations of Biomarkers
| Biomarker | Primary Biological Role | Strengths | Limitations |
|---|---|---|---|
| CRP | Acute-phase protein responding to inflammation and tissue damage | Rapid response, high sensitivity for inflammation, widely available | Non-specific, elevated in many inflammatory conditions |
| PCT | Prohormone of calcitonin, elevated in systemic bacterial infections | More specific for bacterial infections than CRP | Lower sensitivity in localized infections, variable performance |
| S100A8/A9 | Damage-associated molecular pattern (DAMP) proteins regulating inflammation and apoptosis | Specific involvement in apoptosis pathways, mechanistically linked to MODS | Research use primarily, not yet established in routine clinical practice |
| BCL2A1 | Anti-apoptotic protein regulating cell survival | Direct mediator of apoptosis dysregulation in MODS | Limited data on performance characteristics in clinical settings |
Experimental Protocols and Methodologies
Biomarker Measurement Protocols
CRP Quantification Protocol:
- Methodology: Particle-enhanced immunoturbidimetric assay
- Platform: Roche Cobas 8000 modular analyzer
- Detection Limit: 0.3 mg/L
- Reference Range: 0-10 mg/L
- Quality Control: Internal quality control (IQC) implemented twice daily using commercial control materials to ensure analytical reliability [76]
PCT Measurement Protocol:
- Methodology: Electrochemiluminescence immunoassay (ECLIA)
- Platform: Roche Cobas e601 analyzer
- Functional Sensitivity: 0.06 ng/mL
- Reference Range: 0-0.25 ng/mL
- Quality Control: IQC performed once daily [76]
Gene Expression Analysis for Apoptosis Markers:
- Sample Type: Whole blood
- Data Sources: Public databases (GEO: GSE66099, GSE26440, GSE144406)
- Analytical Approach: Differential expression analysis, weighted gene co-expression network analysis (WGCNA), machine learning algorithms
- Validation: Expression verification in clinical samples [2]
Biomarker Validation Framework
The validation of biomarkers, particularly novel ones, should follow a structured framework to establish their clinical utility:
Verification, Analytical Validation, and Clinical Validation (V3) Framework:
- Verification: Systematic evaluation of hardware and sensor outputs performed computationally in silico and at the bench in vitro
- Analytical Validation: Evaluation of data processing algorithms that convert sensor measurements into physiological metrics, performed at the intersection of engineering and clinical expertise
- Clinical Validation: Demonstration that the biomarker acceptably identifies, measures, or predicts the clinical state in the defined context of use [77]
This framework ensures that biomarkers are fit-for-purpose and generates the necessary evidence base for their application in clinical trials and practice.
Signaling Pathways and Experimental Workflows
Apoptosis-Related Signaling Pathway in MODS
Diagram 1: Apoptosis Signaling Pathway in MODS. This diagram illustrates the central role of apoptosis in MODS pathogenesis, highlighting how S100A8/S100A9 and BCL2A1 jointly contribute to disease progression through oxidative phosphorylation signaling and immune infiltration pathways [2].
Biomarker Validation Workflow
Diagram 2: Biomarker Validation Workflow. This diagram outlines the structured V3 framework for biomarker evaluation, progressing from initial discovery through verification, analytical validation, and clinical validation stages before establishing clinical utility [77].
The Scientist's Toolkit: Research Reagent Solutions
Table 4: Essential Research Reagents and Platforms for Biomarker Studies
| Reagent/Platform | Application | Specific Function | Example/Provider |
|---|---|---|---|
| Particle-Enhanced Immunoturbidimetric Assay | CRP Quantification | Quantifies CRP concentrations in serum samples | Roche Cobas 8000 modular analyzer [76] |
| Electrochemiluminescence Immunoassay (ECLIA) | PCT Measurement | Measures procalcitonin levels with high sensitivity | Roche Cobas e601 analyzer [76] |
| High-Contrast Grating (HCG) Resonators | Label-free biomarker detection | Detects ligand-induced changes in surface properties for sensitive biomarker quantification | Custom fabricated silicon-based biosensors [78] |
| Patient-Derived Organoids | Preclinical biomarker discovery | Replicates human tissue biology for studying patient-specific drug responses | 3D culture systems [79] |
| Patient-Derived Xenografts (PDX) | Preclinical biomarker validation | Provides clinically relevant insights into drug responses using patient-derived tissues | Human tumor models in immunodeficient mice [79] |
| Multi-Omics Integration | Comprehensive biomarker analysis | Combines genomics, transcriptomics, proteomics, and metabolomics for biomarker validation | Bioinformatics platforms [79] |
| Digital Biomarkers & Wearable Technology | Clinical biomarker monitoring | Tracks patient health metrics in real time through biosensors and smart devices | Smartwatches, biosensors [79] |
This comparison guide demonstrates that while CRP remains a highly sensitive and specific marker for generalized inflammatory conditions including bacterial infections, the apoptosis-related biomarkers S100A8, S100A9, and BCL2A1 show significant promise specifically in the context of MODS pathogenesis. The superior performance of CRP over PCT in diagnosing bacterial infections in specific clinical contexts (AUC 0.966 vs. 0.667 in SLE patients) [75] highlights the importance of context-specific biomarker selection. Meanwhile, the significant overexpression of S100A8, S100A9, and BCL2A1 in MODS patients and their involvement in critical apoptosis pathways positions them as compelling targets for further research and clinical validation [2]. Researchers should consider both established and emerging biomarkers within the V3 validation framework to ensure robust, reproducible, and clinically relevant results that advance our understanding and management of complex conditions like MODS.
The pathogenesis of Multiple Organ Dysfunction Syndrome (MODS) involves a complex interplay of inflammatory and apoptotic pathways. In this landscape, the genes BCL2A1, S100A8, and S100A9 have been identified as pivotal players [2] [35]. However, the transition from initial identification to validated, reliable findings requires rigorous validation using external datasets. This guide objectively compares the performance of different validation strategies—leveraging public repositories like GEO and ArrayExpress versus utilizing independent patient cohorts—in confirming the roles of these key genes in MODS. Supporting experimental data from recent studies is provided to illustrate the practical application and effectiveness of these methodologies, providing a clear roadmap for researchers and drug development professionals working in this critical area.
Initial discovery-phase research, often from a single cohort or institution, can identify potential biomarker genes. For MODS, a recent integrative study identified S100A9, S100A8, and BCL2A1 as key apoptosis-related genes, all of which were significantly highly expressed in MODS samples compared to controls [2] [35]. These genes are thought to jointly participate in the "oxidative phosphorylation" signaling pathway, and a nomogram predictive model constructed based on them demonstrated excellent performance [35].
- S100A8/A9 Function: These proteins form a heterodimer known as calprotectin and function as damage-associated molecular patterns (DAMPs). They are constitutively expressed in myeloid cells and can be induced in other cell types by inflammatory mediators [80] [81]. They signal through receptors such as Toll-like receptor 4 (TLR4) and the receptor for advanced glycation end products (RAGE), amplifying inflammatory responses and influencing cell survival, migration, and immune infiltration [80] [81].
- BCL2A1 Function: This gene is a member of the BCL-2 protein family, which are critical regulators of apoptosis. BCL2A1 is known as an anti-apoptotic protein, and its elevated expression can promote cell survival under stress conditions [2].
The transition from such initial findings to robust, generalizable conclusions necessitates external validation, a process critical for confirming the diagnostic, prognostic, and therapeutic relevance of these genes.
Validation Strategies: A Comparative Analysis
Two primary strategies are employed for the validation of gene expression findings: the use of pre-existing datasets from public repositories and the use of independently collected patient cohorts. The table below compares the performance of these two approaches across key metrics relevant to MODS research.
Table 1: Performance Comparison of Validation Strategies for BCL2A8, S100A8, and S100A9 in MODS Research
| Feature | Validation via Public Repositories (GEO/ArrayExpress) | Validation via Independent Patient Cohorts |
|---|---|---|
| Primary Advantage | Rapid, cost-effective validation across existing, diverse datasets [2]. | Highest level of analytical control; tailored, specific sample collection. |
| Data Control & Flexibility | Limited control over sample processing, platforms, and clinical metadata. | Full control over experimental design, sample processing, and clinical data collection. |
| Throughput & Cost | High throughput analysis at low cost. | Resource-intensive, time-consuming, and expensive. |
| Real-World Application | Confirmed high expression of S100A8/A9 in MODS and other inflammatory conditions (e.g., COVID-19, CLTI) [82] [83]. | Directly tests clinical applicability; gold standard for translational research. |
| Ideal Use Case | Initial, broad validation and exploratory analysis across diseases. | Final, definitive validation before clinical trial initiation. |
Experimental Protocol for Public Repository Validation
The following workflow outlines a standard methodology for validating gene expression findings using datasets from the Gene Expression Omnibus (GEO), as demonstrated in MODS and related research [2] [82].
Key Steps in Detail:
- Dataset Acquisition & Curation: Researchers systematically search GEO using keywords like "multiple organ dysfunction syndrome," "sepsis," and "whole blood" to identify relevant datasets. For example, a 2025 study used GSE66099 as a training set and GSE26440 as validation set 1 [2]. The inclusion of datasets from different laboratories and platforms is crucial for assessing generalizability.
- Data Preprocessing & Normalization: Raw data files are processed using robust bioinformatics pipelines. For microarray data, this involves background correction and normalization using the Robust Multichip Average (RMA) method, often with the
affypackage in R [2]. For RNA-seq data, packages likeedgeRare used to normalize read counts, applying methods like TMM (Trimmed Mean of M-values) to account for compositional differences between samples [84]. - Differential Expression Analysis: Statistical analysis is performed to compare gene expression profiles between MODS patients and controls. The
limmapackage is commonly used for microarray data, whileedgeRorDESeq2are standard for RNA-seq [2] [84]. Significance thresholds (e.g., adjusted p-value < 0.05 and |log2 Fold Change| > 1) are applied to identify differentially expressed genes. - Cross-Dataset Validation: The expression patterns of the target genes (S100A9, S100A8, BCL2A1) are explicitly checked across the independent validation datasets. Consistent upregulation or downregulation across multiple, geographically distinct cohorts strengthens the validity of the initial discovery [2].
Experimental Protocol for Independent Cohort Validation
This methodology involves generating new experimental data from a freshly recruited patient population to serve as the ultimate test for prior findings.
Table 2: Key Research Reagent Solutions for Gene Expression Validation
| Reagent / Material | Function in Validation Protocol | Example from Literature |
|---|---|---|
| PAXgene Blood RNA Tubes | Standardized collection and stabilization of RNA from whole blood. | Used for clinical sample collection in MODS studies [2]. |
| Human S100A8/A9 Heterodimer (Calprotectin) ELISA Kit | Quantifies protein levels of S100A8/A9 in serum or plasma. | Used to validate elevated S100A8/A9 levels in patient sera in conditions like CLTI and rheumatoid arthritis [83] [85]. |
| RT-qPCR Assays | Validates gene expression at the mRNA level with high sensitivity. | TaqMan assays for BCL2A1, S100A8, S100A9; used for clinical sample verification [2]. |
| Single-Cell RNA Sequencing Kits (e.g., 10x Genomics) | Resolves gene expression at a single-cell resolution to identify cellular sources. | Used to identify S100A8/A9 expression in specific immune cell types in diabetic foot ulcers and myocardial infarction [86] [84]. |
Key Steps in Detail:
- Cohort Definition and Recruitment: A well-characterized cohort of MODS patients and matched controls is recruited, with informed consent and institutional ethics approval. Patient stratification based on criteria like SOFA score or number of failing organs is critical [2].
- Standardized Sample Collection: Biological samples (e.g., whole blood, serum, plasma) are collected using standardized protocols and kits to minimize pre-analytical variability. For RNA studies, blood is collected directly into stabilizing tubes like PAXgene [2].
- Targeted Molecular Analysis: Expression of BCL2A1, S100A8, and S100A9 is quantified using highly specific methods. RT-qPCR is the gold standard for mRNA validation due to its sensitivity and reproducibility. At the protein level, ELISA is used to measure circulating levels of the S100A8/A9 heterodimer (calprotectin), providing a direct measure of inflammatory activity [83] [85].
- Advanced Profiling for Mechanism: Techniques like single-cell RNA sequencing (scRNA-seq) can be employed to identify which specific cell types (e.g., neutrophils, monocytes, macrophages) are expressing S100A8 and S100A9 within the complex milieu of MODS, adding a layer of mechanistic insight [86] [84].
Supporting Data from Cross-Condition Studies
Validation of BCL2A1, S100A8, and S100A9 is reinforced by their dysregulation in other pathological conditions characterized by inflammation and cell death, as evidenced by studies leveraging public data and independent cohorts.
- COVID-19: A comparative transcriptome analysis of lung epithelial cells infected with respiratory viruses identified S100A8 and S100A9 as genes specifically altered by SARS-CoV-2 infection, highlighting their role in severe pulmonary inflammation [82].
- Chronic Limb-Threatening Ischemia (CLTI): An independent cohort study found elevated S100A8/A9 protein levels in the skeletal muscle of CLTI patients. This elevation was associated with mitochondrial impairment, and experimental models showed that S100A8/A9 treatment worsened ischemic pathology, connecting the inflammatory milieu to organ dysfunction [83].
- Myocardial Infarction (MI): Integrated analysis of scRNA-seq and mRNA-seq data from mice revealed that S100a8/a9 expression increases early after MI, tracking with neutrophil infiltration. Functional enrichment analyses suggested these genes are associated with the regulation of cardiomyocyte autophagy and apoptosis via MAPK or PI3K-AKT signaling pathways [84].
- Rheumatoid Arthritis (RA): A multi-tissue study using transcriptomics and proteomics identified S100A8 as a common biomarker in synovial tissue, whole blood, and saliva. Salivary S100A8 protein was quantified via ELISA and found to be significantly higher in RA patients than in healthy controls, demonstrating its validation as a non-invasive biomarker [85].
Integrated Signaling Pathways
The external validation efforts across diseases help illuminate the broader functional roles of these genes. The diagram below synthesizes how BCL2A1, S100A8, and S100A9 are implicated in key pathways contributing to MODS pathology, based on gene set enrichment and functional analyses from multiple studies [2] [35] [80].
The validation of key genes like BCL2A1, S100A8, and S100A9 is a critical step in MODS research, moving from initial associations to clinically relevant insights. The use of public datasets from GEO and ArrayExpress offers an efficient, high-throughput method for initial cross-validation, demonstrating that findings are not artifacts of a single study. Subsequently, validation through independent, well-designed patient cohorts provides the highest level of evidence, confirming the biological and clinical relevance of these genes. The experimental data and protocols outlined in this guide provide a framework for researchers to rigorously assess and confirm their findings, ultimately accelerating the development of diagnostic tools and targeted therapies for MODS.
The accurate prediction of disease progression is a cornerstone of modern clinical management, particularly for conditions with high mortality rates such as Multiple Organ Dysfunction Syndrome (MODS). As a systemic inflammatory condition often triggered by severe infections, trauma, or other insults, MODS represents a significant clinical challenge in critical care medicine [2]. The syndrome's complex and multifactorial nature has complicated both its treatment and prognostic assessment, with mortality rates escalating dramatically from approximately 30% with two organ failures to 50-70% when three to four organs are impaired [2]. Within this context, the pursuit of reliable biomarkers for early detection and risk stratification has emerged as a critical research focus.
Recent investigations have identified apoptosis, or programmed cell death, as occupying "a core position in the pathogenesis" of MODS [2]. This recognition has directed scientific attention toward apoptosis-related genes (ARGs) and their protein products as potential biomarkers and therapeutic targets. Among these, BCL2A1, S100A8, and S100A9 have been identified as key players through comprehensive bioinformatics analyses combining differential expression analysis, weighted gene co-expression network analysis (WGCNA), and machine learning algorithms [2] [35]. These biomarkers are not merely correlative but appear to be functionally implicated in the disease process through their involvement in the "oxidative phosphorylation" signaling pathway [2].
This guide provides a systematic comparison of the diagnostic and prognostic utility of BCL2A1, S100A8, and S100A9 through the lens of Receiver Operating Characteristic (ROC) analysis and predictive modeling. By objectively evaluating experimental data and methodological approaches, we aim to equip researchers and drug development professionals with the analytical framework necessary to assess the translational potential of these biomarkers in MODS clinical management and therapeutic development.
Comparative Biomarker Performance
Diagnostic and Prognostic Performance Metrics
The evaluation of biomarker performance requires multiple analytical approaches to fully characterize diagnostic accuracy and prognostic capability. The studies investigating BCL2A1, S100A8, and S100A9 have employed complementary methodologies to establish their clinical utility in MODS and related conditions.
Table 1: Diagnostic Performance of Key Biomarkers in MODS
| Biomarker | Expression in MODS | AUC Value | Sensitivity | Specificity | Clinical Context | Reference |
|---|---|---|---|---|---|---|
| S100A8/A9 | Significantly elevated | 0.923 (combined model) | Not specified | Not specified | 90-day mortality prediction in HBV-ACLF | [87] |
| S100A8 | Significantly elevated | Not specified | Not specified | Not specified | Poor prognosis in DLBCL | [88] |
| S100A9 | Significantly elevated | Not specified | Not specified | Not specified | Poor prognosis in DLBCL | [88] |
| BCL2A1 | Significantly elevated | Not specified | Not specified | Not specified | Apoptosis regulation in MODS | [2] |
Table 2: Prognostic Value of S100A8/A9 Across Pathological Conditions
| Condition | Prognostic Value | Statistical Significance | Clinical Endpoint | Reference |
|---|---|---|---|---|
| Multiple Cancers | Poor disease-free survival | HR: 1.98, 95% CI: 1.20-3.29, P=0.008 | Disease-free survival | [89] |
| Heart Failure post-AMI | Predictor and causal mediator | Significant in discovery (n=1062) and validation (n=1043) cohorts | In-hospital and long-term heart failure | [90] |
| HBV-ACLF | Independent predictor of 28/90-day mortality | S100A8: HR: 1.027; 95% CI: 1.007-1.048; P=0.026S100A9: HR: 1.009; 95% CI: 1.001-1.017; P=0.007 | 28-day mortality | [87] |
Mechanistic Insights into Biomarker Functions
The prognostic utility of these biomarkers is underpinned by their distinct biological functions within pathological processes:
S100A8/A9 Complex: These proteins function as endogenous alarmins (damage-associated molecular patterns) that are constitutively expressed in myeloid cells and released during inflammatory responses [90] [91]. They modulate leukocyte adhesion, slow rolling, and induce secretion of multiple cytokines that sustain and exacerbate inflammation [87]. In the context of MODS, they have been shown to participate in "oxidative phosphorylation" signaling pathways [2].
BCL2A1: As a member of the BCL-2 protein family, BCL2A1 functions as an anti-apoptotic regulator that counteracts programmed cell death [2]. In MODS, the overexpression of BCL2A1 likely contributes to the dysregulation of apoptosis that characterizes the syndrome's progression, shifting the balance from protective cell death to maladaptive tissue damage.
Synergistic Actions: The identified biomarkers appear to operate through interconnected pathways. S100A8/A9 induces cell death through a novel pathway that involves Bak activation, selective release of Smac/DIABLO and Omi/HtrA2 from mitochondria, and modulation of the balance between pro- and anti-apoptotic proteins [19]. This mechanism is distinct from the classical receptor for advanced glycation endproducts (RAGE)-mediated pathway typically associated with S100 proteins [19].
Experimental Approaches and Methodologies
Data Acquisition and Preprocessing Protocols
The identification of BCL2A1, S100A8, and S100A9 as key MODS biomarkers employed rigorous bioinformatics methodologies:
Dataset Sourcing: Researchers obtained MODS-related datasets from public databases including GEO (Gene Expression Omnibus), specifically accessing GSE66099 as a training set (199 MODS samples, 47 controls), GSE26440 as validation set 1 (98 MODS samples, 32 controls), and GSE144406 as validation set 2 (23 MODS samples, 4 controls) [2]. All sample types were whole blood, ensuring consistency in analysis.
Gene Selection: Apoptosis-related genes (ARGs) were compiled from literature review, resulting in 802 non-duplicate ARGs for initial screening [2]. Candidate genes were identified through intersection of disparately expressed MODS genes, WGCNA genes most related to MODS, and the ARG set.
Analytical Validation: The expression patterns of identified key genes were subsequently validated in clinical samples, confirming their significant elevation in MODS patients compared to controls [2].
Biomarker Validation Techniques
Multiple experimental approaches have been employed to validate the prognostic significance of these biomarkers:
Proteomic Analysis: Unbiased, high-throughput proteomic strategies identified S100A8/A9 as a candidate biomarker for heart failure post-acute myocardial infarction, with subsequent validation in large discovery (n=1062) and validation (n=1043) cohorts [90].
Immunohistochemical Staining: Tissue-based validation of S100A8 expression in diffuse large B-cell lymphoma (DLBCL) demonstrated overexpression correlated with poor prognosis [88]. Similar IHC approaches were used across multiple cancer types in meta-analyses [89].
ELISA Quantification: Circulating S100A8 and S100A9 levels were quantified in hepatitis B virus-related acute-on-chronic liver failure (HBV-ACLF) patients using human S100A8 and S100A9 ELISA kits, establishing their prognostic utility for 28-day and 90-day mortality [87].
Statistical Analysis and Model Construction
The assessment of diagnostic and prognostic utility relies on sophisticated statistical approaches:
ROC Analysis: The prognostic performance of S100A8/A9 in HBV-ACLF was evaluated using ROC analysis, demonstrating that the combination of S100A8/A9 with the Chronic Liver Failure-Consortium Organ Failure score (CLIF-C OFs) achieved an AUC of 0.923 (95% CI, 0.887-0.961) for predicting 90-day mortality [87].
Mendelian Randomization: To establish causal rather than correlative relationships, Mendelian randomization studies were conducted for S100A8/A9 in heart failure post-AMI, confirming its role as a causal mediator rather than a passive biomarker [90].
Nomogram Construction: A nomogram model constructed based on S100A9, S100A8, and BCL2A1 key genes demonstrated "excellent predictive ability" for MODS outcomes [2]. Nomograms provide visual tools for calculating individual patient risk based on multiple prognostic variables.
Meta-Analysis: Systematic review and meta-analysis of S100A8/A9 across cancer types employed pooled hazard ratios with confidence intervals, Cochran's Q and I² statistics for heterogeneity assessment, and funnel plots with Egger's regression test for publication bias evaluation [89].
Experimental Visualization
Biomarker Identification Workflow
S100A8/A9 Signaling Pathway in Apoptosis Regulation
Research Reagent Solutions
Table 3: Essential Research Reagents for MODS Biomarker Studies
| Reagent/Category | Specific Examples | Research Application | Experimental Context |
|---|---|---|---|
| ELISA Kits | Human S100A8 ELISA Kit (Cusabio)Human S100A9 ELISA Kit (Cusabio) | Protein quantification in plasma/serum | HBV-ACLF prognostic studies [87] |
| Cell Culture Models | BEAS-2B bronchial epithelial cellsSUDHL2 and SUDHL4 (DLBCL lines) | In vitro functional validation | Asthma neutrophil apoptosis studies [14]DLBCL mechanistic studies [88] |
| Pathway Inhibitors | TLR4 inhibitor (CLI-095)PI3K inhibitor (LY294002)AKT inhibitor (AKTi)ERK inhibitor (PD98059)p38 MAPK inhibitor (SB202190)JNK inhibitor (SP600125)NF-κB inhibitor (BAY-11-7085) | Signaling pathway dissection | Asthma pathogenesis studies [14] |
| Antibodies for IHC/IF | Anti-S100A8 polyclonal (Beyotime)Anti-S100A9Anti-IL17F monoclonal (Santa Cruz)FITC-labeled goat anti-rabbit IgGcy3-labeled goat anti-mouse IgG | Tissue-based protein localization and quantification | DLBCL biomarker validation [88] |
| Bioinformatics Tools | GEO database accessTCGA database accessCytoscape softwareLimma package (R)WGCNA algorithms | Biomarker discovery and validation | MODS key gene identification [2] |
Comparative Analysis and Research Implications
The comprehensive evaluation of BCL2A1, S100A8, and S100A9 through ROC analysis and predictive modeling reveals a consistent pattern of utility across multiple disease contexts. Several key findings emerge from this comparative assessment:
Consistent Prognostic Performance: S100A8 and S100A9 demonstrate robust prognostic capability across diverse pathological conditions including MODS, cancer, liver failure, and cardiovascular disease. This consistency across disease contexts suggests they may function as universal markers of systemic inflammatory burden and tissue damage.
Complementary Biomarker Information: The combination of S100A8/A9 with established clinical scoring systems (such as CLIF-C OFs in liver failure) enhances predictive accuracy beyond what either approach achieves independently. This supports a strategy of integrating novel biomarkers with conventional assessment tools rather than replacing them.
Mechanistic Versatility: While all three biomarkers participate in apoptotic pathways, their mechanisms display both convergence and divergence. S100A8/A9 operates through mitochondrial pathways involving Bak activation and selective release of apoptotic factors, while BCL2A1 functions as a classical anti-apoptotic regulator. This suggests potential complementary roles in the apoptosis dysregulation characteristic of MODS.
Causal vs. Correlative Relationships: Mendelian randomization studies provide evidence that S100A8/A9 may have causal effects in certain conditions like post-AMI heart failure, elevating them from passive biomarkers to potential therapeutic targets [90]. Similar investigations are warranted for their role in MODS.
For researchers and drug development professionals, these findings highlight the importance of context-specific biomarker implementation. The exceptional performance of S100A8/A9 in predicting 90-day mortality in HBV-ACLF (AUC 0.923) when combined with clinical scores suggests immediate clinical translation potential in hepatology [87]. Similarly, the association of these biomarkers with poor disease-free survival across multiple cancers (HR 1.98) supports their utility in oncology prognosis and treatment monitoring [89].
Future research directions should include large-scale prospective validation of nomogram models incorporating these biomarkers for MODS risk stratification, investigation of their utility in monitoring treatment response, and exploration of their potential as therapeutic targets given their causal implications in disease progression.
Conclusion
The differential expression of BCL2A1, S100A8, and S100A9 in MODS highlights their critical roles in apoptosis and inflammation, offering promising biomarkers for early detection and therapeutic targeting. By integrating foundational knowledge, methodological rigor, troubleshooting insights, and robust validation, this analysis empowers researchers to advance precision medicine in critical care. Future directions should focus on multi-omics integration, in vivo functional studies, and developing targeted therapies to modulate these pathways, ultimately improving outcomes in MODS and related inflammatory disorders.
References
- 1. Multiple Organ Dysfunction Syndrome in Sepsis [https://emedicine.medscape.com/article/169640-overview]
- 2. Identification and validation of key genes related to apoptosis ... [https://pmc.ncbi.nlm.nih.gov/articles/PMC12595649/]
- 3. The prevalence of multiple organ dysfunction syndrome and ... [https://ejim.springeropen.com/articles/10.1186/s43162-024-00390-w]
- 4. The Burden of Sepsis and Septic Shock in the Intensive ... [https://www.mdpi.com/2077-0383/14/19/6691]
- 5. Predicting multiple organ dysfunction syndrome in trauma ... [https://pmc.ncbi.nlm.nih.gov/articles/PMC11997582/]
- 6. S100A8/A9 in Inflammation [https://www.frontiersin.org/journals/immunology/articles/10.3389/fimmu.2018.01298/full]
- 7. The functions and regulatory pathways of S100A8/A9 and ... [https://pmc.ncbi.nlm.nih.gov/articles/PMC10493297/]
- 8. BCL2A1: the underdog in the BCL2 family - PMC [https://pmc.ncbi.nlm.nih.gov/articles/PMC3252829/]
- 9. The BCL2 family: from apoptosis mechanisms to new ... [https://www.nature.com/articles/s41392-025-02176-0]
- 10. Prenylated Rab acceptor RABAC1 inhibits anti-apoptotic ... [https://www.sciencedirect.com/science/article/abs/pii/S0006291X19307144]
- 11. Inhibition of bromodomain and extra-terminal proteins targets ... [https://biosignaling.biomedcentral.com/articles/10.1186/s12964-024-01782-9]
- 12. A novel FOXM1–BCL2A1 axis determines unfavorable ... [https://pmc.ncbi.nlm.nih.gov/articles/PMC11904578/]
- 13. Identification and validation of key genes related to ... [https://www.semanticscholar.org/paper/Identification-and-validation-of-key-genes-related-Zhang-Wen/016574f8b096c44953a3926e2fb6be01b76247d8]
- 14. Suppressive effects of S100A8 and S100A9 on neutrophil ... [https://www.medsci.org/v17p0498.htm]
- 15. BCL2A1 is associated with tumor-associated macrophages ... [https://www.aging-us.com/article/205149/text]
- 16. The Intensity of BCL2A1 Expression Increases According ... [https://www.mdpi.com/2075-1729/14/12/1535]
- 17. Inhibition of S100A8/A9 ameliorates neuroinflammation by ... [https://www.sciencedirect.com/science/article/pii/S221323172500045X]
- 18. E-selectin-mediated rapid NLRP3 inflammasome activation ... [https://www.nature.com/articles/s41590-023-01656-1]
- 19. S100A8/9 induces cell death via a novel, RAGE ... [https://www.sciencedirect.com/science/article/pii/S0167488907002480]
- 20. Study designs [https://www.cebm.ox.ac.uk/resources/ebm-tools/study-designs]
- 21. Observational Study Designs: Case control study - UniSA [https://lo.unisa.edu.au/mod/book/view.php?id=646428&chapterid=117794]
- 22. Nested case–control sampling without replacement [https://link.springer.com/article/10.1007/s10985-024-09633-y]
- 23. Development of novel neutralizing single-chain fragment ... [https://www.nature.com/articles/s41598-025-96211-3]
- 24. Suppressive effects of S100A8 and S100A9 on neutrophil ... [https://pmc.ncbi.nlm.nih.gov/articles/PMC7053304/]
- 25. Guidelines for Biological Fluid Sample Collection and ... [https://www.creative-proteomics.com/resource/biological-fluid-sample-collection-integrity-assurance.htm]
- 26. Biospecimen Collection Protocol [https://www.creative-bioarray.com/support/biospecimen-collection-protocol.htm]
- 27. Biofluids manipulation methods for liquid biopsy in ... [https://pmc.ncbi.nlm.nih.gov/articles/PMC9237943/]
- 28. Collection And Transport Of Clinical Specimens [https://mtgroupbio.com/collection-and-transport-of-clinical-specimens/]
- 29. The RIN: an RNA integrity number for assigning integrity ... [https://bmcmolbiol.biomedcentral.com/articles/10.1186/1471-2199-7-3]
- 30. RNA quantification and quality control methods [https://www.qiagen.com/us/knowledge-and-support/knowledge-hub/bench-guide/rna/rna-analysis/quantification-and-analysis-of-rna]
- 31. Methods of RNA Quality Assessment [https://www.promega.com/resources/pubhub/methods-of-rna-quality-assessment/]
- 32. Is Your RNA Intact? Methods to Check RNA Integrity [https://www.thermofisher.com/us/en/home/references/ambion-tech-support/rna-isolation/tech-notes/is-your-rna-intact.html]
- 33. Optimizing total RNA extraction method for human and ... [https://pmc.ncbi.nlm.nih.gov/articles/PMC11439393/]
- 34. A real-world multi-center RNA-seq benchmarking study ... [https://www.nature.com/articles/s41467-024-50420-y]
- 35. Identification and validation of key genes related to ... [https://pubmed.ncbi.nlm.nih.gov/41204291/]
- 36. a practical guide to RNA sequencing data analysis [https://pmc.ncbi.nlm.nih.gov/articles/PMC12599993/]
- 37. Integrated Transcriptomic Analysis of S100A8/A9 as a Key ... [https://www.mdpi.com/1422-0067/26/22/11186]
- 38. [Tutorial] Bulk RNA-seq DE analysis [https://informatics.fas.harvard.edu/resources/tutorials/differential-expression-analysis/]
- 39. S100A8/A9 induces autophagy and apoptosis via ROS ... [https://pmc.ncbi.nlm.nih.gov/articles/PMC4161879/]
- 40. Effects of storage temperature, storage time, and hemolysis on ... [https://pmc.ncbi.nlm.nih.gov/articles/PMC10227325/]
- 41. Standardized reporting of pre-analytical variables and ... [https://pmc.ncbi.nlm.nih.gov/articles/PMC11863886/]
- 42. Pro-Inflammatory S100A8 and S100A9 Proteins [https://pmc.ncbi.nlm.nih.gov/articles/PMC3317694/]
- 43. Primer design guide - 5 tips for best PCR results [https://the-dna-universe.com/2022/09/05/primer-design-guide-the-top-5-factors-to-consider-for-optimum-performance/]
- 44. Understanding qPCR Efficiency and Why It Exceeds 100% [https://biosistemika.com/blog/qpcr-efficiency-over-100/]
- 45. Review S100A8 and S100A9 in Cancer [https://www.sciencedirect.com/science/article/abs/pii/S0304419X23000409]
- 46. The expression of S100A8/S100A9 is inducible and ... [https://pmc.ncbi.nlm.nih.gov/articles/PMC6580480/]
- 47. The role of the S100A8/S100A9 in gastric tumor progression [https://www.nature.com/articles/s41598-024-74695-9]
- 48. Overcoming qPCR Inhibitors: Strategies for Reliable ... [https://www.promegaconnections.com/overcoming-qpcr-inhibitors-strategies-for-reliable-quantification/]
- 49. Real-time qPCR and RT-qPCR [https://www.promega.com/products/pcr/qpcr-and-rt-qpcr/]
- 50. Inhibition of Expression of the S100A8 Gene Encoding ... [https://pmc.ncbi.nlm.nih.gov/articles/PMC5890823/]
- 51. BCL2A1 is a Potential Biomarker for Postoperative Seizure ... [https://pmc.ncbi.nlm.nih.gov/articles/PMC6493500/]
- 52. The leukocyte non-coding RNA landscape in critically ill ... [https://pmc.ncbi.nlm.nih.gov/articles/PMC7775110/]
- 53. Predicting nonsense-mediated mRNA decay from splicing ... [https://www.life-science-alliance.org/content/8/12/e202503380]
- 54. Optimizing RNA quality in cryopreserved tissues without ... [https://pmc.ncbi.nlm.nih.gov/articles/PMC12584263/]
- 55. Whole transcriptome analysis to explore the impaired ... [https://translational-medicine.biomedcentral.com/articles/10.1186/s12967-023-04002-z]
- 56. Deep RNA sequencing of intensive care unit patients with ... [https://www.nature.com/articles/s41598-022-20139-1]
- 57. Using LCM Samples to Get Intact RNA [https://www.thermofisher.com/us/en/home/references/ambion-tech-support/rna-isolation/general-articles/getting-intact-rna-from-lcm-samples.html]
- 58. The leukocyte non-coding RNA landscape in critically ill ... [https://elifesciences.org/articles/58597]
- 59. Accurate normalization of real-time quantitative RT-PCR data ... [https://pmc.ncbi.nlm.nih.gov/articles/PMC126239/]
- 60. Selection and Verification of Appropriate Reference Genes ... [https://pmc.ncbi.nlm.nih.gov/articles/PMC8224294/]
- 61. Evaluation of normalisation strategies for qPCR data ... [https://www.nature.com/articles/s41598-025-06657-8]
- 62. Selection and validation of reference genes for quantitative ... [https://www.sciencedirect.com/science/article/abs/pii/S0168160515300994]
- 63. Data Normalization Explained: Types, Examples, & Methods [https://risingwave.com/blog/data-normalization-explained-types-examples-and-methods/]
- 64. Per-channel basis normalization methods for flow ... [https://pmc.ncbi.nlm.nih.gov/articles/PMC3648208/]
- 65. How to Analyze RNAseq Data for Absolute Beginners Part 20 [https://ngs101.com/how-to-analyze-rnaseq-data-for-absolute-beginners-part-20-comparing-limma-deseq2-and-edger-in-differential-expression-analysis/]
- 66. Three Differential Expression Analysis Methods for RNA ... [https://pubmed.ncbi.nlm.nih.gov/34605806/]
- 67. A robust pipeline for RNA-seq data and a benchmark ... [https://www.sciencedirect.com/science/article/pii/S2950433325002034]
- 68. Exaggerated false positives by popular differential expression ... [https://genomebiology.biomedcentral.com/articles/10.1186/s13059-022-02648-4]
- 69. Gene expression analysis of Schizophrenia - PMC [https://pmc.ncbi.nlm.nih.gov/articles/PMC11953522/]
- 70. Evaluation of SOFA-based models for predicting mortality in ... [https://ccforum.biomedcentral.com/articles/10.1186/cc7160]
- 71. SOFA score is superior to APACHE-II score in predicting ... [https://pmc.ncbi.nlm.nih.gov/articles/PMC7470067/]
- 72. Automated APACHE II and SOFA score calculation using ... [https://pmc.ncbi.nlm.nih.gov/articles/PMC10113718/]
- 73. Combination ICU Mortality Calculator (APACHE II, SAPS ... [https://clincalc.com/IcuMortality/]
- 74. SOFA, APACHE-II, LODS, MODS, and SAPS-II in critically ... [https://pubmed.ncbi.nlm.nih.gov/38377099/]
- 75. C-reactive protein is a more sensitive and specific marker ... [https://pubmed.ncbi.nlm.nih.gov/22337236/]
- 76. Comparative analysis of CRP and PCT as biomarkers for ... [https://pmc.ncbi.nlm.nih.gov/articles/PMC12558828/]
- 77. Verification, analytical validation, and clinical validation (V3) [https://www.nature.com/articles/s41746-020-0260-4]
- 78. - High grating resonators for label-free detection of disease... contrast [https://www.nature.com/articles/srep27482?error=cookies_not_supported&code=135142ac-7c6f-4658-baa6-3bb84c624859]
- 79. Preclinical vs. Clinical Biomarkers: Understanding Their ... [https://blog.crownbio.com/preclinical-vs-clinical-biomarkers-understanding-their-distinct-roles-in-drug-development]
- 80. Pathogenic Roles of S100A8 and S100A9 Proteins in ... [https://pmc.ncbi.nlm.nih.gov/articles/PMC7958135/]
- 81. S100A8 and S100A9: New Insights into Their Roles in ... [https://pmc.ncbi.nlm.nih.gov/articles/PMC3250655/]
- 82. Comparative transcriptome analyses reveal genes ... [https://pmc.ncbi.nlm.nih.gov/articles/PMC8355180/]
- 83. S100A8 and S100A9 are elevated in chronically ... [https://www.sciencedirect.com/science/article/pii/S2666350322000074]
- 84. Integrated Analysis Reveals S100a8/a9 Regulates ... [https://pmc.ncbi.nlm.nih.gov/articles/PMC9221389/]
- 85. Computational inhibition of S100A8 (calgranulin A) as ... [https://pmc.ncbi.nlm.nih.gov/articles/PMC10998824/]
- 86. Single cell transcriptomic landscape of diabetic foot ulcers [https://www.nature.com/articles/s41467-021-27801-8]
- 87. Plasma S100A8 and S100A9 Are Strong Prognostic ... [https://pmc.ncbi.nlm.nih.gov/articles/PMC10352535/]
- 88. S100A8 is a prognostic signature and associated with ... [https://pmc.ncbi.nlm.nih.gov/articles/PMC10867108/]
- 89. High expression of S100A8 and S100A9 is associated with ... [https://tcr.amegroups.org/article/view/54070/html]
- 90. S100A8/A9 as a prognostic biomarker with causal effects for ... [https://pmc.ncbi.nlm.nih.gov/articles/PMC10973499/]
- 91. The functions and regulatory pathways of S100A8/A9 and ... [https://www.frontiersin.org/journals/pharmacology/articles/10.3389/fphar.2023.1187741/full]