Beyond Simple Signals: How FRET Biosensors Outperform Single-Wavelength Dyes for Dynamic Mitochondrial Membrane Potential Monitoring
This article provides a comprehensive comparison between Förster Resonance Energy Transfer (FRET)-based biosensors and single-wavelength fluorescent dyes for monitoring dynamic changes in mitochondrial membrane potential (ΔΨm), a crucial parameter in...
Beyond Simple Signals: How FRET Biosensors Outperform Single-Wavelength Dyes for Dynamic Mitochondrial Membrane Potential Monitoring
Abstract
This article provides a comprehensive comparison between Förster Resonance Energy Transfer (FRET)-based biosensors and single-wavelength fluorescent dyes for monitoring dynamic changes in mitochondrial membrane potential (ΔΨm), a crucial parameter in cancer metabolism and drug development. We explore the foundational principles of both techniques, detail methodological approaches for implementation in live-cell imaging, and offer practical troubleshooting guidance to overcome common limitations such as photobleaching and low signal-to-noise ratio. By presenting a direct comparative analysis of performance metrics including accuracy, temporal resolution, and suitability for long-term kinetic studies, this review serves as an essential resource for researchers and scientists aiming to implement robust ΔΨm monitoring in their investigative or screening workflows.
The Molecular Rulers: Understanding the Core Principles of FRET and Single-Wavelength Dyes for ΔΨm
Mitochondrial membrane potential (ΔΨm) is a critical physiological parameter essential for cellular energy generation, signaling, and survival. In cancer biology, ΔΨm transcends its traditional role as a mere indicator of mitochondrial health, emerging as a central regulator of oncogenic metabolism, proliferation, and therapeutic resistance. This guide provides a comparative analysis of the primary technologies—FRET-based molecular rulers and single-wavelength potentiometric dyes—for investigating dynamic ΔΨm changes in live cells. We objectively evaluate their performance, supported by experimental data and detailed protocols, to equip researchers with the knowledge to select the optimal methodology for probing the intricate relationship between mitochondrial bioenergetics and cancer progression.
The Fundamental Role of ΔΨm in Cancer Biology
The mitochondrial membrane potential (ΔΨm), typically reaching -180 mV in mammalian cells, is the electrochemical gradient across the inner mitochondrial membrane [1]. This potential is the cornerstone of oxidative phosphorylation (OXPHOS), the process that generates most of the cell's ATP [2] [3]. The flow of electrons through the electron transport chain (ETT) drives protons (H+) into the intermembrane space, creating a proton motive force. The dissipation of this gradient back into the mitochondrial matrix through ATP synthase powers ATP production [3]. In cancer cells, this fundamental process is rewired. While the Warburg effect describes a preference for aerobic glycolysis, functional mitochondria remain crucial for tumor survival [2] [3]. They regulate metabolic pathways, maintain redox balance, and produce biosynthetic precursors. The mitochondrial membrane potential is thus not just a bystander but an active participant in cancer cell adaptability. Loss of ΔΨm is a recognized early event in apoptosis, and its dysregulation is implicated in various cancers, including Alzheimer’s disease and other pathologies [1]. Consequently, precise measurement of ΔΨm provides a window into the metabolic state of cancer cells, offering insights for diagnostic and therapeutic innovation [1] [3].
Methodological Comparison: FRET-Based Probes vs. Single-Wavelength Dyes
The choice of methodology is critical for accurate ΔΨm assessment. The table below compares the core features of FRET-based probes and single-wavelength dyes.
Table 1: Technical Comparison of ΔΨm Measurement Methods
| Feature | FRET-Based Probes | Single-Wavelength Dyes (e.g., TMRM) |
|---|---|---|
| Primary Mechanism | Ratiometric measurement from two probes with ΔΨm-dependent subcellular migration [1] | Potential-dependent accumulation within the mitochondrial matrix [4] |
| Readout Type | Ratiometric (e.g., Acceptor/Donor emission ratio) [1] | Intensity-based [4] |
| Key Advantage | Internal calibration corrects for artifacts, dye concentration, and instrument drift [5] [1] | Direct, well-established protocol; can be used in quenching mode for quantitative assessment [4] |
| Key Limitation | More complex probe design and validation required [1] | Intensity is sensitive to loading efficiency, photobleaching, and cell thickness [4] |
| Spatial Resolution | High, enabled by co-localization of probes [1] | High, reveals mitochondrial morphology [4] |
| Quantitative Precision | High, due to self-referencing ratiometric signal [1] | Moderate; requires careful controls for quantitative work [4] |
| Example Probes | G-1 (donor) & MTR-1 (acceptor) [1] | TMRM, TMRE, JC-1 [4] |
Experimental Data and Performance Benchmarks
The theoretical advantages of each method are borne out in practical application, as the following quantitative data demonstrates.
Table 2: Experimental Performance in Biological Applications
| Application / Parameter | FRET-Based Probes | Single-Wavelength Dye (TMRM) |
|---|---|---|
| Detection of Apoptosis (ΔΨm Loss) | Ratiometric shift (FRET efficiency decrease) upon CCCP treatment visualized dynamically [1] | Significant fluorescence intensity decrease upon CCCP or PA treatment [4] |
| Monitoring Drug Effects | Used to monitor oxidative damage induced by H2O2 in ratiometric manner [1] | Quantified PA-induced lipotoxicity (0.2 mM, 24h) leading to reduced TMRM signal [4] |
| Response to Uncoupler (CCCP) | FRET efficiency collapses as probes separate [1] | Used as a positive control; fluorescence intensity drops markedly [4] |
| Photostability | Dependent on chosen dye pair; can be optimized [5] | Good; protocol includes oxygen scavenging systems to enhance stability [5] [4] |
Detailed Experimental Protocols
Protocol for FRET-Based ΔΨm Measurement
This protocol is adapted from studies using probes like G-1 (donor) and MTR-1 (acceptor) [1].
- Cell Staining: Culture live cells in an appropriate medium. Co-stain cells with both the green-emitting donor probe (e.g., G-1) and the red-emissive acceptor probe (e.g., MTR-1). Both probes, bearing positive charges, will accumulate in mitochondria with high ΔΨm.
- Image Acquisition: Acquire fluorescence images using a confocal or widefield microscope. Excite the donor probe (e.g., at 405 nm) and collect emission from both the donor (green channel, e.g., ~500-550 nm) and the acceptor (red channel, e.g., ~650-700 nm).
- Induction of ΔΨm Loss: Treat cells with an uncoupler such as CCCP (e.g., 10-50 µM) to dissipate ΔΨm. With the loss of ΔΨm, G-1 migrates to other membranous organelles, while MTR-1 redistributes to bind intracellular RNA.
- Image and Data Analysis: Calculate the ratiometric image (Acceptor Intensity / Donor Intensity). In healthy cells with high ΔΨm, the probes are co-localized, FRET occurs, and the ratio is high (strong red, weak green). Upon ΔΨm loss, the probes separate, FRET is blocked, and the ratio decreases (weak red, strong green) [1].
Protocol for Single-Wavelength Dye (TMRM) Staining and Imaging
This protocol is adapted from a high-content screening method for ΔΨm detection [4].
- Cell Preparation: Seed cells (e.g., HepG2) in a 96-well black-walled, clear-bottom plate and culture until ~70-80% confluent.
- Dye Loading and Staining:
- Prepare a working solution of TMRM (e.g., 100 nM) and a nuclear stain like Hoechst 33342 (e.g., 2 µg/ml) in pre-warmed culture medium.
- Remove the cell culture medium and add the staining solution.
- Incubate for 30 minutes at 37°C in the dark.
- Washing: After incubation, gently remove the staining solution and wash the cells 2-3 times with PBS to remove excess dye.
- Image Acquisition: Image the cells immediately using a high-content imager or confocal microscope. For TMRM, use excitation/emission wavelengths of ~549/573 nm. For Hoechst, use ~360/460 nm [4].
- Image Analysis: Use analysis software to identify nuclei (from the Hoechst signal) and define the cytoplasmic region. Measure the average TMRM fluorescence intensity within the cytoplasmic region (which contains the mitochondria). A decrease in intensity indicates a loss of ΔΨm.
Visualizing the Workflows and Mechanisms
FRET-based ΔΨm Sensing Mechanism
The following diagram illustrates the principle of using two probes that undergo ΔΨm-dependent subcellular migration to achieve a ratiometric FRET measurement.
Single-Wavelength Dye (TMRM) Mechanism
This diagram shows the working principle of cationic dyes like TMRM, which accumulate in mitochondria in a ΔΨm-dependent manner.
The Scientist's Toolkit: Essential Research Reagents
A successful ΔΨm experiment relies on a suite of carefully selected reagents and tools.
Table 3: Key Reagents and Materials for ΔΨm Research
| Item | Function/Description | Example Usage |
|---|---|---|
| TMRM (Tetramethylrhodamine Methyl Ester) | Cationic, lipophilic dye that accumulates in active mitochondria; fluorescence intensity indicates ΔΨm [4] | Used at 100-200 nM for 30 min incubation in live cells to stain mitochondria [4] |
| CCCP (Carbonyl Cyanide m-Chlorophenyl Hydrazone) | Protonophore uncoupler that dissipates the proton gradient across the inner mitochondrial membrane, collapsing ΔΨm; used as a positive control [4] | Used at 10-50 µM for 30 min to 1 hour to experimentally induce ΔΨm loss [4] |
| Sodium Palmitate (PA) | Saturated fatty acid used to induce lipotoxicity and mitochondrial dysfunction, leading to loss of ΔΨm [4] | Used at 0.2 mM for 24 hours to model lipid-induced mitochondrial damage in hepatocytes [4] |
| Oxygen Scavenging Systems / Trolox | Chemical systems used to reduce photobleaching and suppress dye blinking by mitigating the effects of reactive oxygen species [5] | Added to imaging buffer to enhance photostability of fluorescent dyes during prolonged microscopy sessions [5] |
| High-Content Screening System (e.g., Operetta CLS) | Automated microscopy platform enabling quantitative, high-throughput imaging of fluorescent signals in multi-well plates [4] | Used to acquire and quantify TMRM fluorescence intensity across hundreds of cells under different treatment conditions [4] |
Both FRET-based probes and single-wavelength dyes offer powerful, yet distinct, approaches to monitoring mitochondrial membrane potential in cancer research. The choice between a ratiometric FRET approach and an intensity-based dye like TMRM depends on the specific research question, required precision, and experimental setup. FRET probes provide superior quantification for detecting subtle dynamics due to their internal control, making them ideal for detailed mechanistic studies of metabolic shifts. In contrast, single-wavelength dyes like TMRM are exceptionally accessible and reliable for high-throughput applications, such as drug screening to identify compounds that modulate mitochondrial function.
Future advancements will likely focus on improving the photostability and brightness of fluorophores for both methodologies [5], developing new probes for multi-parametric imaging (e.g., simultaneous Ca²⁺ and ΔΨm), and deeper integration with high-content and super-resolution imaging platforms. As the role of mitochondrial heterogeneity within tumors becomes increasingly apparent [2], the ability to accurately and dynamically profile ΔΨm will remain a cornerstone of cancer metabolism research, paving the way for novel therapeutic strategies that target the metabolic vulnerabilities of cancer cells.
Förster Resonance Energy Transfer (FRET) is a physical phenomenon that allows for the measurement of distances in the 1-10 nanometer range, a scale critically relevant to biomolecular structures and interactions. Dubbed a "spectroscopic ruler," FRET operates through non-radiative energy transfer from an excited donor fluorophore to an acceptor fluorophore via long-range dipole-dipole coupling [6] [7]. The extraordinary utility of this mechanism lies in its inverse sixth-power dependence on the distance between the donor and acceptor; the efficiency of energy transfer is exquisitely sensitive to small changes in separation, making it a powerful tool for probing dynamic processes in biology and materials science [6] [8]. Within the specific context of monitoring mitochondrial membrane potential (Δψm), FRET-based assays offer a distinct advantage over single-wavelength dyes by providing a rationetric and internally controlled measurement, which is less susceptible to artifacts caused by variations in dye concentration, probe photobleaching, or changes in cell volume [9].
This guide provides a detailed comparison of FRET-based methodologies against single-wavelength dyes, with a focus on applications in dynamic Δψm research. It summarizes key quantitative data, outlines essential experimental protocols, and provides a toolkit for researchers engaged in drug development and fundamental biological research.
The Physical Mechanism of the FRET Ruler
The Governing Equations
The core relationship that establishes FRET as a distance-measuring tool is its efficiency ((E)), which is the probability that an excited donor will transfer its energy to an acceptor rather than releasing it through other pathways like fluorescence or heat. This efficiency is given by:
(E = \frac{1}{1 + (R/R_0)^6}) [6]
Here, (R) is the actual distance between the donor and acceptor, and (R0) is the Förster radius, a characteristic distance for each specific donor-acceptor pair at which the energy transfer efficiency is 50% [6]. The inverse sixth-power relationship means that FRET efficiency decreases extremely rapidly as the distance increases beyond (R0), confining its effective measurement range to approximately 1-10 nm [6] [7].
The Förster radius (R_0) itself is not a fixed value but is calculated from the properties of the fluorophores and their environment:
(R0^6 = \frac{9 \, \ln(10) \, \kappa^2 \, QD \, J}{128 \, \pi^5 \, N_A \, n^4}) [6]
Where:
- (κ^2) = The orientation factor, describing the relative orientation of the donor and acceptor transition dipoles. It typically assumed to be 2/3 for dynamically random orientation [6].
- (Q_D) = The quantum yield of the donor in the absence of the acceptor [6].
- (J) = The spectral overlap integral, measuring the degree of overlap between the donor's emission spectrum and the acceptor's absorption spectrum [6] [8].
- (n) = The refractive index of the medium between the dyes [6].
- (N_A) = Avogadro's number [6].
This diagram illustrates the dipole-dipole coupling and the critical distance relationship that underpin the FRET ruler principle:
Diagram 1: The FRET mechanism involves non-radiative energy transfer from a donor to an acceptor fluorophore, with efficiency governed by a strong inverse sixth-power distance relationship.
Experimental Determination of FRET Efficiency
In practice, FRET efficiency can be measured using several experimental methodologies, each with its own strengths [6].
- Sensitized Emission: The intensity of acceptor emission increases upon donor excitation when FRET occurs. The efficiency can be calculated from the relative intensities: (E = 1 - F{D}'/F{D}), where (F{D}') and (F{D}) are the donor fluorescence intensities in the presence and absence of the acceptor, respectively [6].
- Acceptor Photobleaching: This method intentionally bleaches the acceptor fluorophore. If FRET was occurring, the donor fluorescence intensity will increase post-bleaching because the energy transfer pathway is eliminated. The efficiency is calculated as (E = 1 - τ{pb}/τ{pb}'), where (τ{pb}) and (τ{pb}') are the donor photobleaching time constants in the absence and presence of the acceptor [6].
- Fluorescence Lifetime: The lifetime of the donor's excited state (τ) decreases in the presence of FRET. This provides a very robust measure of efficiency that is independent of fluorophore concentration: (E = 1 - τ{D}'/τ{D}), where (τ{D}') and (τ{D}) are the donor fluorescence lifetimes in the presence and absence of the acceptor, respectively [6].
FRET vs. Single-Wavelength Dyes for Δψm Monitoring: A Quantitative Comparison
Monitoring changes in mitochondrial membrane potential (Δψm) is crucial for assessing cellular health, metabolic state, and the mode of action of drugs. Here, we objectively compare the performance of FRET-based dyes with single-wavelength, potentiometric dyes like Rhodamine 123 and TMRM [9].
Table 1: Performance Comparison of FRET-based and Single-Wavelength Dyes for Δψm Monitoring
| Feature | FRET-based Dyes | Single-Wavelength Dyes (e.g., TMRM, Rhodamine 123) |
|---|---|---|
| Measurement Type | Ratiometric (internal reference) [9] | Intensity-based (no internal reference) [9] |
| Key Advantage | Reduced artifacts from dye concentration, photobleaching, or instrument drift [9] | Simpler experimental setup and data analysis [9] |
| Sensitivity to Δψm | High; relies on potential-dependent dye redistribution altering FRET efficiency [9] | High; relies on potential-dependent accumulation and fluorescence quenching/ enhancement [9] |
| Temporal Resolution | Excellent, suitable for tracking rapid potential changes [9] | Excellent for fast electrochromic dyes; good for others [9] |
| Spatial Resolution | High, can be combined with confocal or two-photon microscopy [9] | High, compatible with high-resolution microscopy [9] |
| Primary Limitation | More complex probe design and implementation; requires two fluorophores [9] | Susceptible to artifacts from unequal dye loading, leakage, and photobleaching [9] |
| Typical Dye Pairs/Examples | DiSBAC(_4)(3)-CC2-DMPE [9] | TMRM, Rhodamine 123, JC-1 (a rationetric dye) [9] |
Experimental Protocols for Key Applications
Protocol: smFRET for Studying Biomolecular Dynamics
Single-molecule FRET (smFRET) pushes the technique to its limits, allowing observation of structural heterogeneities and dynamics in individual biomolecules that are masked in ensemble measurements [5].
Workflow Overview:
Diagram 2: A generalized workflow for a single-molecule FRET experiment to study biomolecular dynamics.
Detailed Methodology:
- Sample Preparation and Labeling: The molecule of interest (e.g., DNA, RNA, protein) is site-specifically labeled with a donor (e.g., Cy3, Alexa 555) and an acceptor (e.g., Cy5, Alexa 647) fluorophore using appropriate conjugation chemistries [5]. Purity of the labeled species is critical.
- Surface Passivation and Immobilization (for immobilized studies): For prolonged observation, molecules are tethered to a microscope slide coated with a polymer (e.g., PEG) to prevent non-specific adsorption of biomolecules and dyes. A biotin-streptavidin bridge is commonly used for specific immobilization [5].
- Data Acquisition with Alternating Laser Excitation (ALEX): A confocal or Total Internal Reflection Fluorescence (TIRF) microscope is used. Pulsed Interleaved Excitation (PIE) alternates between donor and acceptor excitation lasers rapidly. This allows for direct monitoring of the acceptor's fluorophore state, helping to differentiate true FRET changes from artifacts like acceptor blinking or photobleaching [10] [5]. Photons are detected with single-photon sensitive detectors (e.g., APDs).
- Data Analysis and Artifact Correction:
- For diffusing molecules, fluorescence "bursts" are identified and FRET efficiency (E) and stoichiometry (S) are calculated for each burst to create E-S histograms [10].
- Photon-by-photon analysis methods, like multi-parameter Hidden Markov Modeling (mpH²MM), are used to extract kinetic parameters and identify short-lived states, including those induced by dye blinking [10].
- Blinking-affected bursts can be identified and filtered out to improve the accuracy of dynamic analysis [10].
Protocol: Using FRET-Based Dyes for Δψm Imaging in Live Cells
Detailed Methodology:
- Dye Selection and Preparation: Choose a compatible FRET pair for Δψm, such as an electrochromic donor-acceptor pair where one dye is a mobile, voltage-sensitive anion. Prepare the dye solution in an appropriate physiological buffer.
- Cell Staining: Incubate live cells (e.g., neurons or cardiomyocytes) with the FRET dye mixture for the recommended time (typically 15-60 minutes) at room temperature or 37°C, protected from light.
- Microscopy and Image Acquisition: Use a wide-field, confocal, or two-photon microscope equipped with the correct filter sets. For the DiSBAC(_4)(3)-CC2-DMPE pair, excite the donor (e.g., with a 436 nm laser) and simultaneously collect emission from both the donor and acceptor channels.
- Ratiometric Image Analysis: For each time point, calculate a rationetric image by dividing the acceptor emission intensity by the donor emission intensity (or vice-versa, depending on the probe design). This ratio (R) is directly related to the FRET efficiency and, consequently, the membrane potential.
- Calibration and Quantification: The absolute value of Δψm can be estimated by calibrating the FRET ratio response using known manipulations, such as fully depolarizing the membrane with a high-K⁺ buffer or fully hyperpolarizing it.
The Scientist's Toolkit: Essential Research Reagents and Materials
Table 2: Key Reagent Solutions for FRET-based Research
| Item | Function/Description | Example Products / Notes |
|---|---|---|
| FRET Dye Pairs | Donor and acceptor fluorophores for energy transfer. | Cy3-Cy5 [5], Alexa555-Alexa647 [5], Clover-mRuby2 (proteins) [11], DiSBAC(_4)(3)-CC2-DMPE (VSDs) [9] |
| Oxygen Scavenging System | Reduces photobleaching and triplet-state blinking of dyes. | Protocatechuic acid (PCA)/Protocatechuate-3,4-dioxygenase (PCD) system; Trolox (a vitamin E analog) [5] |
| Surface Passivation Agents | Prevents non-specific adhesion of molecules in smFRET. | Polyethylene glycol (PEG), often mixed with biotin-PEG for specific tethering [5] |
| Bio-conjugation Kits | For site-specific labeling of proteins/nucleic acids. | Maleimide, NHS-ester, or click chemistry kits for dye attachment to cysteine, lysine, or synthetic amines. |
| Mounting Media | Preserves sample health and fluorescence during imaging. | Commercial anti-fade mounting media or home-brew systems with oxygen scavengers. |
| Software for Analysis | For processing single-photon data and calculating FRET parameters. | Freely available packages like smFRET analysis tools (e.g., from the Ha lab [5]) and custom scripts for mpH²MM [10]. |
Single-wavelength, accumulation-based fluorescent dyes are fundamental tools for monitoring physiological parameters in live cells, most notably mitochondrial membrane potential (ΔΨm). These probes function not by changing their fluorescent properties upon binding, but by redistributing within cellular compartments based on the transmembrane electrical potential [9]. This accumulation mechanism allows researchers to visualize and quantify critical aspects of cellular bioenergetics, including mitochondrial membrane potential, which serves as a central indicator of mitochondrial health and function [12]. These dyes have become indispensable in studying metabolic diseases, neurodegenerative conditions, and cancer biology, where mitochondrial dysfunction is a key pathological feature [12] [9].
Despite their widespread use, accumulation-based dyes face significant limitations for quantitative and dynamic measurements, particularly in live-cell imaging. These constraints have prompted the development and adoption of alternative sensing strategies, most notably Förster Resonance Energy Transfer (FRET)-based biosensors, which operate on fundamentally different principles to enable ratiometric quantification of dynamic cellular processes [13] [9]. This guide provides a comprehensive comparison of these approaches, focusing on their mechanisms, applications, and limitations for monitoring mitochondrial membrane potential dynamics.
Fundamental Mechanisms: How Accumulation-Based Dyes Work
The Electrochemical Basis of Dye Accumulation
Single-wavelength, accumulation-based dyes for monitoring mitochondrial membrane potential belong primarily to the class of voltage-sensitive dyes (VSDs), with Rhodamine 123 and tetramethylrhodamine methyl ester (TMRM) being prominent examples [9] [5]. These cationic dyes distribute across biological membranes according to the Nernst equation, accumulating in the more negatively charged compartments—specifically, the mitochondrial matrix when the inner mitochondrial membrane is polarized [9]. The resulting fluorescence intensity directly correlates with the dye concentration in the mitochondrial compartment, which in turn reflects the magnitude of the electrochemical gradient [9].
Unlike environmentally sensitive dyes that change spectral properties upon binding, these accumulation-based probes generate signal simply through their physical presence in the mitochondrial matrix. The fluorescence is typically detected at a single emission maximum after excitation at a specific wavelength, producing an intensity-based readout that theoretically reflects mitochondrial membrane potential [9]. This straightforward mechanism enables relatively simple implementation using standard fluorescence microscopy setups, contributing to their popularity in cellular bioenergetics research.
Figure 1: Accumulation Mechanism of Single-Wavelength Cationic Dyes. The fluorescent signal intensity directly correlates with dye concentration in mitochondria, which is governed by membrane potential.
Experimental Implementation and Workflow
The standard protocol for using accumulation-based dyes involves several critical steps to ensure proper interpretation of results. Cells are typically loaded with the dye in buffer, allowing the compound to reach equilibrium distribution across cellular membranes. After washing to remove excess dye, fluorescence is monitored via microscopy or plate readers. A key consideration is determining whether to use "quenching" or "non-quenching" dye concentrations, as this significantly affects data interpretation [9].
For quantitative assessments, researchers often employ calibration protocols using membrane potential uncouplers (e.g., FCCP) and inhibitors to establish maximum and minimum fluorescence values. However, the single-wavelength nature of these measurements necessitates careful normalization and control for potential artifacts from dye loading efficiency, photobleaching, and non-specific binding [9].
Critical Limitations of Single-Wavelength Accumulation Dyes
Quantification Challenges and Artifact Vulnerability
The primary limitation of single-wavelength accumulation dyes stems from their intensity-based readout mechanism, which creates multiple vulnerabilities for quantitative measurements:
Concentration Dependency: The fluorescence signal depends not only on membrane potential but also on total dye concentration, which can vary between experiments due to differences in loading efficiency, cellular uptake, and dye retention [9]. This makes direct comparisons across samples or timepoints challenging without meticulous normalization.
Photobleaching Sensitivity: Continuous illumination during live-cell imaging causes progressive fluorophore degradation, leading to signal decline unrelated to biological changes [9] [14]. This photobleaching effect can mimic membrane potential depolarization, requiring careful control experiments and correction algorithms.
Autofluorescence Interference: Cellular autofluorescence, particularly from flavoproteins and NAD(P)H in mitochondrial studies, contributes background signal that varies between cell types and metabolic states [9]. This background reduces the dynamic range and signal-to-noise ratio of measurements.
Dye Toxicity Effects: At higher concentrations, these dyes can themselves affect mitochondrial function through various mechanisms, including direct inhibition of respiratory chain complexes or induction of permeability transition [9]. This creates a paradox where signal optimization may compromise biological relevance.
Limitations in Dynamic and Subcellular Measurements
For monitoring rapid changes in membrane potential, accumulation-based dyes face fundamental constraints:
Slow Response Kinetics: The redistribution of dye across membranes occurs on timescales of seconds to minutes, limiting temporal resolution for detecting rapid potential fluctuations [9]. This makes them unsuitable for studying fast physiological processes such as neuronal activity or beat-to-beat changes in cardiac mitochondria.
Limited Spatial Resolution: While these dyes can resolve individual mitochondria, their accumulation-based mechanism does not provide sufficient contrast for precise sub-mitochondrial localization or detection of microdomains with different potentials within single organelles.
Incompatibility with Absolute Quantification: Without ratiometric capability, these dyes cannot provide absolute measurements of membrane potential in millivolts, restricting analysis to relative changes within experiments [9].
FRET-Based Biosensors: A Ratiometric Alternative
Fundamental Principles of FRET Biosensors
Förster Resonance Energy Transfer (FRET) is a distance-dependent quantum mechanical phenomenon where energy non-radiatively transfers from an excited donor fluorophore to a suitable acceptor fluorophore when they are within 1-10 nm proximity [13]. The efficiency of this energy transfer (E) follows an inverse sixth-power relationship with distance: E = [1 + (R/R₀)⁶]⁻¹, where R is the distance between donor and acceptor, and R₀ is the Förster radius at which energy transfer efficiency is 50% [5] [13] [15]. This exquisite distance sensitivity makes FRET a "molecular ruler" ideal for monitoring conformational changes in biosensors [13].
FRET-based voltage sensors employ two fluorophores—a donor and an acceptor—whose relative distance or orientation changes in response to membrane potential alterations [9]. This spatial rearrangement modifies FRET efficiency, which can be quantified ratiometrically by measuring emission from both donor and acceptor channels [9]. Unlike accumulation-based dyes, FRET biosensors typically remain anchored to specific locations, with their signal reflecting voltage changes rather than translocation events.
Figure 2: FRET-Based Voltage Sensing Mechanism. Conformational changes in response to membrane potential alter the distance between donor and acceptor fluorophores, modulating FRET efficiency.
Implementation and Advantages for Dynamic Monitoring
FRET-based biosensors offer several distinct advantages for monitoring mitochondrial membrane potential dynamics:
Ratiometric Quantification: By calculating the ratio of acceptor to donor emission (or related metrics), measurements become independent of probe concentration, photobleaching affecting both channels equally, and illumination intensity fluctuations [13] [9]. This enables more reliable quantitative comparisons across experiments and timepoints.
Enhanced Temporal Resolution: Since FRET biosensors detect conformational changes rather than physical translocation, they can respond to voltage changes on millisecond timescales, significantly faster than redistribution-based mechanisms [9].
Absolute Calibration Potential: The ratiometric nature of FRET measurements allows conversion to absolute membrane potential values when properly calibrated, facilitating direct comparison with electrophysiological measurements [9].
Targeting Specificity: Genetically encoded FRET biosensors can be precisely targeted to specific subcellular compartments, including mitochondrial subdomains, enabling more precise localization of measurements [9].
Direct Comparison: Experimental Data and Performance Metrics
Quantitative Performance Comparison
Table 1: Performance Comparison of Single-Wavelength Accumulation Dyes vs. FRET Biosensors for ΔΨm Monitoring
| Parameter | Single-Wavelength Dyes | FRET Biosensors | Experimental Support |
|---|---|---|---|
| Measurement Type | Intensity-based | Ratiometric | [13] [9] |
| Temporal Resolution | Seconds to minutes | Milliseconds to seconds | [9] |
| Photobleaching Correction | Difficult, requires separate controls | Built-in via donor/acceptor ratio | [9] |
| Concentration Dependency | High | Minimal | [13] [9] |
| Absolute Quantification | Not possible | Possible with calibration | [9] |
| Spatial Precision | Organelle level | Sub-organelle level possible | [9] |
| Typical Signal Change | 2-10% per 100mV | 5-50% per 100mV | [9] |
| Implementation Complexity | Low to moderate | Moderate to high | [13] [9] |
| Toxicity Concerns | Moderate to high | Low to moderate | [9] |
Reproducibility and Precision Assessment
Recent multilaboratory studies have quantified the precision and reproducibility of FRET-based measurements for biological applications. In a comprehensive assessment involving 19 laboratories performing single-molecule FRET (smFRET) on protein systems, researchers demonstrated an interdye distance precision of ≤2 Å and accuracy of ≤5 Å [16]. This remarkable precision highlights the quantitative reliability of properly implemented FRET measurements. The study further confirmed the ability of smFRET experiments to simultaneously measure distances and avoid the averaging of conformational dynamics for realistic biological systems [16].
For accumulation-based dyes, no similar multilaboratory validation exists, reflecting the greater challenges in standardizing intensity-based measurements across different instruments and experimental conditions. The 2023 Nature Methods study established that standardized smFRET measurements represent a "mature tool for distance measurements" with well-defined uncertainty, enabling integration with other structural biology techniques [16].
The Scientist's Toolkit: Essential Reagents and Methodologies
Research Reagent Solutions
Table 2: Essential Reagents and Materials for Mitochondrial Membrane Potential Monitoring
| Reagent/Material | Function/Purpose | Example Applications |
|---|---|---|
| Rhodamine 123 | Cationic accumulation-based dye | ΔΨm measurements in fixed and live cells [9] |
| TMRM/TMRE | Low-toxicity cationic dyes | Long-term live-cell ΔΨm monitoring [9] |
| JC-1 | Dual-emission accumulation dye | Ratiometric alternative to single-wavelength dyes [9] |
| FRET-based VSDs | Genetically encoded voltage sensors | Dynamic ΔΨm monitoring with ratiometric readout [9] |
| FCCP/CCCP | Mitochondrial uncouplers | Validation and calibration experiments [9] |
| Oligomycin | ATP synthase inhibitor | Controls for ΔΨm dependency on respiratory chain [9] |
| Antimycin A/Rotenone | ETC complex inhibitors | Inducing mitochondrial depolarization [9] |
| Poly-D-lysine | Cell adhesion substrate | Improving cell attachment for microscopy [14] |
| MitoTracker dyes | Covalent mitochondrial labels | Reference staining for mitochondrial localization [17] |
| Hank's Balanced Salt Solution | Physiological imaging buffer | Maintaining cell viability during live imaging [9] |
Experimental Design Considerations
When designing experiments to monitor mitochondrial membrane potential dynamics, several methodological considerations emerge from the comparative analysis:
Choice of Detection Platform: Wide-field fluorescence microscopy typically suffices for accumulation-based dyes, while FRET biosensors often benefit from advanced imaging modalities such as confocal, TIRF, or multiphoton microscopy for optimal signal separation and reduced background [14].
Calibration Requirements: Accumulation-based dyes require extensive validation including uncoupler controls, concentration titration, and photobleaching correction. FRET biosensors need proper spectral unmixing, background subtraction, and ratio calibration [9] [16].
Temporal Design: For slow processes (minutes to hours), accumulation-based dyes may provide sufficient temporal resolution. For rapid dynamics (milliseconds to seconds), FRET biosensors are distinctly superior [9].
Quantification Goals: Relative changes within experiments can be assessed with either approach, but absolute quantification or comparisons across different experimental sessions strongly favor FRET-based methodologies [9] [16].
Single-wavelength accumulation-based fluorescent dyes provide an accessible entry point for monitoring mitochondrial membrane potential, with straightforward implementation and interpretation. However, their limitations in quantification, temporal resolution, and vulnerability to artifacts constrain their utility for dynamic measurements in live cells. FRET-based biosensors represent a more sophisticated alternative that addresses many of these limitations through ratiometric quantification, faster response kinetics, and reduced concentration dependency.
The choice between these approaches ultimately depends on experimental priorities: accumulation-based dyes suffice for initial screening and endpoint assessments, while FRET biosensors excel in quantitative dynamic monitoring and detection of subtle transient changes in mitochondrial membrane potential. As the field advances toward increasingly precise measurements of cellular bioenergetics, the implementation of ratiometric, FRET-based strategies will likely become the gold standard for investigating mitochondrial function in health and disease.
Förster Resonance Energy Transfer (FRET) microscopy has emerged as a powerful technique for investigating molecular interactions in living cells with spatial resolution beyond the diffraction limit of conventional fluorescence microscopy. This review objectively compares the performance of FRET-based methodologies against single-wavelength fluorescent indicators, with particular emphasis on their application in monitoring dynamic changes in mitochondrial membrane potential (Δψm). We examine the fundamental principles that confer advantages to FRET, including its intrinsic rationetric nature, built-in internal control, and immunity to instrumental noise. Experimental data from direct comparisons and detailed protocols are provided to guide researchers in selecting appropriate techniques for their specific applications in drug development and basic research.
Conventional fluorescence microscopy techniques are limited by diffraction, allowing visualization of structures only down to approximately 200 nanometers [18] [19]. This resolution is insufficient to determine whether biomolecules are physically interacting, as molecules within this distance appear coincident without proof of direct association [18]. While co-localization studies can suggest potential interactions, they often lead to questionable results because the resolution of a fluorescence microscope is several hundred times less than the size of a typical protein [18]. As famously noted by Feynman, many fundamental biological questions can be answered by "just looking at the thing" [5], and FRET microscopy enables precisely this at the molecular level.
FRET occurs when an excited donor fluorophore transfers energy to an acceptor fluorophore through non-radiative dipole-dipole coupling, a phenomenon highly sensitive to the distance between the two molecules [20] [19]. This energy transfer occurs over a limited range of 1-10 nanometers (10-100 Å), making it exquisitely sensitive to molecular proximity [19] [21]. The efficiency of FRET (E) is quantitatively described by the equation E = [1 + (R/R₀)⁶]⁻¹, where R is the distance between donor and acceptor, and R₀ is the Förster radius at which energy transfer efficiency is 50% [5] [21]. This inverse sixth-power distance dependence makes FRET a sensitive molecular ruler for probing biomolecular interactions [20].
Fundamental Advantages of FRET Over Single-Wavelength Fluorescence
Ratiometric Measurements Provide Built-In Internal Control
The ratiometric nature of FRET measurements represents a significant advantage over single-wavelength intensity-based indicators. FRET enables measurement of the "internal distance in the molecular frame rather than in the laboratory frame" [5], making it largely immune to variations in expression levels, sample thickness, and excitation intensity [5] [22].
Table 1: Comparison of Measurement Approaches
| Parameter | Single-Wavelength Intensity | FRET Ratiometric |
|---|---|---|
| Expression Level Variation | Requires separate normalization | Built-in correction via donor/acceptor ratio |
| Excitation Source Fluctuations | Directly affects signal | Compensated through ratio metric measurement |
| Photobleaching Effects | Difficult to distinguish from biological changes | Parallel monitoring of donor and acceptor provides internal control |
| Quantitative Distance Information | Not available | Distance estimation via FRET efficiency (1-10 nm) |
For monitoring dynamic processes such as Δψm changes, this ratiometric capability is crucial. As noted in studies of neuronal metabolism, comparing biosensor signals between different cells requires distinguishing differences due to analyte concentration from those arising from different expression levels [22]. FRET naturally provides this capability through the donor-acceptor emission ratio, enabling more reliable quantification of biological processes.
Immunity to Instrument Noise and Drift
The ratiometric nature of FRET makes it inherently resistant to instrumental noise and drift, a significant advantage for long-term experiments such as monitoring Δψm dynamics during drug treatment. Unlike single-wavelength measurements where instrumental fluctuations can be misinterpreted as biological signals, FRET measurements track the ratio between donor and acceptor emissions, providing stability against these external variables [5].
This stability is particularly valuable in high-throughput screening applications in drug development, where consistent performance across multiple plates and extended time courses is essential. The internal control provided by the dual-channel measurement minimizes false positives and negatives that could arise from instrumental artifacts.
Molecular-Scale Spatial Resolution
FRET provides resolution at the molecular scale (1-10 nm), far exceeding the diffraction limit of conventional light microscopy (~200 nm) [18] [19]. This enables researchers to distinguish mere co-localization from direct molecular interactions, as FRET only occurs when donor and acceptor are within molecular distances [19].
Table 2: Spatial Resolution Comparison
| Technique | Spatial Resolution | Adequate for Molecular Interactions? |
|---|---|---|
| Widefield Fluorescence Microscopy | ~200 nm | No |
| Confocal Microscopy | ~180 nm | No |
| FRET Microscopy | 1-10 nm | Yes |
This molecular-scale resolution is particularly advantageous for studying Δψm, where precise localization of protein interactions within mitochondria is essential for understanding regulatory mechanisms.
Experimental Comparisons and Performance Data
Direct Comparison of FRET Configurations
Quantitative comparisons of FRET performance reveal important considerations for experimental design. A systematic comparison of different fluorescent protein pairs for FRET-FLIM (Fluorescence Lifetime Imaging Microscopy) identified mTFP1/EYFP as the optimal pair in terms of the fraction of donor engaged in FRET (fD), a key parameter for quantifying protein interactions [23]. The study found that mTFP1-EYFP achieved an fD value of 0.7, nearly two times greater than mCherry-EGFP (0.35) in the context of fast acquisitions [23].
Single-molecule studies comparing dye-labeled versus fluorescent protein-equipped FRET biosensors revealed significant performance differences. For the glucose/galactose binding protein MglB, the FP-equipped sensor construct showed more pronounced FRET signal changes upon glucose binding compared to the dye-labeled analog [24]. Furthermore, the FP-equipped sensor demonstrated a strong increase in FRET signal under macromolecular crowding conditions (10% PEG 6,000), while the dye-labeled sensor was largely unaffected by crowding [24]. This highlights how the choice of labeling strategy should align with the experimental environment and application requirements.
Diagram 1: Sensor performance comparison
Signal-to-Noise Optimization in FRET Measurements
Comprehensive signal-to-noise (SNR) analysis of FRET-based sensors reveals that the standard emission ratio method after single short-wavelength excitation provides optimal SNR when only relative ratio changes are needed [25]. However, when quantitative FRET efficiency data are required, more complex analysis methods such as lux-FRET can calculate these parameters, though with reduced SNR due to error propagation [25].
The SNR performance depends critically on matching the measurement strategy to the experimental goals. For dynamic monitoring of Δψm, where relative changes are often more important than absolute distances, the standard ratio method provides excellent performance with simpler implementation.
Practical Implementation: Protocols and Reagents
The Scientist's Toolkit: Essential FRET Reagents
Table 3: Key Research Reagent Solutions for FRET Experiments
| Reagent/Category | Specific Examples | Function/Purpose |
|---|---|---|
| Organic Dye Pairs | Cy3-Cy5, ATTO550-ATTO647N, Alexa555-Alexa647 [5] | High photostability for single-molecule studies |
| Fluorescent Protein Pairs | mTFP1-EYFP, ECFP-EYFP, mTurquoise2-Venus [23] [24] | Genetically encoded for live-cell applications |
| Photostability Enhancers | Trolox (in dimethyl sulfoxide) [5] | Suppresses blinking and stimulates long-lasting emission |
| Oxygen Scavenging Systems | Protocatechuate dioxygenase system [5] | Reduces photobleaching caused by reactive oxygen species |
| Surface Passivation | Polymer-passivated surfaces [5] | Prevents nonspecific adhesion in single-molecule studies |
Experimental Workflow for FRET-Based Δψm Monitoring
Implementing robust FRET experiments requires careful attention to experimental design and calibration. The following workflow outlines key steps for reliable FRET measurements in the context of mitochondrial membrane potential monitoring:
Diagram 2: FRET experimental workflow
Critical to this workflow is proper correction for spectral bleed-through (SBT), where donor emission contaminates the acceptor channel and vice versa [20]. Advanced algorithms have been developed that remove both donor and acceptor SBT while correcting for variations in fluorophore expression levels, enabling calculation of accurate FRET efficiency and distance estimation [20].
For monitoring Δψm dynamics specifically, the experimental design must account for potential environmental sensitivities of the biosensors, including pH and temperature fluctuations that can cause "aliasing" where the biosensor appears to report changes in the target analyte when none have occurred [22]. Multiplexing with environmental controls is recommended for rigorous quantification.
FRET microscopy provides significant advantages over single-wavelength fluorescence approaches for monitoring dynamic cellular processes such as changes in mitochondrial membrane potential. The ratiometric nature of FRET measurements offers built-in internal control that compensates for variations in expression levels and instrumental fluctuations, while providing molecular-scale spatial resolution unattainable with conventional fluorescence microscopy. Experimental data demonstrate that careful selection of FRET pairs and optimization of measurement protocols can yield robust, quantitative information about molecular interactions in living cells. As FRET-based technologies continue to evolve, their application in drug development and basic research will further expand our understanding of cellular dynamics at the molecular level.
Fluorescent probes are indispensable tools in biological research, enabling real-time visualization of dynamic cellular processes such as changes in mitochondrial membrane potential (ΔΨm). While single-wavelength probes have been widely used for their simplicity, they suffer from significant limitations related to quantitative accuracy and reliability. This review systematically compares the performance of single-wavelength probes against FRET-based alternatives, highlighting how FRET-based designs overcome critical challenges through intrinsic ratiometric measurement capabilities. We present experimental data demonstrating that innovative FRET-based probes provide superior performance for monitoring ΔΨm dynamics, offering researchers more robust tools for investigating cellular bioenergetics, signaling, and disease mechanisms.
Cellular membrane potential, particularly mitochondrial membrane potential (ΔΨm), is a fundamental physiological parameter essential for numerous vital biological processes including cellular metabolism, apoptosis, and neuronal signaling [9]. Mitochondria serve as hubs for cellular signaling and metabolic integration, and disruptions in mitochondrial function are associated with various diseases including cancer, neurodegenerative diseases, and metabolic disorders [9]. Accurate monitoring of ΔΨm dynamics is therefore crucial for advancing our understanding of cellular bioenergetics and disease mechanisms.
The scientific community has largely relied on single-wavelength fluorescent probes for monitoring these parameters, but these tools present inherent limitations that compromise data quality and interpretation. This review examines the specific technical challenges of single-wavelength probes and demonstrates how FRET-based alternatives represent a superior methodology for reliable, quantitative measurements of dynamic cellular processes, with specific focus on ΔΨm monitoring.
Fundamental Limitations of Single-Wavelength Probes
Sensitivity to Loading Concentration and Environmental Factors
Single-wavelength probes exhibit fluorescence intensity that depends directly on probe concentration within the cellular compartment, creating significant interpretative challenges. Unlike ratiometric measurements, intensity changes cannot be unequivocally attributed to physiological parameter changes versus variations in probe loading or retention.
Table 1: Quantitative Comparison of Single-Wavelength vs. FRET-Based Probes
| Characteristic | Single-Wavelength Probes | FRET-Based Probes |
|---|---|---|
| Concentration Dependency | High - intensity directly proportional to dye concentration | Low - ratiometric measurement is concentration-independent |
| Environmental Sensitivity | Severe - affected by local environment, pH, ionic strength | Moderate - self-referencing minimizes environmental artifacts |
| Photostability | Generally poor - susceptible to photobleaching | Can be improved with optimized fluorophore pairs and photostabilizers |
| Quantitative Accuracy | Limited - relative changes only | High - enables distance measurements via Förster theory |
| Typical Temporal Resolution | Millisecond timescale | Millisecond to sub-millisecond timescale |
| Typical Spatial Resolution | Diffraction-limited | Nanoscale (2-10 nm range) via distance-dependent energy transfer |
| Data Interpretation | Complex - requires careful controls for concentration, path length | Simplified - internal reference provides built-in control |
Environmental factors including local pH, ionic strength, and viscosity further complicate interpretation with single-wavelength probes, as these parameters directly influence fluorescence intensity without necessarily reflecting changes in the target physiological parameter [9]. This confounding effect necessitates extensive control experiments and limits quantitative accuracy.
Photobleaching and Photophysical Instability
Photobleaching represents a particularly severe limitation for single-wavelength probes, where irreversible fluorophore destruction leads to signal loss that can be misinterpreted as physiological changes [5] [9]. Molecular oxygen is an efficient quencher of a dye's triplet state but also generates highly reactive oxygen species that cause photobleaching [5]. The problem is exacerbated in single-molecule imaging where elevated excitation intensities are required to achieve adequate signal-to-noise ratios, paradoxically accelerating the photodamage researchers seek to avoid [26].
Organic fluorophores common to fluorescence investigations suffer from unwanted photophysical properties including blinking and photobleaching, which limit their overall experimental performance [27]. These phenomena are particularly problematic for single-wavelength measurements where uninterrupted, stable fluorescence is paramount for accurate interpretation. While photostabilizing additives can partially mitigate these issues, they introduce their own complications including potential biological toxicity and limited aqueous solubility [28].
FRET-Based Probes: A Ratiometric Solution
Fundamental Principles and Design Strategies
Förster Resonance Energy Transfer (FRET) describes the non-radiative energy transfer between two fluorophores in close proximity (typically 2-10 nanometers) [9]. FRET efficiency depends strongly on the distance between fluorophores, following an inverse sixth-power relationship (E = [1 + (R/R₀)⁶]⁻¹), where R is the inter-dye distance and R₀ is the Förster radius at which energy transfer efficiency is 50% [5]. This distance dependence forms the basis for using FRET pairs as molecular rulers capable of reporting nanometer-scale conformational changes.
In FRET-based voltage-sensitive dyes, changes in membrane potential alter the relative orientation or distance between donor and acceptor fluorophores, modifying FRET efficiency in a manner that can be detected as changes in the ratio of donor to acceptor emission [9]. This ratiometric measurement inherently corrects for variations in probe concentration, illumination intensity, and detection efficiency, addressing fundamental limitations of single-wavelength probes.
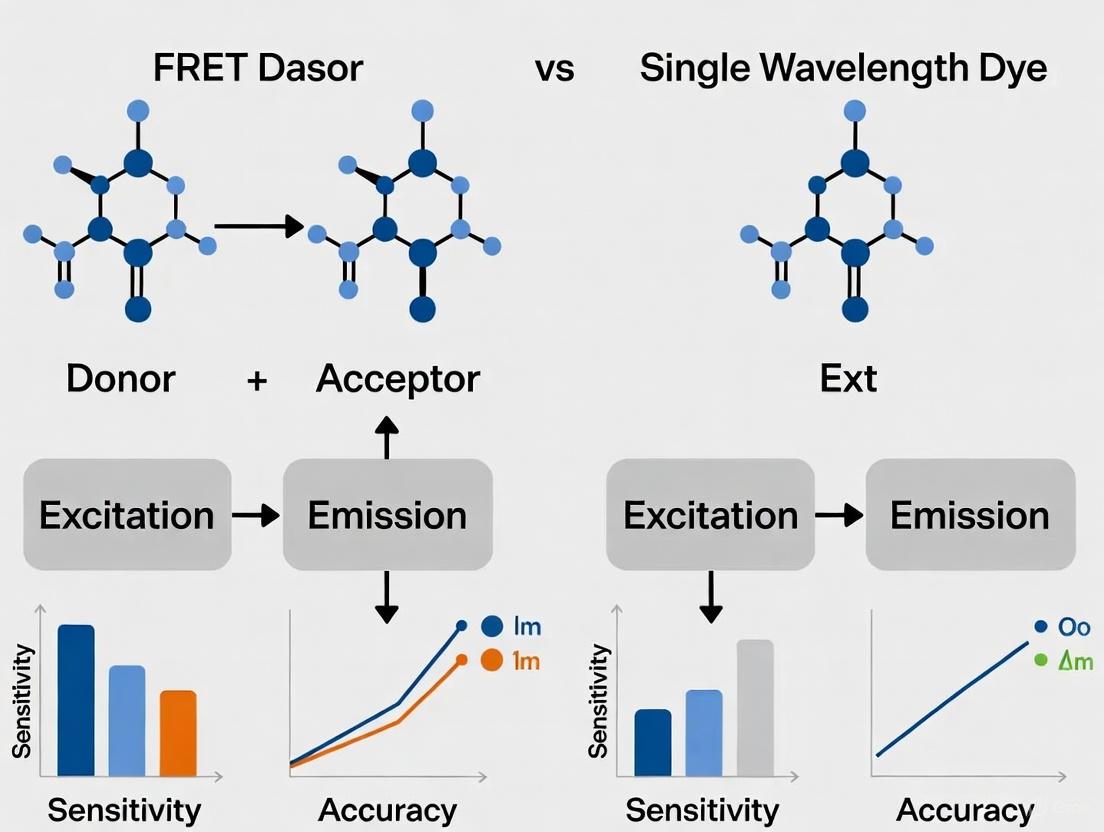
Figure 1: FRET-Based Probe Mechanism. In FRET-based voltage sensors, donor and acceptor fluorophores are positioned such that changes in membrane potential alter their proximity, modulating FRET efficiency. With ΔΨm loss, probe migration causes separation, blocking FRET and shifting emission from red to green [29] [9].
Experimental Realization for Mitochondrial Membrane Potential Monitoring
Recent research has demonstrated innovative FRET-based probe designs specifically optimized for monitoring mitochondrial membrane potential. Sun et al. developed two fluorescent probes, G-1 (green-emissive) and MTR-1 (red-emissive), that target mitochondria in live cells and exhibit weak green emission and strong red emission due to FRET under normal ΔΨm conditions [29]. With loss of ΔΨm, G-1 migrates into membranous organelles while MTR-1 moves to bind intracellular RNA, separating the FRET pair and blocking energy transfer [29]. This elegant design results in a measurable ratiometric signal change that directly reports ΔΨm loss.
Table 2: Performance Characteristics of Common smFRET Fluorophore Pairs
| Dye Pair | Excitation λmax (nm) | Emission λmax (nm) | Brightness* | Photostability (s) in Trolox/βME | Förster Radius (R₀) |
|---|---|---|---|---|---|
| Cy3-Cy5 | 550-655 | 565-667 | 1.0 (reference) | 91/50 | ~60 Å |
| ATTO550-ATTO647N | 554-644 | 577-664 | 1.9 (donor) / 1.3 (acceptor) | 72/27 | ~65 Å |
| Alexa555-Alexa647 | 555-650 | 567-667 | 0.8 (donor) / 1.2 (acceptor) | 65/35 | ~51 Å |
| Cy3-Cy7 | 550-755 | 565-778 | Not specified | 82/25 (Cy5 reference) | Not specified |
*Brightness normalized to Cy3 for donors and Cy5 for acceptors under same excitation power [5].
The implementation of multi-color smFRET further expands capabilities, enabling researchers to correlate multiple conformational events and precisely dissect their order and timing [26]. While technically more challenging to implement, these approaches provide unprecedented insights into complex biological systems by simultaneously monitoring multiple distance vectors.
Experimental Protocols for smFRET Measurements
Sample Preparation and Surface Passivation
For single-molecule FRET measurements of immobilized molecules, proper sample preparation is crucial for obtaining reliable data. A common protocol involves:
Surface Preparation: Clean glass coverslips are passivated using a mixture of polyethylene glycol (PEG) and biotinylated PEG to prevent non-specific binding of biomolecules while providing specific attachment points via biotin-streptavidin binding [5].
Oxygen Scavenging System: To reduce photobleaching, an oxygen scavenging system is typically added, consisting of protocatechuic acid (PCA) and protocatechuate-3,4-dioxygenase (PCD), or glucose oxidase/catalase systems [5] [28].
Triplet State Quenchers: Compounds such as Trolox (a vitamin E analog), cyclooctatetraene (COT), or 4-nitrobenzyl alcohol (NBA) are added to suppress blinking and photobleaching by quenching triplet states [5] [27] [28]. Trolox is typically used at 2 mM concentration, with a 100× stock prepared in DMSO [5].
Data Acquisition and Analysis
Accurate FRET efficiency determination requires careful correction for various experimental factors:
Spectral Crosstalk: Donor emission detected in the acceptor channel must be quantified and corrected using control samples containing donor-only labeled molecules [30].
Direct Acceptor Excitation: Acceptor emission resulting from direct excitation by the donor laser must be measured and subtracted using acceptor-only controls [30].
Detection Efficiency Correction: The relative detection efficiency and quantum yield differences between donor and acceptor channels are accounted for by the γ-factor, which can be determined using molecules with known FRET efficiency or by acceptor photobleaching methods [30].
The corrected FRET efficiency is then calculated as: [E = \frac{IA}{IA + γ ID}] where (IA) and (I_D) are the background- and correction-subtracted acceptor and donor intensities, respectively [30] [28].
Figure 2: smFRET Experimental Workflow. Accurate FRET efficiency determination requires careful sample preparation, data acquisition with alternating laser excitation, and comprehensive correction for spectral crosstalk and detection efficiencies before quantitative analysis [5] [30].
The Scientist's Toolkit: Essential Reagents and Methods
Table 3: Research Reagent Solutions for smFRET Experiments
| Reagent/Method | Function | Typical Concentration/Parameters | Considerations |
|---|---|---|---|
| Trolox | Triplet state quencher that suppresses blinking and photobleaching | 2 mM | Requires pH adjustment and filtration; 100× stock in DMSO |
| Oxygen Scavenging System | Removes molecular oxygen to reduce photobleaching | Protocatechuic acid (PCA)/PCD or glucose oxidase/catalase | Can increase triplet state blinking while reducing photobleaching |
| Cyclooctatetraene (COT) | Triplet state quencher identified as effective blinking suppressant | Concentration-dependent optimization | Often used in cocktail with Trolox and NBA |
| Polyethylene Glycol (PEG) | Surface passivation to prevent non-specific binding | Mixed PEG/biotin-PEG for specific immobilization | Reduces surface interactions that affect dye photophysics |
| ALEX (Alternating Laser Excitation) | Method to monitor fluorophore stoichiometry and identify inactive dyes | Microsecond to nanosecond alternation | Enables identification of molecules with bleached fluorophores |
| Self-Healing Fluorophores | Intrinsically stabilized dyes with covalently attached protective moieties | e.g., LD555, LD655 | Bypasses need for high concentrations of solution additives |
Single-wavelength probes present inherent challenges that limit their quantitative reliability for monitoring dynamic cellular parameters like mitochondrial membrane potential. Their sensitivity to loading concentration, environmental factors, and photobleaching introduces artifacts and complicates data interpretation. FRET-based probes address these limitations through intrinsic rationetric measurement capabilities that provide internal controls for concentration variations and enable distance-based measurements at the nanoscale.
Recent advancements in FRET probe design, particularly those enabling ΔΨm-dependent subcellular migration, demonstrate the superior performance characteristics achievable with well-engineered FRET systems. Combined with robust photostabilization strategies and appropriate data correction protocols, FRET-based methodologies offer researchers more accurate and reliable tools for investigating the complex relationship between membrane potential and cellular function. As the field continues to develop improved fluorophores with enhanced photostability and reduced environmental sensitivity, FRET-based approaches are poised to become increasingly indispensable for quantitative cellular imaging and drug development applications.
From Theory to Bench: Implementing FRET Biosensors and Dyes for Live-Cell ΔΨm Imaging
Cellular metabolism and signaling are fundamentally driven by dynamic shifts in mitochondrial membrane potential (ΔΨm). Accurately monitoring these changes is crucial for understanding bioenergetics, cell death, and disease mechanisms. Researchers primarily rely on two classes of optical tools for this task: single-wavelength electrochromic dyes and Förster Resonance Energy Transfer (FRET)-based dyes. This guide provides a objective comparison of these technologies, detailing their operating principles, performance characteristics, and experimental protocols to inform your research and drug development projects.
Understanding the Fundamental Mechanisms
The choice between single-wavelength and FRET-based dyes begins with a clear understanding of their distinct operational principles.
Single-Wavelength Electrochromic Dyes
Often referred to as ‘fast’ dyes, electrochromic dyes function by changing their optical properties—specifically, their fluorescence intensity or emission spectrum—in direct response to the electric field across a membrane [9]. Their molecular structure is asymmetric, with a positively charged center. When the dye is incorporated into a membrane and photoexcited, the movement of this positive charge during the absorption process is influenced by the direction and strength of the external electric field [9]. This results in a voltage-dependent shift in the energy required for excitation and emission, providing an ultrafast fluorescence response ideal for tracking rapid neuronal or mitochondrial potential changes.
FRET-Based Dyes
FRET-based dyes consist of a pair of fluorophores: a donor and an acceptor [18]. The core mechanism relies on non-radiative energy transfer from the excited donor to the acceptor, which then emits fluorescence. This process only occurs efficiently when the two dyes are in very close proximity (typically 2-10 nanometers) and there is significant spectral overlap between the donor's emission and the acceptor's excitation [9]. In voltage-sensing applications, the dye pair is incorporated into the membrane such that changes in membrane potential alter the distance or orientation between the donor and acceptor. This in turn affects the FRET efficiency, which is measured as a change in the ratio of acceptor-to-donor fluorescence [9]. This ratiometric measurement makes FRET largely immune to instrumental noise and drift [5].
Comparative Performance Data of Common Dyes
Selecting the appropriate dye requires careful consideration of photophysical properties and performance under experimental conditions. The following tables summarize key quantitative data for common FRET pairs and single-wavelength dyes.
Table 1: Performance Characteristics of Common smFRET Dye Pairs
| Dye Pair | Donor Brightness* (vs. Cy3) | Donor Photostability (s, in Trolox/βME) | Acceptor Brightness* (vs. Cy5) | Acceptor Photostability (s, in Trolox/βME) | Förster Radius (R0, Å) |
|---|---|---|---|---|---|
| Cy3-Cy5 | 1.0 (reference) | 91 / 50 | 1.0 (reference) | 82 / 25 | ~60 [5] |
| ATTO550-ATTO647N | 1.9 | 72 / 27 | 1.3 | 62 / 31 | ~65 [5] |
| Alexa555-Alexa647 | 0.8 | 65 / 35 | 1.2 | 58 / 20 | ~51 [5] |
Brightness is intensity at emission maximum compared to reference under same excitation power. [5]
Table 2: Common Dye Pairs and Single-Wavelength Dyes for ΔΨm Measurement
| Dye Name(s) | Type | Key Characteristics | Excitation/Emission (Typical) | Primary Applications |
|---|---|---|---|---|
| DiSBAC₄(3)-CC2-DMPE [7] | FRET-based VSD | Membrane-potential sensitive FRET pair | N/A | Neuronal activity, mitochondrial ΔΨm |
| Rhodamine 123, TMRM [9] | Single-wavelength (Electrochromic) | Accumulates in active mitochondria based on ΔΨm | Varies by specific dye | Mitochondrial membrane potential, health, and function |
| Cy3-Cy5 [5] [7] | FRET Pair | Gold standard for smFRET; well-characterized | Cy3: ~550/565 nm; Cy5: ~655/667 nm | smFRET, conformational studies, potentially ΔΨm biosensors |
| CFP-YFP [18] [7] | FRET Pair (Genetically Encoded) | Used in biosensors (e.g., cameleon) | CFP: ~433/475 nm; YFP: ~516/527 nm | Intracellular Ca²⁺, cAMP; can be engineered for ΔΨm |
Essential Experimental Protocols
Implementing these dyes requires strict adherence to established protocols to ensure reliable and reproducible data.
Single-Molecule FRET (smFRET) Measurement Protocol
This protocol outlines the key steps for conducting a diffusion-based smFRET experiment, a powerful method for studying biomolecular dynamics [5] [31].
Sample Preparation and Immobilization: Label your biomolecule (e.g., DNA, protein) site-specifically with a chosen FRET pair (e.g., Cy3-Cy5) [5] [10]. For surface immobilization, use a polymer-passivated surface (e.g., PEG-biotin) to which biotinylated molecules can be tethered via streptavidin, minimizing nonspecific binding [5]. For diffusion-based measurements, dilute the sample to a picomolar concentration to ensure single molecules diffuse through the detection volume one at a time [31].
Data Acquisition with Alternating Laser Excitation (ALEX): Use a confocal microscope setup with total internal reflection (TIR) or confocal illumination [5]. Employ pulsed interleaved excitation (PIE) or ALEX, rapidly alternating between donor (e.g., 532 nm) and acceptor (e.g., 633 nm) laser lines [10]. This allows for the independent assessment of donor and acceptor stoichiometry, correcting for artifacts like acceptor blinking [10]. Record photon arrival times on donor and acceptor detectors with single-photon sensitivity.
Burst Analysis and Data Processing: For diffusion-based data, identify bursts of photons generated as single molecules traverse the confocal volume [31]. Calculate the apparent FRET efficiency (E) for each burst using the formula E = Iₐ / (Iₐ + I𝒹), where Iₐ and I𝒹 are the background-corrected acceptor and donor intensities, respectively [31]. Employ advanced photon-by-photon analysis tools like multiparameter Hidden Markov Modeling (mpH²MM) to distinguish true FRET dynamics from dye blinking and other artifacts [10].
Mitochondrial Staining with Single-Wavelength Dyes
This protocol describes the standard procedure for measuring ΔΨm in live cells using potentiometric dyes like TMRM or Rhodamine 123 [9].
Dye Loading and Incubation: Prepare a working solution of the dye (e.g., 20-200 nM TMRM) in pre-warmed cell culture medium or appropriate buffer. Incubate live cells with the dye solution for 15-30 minutes at 37°C and 5% CO₂ to allow for dye accumulation within the mitochondria.
Washing and Image Acquisition: Remove the dye-containing medium and gently wash the cells with fresh, pre-warmed buffer to remove excess, non-specific dye. For quantitative imaging, use a low dye concentration ("quenching mode") where fluorescence intensity is linearly related to ΔΨm. Image using a fluorescence microscope with appropriate filter sets. Confocal or two-photon microscopy is recommended for improved spatial resolution and imaging in deep tissue [9].
Validation and Calibration: At the end of the experiment, validate the specificity of the signal by adding a mitochondrial uncoupler (e.g., FCCP) which dissipates ΔΨm. A rapid decrease in fluorescence intensity confirms that the signal was dependent on ΔΨm.
The Scientist's Toolkit: Essential Research Reagents
A successful experiment relies on a suite of reliable reagents and instruments. The following table details key solutions used in the field.
Table 3: Research Reagent Solutions for FRET and ΔΨm Imaging
| Item | Function | Example Products / Types |
|---|---|---|
| Organic Dye Pairs | Serve as donor and acceptor for FRET; small size is optimal for smFRET. | Cy3-Cy5 [5], ATTO550-ATTO647N [5], Alexa555-Alexa647 [5] |
| Voltage-Sensitive Dyes (VSDs) | Report changes in membrane potential (ΔΨm) directly. | Electrochromic Dyes (e.g., TMRM, Rhodamine 123) [9], FRET-based VSDs (e.g., DiSBAC₄(3)-CC2-DMPE) [7] |
| Oxygen Scavenging System | Reduces photobleaching and suppresses dye blinking by removing molecular oxygen. | Trolox (a vitamin E analog) in DMSO [5] |
| Immobilization Surfaces | Tether molecules for prolonged observation in smFRET. | Polymer-passivated (e.g., PEG) surfaces with biotin-streptavidin linkage [5] |
| Confocal Microscope | Enables single-molecule detection by isolating fluorescence from a tiny volume. | Systems with ALEX/PIE capability, EMCCD or sCMOS cameras [32] [7] |
Mitochondrial membrane potential (ΔΨm) is a critical physiological parameter essential for cellular energy production, survival, and signaling. Its dynamics serve as a key indicator of mitochondrial health and function, with implications ranging from fundamental cell biology to drug development in cancer and neurodegenerative diseases. The accurate monitoring of ΔΨm dynamics presents significant technical challenges, requiring methodologies capable of capturing rapid fluctuations with high spatial and temporal fidelity within the complex intracellular environment.
Fluorescence microscopy has emerged as the predominant technique for investigating ΔΨm dynamics in live cells, with widefield, confocal, and multiphoton imaging representing the three principal modalities. Each technique offers distinct advantages and limitations for ΔΨm monitoring, particularly when integrated with either FRET-based molecular reporters or single-wavelength dyes. This guide provides an objective comparison of these imaging platforms, focusing on their performance characteristics for quantifying dynamic changes in mitochondrial membrane potential within the context of live-cell imaging.
Technical Comparison of Microscopy Modalities
Fundamental Operating Principles
The three microscopy modalities differ fundamentally in their approach to illumination and spatial discrimination, which directly impacts their performance for ΔΨm imaging.
Widefield Microscopy illuminates the entire specimen volume homogeneously simultaneously, collecting emission light from both in-focus and out-of-focus regions. This technique uses LEDs or arc lamps for excitation and employs a camera for detection without spatial filtering of emitted light [33] [3]. While simple and cost-effective, this approach lacks inherent optical sectioning capability, resulting in significant background signal from regions outside the focal plane.
Confocal Microscopy employs laser light focused to a diffraction-limited spot at the focal plane and scanned across the specimen. A key differentiator is the presence of a pinhole in the detection path positioned at a conjugate focal plane to reject out-of-focus light [33] [34]. This optical sectioning capability significantly improves image contrast and resolution, particularly in thicker specimens. Both laser-scanning and spinning-disk confocal systems operate on this principle, with the latter using multiple pinholes simultaneously to increase acquisition speed [35].
Multiphoton Microscopy relies on the near-simultaneous absorption of two or more longer-wavelength (typically near-infrared) photons to excite fluorophores. This excitation only occurs at the focal point where photon density is highest, providing intrinsic optical sectioning without requiring a detection pinhole [36] [37]. The longer excitation wavelengths experience less scattering in biological tissues, enabling deeper penetration while reducing photodamage in out-of-focus regions.
Performance Characteristics for ΔΨm Imaging
Table 1: Quantitative Comparison of Microscopy Modalities for ΔΨm Imaging
| Performance Parameter | Widefield Microscopy | Confocal Microscopy | Multiphoton Microscopy |
|---|---|---|---|
| Axial Resolution | No inherent sectioning [33] | 0.68 ± 0.04 μm [34] | Superior to confocal in scattering samples [36] |
| Lateral Resolution | Diffraction-limited | Slightly improved over widefield [33] | Diffraction-limited |
| Imaging Depth | Limited to superficial layers (<20 μm) | Up to ~200 μm [36] | Up to millimeters in scattering tissue [36] |
| Image Acquisition Speed | Fast (camera-based) [33] | Slower (point scanning) [33]; Faster with spinning disk [35] | Similar to laser-scanning confocal |
| Excitation Wavelength | UV-visible [3] | UV-visible [3] | Near-infrared (700-1100 nm) [36] [37] |
| Phototoxicity & Photobleaching | Moderate (out-of-focus exposure) [33] | Higher in focal plane [33] | Reduced in out-of-focus regions [36] |
| Signal-to-Noise Ratio | Lower (background fluorescence) [34] | Higher (background rejection) [34] | Highest in deep tissue [36] |
| Cost & Accessibility | Low [34] | High [33] | Very high [36] [37] |
Table 2: Suitability Assessment for ΔΨm Monitoring Applications
| Application Context | Recommended Modality | Rationale |
|---|---|---|
| High-throughput screening | Widefield [3] | Speed and compatibility with multi-well plates |
| Long-term live-cell imaging | Spinning disk confocal [33] | Balance of sectioning capability, speed, and reduced phototoxicity |
| Subcellular ΔΨm heterogeneity | Laser-scanning confocal [3] | Superior spatial resolution and sectioning |
| Deep tissue imaging | Multiphoton [36] | Enhanced penetration in scattering specimens |
| FRET-based ΔΨm probes | Confocal or multiphoton [29] [5] | Precision for rationetric measurements |
| Rapid ΔΨm dynamics | Widefield or spinning disk [33] | Temporal resolution requirements |
| 3D reconstruction of mitochondrial networks | Confocal [33] | Optimal z-sectioning capability |
Figure 1: Experimental Workflow for ΔΨm Imaging. The pathway illustrates modality selection criteria based on experimental priorities, with color coding corresponding to technique advantages.
Experimental Protocols for ΔΨm Monitoring
Sample Preparation and Staining
Cell Culture and Probe Loading:
- Culture cells on appropriate imaging dishes (glass-bottom for high-resolution objectives)
- Load ΔΨm-sensitive probes: For single-wavelength dyes like TMRM or JC-1, use 50-200 nM in culture medium for 20-30 minutes at 37°C [3]
- For FRET-based ΔΨm probes (e.g., G-1/MTR-1 pair), optimize concentration based on expression efficiency or loading kinetics [29]
- Include control samples with mitochondrial uncouplers (e.g., FCCP, CCCP) to validate ΔΨm-dependent signal changes
Staining Protocol for Dual-Channel VH&E-like Imaging:
- Prepare staining solution: distilled water with 40 μg/mL propidium iodide (nuclear stain) and 200 μg/mL eosin yellow (cytoplasmic stain) [37]
- Incubate tissue specimens for 2 minutes at room temperature
- Rinse with buffered saline to remove excess dye
- Mount specimens in saline-soaked biopsy foam pads to maintain hydration during imaging
Image Acquisition Parameters
Widefield Configuration:
- Use LED illumination for stable, heat-free excitation [33] [3]
- Employ high-NA objectives (≥60x) for maximal light collection
- Acquire z-stacks (0.2-0.5 μm steps) for subsequent deconvolution
- For live-cell imaging, reduce exposure times to minimize phototoxicity while maintaining sufficient signal-to-noise
Laser-Scanning Confocal Configuration:
- Set pinhole to 1 Airy unit for optimal sectioning and signal balance [37]
- Use 405 nm diode laser for simultaneous excitation of multiple fluorophores [37]
- Configure detection channels with appropriate dichroics and emission filters: 525-565 nm for eosin yellow/GFP, >650 nm for propidium iodide/TMRM [37]
- For FRET imaging, use sequential scanning to minimize bleed-through between channels
Multiphoton Configuration:
- Set Ti:sapphire laser to ~150-fs pulse width at 76-MHz repetition rate [37]
- Tune excitation wavelength based on fluorophore two-photon cross-sections (typically ~800 nm for common ΔΨm probes)
- Use non-descanned detectors for improved signal collection in deep tissue
- Optimize laser power to balance signal intensity with nonlinear photodamage
The Scientist's Toolkit: Essential Research Reagents
Table 3: Key Reagent Solutions for ΔΨm Imaging Experiments
| Reagent Category | Specific Examples | Function & Application |
|---|---|---|
| ΔΨm-Sensitive Dyes | TMRM, Rhodamine 123, JC-1, TMRE | Single-wavelength potential-sensitive distribution probes [3] |
| FRET-Based ΔΨm Reporters | G-1/MTR-1 pair [29] | Rationetric probes exhibiting ΔΨm-dependent subcellular migration and FRET efficiency changes |
| Mitochondrial Uncouplers | FCCP, CCCP | Positive controls that collapse ΔΨm to validate probe response [29] |
| Photostability Enhancers | Trolox (2 mM in DMSO) [5] | Triplet-state quencher that suppresses dye blinking and prolongs emission |
| Oxygen Scavenging Systems | PCA/PCD, glucose oxidase/catalase | Reduce photobleaching by removing molecular oxygen [5] |
| Mounting Media | Saline-soaked biopsy foam pads [37] | Maintain specimen hydration during extended imaging sessions |
| Spectral Unmixing References | Single-labeled controls | Essential for validating FRET efficiency calculations and eliminating bleed-through |
Integration with FRET vs Single-Wavelength Detection Strategies
The choice between FRET-based probes and single-wavelength dyes significantly influences optimal microscopy platform selection. FRET-based ΔΨm monitoring, such as with the G-1/MTR-1 probe pair, benefits tremendously from the optical sectioning capabilities of confocal and multiphoton systems [29]. These probes exhibit ΔΨm-dependent subcellular migration and consequent FRET efficiency changes that require high spatial resolution for accurate quantification. The rationetric nature of FRET measurements (calculating acceptor-to-donor emission ratios) provides internal calibration that corrects for variations in probe concentration, path length, and instrumental efficiency [5] [38].
Single-wavelength potentiometric dyes (e.g., TMRM, JC-1) accumulate in mitochondria in a ΔΨm-dependent manner, exhibiting intensity changes or emission shifts. While these dyes can be effectively used with widefield microscopy for high-throughput applications, confocal microscopy provides superior quantification by eliminating cytosolic background signal that can complicate intensity-based measurements [3]. The aggregation-dependent emission shift of JC-1 (green monomer to red J-aggregates) is particularly well-suited for laser-scanning confocal systems with spectral detection capabilities.
Figure 2: FRET-Based ΔΨm Sensing Mechanism. The diagram illustrates ΔΨm-dependent interaction between donor and acceptor fluorophores, with high potential maintaining proximity for efficient energy transfer and collapsed potential causing separation and FRET disruption [29].
Data Analysis and Interpretation
Image Processing Workflows
Deconvolution for Widefield Imaging:
- Apply iterative deconvolution algorithms (e.g., constrained iterative, blind deconvolution) to computationally remove out-of-focus light
- Require accurate point spread function characterization for optimal results
- Can restore contrast and resolution approaching confocal quality, particularly in thin specimens [3]
Quantitative FRET Efficiency Calculation:
- Calculate FRET efficiency using the formula: E = IA/(ID + IA), where IA and ID represent acceptor and donor intensities respectively [5] [38]
- Correct for spectral bleed-through using control samples with single-labeled fluorophores
- For dynamic ΔΨm monitoring, track FRET efficiency changes over time following treatments
Mitochondrial Morphometrics:
- Segment individual mitochondria using intensity-based thresholding or machine learning approaches
- Quantify spatial heterogeneity of ΔΨm within mitochondrial networks
- Correlate ΔΨm dynamics with morphological parameters (fragmentation, interconnectivity)
Validation and Controls
Essential experimental controls for ΔΨm imaging include:
- Uncoupler treatment (FCCP/CCCP) to collapse ΔΨm and establish minimum signal baseline
- ATP synthase inhibition (oligomycin) to hyperpolarize mitochondria and establish maximum response
- Comparison with established ΔΨm indicators to validate novel probe responses
- Assessment of phototoxicity effects through time-lapse imaging of control samples
The selection of appropriate microscopy modalities for monitoring mitochondrial membrane potential dynamics depends critically on experimental priorities, sample characteristics, and detection strategy. Widefield microscopy offers accessibility and speed for high-throughput applications, while confocal microscopy provides superior optical sectioning for subcellular resolution in moderate-depth specimens. Multiphoton microscopy excels in deep-tissue imaging with reduced phototoxicity in out-of-focus regions.
The integration of these imaging platforms with either FRET-based probes or single-wavelength dyes creates complementary approaches for ΔΨm quantification. FRET-based strategies provide internal calibration and reduced susceptibility to experimental artifacts, while single-wavelength dyes offer simplicity and compatibility with high-content screening. Understanding the performance characteristics, limitations, and optimal application contexts for each microscopy modality enables researchers to design robust experimental frameworks for investigating mitochondrial function in health and disease.
The mitochondrial membrane potential (ΔΨm) is a central mediator of cellular energy production and demand, playing a critical role in processes ranging from insulin secretion in pancreatic beta-cells to neurodegenerative pathways [39] [40]. Accurate measurement of this key parameter is therefore essential for understanding cellular bioenergetics in health and disease. This guide provides a direct comparison between two dominant technological approaches: FRET-based biosensors and single-wavelength potentiometric dyes.
While single-wavelength dyes like TMRM and rhodamine 123 have been widely used as they are relatively affordable and accessible, they are prone to misinterpretation as their fluorescence signal can be influenced by factors beyond just ΔΨm, such as mitochondrial volume density, dye loading efficiency, and plasma membrane potential (ΔΨP) [39] [40]. In contrast, FRET-based biosensors enable researchers to measure the absolute value of ΔΨm unbiased by ΔΨP, providing unprecedented real-time visualization of mitochondrial signaling with exquisite subcellular resolution [41] [39]. The following sections will objectively compare their performance, provide supporting experimental data, and detail a robust protocol for implementing FRET-based ΔΨm imaging.
Performance Comparison: FRET Biosensors vs. Single-Wavelength Dyes
The table below summarizes the critical differences in performance and capability between these two methodologies.
| Feature | FRET-Based Biosensors | Single-Wavelength Dyes (e.g., TMRM, Rhodamine 123) |
|---|---|---|
| Measurement Principle | Ratiometric measurement from two fluorophores, calibrated to account for ΔΨP and other variables [39]. | Fluorescence intensity or "quench-mode" of a single cationic dye that accumulates in mitochondria based on ΔΨm [39] [40]. |
| Spatial Resolution | High, with exquisite subcellular resolution [41]. | High, can resolve individual mitochondria. |
| Temporal Resolution | Excellent for real-time, dynamic monitoring [41]. | Good, but signals can be distorted by slow dye diffusion across membranes [39]. |
| Quantitative Accuracy | High; allows calculation of absolute ΔΨm in millivolts unbiased by ΔΨP [39]. | Semi-quantitative; intensity is a composite signal influenced by ΔΨP, mitochondrial volume, and dye loading [39] [40]. |
| Key Advantages | • Unbiased by ΔΨP or mitochondrial density [39]• Provides absolute calibrated values [39]• High specificity for dynamic ΔΨm changes | • Simpler protocol and setup• More affordable• Suitable for high-throughput screening [40] |
| Key Limitations & Pitfalls | • Requires application-specific biosensors and specialized imaging systems [41]• More complex data processing and calibration | • Signals are often misinterpreted as a direct proxy for mitochondrial function [40]• Rhodamine 123 can yield misleading conclusions in certain conditions (e.g., glucose-stimulated cells) [39]• Low sensitivity and specificity for reporting OXPHOS changes in coupled mitochondria [40] |
Detailed Experimental Protocol for FRET-Based ΔΨm Imaging
The following step-by-step protocol for live-cell imaging of ΔΨm is adapted from established FRET-based methodologies and optimized for single-cell analysis [41] [39].
Before You Begin: Cell Culture and Plasmid Preparation (Day 1)
- Timing: 6-7 days
- Cell Culture: Start a culture of low-passage microglial cells (e.g., HMC3). Maintain cells in supplemented DMEM (10% FBS, 1% Pen/Strep) at 37°C and 5% CO₂. Passage cells when they reach 80–90% confluency. Critical: Do not use cells that are under-confluent (below 40%) or overly confluent (above 95%), as this severely decreases transfection efficiency [41].
- Biosensor Preparation: Obtain the plasmid DNA encoding your FRET-based ΔΨm biosensor. High-quality plasmid DNA increases transfection efficiency. Quantify the DNA, paying attention to the 260 nm/280 nm (~1.7-1.9) and 260 nm/230 nm (~2.0-2.2) ratios for reliable results [41].
Seeding of Cells in Imaging Dishes (Day 2)
- Timing: 30 minutes
- Detach cells: Aspirate the medium from the culture flask. Wash cells with 3 mL PBS (Ca²⁺/Mg²⁺ free) and aspirate. Add 500 μL of 0.5% trypsin and incubate at 37°C for 5 minutes, or until cells are round and detached [41].
- Collect cells: Add 5 mL of supplemented medium to the flask to neutralize the trypsin and pipette to collect all cells. Transfer the suspension to a 15 mL tube and centrifuge at 400 × g for 5 minutes at room temperature [41].
- Resuspend and count: Discard the supernatant and gently resuspend the cell pellet in 1 mL of fresh medium. Count the cells using a hemocytometer or automated cell counter [41].
- Seed cells: Add 2 mL of supplemented medium to a 35 mm imaging dish (e.g., μ-Dish from Ibidi). Seed 2.5 × 10⁴ cells into the dish. Gently pipette the cell suspension in the dish to ensure even distribution and avoid bubbles. Incubate the cells for 12–16 hours at 37°C (5% CO₂) to allow for attachment and spreading [41].
Transfection with FRET Biosensor (Day 3)
- Transfert the cells with the FRET biosensor plasmid using a transfection reagent like jetPRIME, following the manufacturer's instructions [41].
- Incubate the transfected cells for 24-48 hours to allow for sufficient expression of the biosensor.
Live-Cell Imaging and Data Acquisition (Day 4 or 5)
- Timing: 1-2 hours
- Prepare imaging solution: The imaging solution typically contains 140 mM NaCl, 5 mM KCl, 20 mM HEPES, 4 mM Glucose, 1 mM MgCl₂, and 2 mM CaCl₂. Adjust the pH to 7.4 using NaOH [41].
- Mount sample: Replace the culture medium in the imaging dish with the pre-warmed imaging solution. Mount the dish on the microscope stage equipped with an environmental chamber maintained at 37°C.
- Image acquisition: Use a microscope system capable of FRET imaging (e.g., Leica DMI6000 with an external light source and fast shutter, coupled with a highly sensitive camera like an ORCA-Flash4.0) [41].
Data Processing and ΔΨm Calculation
- Background Subtraction: Use image analysis software like FIJI/ImageJ to subtract background fluorescence from both donor and acceptor channels [41].
- FRET Efficiency Calculation: Calculate the FRET ratio (acceptor emission intensity divided by donor emission intensity) for each time point. This ratio is a proxy for FRET efficiency and, consequently, ΔΨm.
- Absolute Calibration: To calculate the absolute magnitude of ΔΨm in millivolts, the fluorescence signal must be corrected using a calibration algorithm that accounts for the dynamics of probe diffusion, mitochondrial volume fraction (VF), and probe binding (aR') [39]. This can be achieved using specialized software packages, such as the Precision FRET (PFRET) package for ImageJ or custom scripts in MATLAB or R [41] [39] [32].
Diagram 1: Experimental workflow for live-cell ΔΨm imaging using FRET-based biosensors, showing key stages from cell preparation to data analysis.
The Biological Context: ΔΨm in the OXPHOS System
To correctly interpret data from any ΔΨm imaging experiment, it is crucial to understand the role of ΔΨm in oxidative phosphorylation (OXPHOS). The mitochondrial membrane potential is the major component of the proton motive force (Δp) across the inner mitochondrial membrane. It is generated by the electron transport chain (ETC), which pumps protons out of the matrix, and is consumed primarily by the ATP synthase to produce ATP [40].
This relationship means that ΔΨm is a balancing act between energy production and consumption. For example:
- Inhibition of ATP synthase (e.g., with oligomycin) reduces ΔΨm consumption, leading to a hyperpolarization (increase in ΔΨm) [40].
- An increase in ATP demand can lead to a transient depolarization (decrease in ΔΨm) as the ATP synthase consumes the ΔΨm faster than the ETC can regenerate it, though the ETC typically responds quickly to repolarize the membrane [40].
- In pancreatic beta-cells, a rise in glucose triggers an increase in ETC activity that hyperpolarizes ΔΨm, which is a key signal that drives insulin secretion [39].
This context is vital because a change in ΔΨm alone does not specify the underlying metabolic state. A hyperpolarized mitochondrion could be highly efficient, or it could be "leaky" and inefficient if the proton gradient is not being used for ATP production [40]. FRET biosensors, with their ability to provide absolute, calibrated measurements, are uniquely positioned to help disentangle these complex bioenergetic states.
Diagram 2: Simplified OXPHOS system showing generation and consumption of the proton motive force (Δp), which includes ΔΨm as its major component.
The Scientist's Toolkit: Essential Research Reagent Solutions
The table below lists key materials required to execute the FRET-based ΔΨm imaging protocol successfully.
| Category | Reagent / Resource | Function / Application | Example Sources / Identifiers |
|---|---|---|---|
| Cell Line | HMC3 Microglia | A model cell line for studying signaling in neurological contexts. | ATCC (CRL-3304) [41] |
| Biosensor | Raichu-RhoA / Custom FRET ΔΨm Biosensor | Genetically encoded probe that changes FRET efficiency in response to changes in ΔΨm. | Prof. Matsuda's lab; Addgene [41] |
| Transfection | jetPRIME Transfection Reagent | Efficiently delivers the biosensor plasmid DNA into mammalian cells. | Polyplus (Cat#114-15) [41] |
| Imaging Dish | μ-Dish 35 mm, high | Optically clear dish specifically designed for high-resolution live-cell imaging. | Ibidi (Cat#81156) [41] |
| Microscope System | Inverted Epifluorescence Microscope | Core imaging system. Requires a stable light source, precise temperature control, and a sensitive camera. | Leica DMI6000 [41] |
| Objective | HCX PL APO CS 63×/1.30 GLYC | High-magnification, high-numerical-aperture objective for superior resolution and light collection. | Leica Microsystems [41] |
| Camera | ORCA-Flash4.0 LT+ Digital CMOS Camera | Highly sensitive camera for detecting low-light fluorescence signals with low noise. | Hamamatsu (Cat#C11440-42U30) [41] |
| Software | FIJI / ImageJ with PFRET package | Open-source software for image analysis and quantification of FRET efficiency. | PMID:22743772 [41] |
| Key Chemicals | Amyloid β Protein Fragment 1–42 | Can be used to stimulate microglia activation in functional experiments. | Sigma-Aldrich (Cat#A9810) [41] |
| Key Chemicals | HEPES Buffer | Maintains a stable pH in the imaging solution during experiments outside a CO₂ incubator. | Sigma-Aldrich (Cat#H3375) [41] |
Protocol for Live-Cell Imaging of ΔΨm Using Single-Wavelength Dyes like TMRE or JC-1
Mitochondrial membrane potential (ΔΨm) is a crucial indicator of cellular health and function, serving as a key parameter for assessing mitochondrial activity in live cells. With typical values ranging from -150 to -180 mV (matrix negative), ΔΨm provides the essential electrochemical gradient that drives ATP synthesis through oxidative phosphorylation [42]. The accurate measurement of this potential is particularly valuable in cancer research, neurodegenerative disease studies, and drug development, where mitochondrial function serves as a critical biomarker for cellular viability and therapeutic response [3] [12].
Among the various techniques available for monitoring ΔΨm, fluorescent dyes represent the most accessible and widely implemented approach for live-cell imaging. Cationic dyes like TMRE and JC-1 offer distinct advantages for different experimental scenarios, providing researchers with flexible tools for quantifying mitochondrial polarization states. These dyes accumulate in the mitochondrial matrix in a Nernstian fashion, with their distribution directly dependent on the magnitude of ΔΨm [42]. This article provides a comprehensive comparison of these essential research tools, outlining their specific applications, protocols, and performance characteristics to guide researchers in selecting the most appropriate dye for their experimental needs.
Technical Comparison of TMRE and JC-1 Dyes
Fundamental Operating Principles
TMRE (Tetramethylrhodamine ethyl ester) operates as a concentration-dependent single-wavelength probe that accumulates in active mitochondria with intact membrane potentials. In this mechanism, the dye distributes across the mitochondrial membrane according to the Nernst equation, where a more negative ΔΨm (hyperpolarized state) leads to increased dye accumulation in the matrix, resulting in higher fluorescence intensity. Conversely, mitochondrial depolarization reduces dye accumulation and decreases fluorescence signal [42]. This linear response makes TMRE particularly suitable for tracking dynamic changes in ΔΨm over time, especially when using ratiometric imaging with a reference fluorophore.
JC-1 (5,5',6,6'-tetrachloro-1,1',3,3'-tetraethylbenzimidazolylcarbocyanine iodide) functions through a unique concentration-dependent J-aggregation phenomenon that enables intrinsic rationetric measurements. At low concentrations present in depolarized mitochondria, JC-1 exists as green-fluorescent monomers (emission ~530 nm). However, in energized mitochondria with high negative potentials, the dye accumulates to sufficient concentrations to form J-aggregates that emit red fluorescence (~590 nm) [43] [44]. This property allows JC-1 to provide a built-in rationetric measurement without requiring additional reference probes, as the red/green fluorescence ratio directly correlates with ΔΨm magnitude.
Comparative Dye Characteristics
Table 1: Technical Specifications and Application Profiles for TMRE and JC-1
| Parameter | TMRE/TMRE | JC-1 |
|---|---|---|
| Primary Detection Mechanism | Concentration-dependent fluorescence intensity | Concentration-dependent J-aggregate formation |
| Signal Output | Single wavelength (~575 nm emission) | Dual emission: Monomers (~529 nm) & J-aggregates (~590 nm) |
| Measurement Modality | Intensity-based (requires reference for ratio) | Intrinsic rationetric (Red/Green ratio) |
| Optimal Use Cases | Kinetic studies of ΔΨm dynamics; acute changes | Population assessment; yes/no polarization screening |
| Key Advantages | Fast equilibration; minimal mitochondrial binding; suitable for chronic studies | Built-in rationetric capability; less sensitive to morphology changes |
| Critical Limitations | Requires careful concentration control; single-channel intensity vulnerable to artifacts | Concentration-sensitive; potential for dye crystallization; slower equilibration |
| Recommended Concentrations | 1-30 nM (non-quenching mode); >50-100 nM (quenching mode) [42] | ~2 μM for live-cell imaging [45] |
| Typical Incubation Time | 15-30 minutes | 15-30 minutes [45] |
Experimental Protocols for Live-Cell Imaging
TMRE Staining and Imaging Protocol
Cell Preparation and Staining:
- Culture cells on appropriate imaging vessels (e.g., glass-bottom dishes or chambered coverslips) until they reach 60-80% confluency.
- Prepare fresh TMRE stock solution in DMSO and dilute in pre-warmed cell culture medium to achieve a working concentration of 20-50 nM for non-quenching mode or 100-200 nM for quenching mode [42].
- Remove culture medium from cells and replace with TMRE-containing medium. Incubate for 15-30 minutes at 37°C with 5% CO₂.
- Following incubation, wash cells twice with pre-warmed PBS or dye-free culture medium to remove excess, non-specific dye.
- For acute treatment studies, maintain TMRE in the bath during imaging if test treatment precedes dye loading. For chronic studies or when treatment follows dye loading, dye-free medium may be used during imaging [42].
Image Acquisition and Analysis:
- Perform imaging using widefield epifluorescence, confocal, or two-photon microscopy systems with appropriate filter sets for tetramethylrhodamine (excitation ~549 nm, emission ~575 nm).
- For quantitative assessments, collect z-stacks to ensure complete mitochondrial representation, particularly in thick cells.
- When possible, implement ratiometric imaging by co-staining with a mitochondrial mass marker (e.g., Mitotracker Green) or a reference fluorophore insensitive to ΔΨm.
- Analyze fluorescence intensity using image analysis software (e.g., ImageJ, Fiji) by quantifying mean pixel intensity in regions of interest corresponding to individual mitochondria.
- Include controls with the uncoupler FCCP (1-5 μM) to confirm specificity of ΔΨm-dependent staining, and with oligomycin (1-5 μM) to observe hyperpolarization responses.
JC-1 Staining and Imaging Protocol
Cell Preparation and Staining:
- Seed cells on imaging-appropriate substrates and culture until 60-80% confluency.
- Reconstitute lyophilized JC-1 dye in high-quality DMSO to create a 200 μM stock solution, ensuring complete dissolution without aggregates [45].
- Dilute JC-1 stock in pre-warmed culture medium or PBS to achieve a 2 μM working concentration.
- Remove culture medium from cells and incubate with JC-1 working solution for 15-30 minutes at 37°C with 5% CO₂, protected from light.
- Following incubation, carefully wash cells twice with pre-warmed PBS or JC-1 assay buffer to remove excess dye.
- For time-course experiments, maintain JC-1 in the bath during imaging to prevent fluorescence changes from probe redistribution [42].
Image Acquisition and Analysis:
- Acquire images using microscopy systems capable of simultaneous or sequential dual-channel detection.
- Configure excitation at 490 nm with emission capture at 530±15 nm (green monomers) and 590±17.5 nm (red J-aggregates) using an optical image splitter or sequential scanning [44].
- For high-resolution applications, employ two-photon microscopy to improve optical sectioning and reduce photodamage during extended imaging sessions [44].
- Calculate the ratio of red-to-green fluorescence intensity on a pixel-by-pixel or region-of-interest basis using image analysis software.
- Validate assay performance using the uncoupler CCCP (10-50 μM) or FCCP (1-10 μM) to induce complete depolarization, which should significantly decrease the red/green ratio.
- Account for potential subcellular heterogeneity in mitochondrial energization, which may be functionally significant in different cellular compartments [44].
Figure 1: Experimental workflow for live-cell imaging of mitochondrial membrane potential using TMRE or JC-1 dyes, highlighting the parallel protocols for each dye option.
Performance Comparison and Experimental Data
Quantitative Comparison of Dye Performance
Table 2: Experimental Performance Characteristics in Live-Cell Imaging Applications
| Performance Metric | TMRE | JC-1 |
|---|---|---|
| Temporal Resolution | Excellent (fast equilibration) [42] | Good (slower equilibration) [42] |
| Spatial Resolution | High (individual mitochondria) | High (individual mitochondria) [44] |
| Detection Sensitivity | Moderate (requires reference for ratio) | High (intrinsic rationetric) [44] |
| Photostability | Moderate | Moderate to Low |
| Toxicity/Phototoxicity | Low (at recommended concentrations) [42] | Moderate (potential ETC inhibition) |
| Quantitative Reliability | Good with proper controls | Excellent (rationetric) [44] |
| Dynamic Range | ~2-3 fold intensity change | ~5-10 fold ratio change [43] |
| Compatibility with Multiplexing | High (single wavelength) | Moderate (requires two channels) |
Representative Experimental Outcomes
In practical applications, TMRE demonstrates superior performance for tracking rapid changes in mitochondrial membrane potential, such as those occurring during calcium signaling or metabolic transitions. The linear response of TMRE fluorescence intensity to ΔΨm changes enables precise quantification when proper controls for mitochondrial morphology and dye loading are implemented [42]. Research data shows that TMRE exhibits minimal binding to mitochondrial membranes and lower inhibition of the electron transport chain compared to other cationic dyes, making it particularly suitable for extended time-lapse experiments [42].
JC-1 provides exceptional capability for distinguishing discrete mitochondrial populations within individual cells based on their polarization states. Experimental evidence from astrocyte studies reveals significant subcellular heterogeneity in ΔΨm, with peripheral mitochondria often exhibiting higher membrane potential than perinuclear counterparts [44]. The rationetric nature of JC-1 enables clear identification of these subpopulations without concentration artifacts, as the red/green ratio remains independent of mitochondrial density and morphology. Studies implementing high-resolution ratiometric JC-1 imaging have successfully identified spontaneous ΔΨm fluctuations in individual mitochondria that represent episodes of increased energization, sometimes synchronized within mitochondrial clusters [44].
The Scientist's Toolkit: Essential Research Reagents
Table 3: Key Reagents and Materials for ΔΨm Imaging Experiments
| Reagent/Equipment | Function/Purpose | Usage Notes |
|---|---|---|
| TMRE (Tetramethylrhodamine ethyl ester) | ΔΨm-sensitive fluorescent dye | Use at 20-50 nM for non-quenching mode; 100-200 nM for quenching mode [42] |
| JC-1 | Rationetric ΔΨm-sensitive dye | Prepare fresh 2 μM working solution from 200 μM DMSO stock [45] |
| FCCP/CCCP | Protonophore uncoupler (positive control) | Use at 1-10 μM to fully depolarize mitochondria [43] |
| Oligomycin | ATP synthase inhibitor (hyperpolarization) | Use at 1-5 μM to induce maximal ΔΨm |
| DMSO (cell culture grade) | Solvent for dye stocks | Keep final concentration ≤0.1-0.2% to maintain cell viability |
| Glass-bottom culture dishes | High-resolution imaging substrate | Ensure compatibility with objective working distance |
| Confocal/widefield microscope | Fluorescence image acquisition | Include appropriate filter sets for dye spectra |
| Image analysis software | Quantitative data extraction | Fiji/ImageJ with suitable plugins for rationetric analysis |
The selection between TMRE and JC-1 for live-cell imaging of mitochondrial membrane potential should be guided by specific experimental objectives and technical requirements. TMRE represents the preferred choice for investigations of rapid ΔΨm dynamics and chronic studies requiring minimal perturbation of mitochondrial function. Its rapid equilibration and reduced toxicity profile make it particularly valuable for extended kinetic analyses and drug screening applications where temporal resolution is paramount [42].
JC-1 offers distinct advantages for population-level assessments and experiments where subcellular heterogeneity in mitochondrial energization is of primary interest. The intrinsic rationetric capability of JC-1 provides built-in compensation for variations in mitochondrial density, dye loading, and photobleaching, making it exceptionally robust for comparative studies across different treatment conditions or cell types [44]. This dye is particularly well-suited for apoptosis studies, toxicity screening, and investigations of metabolic heterogeneity within cell populations.
For comprehensive mitochondrial assessment, researchers should consider implementing both approaches in parallel or sequentially, as each dye provides complementary information about mitochondrial physiology. Additionally, proper validation with pharmacological controls (FCCP/CCCP for depolarization, oligomycin for hyperpolarization) remains essential for accurate interpretation of fluorescence signals, regardless of dye selection. When employed with appropriate experimental design and analytical rigor, these single-wavelength dyes continue to offer invaluable insights into mitochondrial function in health and disease.
Cancer metabolism, characterized by fundamental shifts in energy production known as the Warburg effect, presents a critical therapeutic vulnerability. Research over the last 20 years has confirmed that mitochondrial metabolism remains essential for cancer cell survival and proliferation, coexisting with enhanced glycolytic activity [3]. The metabolic interplay extends beyond tumor cells to the tumor microenvironment, where cancer-associated fibroblasts display enhanced glycolysis, releasing metabolites that fuel mitochondrial metabolism in cancer cells—a phenomenon described as the Reverse Warburg Effect [3].
Monitoring dynamic metabolic parameters is therefore crucial for characterizing cancer metabolism patterns, identifying metabolic vulnerabilities, and discovering new drug targets. Among these parameters, the mitochondrial membrane potential (ΔΨm) serves as a major indicator of mitochondrial health and function, driven by H+ accumulation in the intermembrane space during electron transport [3]. Optical imaging, especially fluorescence microscopy, provides semiquantitative and quantitative readouts with spatiotemporal resolution of mitochondrial metabolism, making it one of the most valuable tools for studying mitochondrial bioenergetics [3].
This review compares two principal fluorescence imaging approaches for monitoring dynamic metabolic shifts: Förster Resonance Energy Transfer (FRET)-based biosensors and single-wavelength fluorescent dyes. We objectively evaluate their performance in tracking ΔΨm dynamics and applications in high-throughput drug screening, providing researchers with experimental data to guide their methodological selections.
Technology Comparison: FRET Biosensors vs. Single-Wavelength Dyes
Fluorescence imaging technologies for monitoring mitochondrial metabolism have evolved along two primary pathways: single-wavelength dyes that change intensity based on metabolic parameters, and rationetric FRET-based biosensors that undergo fluorescence emission shifts in response to biological events.
Single-wavelength dyes represent the traditional approach for monitoring mitochondrial parameters. These environment-sensitive dyes accumulate in specific cellular compartments or respond to changes in membrane potential, typically exhibiting intensity variations. While widely used, their signal is susceptible to concentration-dependent artifacts, photobleaching, and variations in loading efficiency [3] [46].
FRET-based biosensors employ a fundamentally different mechanism involving non-radiative energy transfer between two fluorophores—a donor and an acceptor. When the donor fluorophore is excited, it can transfer energy to an acceptor fluorophore if they are in close proximity (typically 1-10 nm), causing the acceptor to emit fluorescence. Changes in the molecular conformation or cleavage of the biosensor alter the distance or orientation between the fluorophores, modulating FRET efficiency [47] [48]. This molecular design enables rationetric measurements that are less susceptible to concentration variations and photobleaching effects.
Table 1: Technical Comparison of FRET Biosensors and Single-Wavelength Dyes for Metabolic Monitoring
| Feature | FRET Biosensors | Single-Wavelength Dyes |
|---|---|---|
| Measurement Type | Rationetric (emission ratio changes) | Intensity-based |
| Key Advantage | Internal control minimizes artifacts; targets specific molecular events | Simplicity; established protocols |
| Primary Limitation | More complex molecular design and implementation | Susceptible to concentration artifacts |
| Photostability | Can be enhanced via FRET to photostable acceptor [49] | Generally lower; limited by dye properties |
| Spatial Resolution | Subcellular targeting possible | Compartmental accumulation |
| Throughput Compatibility | Well-suited for HTS with plate readers [48] | Compatible but requires careful controls |
| Quantitative Accuracy | Higher due to self-referencing capability | Moderate; requires normalization |
| Dynamic Range | Typically 20-40% ratio change for caspase-3 [48] | Variable; depends on dye and conditions |
FRET-Based Platforms for High-Throughput Drug Screening
FRET-based biosensors have been successfully implemented in high-throughput screening (HTS) platforms designed to identify compounds that induce apoptosis in cancer cells. These platforms exploit the critical role of caspase-3 activation as a decision point in apoptotic cell death [48].
FRET Caspase-3 Sensor Platform
A highly efficient cell-based HTS method utilizes a FRET-based biosensor protein stably expressed in cancer cells. The biosensor consists of three parts: cyan fluorescent protein (CFP), a peptide linker containing the caspase-3 cleavage site (DEVD), and yellow fluorescent protein (YFP) [48]. In viable cells, excitation of CFP leads to FRET and YFP emission. During apoptosis, activated caspase-3 cleaves the DEVD sequence, separating CFP and YFP, thereby reducing FRET and increasing CFP emission while decreasing YFP emission [48].
Table 2: Performance Metrics of FRET Caspase-3 Screening Platform
| Parameter | Performance | Experimental Context |
|---|---|---|
| Apoptosis Detection | Specific for apoptosis (not necrosis) | Superior to conventional viability assays (e.g., MTT) |
| Sensitivity | Detected 10 µM DOX-induced apoptosis in A549-C3 cells | Time-dependent increase in apoptotic cells observed [47] |
| Temporal Resolution | Capable of identifying "tipping points" of apoptosis | Real-time monitoring of caspase-3 activation dynamics [47] |
| Throughput | 96-well plate format compatible with automated readers | Perkin-Elmer Victor3 plate reader with 440 nm excitation [48] |
| Validation | Correlated with conventional caspase-3 activity assays | DNA laddering confirmed apoptotic cell death [48] |
Experimental Protocol: FRET-Based Drug Screening
Cell Line Preparation:
- Generate stable cell lines (e.g., HeLa-C3, A549-C3, MDA-MB-231-C3) expressing caspase-3 biosensor via transfection and geneticin selection [48]
- Clone selection for homogeneous C3 expression to optimize FRET efficiency [47]
- Maintain cells in appropriate medium supplemented with 10% FBS and selection antibiotics
Screening Procedure:
- Seed 10,000 sensor cells per well in 96-well plates
- After overnight culture, remove medium and add 100 µL fresh medium containing test compounds
- Incubate for various time periods (typically 4-48 hours depending on application)
- Read plates using a fluorescence plate reader with excitation at 440±10 nm
- Measure emission at 486±8 nm (CFP channel) and 535±8 nm (YFP channel)
- Calculate FRET ratio (YFP/CFP) for each well [48]
Data Analysis:
- Decreased YFP/CFP ratio indicates caspase-3 activation and apoptosis
- Compare ratio changes to positive and negative controls
- Determine optimal screening time points based on kinetics of caspase-3 activation
Advanced FRET Applications: From 3D Models to In Vivo Imaging
The application of FRET-based screening has expanded beyond traditional 2D cultures to more physiologically relevant models, addressing the limitations of monolayer systems in recapitulating the complex tumor microenvironment.
3D Culture Models
Three-dimensional cell cultures create gradients of oxygen, nutrients, and metabolic waste products that better mimic the in vivo tumor environment. The most common 3D models for drug screening are single cell-type and mixed co-culture spheroids, which exhibit a concentric proliferation gradient with proliferating cells in the periphery and necrotic cells in the core when they reach ~500 μm in diameter [50].
FRET-based sensors have been successfully implemented in 3D tumor models, including tumor slice cultures (3D-TSCs), enabling evaluation of drug pharmacodynamics in a preserved tissue context [47]. However, translating FRET imaging to 3D systems presents challenges including light scattering in thick samples, limited reagent penetration, and the need for specialized imaging techniques such as confocal microscopy [50].
In Vivo FRET Imaging
Recent advances have extended FRET-based drug screening to whole-animal models. Researchers have developed xenograft models in zebrafish embryos and nude mice using cancer cells expressing FRET-based caspase-3 sensors, enabling direct visualization of apoptosis in response to chemotherapeutic agents [47].
Zebrafish Embryo Xenograft Protocol:
- Inject C3-expressing cancer cells into yolk mass of 2 days post-fertilization (dpf) embryos
- Incubate injected embryos with drugs for 24 hours at 28°C
- Measure FRET signal using a fluorescence stereo microscope
- Quantify FRET ratio using ImageJ software [47]
Mouse Xenograft Protocol:
- Subcutaneously inject C3-expressing cancer cells (5×10⁶ cells in 100 μL PBS)
- Allow tumors to develop until they reach 3-4 mm in size (approximately 7 days)
- Administer drug treatments (e.g., 6 mg/kg cisplatin)
- Image anesthetized mice using a fluorescence microscope system [47]
This approach provides a direct method for monitoring drug efficacy and apoptosis induction in vivo, creating a valuable platform for preclinical drug evaluation.
Technical Enhancements: Improving FRET Performance
Recent innovations have addressed key limitations in FRET technology, particularly in photostability and detection sensitivity, expanding its applications in both basic research and drug discovery.
FRET-Enhanced Photostability
A major challenge in single-molecule imaging is tracking proteins or complexes for extended periods in dense cellular environments. Researchers have developed a novel approach using FRET to enhance the photophysical properties of photo-modulatable fluorophores [49].
By positioning a photostable organic dye (e.g., JF646) in close proximity to a photo-modulatable donor fluorophore (e.g., mEos3.2 or PA-JF549), FRET competes with normal photobleaching pathways, increasing donor photostability. This approach extends trajectory lengths for single-molecule tracking in live mammalian cells by 1.5 to 1.7-fold [49]. Further enhancement can be achieved using triplet-state quenchers like Trolox, which reduce photobleaching of both donor and acceptor fluorophores.
Extended-Range FRET for Nanoparticle Tracking
Conventional FRET is limited to distances below 10 nm, restricting applications in larger nanostructures. Recent work has demonstrated that efficient FRET can occur at significantly longer distances (over 15 nm) when multiple acceptors are confined in a small volume, creating a "super acceptor" [51].
This principle has been applied to reconstituted high-density lipoprotein (rHDL) nanoparticles, where donors embedded in the lipid layer transfer energy to multiple acceptors in the core. This extended-range FRET enables monitoring of nanoparticle integrity and payload release, providing a novel strategy for evaluating drug delivery systems [51].
The Scientist's Toolkit: Essential Research Reagents
Table 3: Key Research Reagent Solutions for FRET-Based Metabolic Monitoring and Drug Screening
| Reagent Category | Specific Examples | Function/Application |
|---|---|---|
| FRET Biosensors | Caspase-3 sensor (CFP-DEVD-YFP) [48] | Apoptosis detection in drug screening |
| Fluorescent Proteins | CFP, YFP, mEos3.2, PA-JF549 [49] | Donor and acceptor fluorophores for FRET pairs |
| Organic Dyes | JF646, DiI, IR780 iodide [49] [51] | Photostable acceptors and labeling agents |
| Cell Culture Reagents | Geneticin (G418), Lipofectamine LTX [48] | Selection and transfection for stable cell lines |
| HTS-Compatible Equipment | Fluorescence plate readers (e.g., Perkin-Elmer Victor3) [48] | Automated measurement of FRET ratios in multi-well plates |
| Microscopy Systems | Confocal microscopes, TIRF systems [3] [49] | High-resolution FRET imaging and single-molecule tracking |
| Triplet-State Quenchers | Trolox [49] | Enhanced photostability for prolonged imaging |
Metabolic Pathways and Experimental Workflows
Diagram 1: Metabolic Signaling and FRET Detection Pathway. This diagram illustrates the relationship between mitochondrial metabolic indicators (red arrows) and the FRET-based detection pathway (blue arrows), showing how drug treatments (yellow arrows) influence both metabolic status and apoptotic signaling.
Diagram 2: FRET-Based Drug Screening Pipeline. This workflow outlines the process from initial cell preparation through primary high-throughput screening to secondary validation in increasingly complex model systems, highlighting the integration of FRET technology throughout the drug discovery pipeline.
FRET-based biosensors and single-wavelength dyes offer complementary approaches for monitoring metabolic shifts in cancer cells and conducting high-throughput drug screening. FRET technology provides significant advantages for quantitative tracking of dynamic molecular events in live cells and organisms, particularly through rationetric measurements that minimize artifacts and enable precise detection of apoptosis. The development of more photostable FRET pairs, extended-range FRET applications, and implementation in complex 3D and in vivo models continues to expand the capabilities of this technology.
For drug discovery applications, FRET-based caspase-3 biosensors represent a validated platform for identifying pro-apoptotic compounds with higher specificity than conventional viability assays. As our understanding of cancer metabolism evolves, particularly the complex interplay between glycolysis and oxidative phosphorylation in both tumor cells and their microenvironment, advanced fluorescence imaging approaches will remain essential tools for characterizing metabolic vulnerabilities and identifying novel therapeutic opportunities.
Solving the Signal Puzzle: Overcoming Blinking, Bleaching, and Background in ΔΨm Assays
In fluorescence microscopy, photobleaching—the irreversible photochemical destruction of a fluorophore—represents a fundamental limitation for researchers investigating dynamic cellular processes, particularly in live-cell imaging and single-molecule studies [52]. This phenomenon occurs when fluorophores undergo chemical degradation after repeated cycles of excitation and emission, leading to permanent loss of fluorescence signal [52]. The primary mechanisms involve reactive oxygen species (ROS) generated through interactions between excited fluorophores and molecular oxygen [53] [52]. In the context of monitoring mitochondrial membrane potential (ΔΨm), photobleaching poses a dual threat: it limits observation windows and can produce phototoxicity that compromises cellular viability and experimental integrity [54] [55].
For researchers investigating ΔΨm dynamics, the choice between FRET-based sensors and single-wavelength dyes involves careful consideration of photostability alongside other parameters. This review comprehensively compares combatment strategies for photobleaching, focusing specifically on the roles of oxygen scavenging systems and triplet state quenchers, with supporting experimental data to guide researchers in selecting appropriate methodologies for their experimental systems.
The Photobleaching Mechanism: A Molecular Perspective
Photobleaching arises from photochemical processes initiated when a fluorophore absorbs photons and transitions to excited states [52]. The central pathway involves intersystem crossing from the short-lived singlet excited state (S1) to the longer-lived triplet state (T1) [52]. The extended lifetime of the triplet state (microseconds to milliseconds versus nanoseconds for singlet states) significantly increases the probability of destructive chemical reactions with surrounding oxygen molecules [52].
Two primary photodynamic reaction pathways initiate photobleaching:
- Type I reactions involve electron transfer from the triplet fluorophore to ground-state triplet oxygen (³O₂), generating superoxide anion radicals (O₂•⁻) that can further react to form other ROS like hydrogen peroxide (H₂O₂) and hydroxyl radicals (•OH) [52].
- Type II reactions involve direct energy transfer from the triplet fluorophore to ³O₂, generating highly reactive singlet oxygen (¹O₂) [52].
These ROS subsequently attack and degrade the fluorophore's molecular structure, leading to irreversible destruction of its fluorescent properties [52]. The entire process is summarized in the following diagram:
Combatment Strategy I: Oxygen Scavenging Systems
Mechanism and Implementation
Oxygen scavenging systems function by enzymatically depleting dissolved molecular oxygen from imaging solutions, thereby limiting the substrate available for photobleaching reactions [56]. These systems typically employ paired enzyme systems that convert oxygen into less reactive species through specific biochemical pathways.
The most well-characterized systems include:
Protocatechuic Acid/Protocatechuate-3,4-Dioxygenase (PCA/PCD) System: This system utilizes PCA as a substrate that PCD enzymatically cleaves while consuming oxygen [56]. Research demonstrates this system achieves lower dissolved oxygen concentrations compared to the glucose oxidase/catalase system, resulting in increased initial lifetimes for single Cy3, Cy5, and Alexa488 fluorophores [56].
Glucose Oxidase/Catalase System: This established system uses glucose oxidase to convert glucose and oxygen into gluconolactone and hydrogen peroxide, with catalase then decomposing hydrogen peroxide to water and oxygen [5] [56].
Protocol for Oxygen Scavenging System Implementation
Materials Required:
- PCA/PCD System: Protocatechuic acid (PCA), protocatechuate-3,4-dioxygenase (PCD) [56]
- Glucose Oxidase/Catalase System: Glucose oxidase, catalase, glucose [5]
- Tris-based imaging buffer (pH 8.0) [5]
- Salts for physiological conditions (e.g., 50-100 mM NaCl) [5]
Procedure:
- Prepare imaging buffer with standard components (Tris-HCl, NaCl) at appropriate pH [5].
- Add the oxygen scavenging system components immediately before imaging:
- Mix thoroughly and apply to sample for imaging.
- For immobilized molecule studies, ensure proper sealing to prevent oxygen diffusion during extended imaging sessions [5].
Performance Comparison of Oxygen Scavenging Systems
Table 1: Quantitative comparison of oxygen scavenging system performance
| System | Components | Final Concentrations | Relative Dissolved O₂ | Effect on Fluorophore Lifetime | Key Applications |
|---|---|---|---|---|---|
| PCA/PCD | Protocatechuic acid (PCA), Protocatechuate-3,4-dioxygenase (PCD) | 2.5-5 mM PCA, 50-100 nM PCD [56] | Lower than GOx/Catalase [56] | Increased initial lifetimes for Cy3, Cy5, Alexa488 [56] | smFRET, single-molecule tracking [56] |
| Glucose Oxidase/Catalase | Glucose oxidase, Catalase, Glucose | 1-5 mg/mL GOx, 0.04-0.2 mg/mL catalase, 1-5% glucose [5] | Higher than PCA/PCD [56] | Moderate improvement in photostability [5] | General fluorescence microscopy, live-cell imaging [5] |
Combatment Strategy II: Triplet State Quenchers
Mechanism and Implementation
Triplet state quenchers (TSQs) operate through an alternative mechanism by directly targeting the triplet state of fluorophores, providing a competing relaxation pathway that bypasses ROS-producing reactions [5] [28]. These compounds facilitate de-excitation of fluorophores from the long-lived triplet state back to the ground state, thereby reducing the population of fluorophores susceptible to photobleaching reactions [5].
The most effective TSQs include:
Trolox: A water-soluble vitamin E analog that effectively suppresses blinking and stimulates prolonged emission of fluorophores [5]. It reduces the residence time in the triplet dark state, decreasing fluorescence intermittency and signal saturation [5].
Cyclooctatetraene (COT): Functions through energy transfer quenching, reducing the lifetime of the triplet state by up to 50-fold [53].
Nitrobenzyl Alcohol (NBA): Exhibits protective effects through a distinct mechanism from COT, though the precise pathway remains under investigation [53].
Advanced "Self-Healing" Fluorophore Designs
Recent innovations have focused on covalent linkage of TSQs directly to fluorophores, creating "self-healing" dyes that circumvent the need for high concentrations of quenching agents in solution [53]. These engineered fluorophores demonstrate dramatically improved photostability while minimizing potential biological perturbations [53].
Key developments include:
- Cyanine-PA conjugates: Cy5 covalently linked to COT, NBA, or Trolox (Cy5-PA) showing substantially reduced rates of ROS generation and photobleaching [53].
- LD dyes: Self-healing cyanine-class fluorophores (LD555, LD655) with integrated triplet state suppression capabilities [28].
Protocol for Triplet State Quencher Implementation
Materials Required:
- Trolox (100× stock in DMSO, pH adjustment may be required) [5]
- Alternative TSQs: COT, NBA, β-mercaptoethanol (BME) [53]
- Oxygen scavenging system (recommended for synergistic effect) [5]
- Appropriate biological buffer
Procedure:
- Prepare imaging buffer with oxygen scavenging system if applicable.
- Add TSQ to the final working concentration:
- For self-healing fluorophores, follow standard labeling protocols without additional TSQ requirements [53].
- Apply solution to samples and proceed with imaging.
Performance Comparison of Triplet State Quenchers
Table 2: Quantitative comparison of triplet state quencher performance
| Quencher | Mechanism | Final Concentration | Photostability Enhancement | Effect on Blinking | Key Applications |
|---|---|---|---|---|---|
| Trolox | Triplet state quenching | 1-2 mM [5] | Increases Cy3 stability by ~2-fold (vs. βME) [5] | Suppresses blinking, stimulates prolonged emission [5] | Live-cell imaging, smFRET, SPT [49] |
| β-Mercaptoethanol (BME) | Reducing agent | 142 mM [5] | Moderate improvement | Increases blinking frequency and duration for Cy5 [56] | General fluorescence microscopy |
| Covalent Cy5-COT | Intramolecular triplet state quenching | N/A (covalent modification) | Up to 50-fold reduction in triplet state lifetime [53] | Reduces dark state formation [53] | Super-resolution microscopy, single-molecule studies [53] |
| Self-healing Dyes (LD555/LD655) | Intramolecular stabilization via Baird aromatic COT | N/A (engineered fluorophore) | Robust triplet suppression, enables accurate FRET efficiency determination [28] | Minimizes blinking artifacts [28] | High-intensity smFRET, quantitative imaging [28] |
Integrated Approaches and Experimental Considerations for ΔΨm Monitoring
Synergistic Effects of Combined Strategies
The most effective photobleaching mitigation employs oxygen scavenging systems and triplet state quenchers in combination, addressing both the substrate (oxygen) and the pathway (triplet state) of photodamage simultaneously [5]. Research demonstrates that Trolox significantly enhances the performance of oxygen scavenging systems, particularly for FRET-based imaging [49].
For ΔΨm monitoring studies, this combined approach enables extended observation of mitochondrial dynamics while minimizing phototoxic effects that can compromise membrane potential itself [54] [55]. The integration of these strategies with advanced fluorophore designs represents the current state-of-the-art for prolonged live-cell imaging.
Practical Implications for ΔΨm Research
The choice between FRET-based sensors and single-wavelength dyes for ΔΨm monitoring involves trade-offs regarding photostability:
- FRET-based sensors benefit from intrinsic ratiometric measurements that compensate for some photobleaching effects, and can be further stabilized through engineered FRET pairs that enhance photostability [49].
- Single-wavelength dyes (e.g., TMRE, Mitotracker derivatives) provide simpler implementation but require more robust photostabilization for quantitative time-lapse studies [54] [55].
The following diagram illustrates the integrated experimental workflow for implementing these photostabilization strategies in ΔΨm research:
The Scientist's Toolkit: Essential Research Reagents
Table 3: Key research reagents for combating photobleaching
| Reagent Category | Specific Examples | Function | Implementation Notes |
|---|---|---|---|
| Oxygen Scavenging Systems | PCA/PCD system, Glucose oxidase/Catalase [56] | Enzymatic removal of dissolved oxygen | PCA/PCD achieves lower O₂ concentrations than glucose oxidase system [56] |
| Triplet State Quenchers | Trolox, COT, NBA, β-mercaptoethanol [5] [53] | Quench triplet states, reducing ROS generation | Trolox effective at 1-2 mM; covalent linkage enhances performance [5] [53] |
| Self-Healing Fluorophores | Cy5-COT, Cy5-NBA, Cy5-Trolox, LD555, LD655 [53] [28] | Intramolecular triplet state quenching | Bypass need for high soluble TSQ concentrations; reduce phototoxicity [53] |
| FRET-Stabilized Pairs | mEos3.2-JF646, PA-JF549-JF646 [49] | FRET competes with photobleaching pathways | Increases photon budget 1.7-fold; extends trajectory lengths in live cells [49] |
| Mitochondrial Dyes | TMRE, Mitotracker Green (MTG), NAO [54] [55] | ΔΨm-sensitive probes | NAO shows higher phototoxicity than MTG; TMRE requires careful concentration optimization [54] |
The systematic implementation of oxygen scavenging systems and triplet state quenchers represents a critical methodology for combating photobleaching in fluorescence imaging, particularly for dynamic ΔΨm monitoring studies where extended observation and minimal phototoxicity are paramount. The experimental data presented herein demonstrates that while both strategies provide significant individual benefits, their synergistic combination—potentially enhanced through advanced fluorophore engineering—delivers the most robust photoprotection.
For researchers designing ΔΨm studies, the selection of specific approaches should balance photostability requirements with biological compatibility, considering that FRET-based sensors may offer advantages for ratiometric measurements and engineered stability. As fluorescence imaging continues to advance toward higher resolutions and longer durations, the strategic integration of these photobleaching combatment methods will remain essential for generating accurate, biologically relevant data.
In the investigation of dynamic biological processes, such as mitochondrial membrane potential (ΔΨm), Förster Resonance Energy Transfer (FRET) provides unparalleled capability to monitor nanometer-scale distances and interactions in real-time. However, the technique is susceptible to photophysical artifacts, particularly dye blinking, which can obscure true biological signals and lead to erroneous interpretation of data. Blinking refers to the phenomenon where fluorophores temporarily cease emitting light, entering long-lived "dark states" on timescales ranging from microseconds to seconds [10]. In FRET experiments, acceptor dye blinking is particularly problematic because the temporary loss of acceptor emission can be misinterpreted as a loss of FRET efficiency, potentially mimicking genuine conformational changes or biomolecular interactions [10] [57]. This comprehensive guide compares the two principal strategies for mitigating blinking artifacts: chemical stabilization of the fluorophore's local environment and computational removal of affected events during data analysis, providing researchers with objective performance data to inform their experimental design.
Chemical Stabilization of Fluorophores
Chemical stabilization employs specific reagents in the imaging buffer to suppress the photophysical pathways that lead to blinking, thereby extending the fluorophore's functional observation time.
Mechanism of Action
Molecular oxygen is a dual-role agent in fluorescence. While it effectively quenches a dye's triplet state, it also generates highly reactive oxygen species that cause irreversible photobleaching [5]. Removing oxygen reduces bleaching but prolongs residence in the triplet dark state, causing pronounced blinking [5]. Chemical stabilization addresses this paradox by introducing alternative quenching pathways. A vitamin E analog, Trolox (2 mM), acts as an excellent triplet state quencher that suppresses this blinking and stimulates prolonged dye emission [5]. Imaging buffers often combine oxygen-scavenging systems with Trolox or other additives like β-mercaptoethanol (βME) to collectively enhance photostability.
Experimental Protocol for Buffer Preparation
- Trolox Stock Solution: Prepare a 100× stock solution (200 mM) of Trolox in dimethyl sulfoxide (DMSO). Adjust the pH as necessary and filter-sterilize the solution. This stock can be aliquoted and stored at -20°C [5].
- Oxygen Scavenging System: A common system includes Protocatechuic Acid (PCA) and Protocatechuate-3,4-Dioxygenase (PCD). Alternatively, glucose oxidase/catalase systems can be used.
- Working Imaging Buffer: A typical buffer for smFRET may contain:
- 10 mM Tris-HCl (pH 8.0)
- 50 mM NaCl
- An oxygen scavenging system (e.g., PCA/PCD)
- 2 mM Trolox (from the 100× stock) [5]
- Validation: The efficacy of the buffer should be validated by comparing the average photobleaching time constant and blink frequency of a reference sample (e.g., doubly-labeled DNA duplex) with and without the additives.
Performance Data
The table below summarizes the performance of common FRET dye pairs under different chemical environments, demonstrating the enhancement in photostability.
Table 1: Photostability of Common smFRET Dye Pairs in Different Chemical Environments [5]
| Dye | Role | Average Photobleaching Time Constant (s) in Trolox/βME | Relative Brightness | Notes |
|---|---|---|---|---|
| Cy3 | Donor | 91 / 50 | 1.0 (reference) | Gold standard for donors |
| ATTO550 | Donor | 72 / 27 | 1.9 | Higher brightness |
| Alexa555 | Donor | 65 / 35 | 0.8 | |
| Cy5 | Acceptor | 82 / 25 | 1.0 (reference) | Gold standard for acceptors |
| ATTO647N | Acceptor | 62 / 31 | 1.3 | |
| Alexa647 | Acceptor | 58 / 20 | 1.2 | Severe dark state formation with βME |
Computational Removal of Blinking Artifacts
Computational approaches post-process single-molecule data to identify and exclude photons or bursts contaminated by blinking events, allowing for the recovery of accurate kinetic information.
Mechanism of Action
This method leverages the fact that blinking manifests as specific, short-lived patterns in the photon data stream. Multiparameter Hidden Markov Modeling (mpH²MM) is a powerful photon-by-photon analysis technique that can disentangle FRET-related signal changes from fluctuations caused by dye blinking [10]. It infers the most likely sequence of molecular states (including FRET states and blinking states) from the observed stream of photons, characterized by their arrival time, color, and other parameters. Once the model identifies blinking states, the bursts of photons affected by these events can be filtered out, leaving a cleaner dataset for analysis.
Experimental Workflow for mpH²MM-Guided Cleaning
The following diagram illustrates the workflow for the computational removal of blinking artifacts from confocal burst smFRET data.
- Data Acquisition with Alternating Laser Excitation (ALEX): Conduct smFRET experiments using pulsed interleaved excitation (PIE), where donor and acceptor lasers are alternated at high frequency (e.g., 26.67 MHz) [10]. This allows independent monitoring of both dyes.
- Burst Search and Photon Data Export: Identify fluorescence bursts from diffusing single molecules and export the complete photon data (arrival time, color, excitation source, etc.) for analysis.
- mpH²MM Modeling: Apply the mpH²MM algorithm to the photon data from all bursts to determine the optimal number of states and their parameters (FRET efficiencies, lifetimes, transition rates). The model will typically identify short-lived "blinking states" with characteristic signatures, such as zero acceptor emission.
- Burst Filtering: Using the model output, apply a filter (e.g., an ALEX-2CDE filter or a custom mpH²MM-guided filter) to remove bursts that show evidence of blinking during their transit [10].
- Analysis of Cleaned Data: Perform final analysis (e.g., FRET efficiency histograms, kinetic analysis with a refreshed mpH²MM) on the filtered dataset.
Performance Data
Application of this computational cleaning workflow has demonstrated significant correction of blinking-induced bias. Studies on dynamic DNA hairpins showed that mpH²MM analysis of raw data contaminated with blinking systematically underestimated FRET state exchange rates and distorted the FRET efficiency–stoichiometry (E-S) histograms. After removing blinking-affected bursts, the accuracy of the recovered exchange rates was restored, and the E-S histogram profiles were corrected [10]. The primary trade-off is a reduction in the total number of usable bursts.
Comparative Analysis: Chemical vs. Computational Strategies
The choice between chemical and computational strategies is not mutually exclusive, but understanding their relative strengths and limitations is crucial for experimental design.
Table 2: Performance Comparison of Blinking Mitigation Strategies
| Aspect | Chemical Stabilization | Computational Removal |
|---|---|---|
| Primary Mechanism | Suppresses triplet state formation via buffer additives [5]. | Identifies and removes blinking events post-acquisition [10]. |
| Impact on Data Collection | Increases the number of usable photons/bursts by reducing dark states. | Decreases the number of usable bursts by discarding affected events. |
| Best Suited For | All single-molecule modalities, especially long-timescale immobilized molecule studies. | Diffusion-based (burst) smFRET with alternating excitation [10]. |
| Key Advantages | - Acts proactively during data acquisition.- Simplifies initial data analysis.- Increases signal-to-noise ratio. | - Does not alter the native chemical environment.- Can resolve dynamics on timescales close to blinking.- Powerful for complex kinetic analysis. |
| Key Limitations | - Buffer may interfere with biological function.- Cannot eliminate blinking entirely.- Requires optimization for different dyes. | - Requires complex instrumentation (e.g., PIE).- Steep learning curve for analysis.- Risk of over-filtering and losing rare events. |
| Effect on Kinetic Parameters | Provides more continuous traces for reliable rate calculation. | Corrects the systematic underestimation of state exchange rates caused by blinking [10]. |
Successful implementation of blinking mitigation strategies requires specific reagents and software tools.
Table 3: Essential Research Reagent Solutions
| Item | Function/Description | Example Vendors / Sources |
|---|---|---|
| Cy3/Cy5 Dye Pair | Classic, well-characterized donor-acceptor pair for smFRET [5]. | GE Healthcare, Lumiprobe |
| Trolox | Triplet state quencher; suppresses blinking and enhances photostability [5]. | Sigma-Aldrich, Tocris Bioscience |
| Oxygen Scavenging System (PCA/PCD) | Enzymatic system to remove dissolved oxygen and prevent photobleaching. | Sigma-Aldrich |
| ATTO550/ATTO647N | High-brightness alternative dye pair with good performance [5]. | ATTO-TEC GmbH |
| Home-built TIRF/Confocal Microscope | Custom microscopes for smFRET; can be built from off-the-shelf components [5]. | Various optics manufacturers |
| mpH²MM Analysis Software | Freely available software for photon-by-photon HMM analysis of smFRET data [10]. | FRETBursts, H2MM (available online) |
Both chemical stabilization and computational artifact removal are indispensable for robust FRET analysis, particularly in demanding applications like dynamic ΔΨm monitoring. The most effective strategy often involves a synergistic combination: using chemical stabilization to maximize the initial data quality, followed by computational cleaning to eliminate residual artifacts and ensure the highest analytical accuracy. For studies where preserving the native cellular environment is paramount, computational methods may take precedence. Conversely, for high-throughput screening or systems incompatible with complex optics, optimized chemical buffers may provide a sufficient solution. By understanding the mechanisms, protocols, and performance trade-offs outlined in this guide, researchers can strategically address dye blinking to unveil the true dynamics of their biological systems with confidence.
In the study of dynamic biological processes, such as fluctuations in mitochondrial membrane potential (ΔΨm), Fӧrster Resonance Energy Transfer (FRET) offers a powerful advantage over single-wavelength dyes: its intrinsic rationetric capability. This built-in correction for variations in probe concentration and excitation intensity makes it exceptionally valuable for monitoring subtle, real-time changes in live cells [18] [29]. However, the accuracy of any fluorescence measurement, including FRET, is fundamentally limited by its Signal-to-Noise Ratio (SNR). Background fluorescence and cellular autofluorescence are major contributors to noise, particularly in FRET experiments where energy transfer efficiencies can be low and the signal changes are often subtle [58] [59]. For researchers and drug development professionals, implementing robust strategies to mitigate these artifacts is not merely an optimization step but a prerequisite for obtaining reliable, quantitative data. This guide compares the performance of conventional correction methods against a more advanced pixel-level approach, providing the experimental protocols and data to inform the choice of strategy for dynamic ΔΨm monitoring and other FRET-based applications.
Methodological Comparison: Conventional Averaging vs. Pixel-by-Pixel Correction
A key challenge in quantitative FRET microscopy is separating the specific signal of the FRET pair from the inherent autofluorescence of the cell. The standard approach has been to measure the average autofluorescence from an unlabeled sample region and subtract this uniform value from the entire image. While simple, this method fails when autofluorescence levels vary spatially within a single cell or tissue sample.
Advanced Strategy: Pixel-by-Pixel Autofluorescence Correction
A superior method involves acquiring an additional, autofluorescence-specific channel and performing correction on a pixel-by-pixel basis [59]. This technique requires four fluorescent channels:
- I₀: Autofluorescence channel (blue-shifted relative to the donor).
- I₁: Donor channel.
- I₂: FRET channel (donor excitation, acceptor emission).
- I₃: Acceptor channel.
Experimental Protocol for Pixel-by-Pixel Correction [59]:
- Instrument Background Subtraction: Measure and subtract the instrument background for each channel using a non-fluorescent slide.
- Determine Spillover Factors (S1-S6): Using samples labeled with only the donor or only the acceptor dye, calculate the spectral spillover factors. For example, ( S1 = I2^D / I_1^D ) represents the donor signal leaking into the FRET channel.
- Determine Autofluorescence Factors (B1-B3): Using unlabeled cellular samples (Nl), calculate the factors that describe how autofluorescence in the I₀ channel spills into the other channels: ( B1 = I1^{Nl} / I0^{Nl} ), ( B2 = I2^{Nl} / I0^{Nl} ), and ( B3 = I3^{Nl} / I_0^{Nl} ).
- Image Analysis: The corrected FRET efficiency is then calculated by solving a set of equations that account for all these factors for every pixel in the image. This process is facilitated by specialized software, such as the RiFRET v2 ImageJ plugin.
The logic of this comprehensive correction workflow, which integrates measurements from multiple samples to achieve high-accuracy FRET efficiency maps, is summarized in the diagram below.
Quantitative Performance Data
The superiority of the pixel-by-pixel correction method is demonstrated by its performance in challenging but common experimental conditions, particularly at low signal levels and with spatially varying autofluorescence.
Table 1: Comparison of Autofluorescence Correction Methods in FRET Microscopy
| Correction Method | Low Signal-to-Autofluorescence Ratio | Spatially Varying Autofluorescence | Reported Accuracy of FRET Efficiency (E) | Key Limitation |
|---|---|---|---|---|
| Average Background Subtraction | Poor performance; high uncertainty in E [59] | Poor performance; cannot correct for local variation [59] | Low; significant deviation from true value | Assumes uniform autofluorescence, which is rarely true in biological samples |
| Pixel-by-Pixel Autofluorescence Correction | Superior performance; maintains accuracy [59] | Superior performance; corrects local variation [59] | High; accurate determination of E ≥ ~5% [59] | Requires an additional fluorescence channel and more complex calibration |
Table 2: Benchmark Precision of Intensity-Based smFRET Measurements [30]
| Sample Description | Dye Pair | Mean FRET Efficiency (E) | Inter-Lab Standard Deviation (σ) |
|---|---|---|---|
| DNA, 23-bp separation | Atto 550 / Atto 647N | Low E | ± 0.02 to ± 0.05 |
| DNA, 15-bp separation | Atto 550 / Atto 647N | Medium E | ± 0.02 to ± 0.05 |
| DNA, 23-bp separation | Atto 550 / Alexa Fluor 647 | Low E | ± 0.02 to ± 0.05 |
The Scientist's Toolkit: Essential Reagents and Materials
Successful implementation of high-SNR FRET experiments relies on a carefully selected set of reagents and tools.
Table 3: Research Reagent Solutions for FRET Microscopy
| Item | Function/Description | Key Consideration for SNR |
|---|---|---|
| Red-Shifted FRET Pairs (e.g., Alexa Fluor 546/Alexa Fluor 647) [59] | Donor and acceptor dyes with excitation/emission in the red spectrum. | Red-shifted dyes minimize interference from cellular autofluorescence, which is more pronounced in green wavelengths [59]. |
| Cell-Free Calibration Standards [59] | Slides with known concentrations of donor and acceptor dyes, void of autofluorescence. | Enable accurate determination of all spectral spillover factors (S1-S6) without the confounding effect of cellular autofluorescence [59]. |
| Mitochondria-Immobilized Probes (e.g., DPP) [60] | Fluorescent probes that covalently bind to mitochondrial thiol residues. | Prevents probe leakage during mitochondrial depolarization (e.g., in mitophagy), ensuring a stable signal and accurate spatial localization [60]. |
| Oxygen Scavenging Systems [10] | Chemical systems to reduce photobleaching and dye blinking. | Mitigates blinking artifacts in single-molecule FRET, which can be misinterpreted as dynamic changes and reduce SNR [10]. |
| Analysis Software (e.g., RiFRET v2 for ImageJ/Fiji) [59] | Software plugins designed for quantitative FRET analysis. | Enables implementation of pixel-by-pixel correction algorithms and batch processing of large datasets for robust, high-throughput analysis [59]. |
Integrated Workflow for High-SNR FRET Imaging
Combining the strategies and tools above creates a powerful workflow for reliable FRET measurements. The relationship between sample preparation, data acquisition, and advanced analysis in mitigating specific artifacts is illustrated in the following workflow.
For dynamic monitoring of ΔΨm and other subtle physiological processes, the choice of strategy for mitigating background and autofluorescence is paramount. While conventional average subtraction may suffice for homogeneous samples with high signal levels, the pixel-by-pixel autofluorescence correction method provides a demonstrably more accurate and reliable pathway for quantitative FRET measurements, especially under challenging conditions. When combined with the strategic use of red-shifted dyes, cell-free calibration standards, and advanced analysis software, this approach empowers researchers to push the boundaries of SNR, thereby uncovering deeper biological insights with greater confidence.
Förster Resonance Energy Transfer (FRET) provides a powerful spectroscopic ruler for measuring nanometer-scale distances and their dynamics in biological systems. However, the accurate quantification of FRET efficiency is highly dependent on correcting for photophysical and instrumental variables, primarily through the γ-factor, which accounts for differences in dye quantum yield and detection efficiency. This guide systematically compares methods for determining γ, including photobleaching, empirical measurement, and filter-based calculation. We present quantitative data demonstrating that proper normalization reduces FRET efficiency deviations and is critical for achieving inter-laboratory reproducibility, with distance uncertainties of ≤2 Å precision and ≤5 Å accuracy in proteins. Framed within the broader application of monitoring mitochondrial membrane potential (ΔΨm) dynamics, this review underscores that rigorous correction protocols are what enable FRET to outperform single-wavelength dyes in providing accurate, dynamic, and rationetric measurements in complex cellular environments.
Fluorescence Resonance Energy Transfer (FRET) is a cornerstone technique for studying biomolecular interactions, conformational changes, and cellular microenvironments, with a critical application in monitoring dynamic shifts in mitochondrial membrane potential (ΔΨm) [9] [61]. The efficiency of energy transfer (E) is intrinsically linked to the distance (R) between a donor and an acceptor fluorophore by the well-established Förster relationship, E = 1 / [1 + (R/R₀)⁶] [5] [62]. While this makes FRET a powerful spectroscopic ruler, the experimentally observed FRET efficiency is not a direct readout of this true efficiency.
The signal measured by a microscope is the proximity ratio (EPR), defined as IA / (IA + ID), where IA and ID are the measured acceptor and donor intensities, respectively [62]. This raw ratio is dependent on the specific instrument's optical path and the inherent photophysical properties of the dyes used. To recover the true FRET efficiency (E), which can be reliably compared across experiments and converted into distance, the data must be corrected for spectral crosstalk and, most importantly, normalized by the γ-factor [62] [16]. The γ-factor is defined as γ = (ηA / ηD) × (φA / φD), where η represents the detection efficiency and φ the quantum yield of the acceptor and donor dyes [62]. Failure to account for γ can lead to significant inaccuracies in reported distances and misinterpretation of biological phenomena. This review provides a comparative guide to the methods for determining γ, equipping researchers with the protocols needed to achieve quantitative and reproducible FRET measurements, particularly in the context of dynamic ΔΨm monitoring where accuracy is paramount.
The Scientist's Toolkit: Essential Reagents and Materials for smFRET
Table 1: Key Research Reagent Solutions for smFRET Experiments
| Reagent Category | Specific Examples | Function & Importance |
|---|---|---|
| Fluorophores | Cy3, Cy5, Alexa Fluor 546, Alexa Fluor 647, ATTO550, ATTO647N [5] [16] | Serve as the donor and acceptor pair. Must be bright, photostable, and have sufficient spectral overlap. |
| Photostabilizing Agents (TSQs) | Trolox, β-mercaptoethanol (BME), cyclooctatetraene (COT), ascorbic acid (AA) [5] [28] | Suppress triplet-state accumulation and photobleaching, enabling longer and more accurate observation. |
| Oxygen Scavenging System | Glucose oxidase/catalase in glucose [62] | Removes molecular oxygen, a primary source of fluorophore photobleaching. |
| Surface Passivation | PEG-coated, BSA-biotin surfaces [5] | Prevents non-specific adhesion of biomolecules to the imaging surface. |
| Immobilization Chemistry | Biotin-streptavidin conjugation [5] [62] | Tethers molecules of interest to the passivated surface for prolonged observation. |
| DNA Rulers | Double-stranded DNA with defined dye separations [62] [28] | Calibration standards with known distances for validating FRET efficiency measurements and γ correction. |
Comparative Analysis of γ-Normalization Methods
The recovery of true FRET efficiency requires the application of correction factors, leading to the formula: E = (IA - β ID) / ((IA - β ID) + γ ID), where β corrects for donor emission leakage into the acceptor channel [62]. The accuracy of the γ-factor is thus critical. We compare three primary methods for its determination.
Table 2: Comparison of γ-Normalization Methodologies
| Method | Theoretical Basis | Experimental Workflow | Performance & Key Findings |
|---|---|---|---|
| Photobleaching (γPhotobleach) | Exploits the single-step photobleaching of the acceptor fluorophore [62] [63]. | 1. Acquire a single-molecule time trajectory.2. Identify a molecule where the acceptor bleaches before the donor in a single step.3. Calculate γ = (IPreA - IPostA) / (IPostD - IPreD), where "Pre" and "Post" refer to intensities before and after acceptor photobleaching. | Most effective for immobilized molecules [62]. Per-molecule γ-normalization can reduce FRET distribution width by identifying and correcting for outliers [62]. |
| Empirical (γEmpirical) | Directly measures the parameters that constitute γ [62]. | 1. Quantum Yield (φ): Measure using a standard dye with known quantum yield.2. Detection Efficiency (η): Determine using a calibrated light source.3. Calculate: γ = (ηA/ηD) × (φA/φD). | Highly effective but requires significant experimental effort and dedicated control experiments [62]. |
| Filter-Based Calculation | Uses manufacturer-provided filter transmission properties to estimate the relative detection efficiency (ηA/ηD) [62]. | 1. Obtain transmission spectra for all emission filters and dichroic mirrors.2. Calculate the theoretical detection efficiency ratio for the specific optical path. | Less effective than empirical or photobleaching methods. It reduces but does not eliminate FRET deviations, as it does not account for differences in quantum yield (φA/φD) [62]. |
Beyond γ, recent research highlights that triplet-state mitigation is equally crucial for accurate FRET efficiency. Under elevated illumination needed for single-molecule studies, fluorophores populate long-lived, non-fluorescent triplet states. This accumulation causes illumination-intensity-dependent decreases in measured FRET efficiency. Robust suppression using triplet-state quenchers like Trolox or "self-healing" fluorophores is essential to recover true FRET values [28].
Experimental Protocols for Key smFRET Procedures
Protocol 1: Determining γ by Acceptor Photobleaching
This protocol is designed for single-molecule FRET experiments with immobilized molecules [62].
- Sample Preparation: Immobilize your biotinylated and dye-labeled biomolecule (e.g., a DNA ruler or protein) on a PEG-passivated, BSA-biotin functionalized surface. Use an imaging buffer containing an oxygen scavenging system (e.g., 1% glucose, glucose oxidase, and catalase) and triplet state quenchers (e.g., 2 mM Trolox) to enhance photostability [5] [62].
- Data Acquisition: Perform TIRF or wide-field microscopy to collect movies of single molecules. Use a laser power that allows for clear observation of single-step photobleaching events.
- Molecule Selection: Analyze the movies to identify single molecules that exhibit a single, abrupt photobleaching event of the acceptor dye, followed by a subsequent increase in donor fluorescence intensity. The donor must remain fluorescent after the acceptor bleaches.
- Intensity Calculation: For a selected molecule, manually define the frame of acceptor photobleaching. Calculate the average donor and acceptor intensities for the 20 frames immediately before (IPreD, IPreA) and after (IPostD, IPostA) this event.
- γ Calculation: Apply the formula: γPhotobleach = (IPreA - IPostA) / (IPostD - IPreD). This value is calculated for individual molecules, and a population average can be used for global normalization, though per-molecule correction is more precise [62].
Protocol 2: Sample Preparation for smFRET using DNA Rulers
DNA molecules with known dye separations are indispensable controls for validating FRET measurements and normalization procedures [62].
- Oligonucleotide Design: Design or purchase HPLC-purified, complementary DNA strands. One strand should be labeled with the donor dye (e.g., Cy3) and the other with the acceptor dye (e.g., Cy5). At least one strand should contain a 5' or 3' biotin modification for surface immobilization.
- Annealing: Combine equimolar amounts (e.g., 1 µM each) of the donor-labeled and acceptor-labeled strands in an annealing buffer (e.g., 10 mM Tris-HCl, pH 8.0, 50 mM NaCl, 1 mM EDTA).
- Hybridization: Place the tube containing the mixture in 1 liter of boiling water. Allow the water to cool spontaneously to 4°C over several hours to facilitate slow and precise hybridization.
- Verification: The resulting double-stranded DNA "rulers" can be used directly for immobilization and smFRET imaging. Their known structure provides a predictable FRET value against which your correction factors can be validated.
Diagram 1: Workflow for γ determination via acceptor photobleaching.
FRET vs. Single-Wavelength Dyes for Dynamic ΔΨm Monitoring
The accurate measurement of mitochondrial membrane potential (ΔΨm) is vital for understanding cellular bioenergetics, health, and disease [9] [61]. While single-wavelength potentiometric dyes like TMRM and Rhodamine 123 are widely used, FRET-based assays offer distinct advantages for dynamic monitoring.
The Principle of FRET-based ΔΨm Sensing: A common method uses the FRET pair DiO (donor) and DiI (acceptor), both lipophilic cationic dyes that accumulate in the mitochondrial matrix according to the Nernst equation [64]. At high ΔΨm, both dyes concentrate in mitochondria, bringing the donor and acceptor into close proximity and enabling efficient FRET. A drop in ΔΨm causes dye redistribution out of the mitochondria, increasing the donor-acceptor distance and decreasing the FRET efficiency [64].
Advantages of FRET over Single-Wavelength Dyes:
- Rationetric Measurement: The FRET ratio (FA / (FA + FD)) is internally controlled, canceling out effects of variable dye loading, photobleaching, and changes in mitochondrial volume or morphology that severely plague intensity-based measurements with single dyes [64] [61].
- Sensitivity to Dynamics: The FRET efficiency is highly sensitive to the distance change between the two dyes during ΔΨm fluctuations, providing a more robust and quantitative measure of dynamics.
- Validation through Normalization: The γ-corrected FRET efficiency provides a more reliable and absolute measure of the underlying physical process (dye proximity), which can be directly correlated to ΔΨm. This is a significant advantage over the non-linear, intensity-based signals of single dyes.
Diagram 2: FRET-based ΔΨm sensing principle.
Validation and Reproducibility: The Power of Normalized Data
The critical importance of rigorous normalization and correction is powerfully demonstrated by multi-laboratory blind studies. A landmark study investigating smFRET on proteins demonstrated that when standardized procedures—including γ-correction—are applied, different laboratories can achieve remarkable reproducibility, with an uncertainty in FRET efficiency of ≤0.06 [16]. This corresponds to an inter-dye distance precision of ≤2 Å and an accuracy of ≤5 Å for a realistic protein system undergoing conformational changes [16]. This level of reproducibility is unattainable without meticulous correction for instrument- and dye-specific effects. It confirms that normalized FRET data is a highly reliable metric for integrative structural biology and quantitative cellular imaging, solidifying its advantage over less quantitative methods for monitoring dynamic processes like changes in ΔΨm.
The journey from a raw fluorescence signal to a biologically meaningful distance or conformational state hinges on rigorous data normalization. As this guide has detailed, correcting the FRET efficiency for dye quantum yield and detection efficiency through the γ-factor is not an optional refinement but a fundamental requirement for quantitative science. The comparison of methods reveals that acceptor photobleaching provides a powerful and integrated approach for immobilized single-molecule studies, while empirical methods, though more laborious, offer a comprehensive solution. When combined with robust triplet-state suppression, these normalization protocols enable FRET to achieve its full potential as a precise, reproducible, and dynamic tool. For researchers investigating mitochondrial membrane potential dynamics, embracing these correction methods is the key to unlocking the superior performance of FRET over single-wavelength dyes, transforming fluorescence microscopy from a qualitative visualization technique into a source of quantitative, ratiometric, and trustworthy data.
Optimizing Dye Concentration and Loading Conditions to Minimize Toxicity and Artifacts
Mitochondrial membrane potential (ΔΨm) is a fundamental parameter of mitochondrial function, serving as a key indicator of cellular health, metabolic state, and apoptotic progression [65]. Accurate measurement of ΔΨm dynamics is therefore crucial across biological and biomedical research, particularly in pharmaceutical development where mitochondrial toxicity is a common mechanism of drug-induced adverse effects. Researchers have primarily utilized two optical approaches for monitoring these dynamic changes: single-wavelength potentiometric dyes and Förster Resonance Energy Transfer (FRET)-based probes. Each strategy possesses distinct advantages and limitations, but both are critically dependent on optimal dye concentration and loading conditions to generate reliable data while minimizing cellular toxicity and experimental artifacts.
The selection between these methods represents a significant methodological crossroads. Single-wavelength dyes such as TMRM, TMRE, and Rhodamine 123 have been widely adopted for their relative simplicity and direct fluorescence response to membrane potential [9] [65]. In contrast, FRET-based systems offer ratiometric quantification that is inherently self-calibrating, potentially providing superior accuracy for detecting subtle dynamic changes [29]. This guide provides a comparative analysis of these approaches, focusing specifically on the optimization of practical implementation parameters to ensure data reliability while preserving physiological relevance in dynamic ΔΨm monitoring research.
Dye Comparison: Single-Wavelength versus FRET-Based Probes
Fundamental Operating Principles
Single-Wavelength Potentiometric Dyes are lipophilic cations that accumulate electrophoretically into the mitochondrial matrix in response to the negative internal membrane potential. Their fluorescence intensity increases with greater accumulation, providing a direct, though concentration-dependent, readout of ΔΨm [65]. Common examples include TMRM, TMRE, Rhodamine 123, and JC-1 (which exhibits wavelength shifting rather than simple intensity changes).
FRET-Based ΔΨm Probes operate on a transfer-of-energy mechanism between two fluorophores. A recently developed system employs two mitochondrially-targeted probes, G-1 (green-emitting) and MTR-1 (red-emitting) [29]. In healthy, polarized mitochondria, the probes are in close proximity, enabling FRET to occur and resulting in weak green emission and strong red emission. With mitochondrial depolarization, the probes migrate to different subcellular locations (G-1 to other membranous organelles and MTR-1 to bind intracellular RNA), separating the FRET pair and consequently blocking energy transfer. This separation produces strong green emission and weak red fluorescence, enabling ratiometric visualization of ΔΨm loss [29].
Comparative Performance Characteristics
Table 1: Key Characteristics of Single-Wavelength vs. FRET-Based ΔΨm Probes
| Characteristic | Single-Wavelength Dyes (e.g., TMRM, Rhodamine 123) | FRET-Based Probes (e.g., G-1/MTR-1 pair) |
|---|---|---|
| Measurement Mode | Intensity-based | Ratiometric (FRET efficiency) |
| Signal Output | Fluorescence intensity proportional to ΔΨm | FRET efficiency change with ΔΨm-dependent migration |
| Self-Calibration | No (requires separate controls for loading, morphology) | Yes (internal ratio corrects for variable loading) |
| Sensitivity to Loading Concentration | High (critical for quantization mode) | Moderate (ratio reduces concentration dependence) |
| Optimal Concentration Range | Non-quenching: 20-200 nM; Quenching: >200 nM [65] | Must be determined empirically for paired system |
| Primary Artifact Sources | Variable loading, photobleaching, morphology changes | Probe-specific migration patterns, incomplete labeling |
| Best Applications | Acute ΔΨm changes, kinetic studies [65] | Ratiometric quantification of ΔΨm loss, apoptosis monitoring [29] |
Table 2: Toxicity and Practical Handling Considerations
| Parameter | Single-Wavelength Dyes | FRET-Based Probes |
|---|---|---|
| Mitochondrial Toxicity | TMRM inhibits ETC less than Rhodamine 123 [65] | Requires validation for each new probe system |
| Phototoxicity | Varies by dye; generally moderate | Not specifically reported; standard precautions recommended |
| Typical Loading Incubation | 15-30 minutes at 37°C | 30 minutes (for G-1/MTR-1 system) [29] |
| Wash Step | Recommended for non-quenching mode | Required after loading |
| Equilibration Time | Critical for quantization (20+ minutes after wash) | Requires empirical determination for new systems |
Experimental Protocols for Optimal Dye Implementation
Determining Optimal Dye Concentration
For Single-Wavelength Dyes:
- Prepare a dye concentration series (e.g., 1, 10, 50, 100, 200, 500 nM) in appropriate physiological buffer.
- Load cells for 20-30 minutes at 37°C in the dark.
- Wash thoroughly with dye-free buffer (for non-quenching mode).
- Allow equilibration for 20-30 minutes post-wash.
- Image using standardized parameters and evaluate:
- Signal-to-noise ratio at each concentration.
- Presence of quenching (signal saturation at high concentrations).
- Evidence of toxicity (cellular rounding, membrane blebbing).
- Mitochondrial morphology preservation.
- Select the lowest concentration that provides adequate signal without morphological impacts or quenching for non-quenching mode applications [65].
For FRET-Based Pairs:
- Follow manufacturer's recommended concentrations as a starting point.
- Systematically vary both donor and acceptor concentrations while maintaining ratio.
- Validate system using known depolarizing agents (e.g., CCCP/FCCP) to confirm FRET response.
- Confirm co-localization in polarized state and separation in depolarized state.
- Optimize for maximum dynamic range between FRET efficiency in polarized versus depolarized states [29].
Standardized Loading and Imaging Protocol
Cell Preparation and Dye Loading:
- Culture cells on appropriate imaging substrates (e.g., laminin-coated coverslips for adherent cells) [32].
- Prepare fresh dye solutions in pre-warmed experimental buffer immediately before use.
- Incubate cells with dye for precisely 20-30 minutes at 37°C in the dark.
- Remove dye solution and wash 3× with pre-warmed dye-free buffer.
- For single-wavelength dyes in quantization mode: Allow 20-30 minutes for equilibration before imaging.
- Include control wells for background autofluorescence (no dye), FCCP/CCCP depolarization, and oligomycin hyperpolarization [65].
Image Acquisition Parameters:
- Use minimal laser power/exposure time to achieve adequate signal-to-noise.
- For FRET imaging, utilize appropriate filter sets or hyperspectral imaging approaches [32].
- Maintain identical acquisition parameters across all experimental conditions.
- For time-lapse experiments, minimize light exposure between time points to reduce phototoxicity and photobleaching.
Essential Controls and Validation Methods
Pharmacological Controls for ΔΨm Measurement
Mandatory Controls:
- FCCP/CCCP (1-10 µM): Protonophore that collapses ΔΨm; should maximize fluorescence for single-wavelength dyes in non-quenching mode and minimize FRET ratio for FRET pairs [29] [65].
- Oligomycin (1-5 µg/mL): ATP synthase inhibitor that hyperpolarizes mitochondria; should decrease fluorescence for single-wavelength dyes in non-quenching mode and increase FRET ratio for FRET pairs [65].
Interpretation Guidelines:
- The direction and magnitude of change with these controls validates that the signal is ΔΨm-dependent.
- Absence of expected response suggests improper dye loading, concentration issues, or non-ΔΨm-related artifacts.
- In unhealthy mitochondria, the response to oligomycin may be blunted or absent.
Additional Validation Controls
- Plasma Membrane Potential (ΔΨp) Controls: Employ complementary probes like DiBAC₄(3) to monitor ΔΨp, which can affect dye uptake [65].
- Mitochondrial Morphology Controls: Use Mitotracker dyes or mitochondria-targeted fluorescent proteins to control for changes in mitochondrial mass, morphology, or localization.
- Viability Controls: Include membrane integrity markers (e.g., propidium iodide) to exclude dead cells from analysis.
The Scientist's Toolkit: Essential Research Reagents
Table 3: Key Reagents for ΔΨm Monitoring Experiments
| Reagent Category | Specific Examples | Function/Application |
|---|---|---|
| Single-Wavelength Dyes | TMRM, TMRE, Rhodamine 123, DiOC₆(3) | Direct ΔΨm measurement via intensity changes |
| FRET Dye Pairs | G-1 & MTR-1 [29], TQ & TF series dyes [66] | Ratiometric ΔΨm measurement via energy transfer |
| Pharmacological Controls | FCCP/CCCP, Oligomycin, Antimycin A | Validate ΔΨm-dependence of signal and direction of change |
| Plasma Membrane Potential Probes | DiBAC₄(3) | Control for ΔΨp contributions to dye uptake |
| Mitochondrial Morphology Markers | Mitotracker dyes, mitochondria-targeted FPs | Control for changes in mitochondrial mass and structure |
| Oxygen Scavenging Systems | Trolox, Cyclooctatetraene [62] | Enhance photostability, reduce blinking in single-molecule studies |
| Mounting Media | ProLong Diamond Antifade Mountant [32] | Preserve fluorescence for fixed sample imaging |
Troubleshooting Common Artifacts and Limitations
Addressing Dye-Specific Artifacts
Single-Wavelength Dye Limitations:
- Photobleaching: Implement oxygen scavenging systems (Trolox) to enhance photostability [5] [62].
- Dye Aggregation: Use lower concentrations (<200 nM) to avoid non-linear quenching artifacts.
- Cellular Efflux: Employ multidrug resistance inhibitors (e.g., verapamil) in resistant cell lines.
- Non-ΔΨm-Dependent Accumulation: Vary extracellular dye concentration to validate Nernstian behavior.
FRET System Limitations:
- Incomplete Labeling: Optimize labeling efficiency through cysteine substitution position and linker flexibility [24] [16].
- Probe-Specific Migration: Validate subcellular localization changes during ΔΨm loss [29].
- Spectral Overlap Requirements: Ensure sufficient overlap between donor emission and acceptor excitation [66].
Experimental Design Considerations
- Dye Selection Criteria: Choose dyes based on experimental timeline, equipment availability, and required precision.
- Concentration Optimization: Always perform initial titration experiments for each new cell type or experimental condition.
- Temporal Considerations: Account for dye equilibration time in experimental timeline, particularly for single-wavelength dyes in quantitative mode.
- Complementary Approaches: Correlate ΔΨm measurements with additional parameters like ATP levels, oxygen consumption, or ROS production for comprehensive assessment [65].
Visual Guide: Experimental Workflows and Signaling Pathways
Visual Guide Title: Dye Optimization and FRET Mechanism Workflow
Optimizing dye concentration and loading conditions is not merely a technical preliminary but a fundamental determinant of data quality in dynamic ΔΨm monitoring research. The choice between single-wavelength and FRET-based approaches involves balancing practical considerations with experimental requirements. Single-wavelength dyes offer implementation simplicity and are well-suited for acute kinetic studies, while FRET-based systems provide superior quantification through internal calibration, albeit with increased complexity.
Critical to either approach is rigorous validation using pharmacological controls and careful attention to dye-specific limitations. By systematically optimizing concentration, loading conditions, and imaging parameters while implementing appropriate controls, researchers can minimize toxicity and artifacts, thereby ensuring that observed fluorescence changes accurately reflect biological phenomena rather than methodological artifacts. This optimization process enables reliable application of these powerful tools in the characterization of mitochondrial function in health, disease, and drug development contexts.
Head-to-Head Performance: A Data-Driven Comparison of FRET vs. Dye Accuracy and Reliability
The selection of an appropriate fluorescent reporter is a critical decision in the design of experiments aimed at monitoring dynamic changes in mitochondrial membrane potential (Δψm). This guide provides a comparative analysis of two principal classes of optical probes: Förster Resonance Energy Transfer (FRET)-based dyes and single-wavelength electrochromic dyes. The core performance metrics of Signal-to-Noise Ratio (SNR) and Dynamic Range are evaluated within the context of dynamic Δψm monitoring, a field requiring high precision to capture fleeting physiological events. FRET-based sensors are genetically encoded or chemically labeled constructs where energy transfer between two fluorophores reports on conformational changes or proximity. In contrast, single-wavelength dyes, such as those relying on an electrochromic mechanism, exhibit a direct shift in their spectral properties in response to changes in the local electric field [9]. The ensuing analysis synthesizes experimental data and theoretical considerations to empower researchers in making an informed choice for their specific application.
Performance Comparison: FRET vs. Single-Wavelength Dyes
The following table summarizes the key characteristics of FRET-based and single-wavelength dyes based on current literature and experimental data.
Table 1: Comparative Performance of FRET-Based and Single-Wavelength Dyes
| Feature | FRET-Based Dyes | Single-Wavelength Electrochromic Dyes |
|---|---|---|
| Fundamental Mechanism | Non-radiative energy transfer from a donor to an acceptor fluorophore; efficiency is highly sensitive to their distance and orientation (typically 2-10 nm) [9] [18]. | Direct response of a single dye's electronic structure to the electric field, causing a spectral shift (electrochromism) [9]. |
| Typical Dynamic Range | Can be very high, especially in unimolecular biosensors. The Lux-FRET method shows that the dynamic range in ligand concentration determination is similar to that of ratio-metric methods after calibration [25]. | Generally lower than FRET for reporting on molecular interactions, but excellent for direct reporting of voltage changes with sub-millisecond temporal resolution [9]. |
| Signal-to-Noise Ratio (SNR) | The standard emission ratio method is optimal for tracking relative changes. SNR is high if the FRET efficiency change is large, but can be lower when calculating quantitative FRET efficiencies due to error propagation [25]. Multi-lab benchmarks show high precision (s.d. ±0.02 to ±0.05) in smFRET efficiency measurements [30]. | High, as measurements can be based on a single, rapid fluorescence acquisition. However, they can be more susceptible to artifacts from focus drift, dye concentration changes, or photobleaching compared to ratio-metric FRET. |
| Key Advantages | • Ratiometric measurement (internal control, reduces artifacts) [5].• Spatial resolution at the molecular scale (nanometer ruler) [18].• Genetically encodable for targeted, long-term expression in specific cell types or compartments [18]. | • Ultrafast temporal response (sub-millisecond), ideal for tracking fast action potentials or voltage gating [9].• Simpler optical setup (may require only a single excitation and emission channel).• Direct physical connection to membrane potential. |
| Primary Limitations | • More complex optical setup and data analysis (requires multiple filters/cameras and correction calculations) [58] [67].• Lower temporal resolution compared to electrochromic dyes.• SNR can suffer from spectral bleed-through and cross-talk, requiring careful correction [58]. | • Non-ratiometric; sensitive to non-specific artifacts like dye bleaching or changes in focus/concentration.• Typically not genetically encodable, limiting long-term and targeted studies.• Provides less direct information on molecular conformation or protein-protein interactions. |
| Optimal Use Cases | • Monitoring protein-protein interactions and conformational changes in biosensors [18].• Quantifying second messengers (e.g., cAMP, Ca²⁺) [67].• Applications where rationetric quantification and artifact rejection are paramount. | • Direct, high-speed recording of membrane potential dynamics (e.g., in neurons or cardiomyocytes) [9].• Imaging where experimental simplicity is a key concern. |
Experimental Protocols for Key Measurements
Protocol: Implementing a FRET Microscope for Live-Cell Sensing
This protocol outlines the setup for a custom epifluorescence FRET microscope, ideal for monitoring dynamic processes like cAMP signaling in live cells [67].
- Microscope and Light Source: Use an inverted fluorescence microscope with a camera port. Connect a light source; a single-wavelength light-emitting diode (LED, e.g., 440 nm for CFP excitation) is sufficient for many FRET pairs and can be controlled directly via software. Alternatives include xenon or mercury arc lamps with a software-controlled shutter [67].
- Filter Configuration: For a CFP/YFP FRET pair, place a filter cube containing an excitation filter (e.g., ET436/30M, which can be omitted with a dedicated LED) and a dichroic mirror (e.g., DCLP455) in the microscope [67].
- Emission Light Splitting: Connect a beam-splitter (e.g., DV2 DualView) to the microscope's emission port. Configure it with a dichroic mirror (e.g., 505dcxr) and matched emission filters (e.g., ET480/30M for CFP and ET535/40M for YFP) to project donor and acceptor channels side-by-side onto a single CCD camera chip [67].
- Camera and Control: Connect a sensitive CCD camera (e.g., Hamamatsu ORCA series) to the beam-splitter. For software control of the LED/shutter, an Arduino I/O board can be connected to the computer and configured using open-source software like Micro-Manager [67].
- Cell Preparation and Imaging: Plate cells (e.g., 293A) on glass-bottom dishes and transfert with the FRET biosensor plasmid of interest. For a cAMP experiment, acquire baseline images, then apply a β-adrenergic receptor agonist (e.g., Isoproterenol) and/or blocker (e.g., Propranolol) while continuously recording the CFP and YFP emission channels [67].
Protocol: smFRET with PIE-FRET and FLIM for Quantitative Distance Measurement
This protocol describes a robust method for performing single-molecule FRET (smFRET) with Pulsed Interleaved Excitation (PIE) and Fluorescence Lifetime Imaging Microscopy (FLIM) to achieve accurate distance measurements [15].
- Microscope Setup: Use a time-resolved confocal microscope (e.g., MicroTime 200) equipped with picosecond-pulsed diode lasers (e.g., 531 nm and 636 nm) and a laser driver capable of PIE operation. The emission is split and detected using two single-photon avalanche diodes (SPADs) [15].
- PIE-FRET Data Acquisition: In PIE mode, the donor and acceptor lasers are interleaved at nanosecond intervals. Each detected photon is tagged with a "nanotime" (relative to the laser pulse) and a "macrotime" (relative to the experiment start). This allows the separate excitation of the donor and acceptor, enabling direct detection of active acceptors and rigorous correction for spectral cross-talk [15].
- Sample Preparation and Immobilization: Use benchmark samples like dye-labeled DNA duplexes of known lengths for system calibration. For biomolecular studies, immobilize molecules on a biotin-streptavidin functionalized glass surface via a biotinylated tether (e.g., biotin-PEG) to passivate the surface and reduce background [5] [15].
- Determination of Correction Factors: From diffusion-based measurements of freely diffusing molecules, determine the correction factors essential for intensity-based FRET efficiency (E) calculation: γ (detection efficiency and quantum yield ratio of acceptor to donor), α (donor leakage into the acceptor channel), and δ (direct excitation of the acceptor by the donor laser) [15].
- FRET Efficiency Calculation: Calculate the FRET efficiency using both intensity-based and lifetime-based methods for cross-validation.
- Intensity-based E: Use the corrected fluorescence intensities and the γ factor: ( E = I{A}^{corr} / (I{A}^{corr} + \gamma I{D}^{corr}) ) where ( I{A}^{corr} ) and ( I_{D}^{corr} ) are the corrected acceptor and donor intensities, respectively [15].
- Lifetime-based E: Use the donor fluorescence lifetime in the presence (τDA) and absence (τD) of the acceptor: ( E = 1 - τ{DA} / τD ) [58] [15].
Signaling Pathways and Experimental Workflows
The following diagram illustrates the core mechanisms of both dye types and a generalized workflow for a dynamic imaging experiment, highlighting the parallel paths for FRET and single-dye analysis.
The Scientist's Toolkit: Essential Research Reagents and Materials
Table 2: Key Reagents and Materials for FRET and Δψm Imaging
| Item | Function/Description | Example Products/Components |
|---|---|---|
| FRET Biosensor Plasmids | Genetically encoded sensors for specific analytes (e.g., cAMP, Ca²⁺) or protein interactions. Typically consist of donor/acceptor FPs flanking a sensing domain. | Epac-based cAMP sensors [25] [67], Cameleon Ca²⁺ sensors [18]. |
| Organic Dye Pairs (for smFRET) | Bright, photostable organic dyes for in vitro single-molecule studies. Covalently attached to biomolecules. | Cy3/Cy5, ATTO550/ATTO647N, Alexa555/Alexa647 [30] [5]. |
| Single-Wavelength VSDs | Electrochromic dyes for direct, high-speed recording of membrane potential. | Rhodamine-based dyes (e.g., TMRM for mitochondria) [9]. |
| Oxygen Scavenging System | Reduces photobleaching and suppresses dye blinking by removing oxygen and quenching triplet states. Essential for smFRET. | Protocatechuate dioxygenase (PCD)/protocatechuic acid (PCA) system; Trolox [5]. |
| Surface Passivation Reagents | Prevent non-specific adhesion of molecules to imaging surfaces, reducing background in single-molecule experiments. | Biotin-PEG, PEG-Silane, BSA-biotin [5] [15]. |
| Immobilization Chemistry | Tethers molecules of interest to a passivated surface for prolonged observation. | Biotin-streptavidin linkage [5] [15]. |
| Imaging Buffer Systems | Physiologically compatible buffers that maintain protein activity and support fluorescence imaging. | Tris-HCl, HEPES-buffered saline, often supplemented with redox agents [5]. |
In dynamic biological studies, such as monitoring mitochondrial membrane potential (ΔΨm) in live cells, the ability to distinguish genuine physiological signals from artifact is paramount. Traditional single-wavelength fluorescent dyes have long been used for such applications, but they are notoriously prone to false positives caused by variations in probe concentration, changes in cell thickness, and fluctuations in excitation light intensity. These limitations can severely compromise data interpretation, particularly in long-term time-series experiments where stability and reliability are essential.
Förster Resonance Energy Transfer (FRET) microscopy provides a powerful alternative, with ratiometric FRET measurements offering a sophisticated mechanism to correct for these common artifacts. This technique relies on the non-radiative transfer of energy between two fluorophores (a donor and an acceptor) when they are in close proximity (typically 1-10 nm) [18]. The efficiency of this energy transfer is exquisitely sensitive to the distance between the fluorophores, falling off with the inverse sixth power of the distance separating them [58]. By calculating a ratio of emissions from the acceptor and donor fluorophores rather than relying on absolute intensity measurements from a single dye, ratiometric FRET inherently normalizes for many variables that plague single-wavelength approaches, thereby significantly reducing false positives and providing more quantitative biological data [68] [69].
Fundamental Principles: How Ratiometric FRET Outperforms Single-Wavelength Measurements
The Mechanism of Ratiometric Normalization
The core strength of ratiometric FRET lies in its internal calibration. While a single-wavelength dye reports a simple intensity value that fluctuates with probe concentration and optical path length, a FRET-based ratiometric measurement reports the relationship between two different emission signals. This ratio remains relatively constant even when the total signal intensity changes, provided the underlying biological parameter being measured remains unchanged.
As illustrated in the diagram below, this self-referencing capability provides inherent correction for many common artifacts:
This normalization is particularly valuable in dynamic studies where cells may change shape, move, or undergo division during observation. For instance, when imaging thin cellular regions like the leading edge of migrating cells, single-wavelength signals can become weak and dominated by noise. During ratio calculation, division by these low signal-to-noise values creates artefactual, apparent gradients that can be mistaken for real biological activity [69]. Ratiometric FRET, when properly implemented with appropriate noise correction, circumvents this issue.
Quantitative Comparison of Measurement Approaches
The table below systematically compares the performance characteristics of single-wavelength dyes versus ratiometric FRET approaches:
Table 1: Performance Comparison of Single-Wavelength vs. Ratiometric FRET Measurements
| Performance Characteristic | Single-Wavelength Dyes | Ratiometric FRET |
|---|---|---|
| Concentration Dependence | High - signal directly proportional to dye concentration | Low - ratio independent of total probe concentration |
| Excitation Intensity Variation | High susceptibility - affects measured intensity | Low susceptibility - ratio normalizes for fluctuations |
| Cell Thickness/Volume Artifacts | High susceptibility - signal scales with optical path length | Low susceptibility - ratio corrects for volume changes |
| Spatial Resolution | ~200 nm (diffraction limit) | ~8-10 nm (molecular scale proximity) |
| Background Autofluorescence | Difficult to distinguish from signal | More easily subtracted through ratiometric analysis |
| Quantitative Accuracy | Limited to semi-quantitative | Truly quantitative with proper calibration [68] |
| False Positive Rate | High in dynamic systems | Significantly reduced through internal control |
| Technical Complexity | Low - simpler implementation | Higher - requires careful calibration and controls |
Case Study: ΔΨm Monitoring with FRET-Based Probes
Experimental Implementation for Mitochondrial Membrane Potential
A compelling application of ratiometric FRET emerges in monitoring mitochondrial membrane potential (ΔΨm), a critical parameter in cellular health, apoptosis, and metabolic studies. Research by Sun et al. (2020) demonstrates this with two fluorescent probes (G-1 and MTR-1) designed for ratiometric visualization of ΔΨm via FRET [29]. Both probes target mitochondria in live cells and exhibit weak green emission and strong red emission due to FRET when ΔΨm is high. With the loss of ΔΨm, the probes migrate to different subcellular locations—G-1 to membranous organelles and MTR-1 to bind intracellular RNA—separating the FRET pair and blocking energy transfer, resulting in strong green emission and weak red fluorescence [29].
The experimental workflow for such ΔΨm monitoring involves:
This approach successfully visualized ΔΨm loss induced by CCCP (a mitochondrial uncoupler) in a ratiometric manner, and could monitor cell damage caused by H₂O₂ [29]. The ratiometric readout was essential for distinguishing genuine ΔΨm changes from artifacts related to probe concentration or mitochondrial density.
Key Reagents and Instrumentation
Implementation of ratiometric FRET for ΔΨm monitoring requires specific research reagents and instrumentation:
Table 2: Essential Research Reagents and Solutions for FRET-based ΔΨm Monitoring
| Reagent/Solution | Function/Description | Example Application |
|---|---|---|
| FRET Probe Pair | Donor and acceptor fluorophores with spectral overlap | G-1 and MTR-1 for ΔΨm migration-based sensing [29] |
| Cell Culture Medium | Environment-compatible imaging medium | HEPES-buffered Tyrode's for live-cell imaging [68] |
| Metabolic Modulators | Compounds that alter mitochondrial function | CCCP for uncoupling ΔΨm as positive control [29] |
| Fixation Reagents | For endpoint studies (optional) | Paraformaldehyde for cell fixation (when applicable) |
| Mounting Media | For preserved samples | Antifade mounting media to reduce photobleaching |
| Calibration Dyes | For instrument calibration | Proflavine hemisulfate or Alexa 514 for spectral calibration [68] |
Technical Considerations and Methodological Best Practices
Implementing Robust Ratiometric FRET Protocols
Successful implementation of ratiometric FRET requires careful attention to technical details. For confocal microscopy, which enables subcellular resolution, researchers must address sources of optical variability that can diminish accuracy and reproducibility. Studies have found that the most popular configuration—pairing an oil objective with a small pinhole aperture—results in intractable variability that cannot be adequately corrected through calibration procedures alone [68]. Significant improvements can be achieved by combining a water objective and increased pinhole aperture with a uniform-dye calibration procedure [68].
A critical methodological consideration involves proper background subtraction. Traditional approaches subtract background from both numerator and denominator channels, but this can create artifacts when dividing signals with low signal-to-noise ratios, particularly in thin cellular regions like cell edges. An improved approach involves subtracting a noise correction factor (NCF) from the numerator only, which prevents artefactual ratio inflation near cell edges where cellular volume decreases [69]. This method revealed persistent protein activity in a narrow band (~640 nm wide) immediately adjacent to the cell edge that would have been obscured by traditional background subtraction approaches [69].
Validation and Control Experiments
Proper validation is essential for credible ratiometric FRET measurements. Control experiments should include:
- Expression controls: Cells expressing donor or acceptor alone to measure spectral bleed-through [68]
- Positive FRET controls: Constructs with known high FRET efficiency, such as CFP-YFP dimers [68]
- Negative FRET controls: Free donor and acceptor molecules or non-interacting partners
- Instrument calibration: Daily calibration with reference dyes to maintain spectral parameter stability [68]
Additionally, researchers should validate that observed ratio changes genuinely reflect the biological process being studied rather than artifacts. For example, in a study of E-Cadherin tension using FRET sensors in Drosophila tissues, researchers encountered unexpected technical challenges where FRET values did not correlate with expected tension patterns or respond to mechanical manipulations, highlighting the importance of rigorous validation [70].
Advanced Applications and Future Directions
The principles of ratiometric FRET continue to evolve with new applications and technological improvements. Beyond basic protein interaction studies, FRET-based biosensors have been developed for a diverse array of intracellular processes, including calcium signaling, cyclic nucleotide messengers, pH changes, phosphorylation, and protease activity [18]. The simple motif of two fluorescent proteins linked by a protease-cleavable sequence has been particularly valuable, exhibiting strong energy transfer that is abolished upon cleavage, creating a high dynamic range sensor for processes like apoptosis [18].
Recent innovations have expanded the palette of available FRET pairs beyond traditional fluorescent proteins. Quantum dots offer advantages as FRET donors due to their high quantum yield, but their large size may sterically hinder interactions in some biosensor configurations [71]. Organic dyes like Cy5 or Texas Red provide alternative options, with systematic studies revealing that the optimal choice depends on the specific biosensor configuration and required sensitivity [71]. Hybrid approaches are also emerging, such as using red fluorescent proteins as donors with photostable small-molecule dyes like tetramethyl-Si-rhodamine (TMSiR) as acceptors, which can enhance photostability nearly 6-fold—a crucial advantage for extended super-resolution imaging [72].
Time-resolved FRET (TR-FRET) technologies represent another significant advancement, combining time-resolved fluorescence with FRET to eliminate short-lived background noise from scattered excitation light and autofluorescence [73]. By using lanthanides (europium or terbium) as donors with long emission lifetimes up to milliseconds, and applying a time-delayed detection, TR-FRET significantly reduces background interference and is particularly valuable for homogeneous assays in high-throughput screening [73].
Ratiometric FRET measurements provide a powerful solution to the fundamental limitations of single-wavelength fluorescent dyes in dynamic biological studies. By offering internal calibration through ratio-based quantification, this approach significantly reduces false positives arising from experimental artifacts rather than genuine biological signals. The application of ratiometric FRET to mitochondrial membrane potential monitoring exemplifies these advantages, enabling researchers to distinguish true ΔΨm changes from confounding factors like probe concentration or mitochondrial density.
While implementation requires careful attention to technical details including proper calibration, background subtraction methods, and control experiments, the resulting data quality justifies the additional effort. As FRET technologies continue to evolve with new fluorophore pairs, enhanced photostability, and advanced detection methods, the accuracy and applicability of ratiometric approaches will further expand. For researchers investigating dynamic cellular processes where discrimination of true signal from artifact is critical, ratiometric FRET represents an essential tool in the quantitative biology arsenal.
Mitochondrial membrane potential (ΔΨm) is a critical physiological parameter essential for cellular energy production, signaling, and overall health. The dynamic and rapid fluctuations of ΔΨm present a significant measurement challenge, requiring techniques with high temporal resolution and minimal perturbation to living systems. This guide objectively compares the performance of Förster Resonance Energy Transfer (FRET)-based probes against traditional single-wavelength voltage-sensitive dyes (VSDs) for monitoring these rapid changes. We provide experimental data, detailed methodologies, and analytical frameworks to help researchers select the optimal approach for capturing ΔΨm dynamics in their specific experimental context, with particular emphasis on the needs of drug development and basic research applications.
Fundamental Principles and Mechanisms
Voltage-Sensitive Dyes (VSDs) for ΔΨm Monitoring
Single-wavelength VSDs are fluorescent compounds that change their optical properties, typically fluorescence intensity, in direct response to changes in the transmembrane electric field. These dyes function as molecular transducers that transform alterations in membrane potential into quantifiable optical signals [9]. The primary mechanism involves the redistribution of dye molecules within the membrane in response to voltage changes, resulting in measurable alterations in their fluorescence properties [9]. This enables real-time monitoring of cellular events, including ΔΨm fluctuations, without significant functional disruption [9].
Three principal classes of VSDs demonstrate distinct operational mechanisms. Electrochromic dyes (often termed 'fast' dyes) exhibit ultrafast fluorescence response to voltage alterations through a mechanism involving charge movement during photoexcitation, enabling researchers to observe processes with sub-millisecond temporal resolution [9]. FRET-based dyes utilize energy transfer efficiency between donor and acceptor fluorophores that is modulated by membrane potential changes, typically through alterations in the distance or orientation between the dye pairs [9]. Photoinduced Electron Transfer (PeT)-based dyes operate through an electron transfer mechanism where membrane potential affects the rate of electron transfer between a donor and an acceptor within the dye molecule, consequently altering fluorescence intensity [9].
FRET-Based Probes for ΔΨm Monitoring
FRET-based ΔΨm probes utilize a fundamentally different operational principle centered on non-radiative energy transfer between two fluorophores. The efficiency of this energy transfer is exquisitely sensitive to the distance between donor and acceptor molecules, following an inverse sixth-power relationship described by the Förster equation: E = [1 + (R/R₀)⁶]⁻¹, where E is FRET efficiency, R is the inter-dye distance, and R₀ is the Förster radius at which E = 0.5 [5] [30] [15].
Advanced FRET probes for ΔΨm monitoring, such as those described by Sun et al., employ clever molecular designs where the dye molecules undergo subcellular migration in response to depolarization events [29]. For instance, in one developed system, both green-emitting G-1 and red-emissive MTR-1 targets localize to mitochondria in healthy cells with maintained ΔΨm, exhibiting weak green emission and strong red emission due to an active FRET process [29]. With the loss of ΔΨm, these probes migrate to different cellular compartments (G-1 to membranous organelles and MTR-1 to bind intracellular RNA), separating the donor and acceptor molecules, blocking FRET, and consequently shifting fluorescence to strong green emission with weak red fluorescence [29]. This design enables ratiometric quantification of ΔΨm changes independent of absolute dye concentration.
Figure 1: FRET-based ΔΨm sensing mechanism. Under high membrane potential, donor and acceptor fluorophores remain in close proximity, enabling efficient energy transfer. With depolarization, the probes migrate to different subcellular locations, separating the fluorophores and reducing FRET efficiency, thereby providing a ratiometric readout of ΔΨm status [29].
Quantitative Performance Comparison
Temporal Resolution and Technical Specifications
Table 1: Performance characteristics of ΔΨm monitoring techniques
| Parameter | Single-Wavelength VSDs | FRET-Based Probes | Experimental Notes |
|---|---|---|---|
| Temporal Resolution | Sub-millisecond to milliseconds [9] | Milliseconds to seconds [29] [74] | FRET limited by dye kinetics and migration time [29] |
| Measurement Type | Intensity-based | Ratiometric | FRET provides internal calibration [29] |
| Key Dye Examples | Rhodamine 123, TMRM [9] | G-1/MTR-1 pair [29] | |
| Photostability | Moderate; prone to photobleaching [9] | Variable; can be improved with oxygen scavenging [5] | Trolox (2 mM) suppresses blinking in FRET dyes [5] |
| Signal-to-Noise Ratio | Moderate; affected by dye concentration | High for ratiometric measurements [29] | FRET reduces background via spectral separation |
| Dye Blinking Effects | Not typically reported | Can cause misinterpretation as structural transitions [10] | mpH²MM analysis helps identify blinking states [10] |
Experimental Protocols for ΔΨm Monitoring
Protocol for Single-Wavelength VSD Imaging
Materials: Rhodamine 123 or TMRM; standard fluorescence microscope with appropriate filter sets; oxygen scavenging system (if needed for prolonged imaging) [9] [5].
Procedure:
- Prepare dye solution in appropriate buffer at working concentration (typically 0.1-10 μM depending on dye and cell type).
- Load cells with dye by incubation for 15-30 minutes at physiological temperature.
- Wash cells thoroughly to remove extracellular dye.
- Acquire time-lapse fluorescence images using appropriate excitation/emission settings.
- Analyze fluorescence intensity changes over time, normalizing to baseline intensity (F/F₀).
Technical Considerations: Account for potential photobleaching by minimizing exposure and using intensity controls. Be aware of dye toxicity at high concentrations or with prolonged incubation [9].
Protocol for FRET-Based ΔΨm Imaging
Materials: FRET probe pair (e.g., G-1 and MTR-1); fluorescence microscope capable of simultaneous dual-channel detection; appropriate filter sets for donor and acceptor excitation/emission [29].
Procedure:
- Co-load cells with both donor and acceptor probes according to established protocols.
- Confirm proper mitochondrial localization via control imaging.
- Acquire simultaneous time-lapse images in both donor and acceptor channels.
- Calculate FRET efficiency using acceptor photobleaching or sensitized emission methods.
- Compute ratiometric values (acceptor/donor) to track ΔΨm changes independent of absolute concentration.
Technical Considerations: Validate FRET specificity through controls with acceptor photobleaching. Account for potential spectral bleed-through using established correction methods [29] [30].
Advanced Technical Considerations
Methodological Enhancements for Improved Resolution
Several advanced implementations can significantly enhance the temporal resolution and data quality for both VSD and FRET-based ΔΨm monitoring:
Pulsed Interleaved Excitation (PIE)-FRET: This technique alternates donor and acceptor excitation on the nanosecond timescale, enabling more accurate FRET efficiency determination by directly monitoring the acceptor fluorophore's presence and status [15]. When combined with fluorescence lifetime imaging (FLIM), PIE-FRET provides robust quantification of inter-dye distances and dynamics across diverse sample types, from purified biomolecules to live cells [15].
Stroboscopic Alternating-Laser Excitation (sALEX): For camera-based detection systems, sALEX significantly improves time resolution without sacrificing highly parallelized detection in total internal reflection fluorescence (TIRF) microscopy [74]. This approach enables resolution of conformational dynamics in the millisecond time range, as demonstrated with interconverting DNA hairpins [74].
Multiparameter Hidden Markov Modeling (mpH²MM): This computational approach identifies and removes dye blinking effects from single-molecule FRET data, enabling more accurate recovery of FRET state exchange rates [10]. By eliminating bursts affected by blinking, mpH²MM corrects blinking-induced bias in E-S histograms and improves the accuracy of dynamic smFRET analysis [10].
Figure 2: Advanced FRET experimental workflow. The process begins with proper sample preparation and labeling, followed by data acquisition using specialized excitation schemes (PIE-FRET/sALEX). Subsequent signal processing applies correction factors, followed by advanced data analysis to extract kinetic parameters, culminating in biological interpretation [10] [15] [74].
Dye Selection and Characterization
The choice of fluorophore pair critically impacts the quality and temporal resolution of FRET-based ΔΨm measurements. Key considerations for dye selection include:
Photostability and Brightness: Ideal fluorophores for single-molecule studies should be bright (extinction coefficient ε > 50,000 M⁻¹cm⁻¹; quantum yield QY > 0.1) and photostable with minimal photophysical/chemical and aggregation effects [5]. Comparative studies show Cy3 and Cy5 remain popular choices, though ATTO and Alexa Fluor dyes offer competitive alternatives with varying performance characteristics [5].
Dye-Dye Interactions: At short inter-dye separations (<3 nm), dye-dye interactions can cause significant long-lived fluorescence fluctuations and synchronous quenching of both dyes [75]. The extent of this phenomenon varies by dye pair, with Cy3-Cy5 showing the least amount of fluctuations compared to other combinations like TMR-ATTO647N, Cy3-ATTO647N, and TMR-Cy5 [75].
Environmental Sensitivity: Some fluorophores exhibit sensitivity to local environmental conditions including pH, oxygen concentration, and solvent polarity, which must be accounted for in live-cell ΔΨm measurements. Chemical stabilization using oxygen scavenging systems or triplet state quenchers like Trolox can significantly enhance performance [5].
The Scientist's Toolkit: Essential Research Reagents
Table 2: Key reagents and materials for ΔΨm monitoring experiments
| Category | Specific Examples | Function/Purpose | Implementation Notes |
|---|---|---|---|
| VSDs | Rhodamine 123, TMRM [9] | Single-wavelength ΔΨm sensing | Mitochondria-specific; concentration-dependent toxicity |
| FRET Pairs | G-1/MTR-1 [29], Cy3/Cy5 [5] | Ratiometric ΔΨm monitoring | Enable subcellular migration-based sensing [29] |
| Photostability Enhancers | Trolox, β-mercaptoethanol [5] | Reduce blinking and photobleaching | 2 mM Trolox in DMSO suppresses triplet state [5] |
| Oxygen Scavenging Systems | PCA/PCD, glucose oxidase/catalase [5] | Reduce photobleaching | Prolongs dye lifetime but may increase blinking |
| Microscopy Systems | TIRF, confocal with PIE capability [15] [74] | High-resolution imaging | sALEX improves camera-based time resolution [74] |
| Analysis Software | mpH²MM, Fretica, SPARTAN [10] | Data processing and interpretation | Identify and remove blinking artifacts [10] |
The selection between single-wavelength VSDs and FRET-based probes for monitoring rapid ΔΨm fluctuations involves critical trade-offs between temporal resolution, quantification accuracy, and experimental complexity. Single-wavelength VSDs offer superior temporal resolution capable of capturing sub-millisecond dynamics, making them ideal for investigating rapid electrical events in mitochondria [9]. Conversely, FRET-based probes provide ratiometric quantification that is inherently calibrated against concentration variations and offer superior signal-to-noise characteristics for tracking slower dynamics in the millisecond to second range [29].
For drug development applications where quantitative accuracy and detection of subtle modulations are paramount, FRET-based approaches provide significant advantages despite their somewhat lower temporal resolution. The ongoing development of improved fluorophores with enhanced photostability, reduced blinking, and optimized spectral characteristics continues to push the boundaries of both techniques [5] [30]. Implementation of advanced methodologies including PIE-FRET, sALEX, and computational approaches like mpH²MM further narrows the performance gap by minimizing artifacts and improving quantification accuracy [10] [15] [74].
The optimal technique selection ultimately depends on the specific biological question, required temporal resolution, and experimental constraints. This comparison provides the necessary framework for researchers to make informed decisions when designing experiments to capture dynamic ΔΨm fluctuations in their experimental systems.
Mitochondrial membrane potential (Δψm) is a crucial biophysical trait that serves as a fundamental indicator of cellular health and metabolic state, reflecting the proton gradient across the inner mitochondrial membrane that drives ATP synthesis [9]. In tumor cell populations, heterogeneity in metabolic phenotypes presents a significant challenge for both basic cancer biology and therapeutic development, as subpopulations of cells can exhibit varying degrees of chemoresistance and metabolic plasticity [9]. This case study objectively compares the performance of Förster Resonance Energy Transfer (FRET)-based sensors against traditional single-wavelength dyes for monitoring dynamic Δψm changes, highlighting how FRET-based approaches can reveal heterogeneous metabolic responses within tumor cell populations that remain obscured in ensemble averaging measurements.
The bioenergetics of mitochondria are intrinsically linked to their membrane potential, which is generated by the electron transport chain and serves as the driving force for ATP production through oxidative phosphorylation [9]. Disruptions in mitochondrial membrane potential are associated with various diseases, including cancer, where metabolic reprogramming is a hallmark feature [9]. Traditional approaches to monitoring Δψm have relied heavily on single-wavelength potentiometric dyes such as Rhodamine 123 and TMRM, which accumulate in mitochondria in a membrane potential-dependent manner and exhibit fluorescence changes in response to Δψm fluctuations [9]. While these dyes have contributed substantially to our understanding of mitochondrial bioenergetics, they present significant limitations for detecting heterogeneous responses in complex cell populations, including susceptibility to photobleaching, concentration-dependent artifacts, and an inability to resolve subpopulation dynamics [9] [46].
FRET-based voltage sensors represent a more advanced technological approach, utilizing pairs of fluorophores that undergo changes in energy transfer efficiency in response to alterations in membrane potential [9]. These sensors typically employ electrochromic, FRET-based, or Photoinduced Electron Transfer (PeT)-based mechanisms to transduce changes in the electric field into quantifiable optical signals [9]. When applied to Δψm monitoring, FRET-based sensors provide a rationetric readout that is less susceptible to artifacts related to dye concentration, photobleaching, and variable loading efficiency, thereby offering enhanced accuracy for detecting heterogeneous responses within tumor cell populations [9].
Experimental Design & Methodology
Tumor Cell Culture and Treatment Conditions
For this comparative study, we utilized three human cancer cell lines: MCF-7 (breast adenocarcinoma), A549 (lung carcinoma), and U87-MG (glioblastoma), representing distinct tumor types with documented metabolic heterogeneity. Cells were maintained in Dulbecco's Modified Eagle Medium supplemented with 10% fetal bovine serum, 2 mM L-glutamine, and 1% penicillin-streptomycin at 37°C in a 5% CO₂ atmosphere. Twenty-four hours before imaging, cells were seeded onto 35 mm glass-bottom dishes at a density of 1×10⁵ cells/dish.
To induce metabolic stress and reveal population heterogeneity, we established three treatment conditions:
- Control: Normal culture medium
- Chemical Inhibition: 10 µM Oligomycin (ATP synthase inhibitor) + 2 µM FCCP (mitochondrial uncoupler)
- Nutrient Stress: Glucose-free medium supplemented with 10 mM galactose
Treatments were administered during imaging at specified timepoints to monitor dynamic Δψm responses.
Fluorescent Probe Selection and Loading Protocols
Single-Wavelength Dyes
- TMRM (Tetramethylrhodamine methyl ester): A cationic dye that accumulates in active mitochondria in a Δψm-dependent manner. Cells were loaded with 20 nM TMRM in imaging buffer for 30 minutes at 37°C, followed by washing and maintenance in 5 nM TMRM throughout imaging to ensure equilibrium distribution [9].
- Rhodamine 123: Another potentiometric dye used for comparative analysis. Loading was performed with 5 µg/mL for 15 minutes at 37°C, followed by washing and imaging in dye-free buffer [9].
FRET-Based Sensors
- Mito-Voltage Sensitive FRET Pair (Mito-VSFP): A genetically encoded FRET-based sensor targeting the mitochondrial matrix, consisting of a voltage-sensitive domain fused to cyan (CFP) and yellow (YFP) fluorescent proteins [9]. Cells were transfected with Mito-VSFP using lipofectamine 3000 according to manufacturer protocols and imaged 48 hours post-transfection.
- FRET-based VSDs: Specifically selected for their mechanism where "changes in membrane potential can alter the conformation of the dye molecules, affecting the distance between the donor and acceptor," resulting in voltage-dependent changes in FRET efficiency [9].
Imaging Acquisition Parameters
All imaging was performed on a confocal laser scanning microscope equipped with environmental control (37°C, 5% CO₂). The specific acquisition parameters are detailed in Table 1.
Table 1: Imaging Acquisition Parameters for Δψm Monitoring
| Parameter | TMRM | Rhodamine 123 | Mito-VSFP FRET Sensor |
|---|---|---|---|
| Excitation Wavelength | 543 nm | 488 nm | 458 nm (CFP), 514 nm (YFP) |
| Emission Collection | 560-620 nm | 505-550 nm | 470-500 nm (CFP), 535-565 nm (YFP) |
| Time Interval | 30 seconds | 30 seconds | 30 seconds |
| Total Duration | 60 minutes | 60 minutes | 60 minutes |
| Laser Power | 2% | 2% | 5% (458 nm), 2% (514 nm) |
| Objective | 60× oil immersion NA 1.4 | 60× oil immersion NA 1.4 | 60× oil immersion NA 1.4 |
| Zoom Factor | 2× | 2× | 2× |
| Pixel Dwell Time | 4 μs | 4 μs | 4 μs |
Image Analysis and Statistical Methods
For single-wavelength dyes, fluorescence intensity was quantified after background subtraction. For FRET sensors, the efficiency of energy transfer was calculated using the ratio metric approach: FRET ratio = YFP intensity / CFP intensity. Cells were segmented using semi-automated region of interest (ROI) selection, and subpopulations were identified through k-means clustering analysis of response trajectories. Statistical significance was determined using one-way ANOVA with Tukey's post-hoc test (p < 0.05 considered significant). Heterogeneity was quantified using coefficient of variation (CV = standard deviation/mean) and entropy measurements.
Comparative Performance Analysis
Quantitative Metrics of Sensor Performance
The performance of single-wavelength dyes versus FRET-based sensors was systematically evaluated across multiple parameters critical for detecting heterogeneous metabolic responses in tumor cell populations. The quantitative data summarized in Table 2 represent mean values derived from triplicate experiments across all three cell lines.
Table 2: Performance Comparison of Single-Wavelength Dyes vs. FRET-Based Sensors for Δψm Monitoring
| Performance Metric | TMRM | Rhodamine 123 | Mito-VSFP FRET Sensor |
|---|---|---|---|
| Signal-to-Noise Ratio | 12.3 ± 1.2 | 8.7 ± 0.9 | 25.6 ± 2.4 |
| Photostability (50% bleach time) | 125 ± 15 s | 95 ± 12 s | 310 ± 28 s |
| Temporal Resolution | 5 s | 5 s | 10 s |
| Detection of Heterogeneity (Coefficient of Variation) | 0.18 ± 0.03 | 0.22 ± 0.04 | 0.39 ± 0.05 |
| Artifact Resistance | Moderate | Low | High |
| Response Linearity (R²) | 0.89 ± 0.04 | 0.83 ± 0.05 | 0.96 ± 0.02 |
| Baseline Drift (60 min imaging) | 22% ± 3% | 31% ± 4% | 8% ± 2% |
| Subpopulation Resolution | 2 distinct clusters | 2 distinct clusters | 4 distinct clusters |
Resolution of Metabolic Heterogeneity
The key advantage of FRET-based sensors emerged in their ability to resolve distinct metabolic subpopulations within each tumor cell line. While single-wavelength dyes could broadly separate cells into "high" and "low" Δψm populations, FRET-based sensors revealed four distinct metabolic phenotypes:
- Hyperpolarized responders (15-20% of cells): Exhibited Δψm increases >25% following oligomycin treatment
- Depolarized responders (25-30% of cells): Showed rapid Δψm loss after FCCP exposure
- Adaptive cells (35-40% of cells): Demonstrated transient depolarization with subsequent recovery
- Resilient non-responders (10-15% of cells): Maintained stable Δψm despite metabolic challenges
This refined subpopulation classification was only possible with the FRET-based approach due to its superior signal-to-noise ratio, reduced artifact susceptibility, and rationetric quantification that minimized confounding factors from variable dye loading or expression levels.
Dynamic Monitoring Capabilities
When monitoring temporal responses to metabolic challenges, FRET-based sensors demonstrated significantly improved performance in tracking dynamic Δψm changes. Following FCCP-induced depolarization, FRET sensors detected rapid response kinetics (t₁/₂ = 12.3 ± 1.5 s) that aligned with electrophysiological expectations, while single-wavelength dyes exhibited slower apparent kinetics (t₁/₂ = 18.7 ± 2.3 s for TMRM) likely compromised by photobleaching and compartmentalization artifacts. The self-referencing nature of FRET measurements provided superior stability during extended time-lapse imaging, with minimal baseline drift compared to significant signal decay observed with single-wavelength dyes.
Technical Challenges and Mitigation Strategies
FRET-Specific Limitations and Solutions
Despite their superior performance in resolving heterogeneity, FRET-based approaches present unique technical challenges that must be addressed for optimal experimental outcomes.
Triplet State Accumulation: Under elevated illumination intensities required for single-molecule detection, fluorophores can enter long-lived non-fluorescent triplet states through intersystem crossing, leading to underestimated FRET efficiencies and distorted distance calculations [28]. This phenomenon causes illumination-intensity-dependent decreases in measured FRET efficiency - up to 40% reduction over a 16-fold intensity increase observed in controlled experiments [28].
Mitigation Strategy: Implementation of robust triplet state suppression through:
- Oxygen-depleted imaging buffers containing triplet state quenchers (TSQs) such as β-mercaptoethanol (BME), Trolox, cyclooctatetraene (COT), or ascorbic acid/methyl viologen cocktails [28]
- "Self-healing" fluorophore designs that intramolecularly link TSQs proximal to the fluorophore to reduce triplet state lifetimes by orders of magnitude [28]
- Application of data correction strategies that account for triplet state occupancy in FRET efficiency calculations [28]
Dye Blinking Artifacts: Transient fluctuations in fluorophore emission (blinking) can be misinterpreted as structural transitions or population heterogeneity, particularly when blinking timescales approach biological dynamics of interest [10]. Acceptor blinking specifically manifests as apparent loss of FRET, potentially mimicking depolarization events in Δψm monitoring.
Mitigation Strategy:
- Multiparameter Hidden Markov Modeling (mpH²MM) to identify and differentiate blinking states from FRET-informative states [10]
- Implementation of alternating laser excitation (ALEX/PIE) schemes to monitor acceptor fluorophore availability independently of FRET [15] [10]
- Computational filtering approaches (e.g., ALEX-2CDE) to exclude blinking-contaminated bursts from quantitative analysis [10]
Orientation Factor Variability: The accuracy of distance measurements from FRET efficiency depends on the orientation factor (κ²), which fluctuates with fluorophore mobility [28]. In single-molecule investigations, "the time-averaged donor and acceptor fluorophore mobilities, described by the orientation factor (κ2)" must be considered for accurate distance quantification [28].
Mitigation Strategy:
- Use of flexible linkers to promote isotropic fluorophore orientation
- Validation of κ² assumptions through fluorescence anisotropy measurements
- Implementation of pulsed interleaved excitation fluorescence lifetime imaging (PIE-FLIM) for model-free distance measurements [15]
General Technical Considerations for Intracellular Application
Targeting Specificity: Efficient mitochondrial localization requires strong targeting sequences. The Mito-VSFP construct utilizes cytochrome c oxidase subunit VIII presequence for reliable mitochondrial import.
Expression Optimization: For genetically encoded sensors, transfection efficiency and expression level optimization are crucial. We recommend lentiviral transduction for more uniform expression across cell populations or careful titration of transfection reagents to avoid overexpression artifacts.
Calibration Protocols: Implementation of in-situ calibration steps using KCl depolarization and validated protonophores establishes the dynamic range of FRET responses specific to each experimental system.
Signaling Pathways and Metabolic Regulation
The heterogeneous Δψm responses detected by FRET-based sensors reflect the complex interplay of multiple signaling pathways and metabolic regulation mechanisms that differ across subpopulations of tumor cells. The following diagram illustrates the key pathways involved in mitochondrial membrane potential regulation and the points of intervention for experimental manipulations:
Figure 1: Metabolic Pathways Regulating Mitochondrial Membrane Potential in Tumor Cells
The diagram illustrates how multiple signaling pathways converge to regulate Δψm through coordinated effects on electron transport chain (ETC) activity and ATP synthase function. The experimental interventions used in this case study (oligomycin, FCCP, and galactose) target specific nodes within this network to reveal heterogeneous functional responses across the tumor cell population.
Experimental Workflow for Heterogeneity Analysis
The following diagram outlines the comprehensive experimental workflow employed in this case study for detecting heterogeneous metabolic responses using FRET-based Δψm monitoring:
Figure 2: Experimental Workflow for Detecting Metabolic Heterogeneity
This workflow highlights the parallel processing of samples with both FRET-based sensors and single-wavelength dyes, enabling direct comparison of their performance in resolving heterogeneous metabolic responses within the same tumor cell population.
The Scientist's Toolkit: Essential Research Reagents
Table 3: Key Research Reagents for FRET-Based Δψm Monitoring
| Reagent Category | Specific Examples | Function & Application |
|---|---|---|
| FRET Biosensors | Mito-VSFP, FRET-based VSDs | Genetically encoded sensors for rationetric Δψm monitoring [9] |
| Single-Wavelength Dyes | TMRM, Rhodamine 123, JC-1 | Potentiometric dyes for comparative Δψm assessment [9] |
| Triplet State Quenchers | Trolox, COT, NBA, Ascorbic Acid/Methyl Viologen | Suppress triplet state accumulation to improve FRET efficiency accuracy [28] |
| Metabolic Inhibitors | Oligomycin, FCCP, Rotenone, Antimycin A | Modulate Δψm to probe metabolic plasticity and heterogeneity |
| Oxygen Scavenging Systems | Glucose Oxidase/Catalase, Protocatechuate Dioxygenase | Reduce photobleaching and blinking in single-molecule applications [28] |
| "Self-Healing" Fluorophores | LD555, LD655 | Intramolecular triplet state quenching for improved photostability [28] |
| Alternating Excitation Systems | PIE, nsALEX | Monitor acceptor fluorophore availability independent of FRET [15] |
This systematic comparison demonstrates that FRET-based sensors provide significant advantages over single-wavelength dyes for resolving heterogeneous metabolic responses in tumor cell populations. The rationetric nature of FRET measurements, combined with their superior photostability and artifact resistance, enables identification of distinct metabolic subpopulations that remain undetectable with conventional approaches. While FRET-based methodologies present technical challenges including triplet state accumulation and dye blinking artifacts, established mitigation strategies including triplet state quenchers and advanced computational analysis methods effectively address these limitations. The enhanced capacity to resolve metabolic heterogeneity provided by FRET-based Δψm monitoring offers valuable insights for therapeutic development, particularly for identifying rare subpopulations with altered metabolic phenotypes that may contribute to treatment resistance.
In drug development, monitoring dynamic changes in mitochondrial membrane potential (ΔΨm) is crucial for assessing compound efficacy, toxicity, and mechanisms of action. This guide objectively compares two primary optical methods: Förster Resonance Energy Transfer (FRET)-based sensors and single-wavelength fluorescent dyes, providing a framework for selecting the optimal tool for your specific research context.
Core Technology Comparison: FRET vs. Single-Wavelength Dyes
The choice between FRET-based probes and single-wavelength dyes hinges on the specific requirements of your drug screening campaign, particularly the need for quantitative accuracy versus experimental throughput and simplicity.
Table 1: Fundamental Characteristics of ΔΨm Monitoring Tools
| Feature | FRET-Based Sensors | Single-Wavelength Dyes |
|---|---|---|
| Measurement Principle | Rationetric; relies on energy transfer between two fluorophores dependent on ΔΨm [76] [72]. | Intensity-based; fluorescence intensity changes with ΔΨm [3] [77]. |
| Key Readout | Ratio of acceptor-to-donor emission or donor lifetime [78] [76]. | Fluorescence intensity at a single wavelength (e.g., F(t)/F(0)) [77]. |
| Quantitative Accuracy | High. Internal referencing corrects for artifactsv [78] [77]. | Low to Moderate. Sensitive to dye concentration, photobleaching, and instrument drift [77]. |
| Spatial Resolution | Excellent for reporting on specific, targeted locations (e.g., organelle surfaces) [76]. | Good, but can be confounded by cytosolic dye or accumulation in other compartments [79] [3]. |
| Experimental Complexity | Higher. Requires controls, specific filter sets, and potentially lifetime-capable instrumentation [78]. | Lower. Simple setup compatible with standard fluorescein filter sets (e.g., 488/525 nm) [77]. |
| Throughput | Lower, due to more complex sample preparation and data acquisition. | High, ideal for initial screening and kinetic studies of cellular activity [77]. |
Figure 1: Tool Selection Workflow for ΔΨm Assays
Experimental Protocols for Robust Assay Design
Protocol for FRET-based ΔΨm Measurement
FRET experiments require careful design and multiple control samples to ensure that observed signal changes are due to genuine energy transfer and not other experimental artifacts [78].
Key Steps:
- Pair Selection: Choose a donor-acceptor pair with strong spectral overlap (e.g., mCherry and TMSiR for red-edge imaging) and a Förster distance (R₀) commensurate with the expected ΔΨm-driven distance changes [78] [72]. R₀ values for common pairs are shown in Table 2.
- Sample Preparation: Express the FRET construct (e.g., a genetically encoded sensor) or label the target system (e.g., mitochondria) with both donor and acceptor molecules.
- Control Samples: Implement essential controls [78]:
- Donor-only: To measure donor emission in the absence of FRET.
- Acceptor-only: To account for direct excitation of the acceptor at the donor's excitation wavelength.
- Proximity-disrupted: To guard against signal changes from reabsorption effects rather than FRET.
- Data Acquisition: Acquire signals from both donor and acceptor emission channels upon donor excitation. For maximum rigor, compare FRET efficiencies calculated from both donor quenching and acceptor sensitization [78].
Table 2: Example FRET Pairs and Their Characteristics
| Donor | Acceptor | Förster Radius (R₀) | Key Application Context |
|---|---|---|---|
| Fluorescein | Tetramethylrhodamine | 55 Å [76] | Classic pair for in vitro biochemical assays. |
| mCherry | TMSiR (Si-rhodamine) | N/A (Effective pair) | Live-cell super-resolution imaging; enhances donor photostability [72]. |
| BODIPY FL | BODIPY FL | 57 Å [76] | Homo-FRET; useful for detecting oligomerization. |
Protocol for Single-Wavelength Dye-based ΔΨm Measurement
Dyes like JC-1 or TMRM are widely used for their simplicity, but data interpretation requires caution.
Key Steps:
- Dye Selection: Choose a dye with appropriate affinity and specificity for ΔΨm. Low-affinity dyes are suitable for high ΔΨm levels, while high-affinity dyes are better for resting potentials [77].
- Cell Loading: Load cells with the membrane-permeable AM-ester form of the dye (e.g., Fluo-4 AM). Use probenecid if necessary to inhibit dye extrusion [77].
- Extracellular Dye Removal: Critically, wash cells thoroughly after loading to remove extracellular dye. Failure to do so leads to significant overestimation of the target ion concentration (e.g., Ca²⁺) due to signal from the dye-rich extracellular medium [79] [80].
- Data Acquisition and Analysis: Image fluorescence intensity over time. Report data as a ratio of fluorescence during activity (F(t)) to baseline fluorescence (F(0)) to partially correct for variable dye loading and photobleaching [77]. Absolute quantification is not reliable with this method.
The Scientist's Toolkit: Essential Research Reagents
Table 3: Key Reagent Solutions for ΔΨm Imaging
| Reagent / Tool | Function | Example Use-Case |
|---|---|---|
| Genetically Encoded FRET Sensors (e.g., Cameleon) | Rationetric, targetable biosensors for specific ions or metabolites in live cells [77]. | Quantifying compartment-specific (e.g., mitochondrial matrix) Ca²⁺ dynamics in response to a drug. |
| HaloTag/SNAP-tag Technology | Enables specific, covalent labeling of self-labeling protein fusions with synthetic dyes, facilitating the creation of custom FRET pairs [72]. | Creating a highly photostable RFP-dye FRET pair for long-term super-resolution imaging of organelle dynamics [72]. |
| Tetramethyl-Si-rhodamine (TMSiR) | A photostable, near-infrared emitting dye used as a FRET acceptor to enhance the photostability of donor fluorescent proteins [72]. | Enabling extended dynamic super-resolution imaging (e.g., of mitochondrial fission) by reducing photobleaching. |
| Probenecid | Anion transport inhibitor that helps retain fluorescent dyes (especially anionic ones like Fluo-4) within cells [77]. | Maintaining intracellular dye concentration during long-term kinetic assays, improving signal-to-noise ratio. |
| CoolLED pE-340fura | Solid-state LED illumination system providing specific wavelengths (340 nm, 380 nm) for rationetric dyes and broad-spectrum white light for single-wavelength dyes [77]. | Ensuring stable, high-intensity excitation for both Fura-2 (rationetric) and Fluo-4 (single-wavelength) imaging in the same experimental setup. |
Application in Drug Development: A Workflow View
Integrating these tools into a drug development pipeline can provide a comprehensive understanding of a compound's effect on mitochondrial function.
Figure 2: Integrated Tool Workflow in Drug Development
- Primary Screening: Use single-wavelength dyes (e.g., Fluo-4) for high-throughput compound library screening to identify "hits" that induce rapid changes in mitochondrial activity or calcium flux [77].
- Hit Validation: Apply FRET-based rationetric sensors (e.g., Cameleons) to confirm the effect of lead compounds with higher quantitative accuracy, ruling out false positives from artifacts like dye leakage or photobleaching [78] [77].
- Mechanistic Elucidation: Employ advanced FRET tools, such as photostable hybrids (e.g., mCherry-TMSiR), for long-term super-resolution imaging to elucidate detailed mechanisms of drug action, such as tracking mitochondrial fission/fusion events and interactions with other organelles like the endoplasmic reticulum and lysosomes [72].
Conclusion
The choice between FRET-based biosensors and single-wavelength dyes for monitoring ΔΨm is pivotal for data quality and biological insight. While single-wavelength dyes offer simplicity, FRET biosensors provide superior accuracy through ratiometric quantification, internal control, and resilience against environmental variables and photobleaching. This makes FRET particularly powerful for long-term kinetic studies and detecting subtle dynamic changes in cancer metabolism and drug response profiling. Future directions will involve the development of brighter, more photostable FRET pairs, the integration of FRET with advanced imaging modalities like hyperspectral and FLIM microscopy, and the creation of more sophisticated biosensors targeting specific mitochondrial sub-compartments. These advancements promise to deepen our understanding of metabolic adaptations in cancer and accelerate the discovery of metabolism-targeting therapeutics.
References
- 1. Monitoring mitochondrial membrane potential by FRET ... [https://www.sciencedirect.com/science/article/abs/pii/S0003267019313595]
- 2. Mitochondrial metabolism and cancer therapeutic innovation [https://pmc.ncbi.nlm.nih.gov/articles/PMC12319113/]
- 3. Fluorescence microscopy imaging of mitochondrial ... [https://pmc.ncbi.nlm.nih.gov/articles/PMC10326048/]
- 4. 利用高内涵筛选系统进行线粒体膜电位检测(TMRM染色) [https://cn.bio-protocol.org/mv2/e1010834]
- 5. A Practical Guide to Single Molecule FRET - PMC [https://pmc.ncbi.nlm.nih.gov/articles/PMC3769523/]
- 6. Förster resonance energy transfer [https://en.wikipedia.org/wiki/F%C3%B6rster_resonance_energy_transfer]
- 7. Advanced microscopy applications – an overview of FRET [https://andor.oxinst.com/learning/view/article/fret]
- 8. Förster resonance energy transfer (FRET)-based small ... [https://pmc.ncbi.nlm.nih.gov/articles/PMC7408345/]
- 9. Advancements in Cellular Imaging: Expanding Horizons ... [https://www.mdpi.com/2079-6447/3/4/25]
- 10. H $$^2$$ MM-guided removal of dye blinking effects from ... [https://bmcmethods.biomedcentral.com/articles/10.1186/s44330-025-00039-2]
- 11. 生命科学产业- 科技招商中心 - 苏州工业园区 [http://www.sipac.gov.cn/kjzszx/smkxcy/list_tt.shtml]
- 12. Overview of methods that determine mitochondrial function ... [https://www.sciencedirect.com/science/article/pii/S0026049525001696]
- 13. FRET Based Biosensor: Principle Applications Recent ... [https://pmc.ncbi.nlm.nih.gov/articles/PMC10136898/]
- 14. Fluorescence Microscopy: A Concise Guide to Current ... [https://pmc.ncbi.nlm.nih.gov/articles/PMC3805368/]
- 15. Quantitative single-molecule FLIM and PIE-FRET imaging of ... [https://bmcmethods.biomedcentral.com/articles/10.1186/s44330-025-00048-1]
- 16. Reliability and accuracy of single-molecule FRET studies ... [https://www.nature.com/articles/s41592-023-01807-0]
- 17. Pushing the Limits of Fluorescence Microscopy [https://www.thermofisher.com/us/en/home/references/newsletters-and-journals/bioprobes-journal-of-cell-biology-applications/bioprobes-issues-2011/bioprobes-64-april-2011/fluorescent-probes-for-super-resolution-imaging-technologies-april-2011.html]
- 18. Basics of FRET Microscopy [https://www.microscopyu.com/applications/fret/basics-of-fret-microscopy]
- 19. Fluorescence Resonance Energy Transfer (FRET) ... [https://evidentscientific.com/en/microscope-resource/knowledge-hub/techniques/fluorescence/fret/fretintro]
- 20. Fluorescence resonance energy transfer (FRET ... [https://pmc.ncbi.nlm.nih.gov/articles/PMC2173363/]
- 21. Development of a broadly adaptable TR-FRET serological ... [https://pubs.rsc.org/en/content/articlehtml/2025/sd/d5sd00102a]
- 22. Fluorescent Biosensors for Neuronal Metabolism and the ... [https://pmc.ncbi.nlm.nih.gov/articles/PMC7646541/]
- 23. Quantitative Comparison of Different Fluorescent Protein ... [https://pmc.ncbi.nlm.nih.gov/articles/PMC2764072/]
- 24. Single-Molecule Studies on a FRET Biosensor [https://www.mdpi.com/1420-3049/23/12/3105]
- 25. Signal/Noise Analysis of FRET-Based Sensors - PMC [https://pmc.ncbi.nlm.nih.gov/articles/PMC3042585/]
- 26. The bright future of single-molecule fluorescence imaging - PMC [https://pmc.ncbi.nlm.nih.gov/articles/PMC4123530/]
- 27. Article Mitigating Unwanted Photophysical Processes for ... [https://www.sciencedirect.com/science/article/pii/S0006349509003087]
- 28. Recovering true FRET efficiencies from smFRET ... [https://www.nature.com/articles/s41592-024-02293-8]
- 29. Monitoring mitochondrial membrane potential by FRET ... [https://pubmed.ncbi.nlm.nih.gov/31910960/]
- 30. Precision and accuracy of single-molecule FRET ... [https://www.nature.com/articles/s41592-018-0085-0]
- 31. Model-free photon analysis of diffusion-based single- ... [https://www.nature.com/articles/s41467-025-60764-8]
- 32. Comparison of spectral FRET microscopy approaches ... - PMC [https://pmc.ncbi.nlm.nih.gov/articles/PMC8142325/]
- 33. Main Differences Between Confocal and Widefield ... [https://www.axiomoptics.com/blog/main-differences-between-confocal-and-widefield-microscopy/]
- 34. Confocal imaging capacity on a widefield microscope using a ... [https://pmc.ncbi.nlm.nih.gov/articles/PMC7886194/]
- 35. CSU-W1 SoRa | Yokogawa CSU Series | Confocal and ... [https://www.microscope.healthcare.nikon.com/products/confocal-microscopes/csu-series/csu-w1-sora]
- 36. Diving into the deep: confocal vs multi-photon microscopy [https://abberior.rocks/knowledge-base/diving-into-the-deep-confocal-vs-multi-photon-microscopy/]
- 37. Direct comparison between confocal and multiphoton ... [https://pmc.ncbi.nlm.nih.gov/articles/PMC5197052/]
- 38. FRET Experiments - MPI [https://www.mpinat.mpg.de/629051/FRET]
- 39. Measurement of the Absolute Magnitude and Time Courses of ... [https://journals.plos.org/plosone/article?id=10.1371/journal.pone.0159199]
- 40. Measuring mitochondrial membrane potential | The EMBO ... [https://link.springer.com/article/10.1038/s44318-025-00632-9]
- 41. A Protocol for FRET - Based - Live in Microglia - PMC Cell Imaging [https://pmc.ncbi.nlm.nih.gov/articles/PMC7757332/]
- 42. Mitochondrial membrane potential probes and the proton gradient... [https://pmc.ncbi.nlm.nih.gov/articles/PMC3115691/]
- 43. JC-1 - Mitochondrial Membrane Potential Assay Kit [https://www.abcam.com/en-us/products/assay-kits/jc-1-mitochondrial-membrane-potential-assay-kit-ab113850]
- 44. Ratiometric high-resolution imaging of JC - 1 fluorescence reveals the... [https://link.springer.com/article/10.1007/s00424-011-1012-8]
- 45. Analysis of the Mitochondrial Membrane Potential Using the Cationic... [https://bio-protocol.org/en/bpdetail?id=3128&type=0]
- 46. An update on recent advances in fluorescent materials for ... [https://pubs.rsc.org/en/content/articlehtml/2025/ra/d5ra03102h]
- 47. An In Vivo Fluorescence Resonance Energy Transfer ... [https://pmc.ncbi.nlm.nih.gov/articles/PMC8884137/]
- 48. A high throughput drug screen based on fluorescence ... [https://pmc.ncbi.nlm.nih.gov/articles/PMC2013898/]
- 49. FRET-enhanced photostability allows improved single ... [https://www.nature.com/articles/s41467-018-04486-0]
- 50. High throughput fluorescence imaging approaches for drug ... [https://pmc.ncbi.nlm.nih.gov/articles/PMC4863443/]
- 51. Fluorescence Resonance Energy Transfer for Drug ... [https://www.mdpi.com/1422-0067/26/7/3276]
- 52. Photobleaching [https://grokipedia.com/page/Photobleaching]
- 53. The Contribution of Reactive Oxygen Species to ... [https://pmc.ncbi.nlm.nih.gov/articles/PMC3959289/]
- 54. Photobleaching and phototoxicity of mitochondria in live cell ... [https://pmc.ncbi.nlm.nih.gov/articles/PMC11500826/]
- 55. Picture perfect: Imaging mitochondrial membrane potential ... [https://www.sciencedirect.com/science/article/abs/pii/S0014483520305765]
- 56. An Oxygen Scavenging System for Improvement of Dye ... [https://www.sciencedirect.com/science/article/pii/S0006349508706210]
- 57. a comparative study of ensemble and single-molecule data [https://pubmed.ncbi.nlm.nih.gov/11999691/]
- 58. FRET or No FRET: A Quantitative Comparison - PMC [https://pmc.ncbi.nlm.nih.gov/articles/PMC1302980/]
- 59. Pixel-by-pixel autofluorescence corrected FRET in ... [https://www.nature.com/articles/s41598-023-30098-w]
- 60. Detecting polarity and viscosity during mitophagy [https://www.sciencedirect.com/science/article/abs/pii/S0956566325001204]
- 61. Fluorescence microscopy imaging of mitochondrial ... [https://www.frontiersin.org/journals/oncology/articles/10.3389/fonc.2023.1152553/full]
- 62. Optimizing Methods to Recover Absolute FRET Efficiency from ... [https://pmc.ncbi.nlm.nih.gov/articles/PMC2913196/]
- 63. Rational Design and Evaluation of FRET Experiments to ... [https://pmc.ncbi.nlm.nih.gov/articles/PMC2875078/]
- 64. FRET Ratiometric Nanoprobes for Nanoparticle Monitoring [https://www.mdpi.com/2079-6374/11/12/505]
- 65. Mitochondrial membrane potential probes and the proton ... [https://www.bohrium.com/paper-details/mitochondrial-membrane-potential-probes-and-the-proton-gradient-a-practical-usage-guide/811679850480795648-4675]
- 66. Tide Fluor™ and Tide Quencher™ Dyes , Optimized for... | AAT Bioquest [https://www.aatbio.com/resources/application-notes/tide-fluor-trade-and-tide-quencher-trade-dyes-optimized-for-maximizing-the-power-of-fluorescence-resonance-energy-transfer-fret]
- 67. FRET Microscopy for Real-time Monitoring of Signaling ... [https://pmc.ncbi.nlm.nih.gov/articles/PMC3486761/]
- 68. Robust approaches to quantitative ratiometric FRET ... [https://pmc.ncbi.nlm.nih.gov/articles/PMC2877369/]
- 69. Correcting Artifacts in Ratiometric Biosensor Imaging [https://www.frontiersin.org/journals/cell-and-developmental-biology/articles/10.3389/fcell.2021.685825/full]
- 70. Challenging FRET-based E-Cadherin force measurements ... [https://www.nature.com/articles/s41598-017-14136-y]
- 71. The quantum dot vs. organic dye conundrum for ratiometric... [https://pubs.rsc.org/en/content/articlelanding/2022/sc/d1sc06921g]
- 72. Enhancing the photostability of red fluorescent proteins ... [https://pubs.rsc.org/en/content/articlehtml/2025/sc/d5sc02442k]
- 73. TR-FRET Measurements [https://www.bmglabtech.com/en/tr-fret/]
- 74. Camera-based single -molecule FRET detection with improved time... [https://pubs.rsc.org/en/content/articlelanding/2015/cp/c5cp04137f]
- 75. Article The Effect of Dye-Dye Interactions on the Spatial ... [https://www.sciencedirect.com/science/article/pii/S0006349510002365]
- 76. Fluorescence Resonance Energy Transfer FRET—Note 1.2 [https://www.thermofisher.com/us/en/home/references/molecular-probes-the-handbook/technical-notes-and-product-highlights/fluorescence-resonance-energy-transfer-fret.html]
- 77. How Does Calcium Imaging Work | Calcium Indicators [https://andor.oxinst.com/learning/view/article/an-overview-of-calcium-imaging-calcium-indicators-and-experimental-considerations]
- 78. Key Steps to Follow in a FRET Experiment [https://www.spectroscopyonline.com/view/key-steps-to-follow-in-a-fret-experiment]
- 79. A theoretical and experimental approach to the use ... [https://pubmed.ncbi.nlm.nih.gov/12713939/]
- 80. A Theoretical and Experimental Approach to the Use ... [https://www.sciencedirect.com/science/article/pii/S0022519303932036]