Calreticulin Exposure and Caspase Activation: Orchestrating Immunogenic Cell Death in Cancer Therapy
This article explores the critical interplay between caspase activation and calreticulin (CALR) exposure in eliciting immunogenic cell death (ICD), a regulated cell death that stimulates antitumor immunity.
Calreticulin Exposure and Caspase Activation: Orchestrating Immunogenic Cell Death in Cancer Therapy
Abstract
This article explores the critical interplay between caspase activation and calreticulin (CALR) exposure in eliciting immunogenic cell death (ICD), a regulated cell death that stimulates antitumor immunity. Tailored for researchers and drug development professionals, we detail the molecular mechanisms where executioner caspases-3/7 trigger the translocation of CALR to the cell surface, an 'eat-me' signal for dendritic cells. The scope covers foundational pathways, advanced methodologies for real-time tracking, strategies to overcome variable DAMP emission, and the integration of these biomarkers for therapeutic validation. We also discuss the dual regulatory role of caspases and the contrasting immunogenic effects of surface-exposed versus soluble CALR, providing a comprehensive resource for developing next-generation immunotherapies.
The Molecular Nexus: How Caspase Activation Drives Immunogenic Calreticulin Exposure
Immunogenic cell death (ICD) is a functionally distinct form of regulated cell death that sufficient to activate an adaptive immune response against dead-cell-associated antigens, particularly from cancer cells [1]. Unlike classical apoptosis which is tolerogenic, ICD transforms dying cells into a therapeutic vaccine that stimulates antigen-specific immunity [1]. This process is critically dependent on the spatiotemporal emission of damage-associated molecular patterns (DAMPs) that act as danger signals to the immune system [1]. The translocation of calreticulin (CRT) from the endoplasmic reticulum to the cell surface represents one of the earliest and most critical "eat-me" signals in ICD, preceding apoptotic commitment and facilitating phagocytic uptake by dendritic cells [2] [3] [4]. Concurrently, caspase activation pathways orchestrate the cell death process, with emerging evidence demonstrating extensive crosstalk between apoptotic and inflammatory caspases in determining immunogenic outcomes [5] [6]. This application note delineates the molecular determinants, experimental methodologies, and technical protocols for investigating ICD in the context of anticancer drug development and immunotherapy strategies.
Core Biomarkers of Immunogenic Cell Death
Damage-Associated Molecular Patterns in ICD
The immunogenicity of cell death is determined by the emission of specific DAMPs in a precise spatiotemporal configuration. These molecules serve as critical biomarkers for distinguishing immunogenic from non-immunogenic cell death and can be quantitatively measured to assess the immunogenic potential of anticancer agents [1].
Table 1: Key Damage-Associated Molecular Patterns in Immunogenic Cell Death
| DAMP | Localization | Function | Detection Window |
|---|---|---|---|
| Calreticulin (CRT) | Cell surface exposure | "Eat-me" signal for phagocyte recruitment | Pre-apoptotic (1-4 hours post-treatment) [4] |
| ATP | Extracellular release | Chemoattractant for dendritic cells | Early-mid apoptosis (4-8 hours) [1] |
| HMGB1 | Extracellular release | TLR4 activation and antigen presentation | Late apoptosis/secondary necrosis (16-24 hours) [1] |
| Type I Interferons | Secreted | Dendritic cell activation and cross-priming | Variable (depends on stimulus) [5] |
The exposure of CRT on the outer leaflet of the plasma membrane serves as a critical "eat-me" signal that facilitates the phagocytosis of dying cells by antigen-presenting cells [2] [7]. This translocation occurs in a pre-apoptotic manner within 1-4 hours after treatment with immunogenic stimuli such as anthracyclines, oxaliplatin, or ionizing radiation [4]. The concomitant release of ATP functions as a potent chemoattractant for dendritic cells, while the passive release of HMGB1 during late apoptosis activates Toll-like receptor 4 (TLR4) on dendritic cells, thereby facilitating antigen processing and presentation [1]. The coordinated emission of these DAMPs establishes an immunogenic microenvironment that promotes the cross-priming of dead-cell-associated antigens and the subsequent activation of cytotoxic T lymphocytes.
Caspase Functions in Cell Death Pathways
Caspases play central roles in coordinating cell death pathways that can exhibit varying degrees of immunogenicity. Traditional classification systems distinguished caspases as either apoptotic (caspase-3, -6, -7, -8, -9) or inflammatory (caspase-1, -4, -5, -11), but emerging evidence reveals extensive functional overlap and crosstalk [5] [8].
Table 2: Caspase Functions in Cell Death and Immunity
| Caspase | Traditional Classification | Primary Functions | Role in ICD |
|---|---|---|---|
| Caspase-8 | Apoptotic initiator | Extrinsic apoptosis, necroptosis regulation | PANoptosis, immunogenic signaling [5] |
| Caspase-9 | Apoptotic initiator | Intrinsic apoptosis | Limited direct role in ICD [8] |
| Caspase-3/7 | Apoptotic executioners | Apoptotic substrate cleavage | Gasdermin E cleavage, secondary necrosis [5] |
| Caspase-1 | Inflammatory | Pyroptosis via gasdermin D cleavage | IL-1β/IL-18 maturation, inflammasome signaling [6] |
The activation of specific caspase cascades influences the immunogenic potential of cell death. Caspase-3 activation, while traditionally associated with non-immunogenic apoptosis, can contribute to ICD through cleavage of gasdermin E, resulting in lytic cell death and amplification of DAMP release [5]. Similarly, caspase-8 participates in PANoptosis, an integrated cell death pathway with features of apoptosis, pyroptosis, and necroptosis that emerges as a potent mediator of immunogenic cell death in response to specific stimuli [5]. The molecular composition of the cell death machinery therefore serves as a critical determinant of immunogenic outcomes.
Experimental Workflow for ICD Detection
The following diagram illustrates the core experimental workflow for detecting immunogenic cell death, integrating in vitro and in vivo assessment methods:
Methodologies and Protocols
Quantitative Detection of Surface Calreticulin Exposure
Principle: The translocation of CRT to the cell surface serves as the earliest biomarker of ICD and can be detected before the loss of plasma membrane integrity [4]. This protocol describes two complementary approaches for quantifying CRT exposure.
Flow Cytometry Protocol:
- Cell Treatment: Plate appropriate target cells (e.g., CT26 colorectal carcinoma, MCA205 fibrosarcoma) and treat with ICD inducers (doxorubicin 25 μM, oxaliplatin 500 μM) or non-immunogenic controls (gemcitabine 15 μM, mitomycin C) for 2-4 hours [4].
- Cell Harvesting: Gently detach cells using non-enzymatic dissociation buffers to preserve surface epitopes.
- Staining: Incubate cells with primary anti-CRT antibody (1:100 dilution) for 30 minutes at 4°C, followed by fluorophore-conjugated secondary antibody (1:200) for 20 minutes in the dark.
- Counterstaining: Include Annexin V-FITC and propidium iodide (PI) to discriminate pre-apoptotic (Annexin V-/PI-) cells with surface CRT.
- Analysis: Acquire data on flow cytometer and analyze CRT fluorescence specifically in the pre-apoptotic population.
Immunofluorescence Microscopy Protocol:
- Cell Culture: Seed cells on glass coverslips and treat as above.
- Fixation: Fix cells with 4% paraformaldehyde for 15 minutes at room temperature.
- Permeabilization: For surface CRT detection only, omit permeabilization step. For total CRT, permeabilize with 0.1% Triton X-100 for 10 minutes.
- Blocking: Incubate with 5% BSA in PBS for 1 hour.
- Antibody Incubation: Stain with anti-CRT antibody (1:100) overnight at 4°C, followed by Alexa Fluor-conjugated secondary antibody (1:200) for 1 hour.
- Mounting: Mount with DAPI-containing medium and image using confocal microscopy.
Alternative Imaging Approach: For in vivo detection, the CRT-specific peptide KLGFFKR (CRTpep) can be labeled with 18F for PET imaging, enabling non-invasive monitoring of ICD in tumor models [4].
Caspase Activation Assessment in ICD
Principle: Caspase activation patterns differ between immunogenic and non-immunogenic cell death. This protocol assesses caspase activation in the context of ICD.
Western Blotting Protocol:
- Cell Lysis: Harvest cells at appropriate timepoints (2-24 hours post-treatment) and lyse in RIPA buffer containing protease inhibitors.
- Electrophoresis: Separate 20-30 μg protein extracts on 4-20% gradient SDS-PAGE gels.
- Transfer: Transfer to PVDF membranes using standard protocols.
- Antibody Probing: Incubate with antibodies against:
- Cleaved caspase-3 (Asp175)
- Cleaved caspase-8 (Asp384)
- Cleaved caspase-9 (Asp330)
- Cleaved PARP (Asp214)
- β-actin (loading control)
- Detection: Develop using enhanced chemiluminescence and quantify band intensities.
Fluorometric Caspase Activity Assay:
- Sample Preparation: Prepare cell lysates from treated cells in caspase activity assay buffer.
- Substrate Addition: Incubate with caspase-specific fluorogenic substrates:
- Caspase-3/7: DEVD-AFC (400 μM)
- Caspase-8: IETD-AFC (400 μM)
- Caspase-9: LEHD-AFC (400 μM)
- Incubation: Incubate at 37°C for 1-2 hours protected from light.
- Measurement: Read fluorescence (excitation 400 nm, emission 505 nm) at 30-minute intervals.
Interpretation: Immunogenic cell death typically involves coordinated activation of caspase-8 and caspase-3, while caspase-9 activation may be more prominent in non-immunogenic apoptosis [8].
Gold-Standard Vaccination Assay
Principle: The definitive assessment of ICD requires demonstration that dying cells can elicit protective immunity in immunocompetent hosts [2] [1].
Protocol:
- Vaccine Preparation:
- Treat tumor cells in vitro with test compound for 24 hours.
- Confirm >70% cell death by Annexin V/PI staining.
- Harvest and wash cells 3x with sterile PBS.
- Resuspend at 1×10^7 cells/mL in PBS.
Vaccination:
- Immunize immunocompetent syngeneic mice (n=5-8/group) subcutaneously with 1×10^6 dying cells in 100 μL PBS.
- Include positive control (known ICD inducer like doxorubicin) and negative controls (non-immunogenic cell death induced by freeze-thaw).
Challenge:
- After 7 days, challenge mice with 1×10^6 live tumor cells of the same type on the contralateral flank.
Monitoring:
- Measure tumor growth every 2-3 days using calipers.
- Monitor survival for up to 60 days.
Immune Profiling:
- For sacrificed animals, analyze tumor-infiltrating lymphocytes by flow cytometry.
- Assess antigen-specific T cell responses by IFN-γ ELISpot.
Validation: Successful ICD induction is confirmed by significant protection against tumor challenge and enhanced survival in vaccinated animals compared to controls [2].
The Scientist's Toolkit: Essential Research Reagents
Table 3: Key Reagents for ICD Research
| Category | Reagent | Application | Notes |
|---|---|---|---|
| ICD Inducers | Doxorubicin (1-25 μM) | Positive control for ICD | Anthracycline [2] |
| Oxaliplatin (100-500 μM) | Positive control for ICD | Platinum derivative [1] | |
| Mitoxantrone (1-3 μM) | Positive control for ICD | Anthracenedione [4] | |
| Non-ICD Controls | Gemcitabine (10-15 μM) | Negative control | Pyrimidine analog [4] |
| Cisplatin (varies) | Negative control | Platinum derivative [1] | |
| UV-C irradiation | Negative control | Non-immunogenic apoptosis | |
| CRT Detection | Anti-CALR antibody | Surface CRT detection | Use without permeabilization [2] |
| CRTpep (KLGFFKR) | CRT binding peptide | Can be labeled with 18F for imaging [4] | |
| Caspase Detection | Fluorogenic substrates | Caspase activity | DEVD-AFC for caspase-3/7 [8] |
| Cleaved caspase antibodies | Western blot | Active form detection [5] | |
| Cell Death Assays | Annexin V/PI kit | Apoptosis quantification | Distinguish early/late apoptosis [1] |
| LDH release assay | Membrane integrity | Necrosis quantification | |
| DAMP Detection ATP Luminescence kit | ATP release | Extracellular ATP measurement [1] | |
| Anti-HMGB1 antibody | HMGB1 release | ELISA or Western blot [1] |
Molecular Mechanisms of ICD
The following diagram illustrates the core molecular pathways involved in immunogenic cell death, highlighting the interconnected roles of calreticulin exposure and caspase activation:
Concluding Remarks
The rigorous assessment of immunogenic cell death requires integrated methodologies that evaluate both early membrane changes (CRT exposure) and activation of cell death executers (caspases), culminating in functional validation through vaccination assays. The protocols detailed herein provide a standardized framework for identifying novel ICD inducers and optimizing combinatorial approaches that enhance antitumor immunity. As the field advances, real-time monitoring of ICD biomarkers in clinical settings through techniques such as CRT-specific PET imaging may facilitate patient stratification and treatment personalization [4]. The continued elucidation of molecular mechanisms underlying ICD, particularly the nuanced roles of different caspase family members, will undoubtedly yield new therapeutic opportunities at the intersection of oncology and immunology.
Immunogenic cell death (ICD) represents a paradigm shift in oncology, transforming cell death from a mere physiological conclusion into a potent trigger for adaptive antitumor immunity. This process is critically dependent on the spatiotemporal emission of damage-associated molecular patterns (DAMPs), which serve as danger signals to activate dendritic cells and prime cytotoxic T-cell responses. Among the intricate molecular machinery governing ICD, executioner caspases-3 and -7 have emerged as central regulators that coordinate the exposure and release of key DAMPs, including calreticulin (CRT), ATP, and high-mobility group box 1 (HMGB1). This application note delineates the pivotal role of caspases-3/7 in ICD-associated DAMP emission and provides detailed methodologies for investigating these processes in preclinical research, framed within the broader context of calreticulin exposure and caspase activation research.
Caspase-3/7 in the ICD Signaling Cascade: Mechanisms and Molecular Relationships
Executioner caspases-3 and -7 function as terminal effectors in apoptotic pathways, but their role extends beyond cellular dismantling to include orchestration of immunogenic signaling. These proteases are activated through both intrinsic (mitochondrial) and extrinsic (death receptor) pathways, culminating in the cleavage of numerous cellular substrates that facilitate the phenotypic manifestations of ICD [9] [10].
The molecular relationship between caspase activation and DAMP emission involves a precisely coordinated sequence of events. ER stress serves as an initiating trigger, leading to the pre-apoptotic surface exposure of calreticulin, an "eat-me" signal that facilitates phagocyte recognition [11] [12]. Subsequently, activation of caspases-3/7 promotes the externalization of phosphatidylserine and the controlled release of ATP and HMGB1, which function as "find-me" signals and DC maturation factors, respectively [12] [13]. This sequential process ensures that dying cells emit the appropriate signals to activate antigen-presenting cells before the loss of membrane integrity.
Figure 1: Integrated signaling pathway of executioner caspases-3/7 in immunogenic cell death. The diagram illustrates the sequential activation from ICD inducers through cellular stress pathways, caspase activation, DAMP emission, and ultimately antitumor immunity.
Quantitative Analysis of Caspase-3/7-Dependent DAMP Emission
The relationship between caspase activation and DAMP emission has been quantitatively characterized across multiple experimental systems. The following table summarizes key quantitative findings from recent studies investigating caspase-3/7-mediated DAMP dynamics.
Table 1: Quantitative Profiling of Caspase-3/7-Dependent DAMP Emission
| DAMP Marker | Cellular Process | Detection Method | Temporal Relationship to Caspase-3/7 Activation | Key Regulators | Experimental Model |
|---|---|---|---|---|---|
| Calreticulin (CRT) | Surface exposure ("eat-me" signal) | Flow cytometry, immunofluorescence | Pre-apoptotic (2-4 hours post-treatment); precedes phosphatidylserine exposure [11] | PERK-dependent ER stress, eIF2α phosphorylation [11] [12] | B16F10 melanoma, human cancer cell lines [11] |
| Adenosine Triphosphate (ATP) | Extracellular release ("find-me" signal) | Luciferase-based assay, HPLC | Early apoptotic phase (4-6 hours); autophagy-dependent secretion [11] [12] | Caspase-3/7 activation, autophagy proteins [12] | B16F10 melanoma, colorectal cancer models [11] [12] |
| High Mobility Group Box 1 (HMGB1) | Passive release from nucleus | ELISA, Western blot | Late apoptotic/secondary necrotic phase (8-24 hours) [11] | Caspase-dependent nuclear shrinkage, membrane permeability [14] | Melanoma, colorectal cancer models [11] [14] |
| Phosphatidylserine (PS) | Membrane asymmetry loss | Annexin V staining | Mid-apoptotic (6-8 hours); follows CRT exposure [13] | Caspase-3/7-mediated scramblase activation [9] | Multiple cancer cell lines, organoid models [13] |
Executioner caspases-3/7 demonstrate distinctive substrate specificities that directly impact DAMP emission profiles. Caspase-3 exhibits the strongest activity against DEVD cleavage motifs, with caspase-7 showing similar preference, while inflammatory caspases (caspase-1, -4, -5, -11) demonstrate minimal DEVD cleavage capacity [13]. This specificity is exploited in modern reporter systems, where DEVD-based biosensors provide precise readouts of caspase-3/7 activation kinetics during ICD.
Experimental Protocol: Real-Time Monitoring of Caspase-3/7 Activation and DAMP Emission
This integrated protocol enables simultaneous monitoring of caspase-3/7 dynamics and subsequent DAMP emission in both 2D and 3D culture systems, facilitating comprehensive characterization of ICD induction.
Materials and Reagents
Table 2: Essential Research Reagents for Caspase-3/7 and ICD Research
| Reagent Category | Specific Examples | Function/Application | Key Considerations |
|---|---|---|---|
| Caspase-3/7 Reporters | DEVD-ZipGFP biosensor, CellEvent Caspase-3/7 Green | Real-time visualization of caspase activation via DEVD cleavage | ZipGFP offers irreversible signal accumulation; validated in caspase-3-deficient MCF-7 cells [13] |
| ICD Inducers | Doxorubicin (1-5 µM), Oxaliplatin (100-500 µM), 15dPMJ2 (5 µM) [11] | Induction of ER stress and caspase-dependent ICD | Concentration-dependent effects; 15dPMJ2 shows potency at lower concentrations [11] |
| Caspase Inhibitors | zVAD-FMK (pan-caspase, 20-50 µM) | Specific inhibition of caspase activity; validation control | Complete abrogation of DEVD cleavage confirms caspase-specific signals [13] |
| DAMP Detection Reagents Anti-CRT antibodies, ATP luciferase assay kits, HMGB1 ELISA | Quantification of DAMP emission magnitude and kinetics | CRT exposure precedes PS externalization; temporal sequencing is critical [11] [13] | |
| Cell Viability Assays | Annexin V/PI, IncuCyte AI Cell Health Analysis | Parallel assessment of cell death progression | mCherry constitutively expressed in reporter systems marks transduced cells but has limited viability assessment utility due to long half-life [13] |
Step-by-Step Methodology
Protocol 1: Generation of Stable Caspase-3/7 Reporter Cell Lines
Lentiviral Transduction
- Utilize lentiviral vectors encoding caspase-3/7 biosensor (ZipGFP with DEVD cleavage motif) with constitutive mCherry marker
- Perform transduction at MOI 5-20 in the presence of 8 µg/mL polybrene
- Select stable pools with appropriate antibiotics (e.g., puromycin 1-2 µg/mL) for 7-14 days
Validation of Reporter Functionality
- Treat reporter cells with carfilzomib (1 µM) or oxaliplatin (200 µM) for 24-48 hours
- Confirm GFP fluorescence induction via live-cell imaging
- Verify caspase specificity through co-treatment with zVAD-FMK (50 µM)
- Corroborate with Western blot for cleaved PARP and cleaved caspase-3 [13]
Protocol 2: Integrated Time-Course Analysis of Caspase Activation and DAMP Emission
Experimental Setup
- Seed caspase-3/7 reporter cells in appropriate culture vessels (2D: 96-well plates; 3D: organoid-compatible matrices)
- Treat with ICD inducers (e.g., doxorubicin 2 µM, oxaliplatin 300 µM) or vehicle control
- Include caspase inhibitor controls (zVAD-FMK 50 µM) for specificity confirmation
Real-Time Imaging and Data Acquisition
- Perform time-lapse imaging using IncuCyte or similar systems (every 2-4 hours for 72-120 hours)
- Monitor GFP fluorescence (caspase-3/7 activation) and mCherry (cell presence/confluence)
- Quantify fluorescence intensity and apoptotic cell counts using integrated analysis modules [13]
Endpoint DAMP Analysis
- Surface Calreticulin Detection: Harvest cells at 4-8 hours, stain with anti-CRT primary antibody and fluorophore-conjugated secondary, analyze via flow cytometry
- ATP Secretion Assay: Collect conditioned media at 6-12 hours, quantify ATP using luciferase-based assay kit
- HMGB1 Release Measurement: Collect conditioned media at 24-48 hours, quantify HMGB1 via ELISA [11] [12]
Figure 2: Experimental workflow for integrated analysis of caspase-3/7 activation and DAMP emission during immunogenic cell death. The protocol encompasses experimental setup, real-time monitoring, endpoint analyses, and data integration phases.
Technical Considerations and Optimization Strategies
Cell Type-Specific Variations
Research indicates significant variation in caspase-3/7 expression and activation capacity across different cell types. Primary macrophages demonstrate higher basal expression of cell death proteins and more robust activation of effector caspases compared to non-immune cells [15]. This cell-type specificity should inform model selection, with immune cells often showing enhanced sensitivity to ICD inducers and more pronounced DAMP emission profiles.
Temporal Dynamics and Sequencing
The sequential nature of DAMP emission requires careful temporal resolution. Surface calreticulin exposure typically precedes caspase-3/7 activation (2-4 hours vs. 6-8 hours), while ATP secretion coincides with early caspase activation, and HMGB1 release occurs during later apoptotic stages [11]. This precise sequencing underscores the importance of high-resolution time-course experiments rather than single endpoint measurements.
3D Culture Systems and Microenvironmental Considerations
The transition from 2D to 3D culture systems presents both challenges and opportunities for ICD research. Organoid and spheroid models better recapitulate the tumor microenvironment but require optimization of imaging parameters and reagent penetration [13]. Caspase-3/7 reporter systems adapted to 3D cultures enable visualization of spatial heterogeneity in ICD induction within complex tissue contexts.
Executioner caspases-3/7 serve as critical molecular switches that coordinate the emission of immunostimulatory DAMPs during ICD, transforming apoptotic cell death into an immunogenic process. The integrated experimental approaches outlined in this application note provide robust methodologies for investigating the temporal dynamics and functional consequences of caspase-3/7 activation in ICD. As research advances, targeting caspase-mediated DAMP emission represents a promising strategy for enhancing the efficacy of cancer immunotherapies and overcoming resistance mechanisms in cold tumors.
Calreticulin (CALR), a primary endoplasmic reticulum (ER) chaperone protein, plays a critical role in immunogenic cell death by translocating to the cell surface where it acts as a potent "eat-me" signal [16] [7]. This surface-exposed CALR (ecto-CALR) binds to Low-Density Lipoprotein Receptor-Related Protein 1 (LRP1, also known as CD91) on antigen-presenting cells, facilitating phagocytosis of dying cancer cells and subsequent cross-presentation of tumor antigens to T lymphocytes [17] [16]. The exposure of CALR represents one of the key damage-associated molecular patterns that confers adjuvanticity to dying cancer cells, transforming them into an in situ vaccine that can stimulate protective antitumor immunity [16] [18]. This process is now recognized as a crucial determinant of the therapeutic efficacy of various anticancer regimens, including specific chemotherapeutic agents, photodynamic therapy, and radiotherapy [17] [19] [18].
Molecular Mechanisms of CALR Translocation
Core Signaling Pathway
The translocation of CALR from the ER lumen to the cell surface is a tightly regulated process initiated by diverse ER stress-inducing stimuli. The following diagram illustrates the core pathway integrating the key molecular events:
Key Regulatory Nodes
PERK-eIF2α Axis: The protein kinase RNA-like ER kinase (PERK)-dependent phosphorylation of eukaryotic initiation factor 2α (eIF2α) constitutes a critical regulatory node in CALR exposure [17] [16]. This phosphorylation event induces a rapid, transient arrest in global protein translation while simultaneously promoting the synthesis of specific proteins required for CALR translocation [16].
Caspase-8 Signaling: Activation of caspase-8 leads to cleavage of B-cell receptor-associated protein 31 (BCAP31), which triggers the oligomerization of pro-apoptotic Bcl-2 family members BAX and BAK at the mitochondrial membrane [16]. This pathway operates in parallel to the PERK pathway and is essential for certain ICD inducers.
Membrane Trafficking Machinery: The anterograde transport of CALR-containing vesicles to the plasma membrane requires the phosphoinositide 3-kinase (PI3K) p110α subunit and SNARE proteins including vesicle-associated membrane protein 1 (VAMP1) and synaptosome-associated protein 25 (SNAP25) [17] [16].
Quantitative Analysis of CALR Exposure Dynamics
The timing and regulation of CALR exposure have been quantitatively characterized across different experimental systems. The following table summarizes key kinetic parameters and regulatory features:
Table 1: Quantitative Dynamics of CALR Exposure in ICD
| Parameter | Values & Observations | Experimental System | Citation |
|---|---|---|---|
| Onset Timing | Early event, precedes phosphatidylserine externalization and biochemical apoptosis signatures | Human bladder carcinoma T24 cells | [17] |
| Key Regulators | PERK (essential), eIF2α phosphorylation (context-dependent), caspase-8 (essential for some inducers) | Multiple cancer cell lines | [17] [16] |
| Trafficking Requirements | Functional secretory pathway, PI3K p110α, VAMP1/SNAP25 | Yeast and human cells | [17] [20] |
| Inhibition Effects | PERK depletion, PI3K inhibition, LRP1 blockade reduce immunogenicity | In vitro and in vivo models | [17] |
| Chemokine Modulation | CXCL8/CXCR1-2 signaling modulates CRT exposure; knockdown reduces immunogenicity | Human and murine cancer cells | [20] |
Experimental Protocols for CALR Detection
Flow Cytometry-Based Surface CALR Detection
This protocol enables quantitative assessment of CALR surface exposure in treated cell populations, suitable for high-content screening applications [21].
Table 2: Protocol for Surface CALR Detection by Flow Cytometry
| Step | Procedure | Conditions & Reagents | Purpose |
|---|---|---|---|
| 1. Cell Preparation | Seed cells in appropriate culture vessels; apply ICD inducers | 70-80% confluency; include untreated and stained controls | Ensure optimal cell health and experimental controls |
| 2. Surface Staining | Harvest cells without fixation; incubate with anti-CALR antibody | Use non-permeabilizing conditions; anti-CALR primary antibody | Detect surface-exposed CALR without detecting intracellular pool |
| 3. Secondary Staining | Incubate with fluorophore-conjugated secondary antibody | Fluorescently-labeled species-specific antibody; protect from light | Amplify signal for detection |
| 4. Analysis | Analyze by flow cytometry; measure fluorescence intensity | Include isotype controls for gating; use viability dyes if needed | Quantify surface CALR levels |
Integrated Real-Time Caspase Activity and CALR Exposure
This advanced methodology combines dynamic caspase tracking with endpoint CALR assessment, providing temporal correlation between apoptotic execution and immunogenic signaling [21].
Table 3: Protocol for Integrated Caspase Dynamics and CALR Detection
| Step | Procedure | Conditions & Reagents | Purpose |
|---|---|---|---|
| 1. Reporter Cell Generation | Stably transduce cells with caspase-3/7 reporter (ZipGFP-DEVD) and constitutive mCherry | Lentiviral delivery; fluorescence-based selection | Generate tools for real-time apoptosis monitoring |
| 2. Real-Time Imaging | Treat cells with ICD inducers; perform live-cell imaging | Time-lapse microscopy over 24-120 hours; control environmental conditions | Track caspase activation kinetics at single-cell resolution |
| 3. Endpoint CALR Analysis | Harvest cells post-imaging; perform surface CALR staining by flow cytometry | Correlate GFP fluorescence history with CALR exposure | Link apoptotic kinetics to immunogenic marker exposure |
| 4. Data Integration | Correlate temporal caspase activation patterns with CALR surface levels | Computational analysis of imaging and flow cytometry data | Establish kinetic relationships between apoptosis and ICD |
The Scientist's Toolkit: Essential Research Reagents
Table 4: Key Research Reagents for CALR Exposure Studies
| Reagent Category | Specific Examples | Research Application | Mechanistic Insight |
|---|---|---|---|
| ICD Inducers | Mitoxantrone, Doxorubicin, Hypericin-PDT, Oxaliplatin | Induce ER stress and CALR exposure | Activate PERK-dependent and -independent pathways [17] [19] [18] |
| Pathway Inhibitors | PERK inhibitors, PI3K inhibitors, zVAD-FMK (pan-caspase) | Dissect contribution of specific pathway nodes | Establish mechanistic requirements [17] [21] |
| Detection Antibodies | Anti-CALR antibodies, LRP1/CD91 blocking antibodies | Quantify surface exposure and functional consequences | Demonstrate "eat-me" signal functionality [17] [16] |
| Reporter Systems | Caspase-3/7 reporters (DEVD-based), stable mCherry lines | Real-time apoptosis tracking with viability normalization | Correlate apoptosis kinetics with CALR exposure [21] |
| Genetic Tools | siRNA against PERK, CALR, CXCL8/Cxcl2 receptors | Target-specific gene function disruption | Validate protein function in CALR exposure pathway [17] [20] |
Methodological Workflow for Comprehensive Analysis
The following diagram outlines an integrated experimental approach for characterizing CALR exposure and its functional consequences:
This comprehensive workflow enables researchers to establish causal relationships between specific pathway activations, CALR surface exposure, and functional immune outcomes, providing a robust framework for evaluating novel ICD inducers and characterizing their mechanisms of action.
Immunogenic cell death (ICD) represents a functionally distinct form of apoptosis that activates an adaptive immune response against dead cell-associated antigens, particularly in cancer cells. This process is critically dependent on the spatiotemporally coordinated emission of damage-associated molecular patterns (DAMPs). Three key signaling pathways converge to regulate ICD: phosphorylation of eukaryotic initiation factor 2α (eIF2α), caspase-8 activation, and vesicular transport mechanisms. The phosphorylation of eIF2α on serine 51 constitutes a pathognomonic characteristic of ICD and serves as a central hub integrating stress signals from multiple kinases to regulate downstream DAMP emission, including calreticulin (CALR) exposure and ATP secretion [22] [23]. Caspase-8 plays a context-dependent role, being essential for ICD induced by some agents while dispensable for others. Vesicular transport provides the essential cellular machinery for the trafficking of ICD mediators to the cell surface and their release into the extracellular space [17] [24]. This application note details the experimental approaches for investigating these interconnected pathways in ICD research.
Table 1: Functional Roles of Core Components in Immunogenic Cell Death
| Pathway Component | Role in ICD | Required for CALR Exposure? | Key Interacting Partners |
|---|---|---|---|
| eIF2α Phosphorylation | Master regulator; inhibits translation, induces ATF4, essential for multiple DAMPs [22] [23] | Required for anthracyclines and other inducers [22] | PERK (EIF2AK3), GCN2 (EIF2AK4), PKR (EIF2AK2), eIF2B [22] [25] [26] |
| Caspase-8 | Apoptosis initiator; role in ICD is stimulus-dependent [17] | Dispensable for CALR exposure in Photodynamic Therapy [17] | FADD, Caspase-3, PERK (indirect) |
| Vesicular Transport (PI3K) | Critical for CALR and ATP trafficking to plasma membrane [17] | Required (PI3K inhibition blocks exposure) [17] | PERK, LRP1/CD91 (CALR docking site) |
Table 2: eIF2α Kinases and Their Roles in Cellular Stress Response
| eIF2α Kinase | Official Name | Primary Activators | Documented Role in ICD/Autophagy |
|---|---|---|---|
| PERK | EIF2AK3 | Endoplasmic Reticulum (ER) stress, unfolded proteins [25] | Mediates eIF2α phosphorylation by mitoxantrone [22] |
| GCN2 | EIF2AK4 | Amino acid starvation, UV damage, viral infection [27] [25] | Antiviral role; can drive eIF2α phosphorylation during infection [27] |
| PKR | EIF2AK2 | Viral double-stranded RNA, alcohol [25] | Activated by viral infection; often degraded or inhibited by viruses [27] |
| HRI | EIF2AK1 | Oxidative stress, heme deficiency, heat shock [25] | Important for autophagy induction by various pharmacological agents [25] |
Experimental Protocols for ICD Pathway Analysis
Protocol 1: Detecting eIF2α Phosphorylation and CALR Exposure
Purpose: To quantify core ICD biomarkers in vitro following treatment with potential ICD inducers (e.g., anthracyclines, photodynamic therapy).
Materials:
- Cell lines: T24 human bladder carcinoma, CT26 mouse colon carcinoma, or U2OS human osteosarcoma [17] [28] [25].
- Reagents: Potential ICD inducer (e.g., Mitoxantrone, Hypericin-based PDT, Datopotamab deruxtecan) [22] [17] [28].
- Antibodies: Anti-phospho-eIF2α (Ser51), anti-total eIF2α, anti-calreticulin for surface staining [23] [25].
- Equipment: Flow cytometer, fluorescence microscope, immunoblotting apparatus.
Procedure:
- Cell Treatment: Seed cells and allow to adhere overnight. Treat with the ICD inducer using established positive controls (e.g., 10 µM Mitoxantrone for 24 hours) [22].
- Cell Harvesting: Gently wash cells with ice-cold PBS and detach using non-enzymatic cell dissociation buffer to preserve surface antigens.
- Surface CALR Staining: Incubate live, non-permeabilized cells with primary anti-calreticulin antibody for 30 minutes on ice. Wash and incubate with fluorescently-labeled secondary antibody. Analyze via flow cytometry [17] [28].
- Intracellular p-eIF2α Staining: Fix and permeabilize a separate cell aliquot. Stain with anti-phospho-eIF2α (Ser51) antibody and an appropriate fluorescent secondary. Analyze by flow cytometry or immunofluorescence [25].
- Immunoblot Validation: Lyse remaining cells for immunoblotting to confirm eIF2α phosphorylation status and total eIF2α levels [22] [25].
Protocol 2: Functional Vesicular Transport and Caspase-8 Dependency Assay
Purpose: To determine the role of vesicular transport and caspase-8 in ICD-associated DAMP emission.
Materials:
- Inhibitors: PI3K inhibitor (e.g., LY294002), pan-caspase inhibitor (e.g., Z-VAD-FMK), caspase-8 specific inhibitor (e.g., Z-IETD-FMK).
- ATP detection kit (e.g., luciferase-based).
- HMGB1 ELISA kit.
- Phagocytosis assay components: Dendritic cells (DCs), fluorescent cell tracker dyes.
Procedure:
- Inhibitor Pre-treatment: Pre-treat target cancer cells with DMSO (vehicle control), PI3K inhibitor, or caspase inhibitor for 1-2 hours prior to ICD inducer application [17].
- ATP Secretion Assay: Collect cell culture supernatant at early time points (e.g., 4-6 hours) post-ICD induction. Measure extracellular ATP concentration using a luciferase-based bioluminescence assay according to manufacturer's protocol [28].
- HMGB1 Release Assay: Collect cell culture supernatant at later time points (e.g., 24 hours) post-ICD induction. Quantify released HMGB1 using a commercial ELISA kit [23].
- Functional Phagocytosis Assay: Label control and ICD-induced target cells with a fluorescent dye. Co-culture with immature dendritic cells (iDCs) at a defined ratio. After co-culture, analyze DCs for maturation markers (CD80, CD83, CD86, MHC-II) by flow cytometry and assess phagocytosis of labeled targets [17].
The Scientist's Toolkit: Key Research Reagent Solutions
Table 3: Essential Reagents for Investigating ICD Signaling Pathways
| Reagent/Category | Specific Examples | Function/Application in ICD Research |
|---|---|---|
| ICD Inducers | Mitoxantrone, Doxorubicin, Hypericin-PDT, Datopotamab deruxtecan [22] [17] [28] | Positive controls to trigger immunogenic cell death with known mechanisms. |
| eIF2α Modulators | Salubrinal, Guanabenz, Nelfinavir (phosphatase inhibitors) [25] | To enhance/investigate eIF2α phosphorylation independently of upstream kinases. |
| Genetic Models | EIF2α S51A mutant cells, EIF2AK1-4 knockout MEFs [25] | To determine the specific requirement for eIF2α phosphorylation and individual kinases. |
| Pathway Inhibitors | PI3K inhibitors (e.g., LY294002), Caspase-8 inhibitor (Z-IETD-FMK) [17] | To dissect the contribution of vesicular transport and specific caspases to DAMP emission. |
| Detection Antibodies | Anti-phospho-eIF2α (Ser51), Anti-Calreticulin (surface staining) [23] [25] | Key biomarkers for quantifying core ICD events via flow cytometry, WB, or IHC. |
| Vesicular Transport Markers | Antibodies against COPI, COPII, Clathrin, LRP1 [17] [24] | To study the machinery responsible for CALR externalization and ATP secretion. |
Signaling Pathway and Experimental Workflow Visualizations
ICD Induction via the PERK-eIF2α-ATF4-CALR Axis
Diagram 1: ICD induction via the PERK-eIF2α-ATF4-CALR axis. This pathway illustrates how endoplasmic reticulum (ER) stress triggers PERK-mediated phosphorylation of eIF2α, which simultaneously inhibits global protein synthesis while selectively promoting ATF4 translation. The eIF2α-P signal promotes CALR surface exposure and ATP secretion through a PI3K-dependent vesicular transport pathway. Caspase-8 operates in a parallel, stimulus-dependent pathway to execute apoptosis and facilitate HMGB1 release.
Experimental Workflow for Comprehensive ICD Analysis
Diagram 2: Experimental workflow for comprehensive ICD analysis. This workflow outlines a sequential approach to validate immunogenic cell death. Phase 1 involves cell preparation and inhibitor pre-treatment to dissect mechanism. Phase 2 focuses on early ICD biomarkers (CALR exposure, ATP secretion, eIF2α phosphorylation). Phase 3 assesses late events (HMGB1 release) and functional consequences (phagocytosis by dendritic cells), culminating in definitive in vivo vaccination and challenge experiments.
Caspases, cysteine-dependent aspartate-specific proteases, represent a fundamental paradox in cellular immunity. Traditionally categorized as either apoptotic or inflammatory, these enzymes are now recognized as critical regulators of both immunostimulatory and immunosuppressive pathways [5] [29]. This duality is particularly evident in the context of immunogenic cell death (ICD), a functionally unique form of apoptosis that activates adaptive immunity against dead cell-associated antigens, such as those from tumors [30] [17]. While conventional apoptosis typically leads to immunosuppressive tolerance, ICD is characterized by the emission of damage-associated molecular patterns (DAMPs) that stimulate potent immunostimulatory responses [17]. The strategic emission of these DAMPs, including calreticulin (CRT), is directly orchestrated by caspase activity [30] [4]. This application note explores the molecular mechanisms underlying caspase-mediated immunomodulation, with a specific focus on CRT exposure pathways, and provides detailed protocols for harnessing this knowledge in therapeutic development.
Molecular Mechanisms of Caspase-Mediated Immunomodulation
Caspase Classification and Functional Diversity
Caspases are phylogenetically conserved across metazoans and are centrally involved in cell death, inflammation, and homeostasis [5]. The 12 human caspases can be categorized structurally by their pro-domains or functionally by their roles in apoptosis, pyroptosis, and inflammation, though these classifications often overlap, reflecting their multifunctional nature [5] [29] [31].
Table 1: Caspase Classification and Primary Functions
| Caspase Type | Members | Pro-Domain | Primary Functions | Immunological Role |
|---|---|---|---|---|
| Apoptotic Initiators | Caspase-2, -8, -9, -10 | CARD or DED | Initiate apoptosis cascades | Immunosuppressive (typically); Caspase-8 can promote ICD |
| Apoptotic Executors | Caspase-3, -6, -7 | Short/None | Execute apoptosis via substrate cleavage | Dual role: Can promote immunosuppression or immunostimulation via GSDME cleavage |
| Inflammatory Caspases | Caspase-1, -4, -5, -11 (mouse) | CARD | Drive pyroptosis and cytokine maturation | Immunostimulatory via lytic cell death and IL-1β/IL-18 release |
The Immunosuppressive Face of Caspases: Conventional Apoptosis
The canonical role of caspases in apoptosis is generally immunosuppressive. Apoptotic cells display "eat-me" signals like phosphatidylserine, which promotes silent clearance by phagocytes without triggering inflammation or adaptive immunity [29]. This process, known as efferocytosis, is crucial for maintaining tissue homeostasis and preventing autoimmunity. Caspase-3, the key executioner caspase, cleaves numerous cellular substrates to dismantle the cell systematically, resulting in the formation of apoptotic bodies that are efficiently engulfed and degraded [32]. The immunosuppressive nature of apoptosis explains why most conventional chemotherapies fail to generate antitumor immunity despite massive tumor cell death.
The Immunostimulatory Face of Caspases: Orchestrating Immunogenic Cell Death
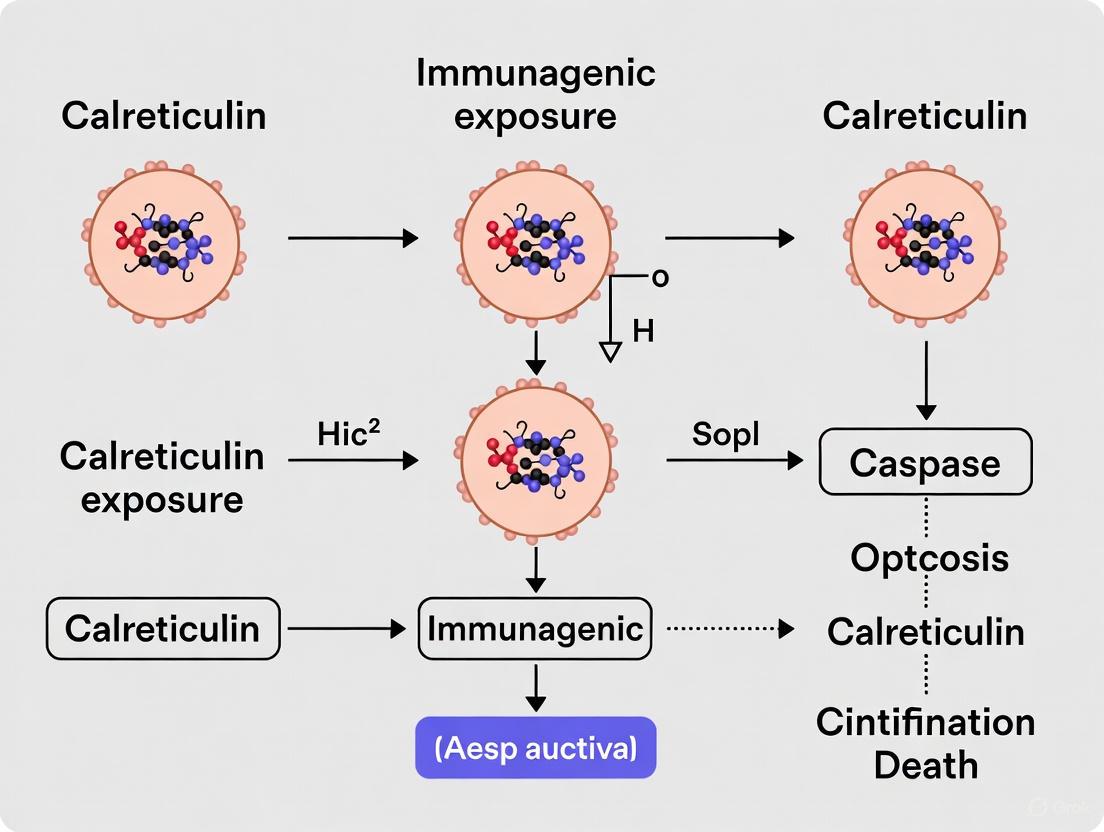
Paradoxically, the same caspases can drive highly immunogenic cell death in specific contexts. Certain chemotherapeutic agents (e.g., anthracyclines, oxaliplatin) and physical stressors (e.g., photodynamic therapy, ultraviolet C radiation) activate caspase-dependent pathways that lead to the emission of DAMPs, which act as adjuvants to stimulate antigen-presenting cells and activate tumor-specific T cells [30] [4] [17]. The pre-apoptotic exposure of calreticulin (ecto-CRT) represents one of the most critical DAMPs in this process, serving as a potent "eat-me" signal that promotes phagocytosis of tumor cells by dendritic cells and cross-presentation of tumor antigens [30] [4].
Diagram 1: Molecular pathway of caspase-dependent calreticulin exposure in immunogenic cell death. Specific inducers trigger ER stress and PERK-dependent activation of caspase-8, leading to CRT translocation via SNARE-mediated exocytosis.
Application Note: Quantitative Analysis of Caspase-Dependent Ecto-CRT Exposure
Experimental Model Systems for ICD Research
The study of caspase-mediated immunogenic cell death requires appropriate model systems that recapitulate key aspects of the human immune response. Multiple established models provide valuable insights into these mechanisms:
- In vitro human cell systems: T24 human bladder carcinoma cells and other cancer lines treated with immunogenic agents (oxaliplatin, mitoxantrone) or photodynamic therapy [17].
- Mouse tumor models: CT26 murine colon carcinoma and B16F10 melanoma syngeneic in immunocompetent BALB/c and C57BL/6 mice respectively [30] [4].
- Yeast models: Surprisingly, the CRT exposure pathway is phylogenetically conserved, with yeast cells exposing CRT in response to mating pheromones, providing a simple model system [20].
Key Readouts and Quantitative Data
Research into caspase-mediated ICD has yielded consistent quantitative data across multiple experimental systems. The following table summarizes key findings from seminal studies in the field:
Table 2: Quantitative Parameters of Caspase-Dependent Ecto-CRT Exposure
| Experimental Parameter | Measurement | System | Reference |
|---|---|---|---|
| Time to CRT exposure | 1-4 hours post-treatment (pre-apoptotic) | CT26 cells treated with oxaliplatin, mitoxantrone, or UVC | [30] |
| CRTpep affinity | Dissociation constant (Kd) = 1.868 μM | CRT-specific peptide binding assay | [4] |
| Caspase-8 activation | Significant increase within 2-4 hours (pre-apoptotic) | Immunoblotting in oxaliplatin-treated CT26 cells | [30] [4] |
| ER stress markers | PERK and eIF2α phosphorylation within 4 hours | Multiple immunogenic agents in CT26 cells | [30] |
| Doxorubicin efficacy | Significant ecto-CRT increase at 25 μM | CT26 xenografts in BALB/c mice | [4] |
| Therapeutic radiation | Significant CRT exposure at 2, 5, and 10 Gy | CT26 cells in vitro | [4] |
Protocols: Experimental Approaches to Caspase-Mediated ICD
Protocol 1: Detection and Quantification of Ecto-CRT
Principle: This protocol utilizes a CRT-specific binding peptide (KLGFFKR, CRTpep) labeled with fluorescein isothiocyanate (FITC) or 18F for in vitro and in vivo detection of caspase-dependent CRT exposure during early ICD [4].
Materials:
- CRTpep (KLGFFKR synthetic peptide)
- FITC or 18F labeling reagents
- Immunogenic agents: oxaliplatin (500 μM), doxorubicin (25 μM), mitoxantrone (3 μM)
- Non-immunogenic control: gemcitabine (15 μM)
- Radiation source (for 2-15 Gy irradiation)
- Flow cytometer or small-animal PET/CT scanner
Procedure:
- Cell treatment: Treat CT26 or other cancer cells with immunogenic agents at indicated concentrations for 2-4 hours.
- CRTpep labeling: Incubate cells with FITC-conjugated CRTpep for 30 minutes at 4°C.
- Washing: Remove unbound peptide with three washes in cold PBS.
- Quantification:
- In vitro: Analyze by flow cytometry or immunofluorescence microscopy.
- In vivo: Inject 18F-CRTpep (7.4 MBq/200 μL) intravenously into tumor-bearing mice and perform PET imaging at 1-2 hours post-injection.
- Validation: Confirm caspase dependence using broad-spectrum caspase inhibitors (Z-VAD-fmk) or caspase-8-specific inhibitors.
Expected Results: Immunogenic agents (oxaliplatin, doxorubicin, mitoxantrone, radiation) will induce significant ecto-CRT exposure detectable by CRTpep binding, while non-immunogenic agents (gemcitabine) will show minimal effect. Caspase inhibition should abrogate CRT exposure.
Protocol 2: Dissecting the Caspase-8/PERK Pathway in CRT Exposure
Principle: This protocol establishes the molecular pathway connecting caspase activation to CRT exposure through ER stress signaling, utilizing RNA interference and phospho-specific antibodies.
Materials:
- PERK-specific siRNA or shRNA
- Caspase-8-specific siRNA
- BAP31 siRNA (targeting ER protein)
- Antibodies: anti-phospho-PERK (Thr980), anti-phospho-eIF2α (Ser51), anti-caspase-8, anti-BAP31
- Immunogenic agents: oxaliplatin, mitoxantrone, UVC irradiation
Procedure:
- Gene knockdown: Transfect cells with PERK-, caspase-8-, or BAP31-specific siRNA using appropriate transfection reagents.
- Verification: Confirm knockdown efficiency by immunoblotting 48-72 hours post-transfection.
- Stimulation: Treat transfected cells with immunogenic agents for 2-4 hours.
- Pathway analysis:
- Monitor PERK activation by immunoblotting for phospho-PERK (Thr980).
- Assess eIF2α phosphorylation by immunoblotting for phospho-eIF2α (Ser51).
- Detect caspase-8 activation by immunoblotting for cleaved caspase-8 fragments.
- Monitor BAP31 cleavage by immunoblotting.
- Functional output: Measure ecto-CRT exposure by flow cytometry with CRTpep-FITC.
Expected Results: Knockdown of PERK, caspase-8, or BAP31 should abolish ecto-CRT exposure without affecting cell death induction, confirming their specific role in the immunogenic pathway.
Protocol 3: In Vivo Validation of Immunogenic Cell Death
Principle: This protocol evaluates the functional consequences of caspase-dependent ICD through vaccination-protection experiments in immunocompetent mice.
Materials:
- CT26 tumor cells
- BALB/c mice (6-8 weeks old)
- Immunogenic agents: oxaliplatin (5 mg/kg), doxorubicin (5-10 mg/kg)
- Non-immunogenic control: gemcitabine (15 mg/kg)
- Caspase inhibitors: Z-VAD-fmk (pan-caspase), Z-IETD-fmk (caspase-8 specific)
Procedure:
- Cell preparation: Treat CT26 cells in vitro with immunogenic agents with or without caspase inhibitors.
- Vaccination: Inject 2×10^6 treated cells subcutaneously into the right flanks of mice (n=5-10 per group).
- Challenge: One week later, challenge mice with 1×10^6 live CT26 cells injected into the opposite flank.
- Monitoring: Measure tumor growth twice weekly for 4-6 weeks.
- Immune analysis: Isolate splenocytes from vaccinated mice and measure tumor-specific T-cell responses by ELISpot or intracellular cytokine staining.
Expected Results: Mice vaccinated with immunogenically dying cells should show significant protection against tumor challenge, evidenced by reduced tumor incidence and growth. This protection should be abrogated by caspase inhibition or CRT blockade.
The Scientist's Toolkit: Essential Research Reagents
Table 3: Key Research Reagents for Caspase and ICD Studies
| Reagent/Category | Specific Examples | Function/Application | Key Findings Enabled |
|---|---|---|---|
| Caspase Inhibitors | Z-VAD-fmk (pan-caspase), Z-IETD-fmk (caspase-8) | Inhibit caspase activity to establish functional requirements | Established caspase-8 requirement for ecto-CRT exposure [30] |
| CRT Detection Probes | CRTpep (KLGFFKR), FITC- or 18F-labeled | Quantify ecto-CRT exposure in vitro and in vivo | Enabled first in vivo imaging of ICD [4] |
| ER Stress Inducers | Tuniamycin, Thapsigargin | Induce ER stress independent of cytotoxic agents | Confirmed ER stress as prerequisite for ecto-CRT [30] |
| Phospho-Specific Antibodies | anti-pPERK (Thr980), anti-peIF2α (Ser51) | Detect activation of ER stress pathway elements | Established PERK-eIF2α axis in CRT exposure [30] |
| siRNA/shRNA Libraries | PERK-, caspase-8-, BAP31-targeting | Gene-specific knockdown to establish pathway hierarchy | Identified essential components of CRT exposure pathway [30] |
| Immunogenic Agents | Oxaliplatin, Doxorubicin, Mitoxantrone | Induce ICD in experimental models | Established chemotherapy-induced immunogenicity [30] [4] |
The dual role of caspases in immunostimulation and immunosuppression represents a paradigm shift in our understanding of cell death and immunity. The precise molecular mechanisms that determine whether caspase activation leads to immunogenic or tolerogenic outcomes remain an area of intense investigation. Current evidence suggests that the subcellular localization, magnitude, and temporal dynamics of caspase activation, along with the cellular context and microenvironment, collectively determine the immunological consequences [31]. The discovery that caspase-8 activation downstream of ER stress is required for pre-apoptotic CRT exposure provides a mechanistic link between the core apoptotic machinery and immunogenic signaling [30]. From a therapeutic perspective, these insights open exciting avenues for improving cancer immunotherapy by converting conventional immunosuppressive apoptosis into immunogenic cell death. Future research should focus on identifying specific caspase substrates that dictate immunogenic versus tolerogenic outcomes and developing small molecules that can selectively modulate these pathways to enhance antitumor immunity.
Tracking ICD in Real-Time: Advanced Assays for Caspase Activity and CALR Exposure
Live-Cell Imaging Reporters for Caspase-3/7 Dynamics in 2D and 3D Models
Regulated cell death is a fundamental process in tissue homeostasis, disease progression, and therapeutic responses. Within this field, immunogenic cell death has emerged as a critical mechanism by which certain anticancer therapies enhance immune-mediated tumour clearance. Central to this process are executioner caspases, particularly caspase-3 and -7, which act as key effector enzymes in the apoptotic cascade. The ability to dynamically visualize these caspases with high spatiotemporal resolution in physiologically relevant models provides invaluable insights for basic research and drug development. This application note details an integrated fluorescent reporter platform that enables real-time imaging of caspase-3/-7 dynamics while simultaneously investigating apoptosis-induced proliferation and immunogenic cell death markers such as calreticulin exposure [21] [33].
Reporter System Design and Mechanism
The core innovation presented here is a lentiviral-based, stable reporter system employing a ZipGFP-based caspase-3/-7 biosensor with a constitutive mCherry marker for normalization. The molecular design utilizes a split-GFP architecture where the GFP molecule is divided into two parts: β-strands 1–10 and the eleventh β-strand, tethered via a flexible linker containing a caspase-3/-7-specific DEVD cleavage motif [21].
Under basal conditions, the forced proximity of the β-strands prevents proper folding and chromophore maturation, resulting in minimal background fluorescence. During apoptosis, activation of caspase-3 or -7 triggers cleavage at the DEVD site, separating the β-strands and allowing spontaneous refolding into the native GFP structure. This structural reassembly enables efficient chromophore formation and rapid fluorescence recovery, providing a specific, irreversible, and time-accumulating signal for caspase activation [21].
The co-expressed mCherry serves as a persistent marker of successful transduction and cell presence, though its long half-life makes it unsuitable for direct real-time viability assessment following acute cell death [21].
Figure 1: Caspase-3/7 Reporter Activation Mechanism. The ZipGFP-based reporter remains non-fluorescent until caspase-3/7-mediated cleavage at the DEVD site enables GFP reconstitution and fluorescence. Constitutively expressed mCherry provides cell presence normalization.
Quantitative Performance Validation
The reporter system was rigorously validated across multiple parameters and experimental conditions, demonstrating robust performance for quantitative imaging applications.
Table 1: Quantitative Performance Metrics of Caspase-3/7 Reporter System
| Validation Parameter | Experimental Treatment | Control | Key Results | Validation Method |
|---|---|---|---|---|
| Caspase Specificity | Carfilzomib (proteasome inhibitor) | zVAD-FMK (pan-caspase inhibitor) | ~90% GFP signal reduction with inhibitor | Live-cell imaging, Western blot |
| Caspase-7 Dependency | Carfilzomib in MCF-7 cells (caspase-3 deficient) | Wild-type cells | Significant GFP signal maintained | Cell line comparison |
| Apoptosis Correlation | Carfilzomib | DMSO | Increased cleaved PARP & caspase-3 | Western blot, Annexin V/PI flow cytometry |
| Temporal Resolution | 80-hour time-lapse | - | Robust time-dependent GFP induction | Live-cell imaging |
| 3D Model Performance | Carfilzomib in spheroids/organoids | Untreated controls | Localized GFP fluorescence in heterogeneous structures | 3D fluorescence imaging |
Extended validation through 120-hour time-lapse imaging following oxaliplatin treatment confirmed progressive GFP fluorescence increase, which was effectively suppressed by zVAD-FMK co-treatment, further establishing the caspase specificity of the reporter system [21].
Experimental Protocols
Protocol 1: Generation of Stable Reporter Cell Lines
Materials:
- Lentiviral vector containing ZipGFP-DEVD-mCherry construct
- Target cells (e.g., MiaPaCa-2, HUVEC, patient-derived organoids)
- Polybrene (8 μg/mL)
- Puromycin (concentration determined by kill curve)
- Complete growth medium
Procedure:
- Seed target cells at 30-40% confluence in 6-well plates 24 hours pre-transduction.
- Replace medium with fresh medium containing 8 μg/mL Polybrene.
- Add lentiviral supernatant at appropriate multiplicity of infection (MOI).
- Centrifuge plates at 1000 × g for 60 minutes at 32°C (spinoculation).
- Incubate cells at 37°C, 5% CO₂ for 6-24 hours.
- Replace with fresh complete medium and culture for additional 48 hours.
- Select transduced cells with puromycin (typically 1-5 μg/mL) for 7-14 days.
- Confirm reporter expression via mCherry fluorescence microscopy.
- Sort high-expressing populations using fluorescence-activated cell sorting if needed.
Protocol 2: Real-Time Caspase Dynamics in 2D Cultures
Materials:
- Stable reporter cells
- Apoptosis inducers (e.g., carfilzomib, oxaliplatin)
- Pan-caspase inhibitor zVAD-FMK (20-50 μM)
- Live-cell imaging chamber with environmental control (37°C, 5% CO₂)
- Confocal or widefield fluorescence microscope with time-lapse capability
Procedure:
- Seed reporter cells in glass-bottom imaging plates at optimal density.
- Allow cells to adhere and recover for 24 hours.
- Pre-treat control wells with zVAD-FMK for 1-2 hours.
- Add apoptosis inducers at determined concentrations to experimental wells.
- Mount plates in environmental control chamber on microscope stage.
- Acquire simultaneous GFP/mCherry images at 10-30 minute intervals for 24-120 hours.
- Maintain focus using hardware autofocus systems.
- Analyze data by quantifying GFP/mCherry ratio per cell over time.
Protocol 3: Caspase Imaging in 3D Spheroid and Organoid Models
Materials:
- Stable reporter spheroids/organoids
- Cultrex or Matrigel basement membrane matrix
- Apoptosis inducers
- Specialized 3D imaging plates
Procedure:
- Embed reporter spheroids/organoids in Cultrex/Matrigel matrix.
- Plate in glass-bottom imaging plates optimized for 3D cultures.
- Allow matrix to polymerize at 37°C for 30 minutes.
- Add treatment compounds directly to culture medium.
- For time-lapse imaging, use confocal or multiphoton microscopy with z-stack acquisition.
- Set optimal z-stack intervals to cover entire structure without excessive phototoxicity.
- Maintain imaging intervals at 1-4 hours depending on experimental timeframe.
- Process 3D data sets using volume rendering and spot detection algorithms.
- Quantify apoptosis propagation through spheroid/organoid by tracking GFP-positive cells over time.
Protocol 4: Integrated Detection of Immunogenic Cell Death
Materials:
- Stable reporter cells
- ICD inducers (e.g., doxorubicin, mitoxantrone)
- Non-ICD inducer control (e.g., gemcitabine)
- Flow cytometry buffer with Fc receptor block
- Anti-calreticulin primary antibody
- Fluorophore-conjugated secondary antibody
- ATP assay kit, HMGB1 ELISA kit
Procedure:
- Treat reporter cells with ICD inducers or controls for 6-24 hours.
- For calreticulin exposure analysis: a. Harvest cells gently using non-enzymatic dissociation buffer b. Block Fc receptors with appropriate blocking buffer c. Stain with anti-calreticulin antibody (1-5 μg/mL) for 30 minutes on ice d. Wash and analyze by flow cytometry, gating on GFP-positive and -negative populations
- For ATP release: a. Collect conditioned medium from treated cells b. Measure ATP concentration using luminescent ATP assay kit
- For HMGB1 release: a. Collect conditioned medium b. Quantify HMGB1 by specific ELISA
- Correlate caspase activation (GFP signal) with ICD marker expression.
Figure 2: Integrated Experimental Workflow for Caspase Dynamics and ICD Analysis. The comprehensive protocol enables simultaneous tracking of caspase activation and immunogenic cell death markers across 2D and 3D model systems.
The Scientist's Toolkit: Essential Research Reagents
Table 2: Key Research Reagent Solutions for Caspase and ICD Imaging
| Reagent / Tool | Function | Application Notes |
|---|---|---|
| ZipGFP-DEVD-mCherry Reporter | Caspase-3/7 activity biosensor | Minimal background, irreversible activation, suitable for long-term imaging |
| Carfilzomib | Proteasome inhibitor, apoptosis inducer | Positive control for caspase activation |
| zVAD-FMK | Pan-caspase inhibitor | Specificity control for caspase-dependent signals |
| Organoid Culture Matrix | 3D support structure | Maintains architecture for physiologically relevant modeling |
| Anti-Calreticulin Antibodies | ICD marker detection | Flow cytometry and immunofluorescence for surface CRT |
| Annexin V / PI Kit | Apoptosis validation | Gold standard endpoint confirmation |
| ATP Luminescence Assay | DAMP detection | Quantifies ATP release as ICD marker |
| HMGB1 ELISA | DAMP detection | Measures HMGB1 release as ICD marker |
Integration with Immunogenic Cell Death Research
This reporter platform bridges crucial gaps in ICD research by enabling simultaneous tracking of caspase activation and established immunogenic markers. Calreticulin exposure is a primordial "eat-me" signal in ICD, occurring pre-apoptotically and driving efficient engulfment and cross-presentation of tumor antigens [16] [34]. The integration of this caspase reporter with calreticulin detection methodologies creates a powerful tool for dissecting the temporal relationship between apoptotic execution and immunogenic signaling.
The platform's application in patient-derived organoid models is particularly valuable for translational research, allowing investigation of caspase dynamics and ICD in clinically relevant, heterogeneous systems that better recapitulate in vivo physiology [21]. This capability enables more predictive screening of therapeutic agents that combine direct cytotoxic effects with immune-stimulating properties.
Advanced Applications
Apoptosis-Induced Proliferation Monitoring
Beyond core apoptosis imaging, this platform can detect apoptosis-induced proliferation, a compensatory process where apoptotic cells stimulate neighboring cell proliferation through mitogenic factor release. By incorporating proliferation dyes alongside caspase imaging, researchers can track this phenomenon in real-time, providing insights into tumor repopulation mechanisms following therapy [21].
Multiplexed Cell Death Modality Analysis
The platform's modular design allows extension to more complex, integrated forms of cell death. When combined with complementary markers of pyroptosis and necroptosis, researchers can dissect mixed cell death modalities that often occur in therapeutic contexts, particularly relevant for immunooncology research [21] [33].
The integrated fluorescent reporter platform detailed in these application notes provides a robust, validated solution for investigating caspase-3/-7 dynamics in physiologically relevant model systems. Its unique capacity to simultaneously track apoptotic execution, proliferation responses, and immunogenic markers positions it as an essential tool for advancing fundamental cell death research and accelerating the development of immunogenic anticancer therapies.
Within the context of immunogenic cell death (ICD), the pre-apoptotic translocation of calreticulin (CALR) from the endoplasmic reticulum to the cell surface represents a crucial "eat-me" signal that promotes the phagocytosis of dying tumor cells by dendritic cells and elicits a potent anticancer immune response [30]. The precise quantification of surface CALR exposure is therefore a critical parameter for evaluating the immunogenic potential of chemotherapeutic agents and for basic research into caspase activation and cell death pathways. This application note provides detailed methodologies for the reliable detection and quantification of surface CALR using flow cytometry and immunofluorescence, framed within the broader research context of ICD and calreticulin exposure mechanisms.
The Role of Surface Calreticulin in Immunogenic Cell Death
Key Signaling Pathways in CALR Exposure
Research has elucidated a specific pathway through which immunogenic cell death inducers, such as anthracyclines and oxaliplatin, trigger the translocation of the CALR/ERp57 complex to the cell surface before the manifestation of classical apoptosis markers [30]. This pathway involves several key steps:
- Endoplasmic Reticulum Stress Response: Early activation of the ER-resident kinase PERK leads to phosphorylation of the eukaryotic initiation factor 2α (eIF2α) on serine 51, a quintessential hallmark of ER stress response [30].
- Caspase Activation: Partial activation of caspase-8 (without concurrent activation of caspase-3) occurs, leading to the cleavage of the ER protein BAP31 [30].
- Bax/Bak Conformational Activation: The conformational activation of Bax and Bak proteins follows caspase-8-mediated cleavage events [30].
- Exocytosis: A specific pool of CALR that has transited the Golgi apparatus is secreted to the cell surface via SNARE-dependent exocytosis [30].
This exposure pathway is essential for the immunogenicity of cell death, as cells lacking the ability to expose CALR fail to elicit an immune response when treated with chemotherapeutic agents, despite undergoing cell death [30].
Table 1: Key Elements in the CALR Exposure Pathway and Their Functions
| Pathway Element | Function in CALR Exposure | Experimental Evidence |
|---|---|---|
| PERK | ER-sessile kinase whose early activation initiates the pathway | Depletion abolishes CRT exposure; phosphorylation on Thr980 observed [30] |
| eIF2α | Translation initiation factor; phosphorylation on Ser51 is essential | S51A mutation abolishes CRT exposure [30] |
| Caspase-8 | Partially activated; cleaves BAP31 | Depletion blocks exposure; broad-spectrum caspase inhibitors abolish translocation [30] |
| BAP31 | ER protein cleaved by caspase-8 | Uncleavable mutant prevents CRT exposure [30] |
| Bax/Bak | Pro-apoptotic proteins that undergo conformational activation | Depletion prevents CRT exposure [30] |
| SNAREs | Mediate vesicle fusion | Required for CALR secretion via exocytosis [30] |
Signaling Pathway for CALR Exposure
The following diagram illustrates the sequential signaling pathway leading to surface calreticulin exposure in response to immunogenic cell death inducers:
Quantitative Flow Cytometry for Surface CALR Detection
Flow cytometry provides a robust, quantitative method for measuring surface CALR exposure in cell populations, allowing for high-throughput screening of potential ICD inducers and detailed analysis of cell death mechanisms.
Sample Preparation Protocol
Stage 1: Cell Preparation and Viability Staining
- Harvest and Wash Cells: Prepare a single-cell suspension from your tissue or cell culture. Wash cells by centrifuging at approximately 200 × g for 5 minutes at 4°C and resuspend in ice-cold suspension buffer (PBS with 5-10% fetal calf serum) [35].
- Determine Cell Number and Viability: Cell viability should ideally be 90-95% before staining. Recommended cell concentration for suspension is 0.5-1 × 10^6 cells/mL [35].
- Viability Staining: Incubate cells with a DNA-binding viability dye (e.g., 7-AAD, DAPI) according to manufacturer's protocol in the dark at 4°C. Choose a dye with an emission spectrum that doesn't overlap with your detection fluorophores [35].
- Wash Cells: Wash cells twice with wash buffer (centrifuge at 200 × g for 5 minutes at 4°C) to remove unbound dye [35].
Stage 2: Blocking and Surface Staining
- Fc Receptor Blocking: Resuspend cell pellet in blocking buffer (e.g., 2-10% normal serum from secondary antibody species, human IgG, or anti-CD16/CD32) and incubate for 30-60 minutes in the dark at 4°C to prevent non-specific antibody binding [35] [36].
- Surface CALR Staining: Without washing out the blocking buffer, add fluorochrome-conjugated anti-CALR antibody. The recommended concentration typically ranges from 10-30 μg/mL. Incubate for 30-60 minutes in the dark at 4°C [37] [35].
- Wash Cells: Wash cells twice with wash buffer to remove unbound antibody [35].
- Fixation (Optional): If immediate analysis isn't possible, fix cells with 1-4% paraformaldehyde for 15-20 minutes on ice. Wash twice after fixation [35].
Critical Considerations:
- Keep cells and antibodies protected from light throughout the procedure to prevent fluorophore photobleaching [35].
- Avoid excessive centrifugation speeds and vortexing to prevent cell damage [35].
- Include appropriate controls: unstained cells, isotype controls, and positive controls if available [36].
Flow Cytometry Standardization and Quantitative Analysis
For truly quantitative measurements of surface CALR, standardization of the flow cytometry platform is essential:
- Instrument Calibration: Use calibration microsphere suspensions with known fluorescence intensities to convert fluorescence measurements to Equivalent Number of Reference Fluorophores (ERF) for quantitative comparisons across instruments and time [38].
- Reference Materials: The National Institute of Standards and Technology (NIST) provides reference materials and methodologies for quantitative flow cytometry, including fluorescent dye standards (e.g., SRM 1934) [38].
- Gating Strategy:
- Gate on intact cells based on forward and side scatter properties.
- Exclude doublets using forward scatter height versus area.
- Gate on viable cells by excluding viability dye-positive cells.
- Analyze CALR fluorescence intensity on viable, single cells.
Table 2: Quantitative Data on CALR Exposure from Key Studies
| Inducing Stimulus | Time to Surface Exposure | Key Pathway Elements Required | Functional Consequence |
|---|---|---|---|
| Anthracyclines | Within 4 hours | PERK, eIF2α, Caspase-8, BAP31, Bax/Bak, SNAREs [30] | Immunogenic cell death; dendritic cell phagocytosis [30] |
| Oxaliplatin (OXP) | Within 4 hours | PERK, eIF2α, Caspase-8, BAP31, Bax/Bak, SNAREs [30] | Immunogenic cell death; T-cell mediated immunity [30] |
| Ultraviolet C (UVC) Light | Within 4 hours | PERK, eIF2α, Caspase-8, BAP31, Bax/Bak, SNAREs [30] | Immunogenic cell death [30] |
| Thapsigargin | No exposure despite inducing ER stress | PERK, eIF2α (but insufficient alone) [30] | Non-immunogenic cell death [30] |
Immunofluorescence Staining for Surface CALR Visualization
Immunofluorescence microscopy provides spatial information about CALR distribution on the cell surface, allowing researchers to observe heterogeneity in CALR exposure within cell populations and to correlate surface CALR with other cellular markers.
Immunofluorescence Staining Protocol for Surface CALR
Solutions and Reagents Required:
- 1X Phosphate Buffered Saline (PBS)
- 4% Formaldehyde, Methanol-Free (freshly prepared)
- Blocking Buffer: 1X PBS / 5% normal serum / 0.3% Triton X-100 (Note: For surface staining only, omit Triton X-100 or use mild detergents like saponin to prevent internal staining)
- Antibody Dilution Buffer: 1X PBS / 1% BSA
- Fluorochrome-conjugated anti-CALR antibody
- Optional: Counterstains (e.g., DAPI for nuclei)
Staining Procedure:
- Fixation: Cover cells with 4% formaldehyde and fix for 15 minutes at room temperature. For tissue sections, follow the same fixation protocol [39].
- Rinse: Rinse three times with PBS for 5 minutes each [39].
- Blocking: Incubate specimen in Blocking Buffer for 60 minutes. For surface CALR staining, use a buffer without Triton X-100 or with mild detergents (0.2-0.5% saponin) that don't permeabilize the plasma membrane [35] [39].
- Primary Antibody Incubation: Apply diluted anti-CALR antibody in Antibody Dilution Buffer and incubate overnight at 4°C [39].
- Rinse: Rinse three times in PBS for 5 minutes each [39].
- Mounting: Mount samples with appropriate mounting medium for imaging [39].
- Storage: Store samples at 4°C protected from light for long-term preservation [39].
Live Cell Staining Alternative: For staining without fixation in live cells or tissues:
- Use fluorochrome-conjugated antibodies at 20 μg/mL concentration [37].
- Fc-block with anti-CD16/32 antibody for 30 minutes at 37°C before staining [37].
- Incubate with antibody for 1 hour at 37°C [37].
- Wash extensively with PBS (30 minutes with buffer changes every 10-15 minutes) to remove unbound antibody [37].
Workflow for Surface CALR Detection
The following diagram outlines the complete experimental workflow for detecting surface CALR using both flow cytometry and immunofluorescence:
The Scientist's Toolkit: Essential Reagents and Materials
Table 3: Research Reagent Solutions for Surface CALR Detection
| Reagent Category | Specific Examples | Function in CALR Detection |
|---|---|---|
| Viability Dyes | 7-AAD, DAPI, TOPRO-3 [35] | Distinguish live from dead cells; exclude dead cells that bind antibodies nonspecifically |
| Fc Blocking Reagents | Normal serum, anti-CD16/32 [35] [36] | Prevent non-specific antibody binding to Fc receptors, reducing background |
| Fixation Reagents | 4% Paraformaldehyde, Methanol, Acetone [35] [39] | Preserve cell structure and surface protein epitopes |
| Permeabilization Detergents | Triton X-100, Saponin, Tween-20 [35] | Allow antibody access to intracellular targets (not used for surface-only CALR) |
| CALR Detection Antibodies | Fluorochrome-conjugated anti-CALR antibodies | Specifically bind to surface-exposed CALR for detection |
| Calibration Standards | Fluorescent microspheres, reference dyes [38] | Enable quantitative fluorescence measurements across instruments and time |
| Isotype Controls | Matching immunoglobulin isotypes [36] | Distinguish specific from non-specific antibody binding |
The precise quantification of surface CALR exposure through flow cytometry and immunofluorescence provides critical insights into the immunogenic potential of cell death in response to various stimuli. The protocols outlined here, grounded in the molecular understanding of the CALR exposure pathway, offer researchers robust methodologies for investigating immunogenic cell death in the context of cancer therapy, drug development, and basic cell biology research. Standardization using quantitative fluorescence approaches and appropriate controls ensures the generation of reliable, reproducible data that can effectively inform both basic research and therapeutic development.
Immunogenic cell death (ICD) is a functionally unique form of regulated cell death that activates adaptive immune responses against dead cell-associated antigens, particularly from cancer cells [1]. The immunogenic potential of ICD hinges on the emission of damage-associated molecular patterns (DAMPs) in a precise spatiotemporal configuration [1]. Key DAMPs include surface-exposed calreticulin (CALR), secreted adenosine triphosphate (ATP), and released high mobility group box 1 (HMGB1) [12]. Detection of these DAMPs requires multiplexed approaches that can capture their coordinated emission, which occurs through distinct molecular pathways often initiated by endoplasmic reticulum (ER) stress and caspase activation [12] [13]. This protocol details standardized methodologies for the simultaneous detection of these three crucial DAMPs, providing researchers with a robust framework for quantifying ICD in experimental models.
The Molecular Framework of Immunogenic DAMP Emission
The emission of DAMPs during ICD follows a defined sequence of molecular events, often triggered by ER stress and culminating in caspase activation. The following diagram illustrates the core signaling pathway connecting initial cell death stimuli to the key DAMPs discussed in this protocol.
Figure 1. Core signaling pathway in immunogenic cell death. ICD inducers trigger endoplasmic reticulum stress, leading to PERK-mediated eIF2α phosphorylation and caspase activation. These events coordinate the emission of key DAMPs: surface exposure of calreticulin (CALR), secretion of ATP, and release of HMGB1, which collectively drive dendritic cell activation and anti-tumor T-cell immunity [12] [13] [1].
Experimental Workflow for Multiplexed DAMP Detection
The following workflow outlines the sequential and parallel procedures for detecting all three DAMPs from a single experimental setup, enabling researchers to capture the complete immunogenic profile of dying cells.
Figure 2. Integrated workflow for multiplexed DAMP detection. The experimental procedure begins with cell treatment followed by parallel processing of supernatant and cells for ATP/HMGB1 measurement and CALR detection, respectively. Data integration from all three assays confirms bona fide ICD [13] [1].
Quantitative Profiles of Key ICD DAMPs
The spatiotemporal emission patterns of CALR, ATP, and HMGB1 during bona fide ICD follow a predictable sequence, with CALR exposure typically preceding ATP secretion and HMGB1 release.
Table 1. Kinetic profiles and detection parameters for key ICD-associated DAMPs
| DAMP | Primary Function | Detection Window | Detection Method | Positive Control |
|---|---|---|---|---|
| Surface CALR | "Eat me" signal for phagocyte uptake [12] | 2-16 hours post-treatment [1] | Flow cytometry with anti-CALR antibody [1] | Mitoxantrone (1-5 µM) [20] |
| Extracellular ATP | "Find me" signal for DC recruitment [12] | 4-24 hours post-treatment [1] | Luciferase-based assay [1] | Doxorubicin (0.5-5 µM) [12] |
| Released HMGB1 | DC activation via TLR4 binding [1] | 24-48 hours post-treatment [1] | ELISA [1] | Oxaliplatin (10-100 µM) [12] |
Detailed Experimental Protocols
Surface Calreticulin (CALR) Detection by Flow Cytometry
Principle: CALR translocates to the cell surface during pre-apoptotic stages of ICD, serving as a critical "eat me" signal for phagocytic cells [1] [20]. This protocol detects surface-exposed CALR while avoiding intracellular pools.
Reagents Required:
- Anti-CALR primary antibody (e.g., rabbit anti-CALR)
- Fluorescently-labeled secondary antibody (e.g., Alexa Fluor 488 goat anti-rabbit)
- Flow cytometry staining buffer (PBS + 2% FBS)
- Positive control ICD inducer: Mitoxantrone (1-5 µM) [20]
- Fixation buffer (4% paraformaldehyde, optional)
Procedure:
- Cell Treatment: Seed appropriate target cells (e.g., CT26 colorectal carcinoma or MCA205 fibrosarcoma) and treat with ICD inducers for 6-16 hours.
- Cell Harvest: Gently detach cells using non-enzymatic cell dissociation buffer to preserve surface epitopes.
- Surface Staining:
- Wash cells twice with ice-cold flow cytometry buffer.
- Resuspend 1×10⁶ cells in 100 µL buffer containing anti-CALR primary antibody (dilution as manufacturer recommends).
- Incubate for 30 minutes at 4°C in the dark.
- Wash twice with buffer to remove unbound antibody.
- Resuspend in 100 µL buffer containing fluorescent secondary antibody.
- Incubate for 30 minutes at 4°C in the dark.
- Wash twice and resuspend in 300 µL buffer for analysis.
- Flow Cytometry: Analyze samples using a flow cytometer equipped with appropriate lasers and filters. Include unstained and isotype controls for gating.
Technical Notes:
- CALR exposure typically precedes phosphatidylserine externalization [13].
- Avoid permeabilization buffers to specifically detect surface-exposed CALR.
- For simultaneous caspase detection, utilize stable cell lines expressing caspase-3/7 reporters [13].
Extracellular ATP Quantification by Luciferase Assay
Principle: ATP released during ICD acts as a potent "find me" signal that recruits antigen-presenting cells and promotes their maturation [12]. This assay exploits the luciferase enzyme's requirement for ATP to produce bioluminescence.
Reagents Required:
- Commercially available ATP bioluminescence assay kit
- Transparent or white 96-well plates
- ATP standard solutions for calibration curve (0.1 nM - 10 µM)
- Cell culture supernatants (centrifuged to remove debris)
- Positive control ICD inducer: Doxorubicin (0.5-5 µM) [12]
Procedure:
- Sample Collection:
- Treat cells with ICD inducers for 4-24 hours.
- Collect culture supernatants and centrifuge at 500 × g for 5 minutes to remove cells and debris.
- Process supernatants immediately or store at -80°C (avoid repeated freeze-thaw cycles).
- Standard Curve Preparation:
- Prepare ATP standards in serial dilutions from 10 µM to 0.1 nM in culture medium.
- Assay Performance:
- Add 50 µL of standards or samples to appropriate wells.
- Add 50 µL of luciferase reagent to each well.
- Incubate for 5 minutes in the dark.
- Measure luminescence using a plate reader.
- Data Analysis:
- Generate a standard curve from ATP standards.
- Calculate ATP concentrations in samples by interpolation from the standard curve.
- Normalize values to cell number or protein content.
Technical Notes:
- ATP secretion is autophagy-dependent [12].
- Include controls with apyrase (ATP-degrading enzyme) to confirm signal specificity.
- Measure at multiple timepoints as ATP secretion is transient [1].
HMGB1 Release Detection by ELISA
Principle: HMGB1 is passively released during late stages of ICD after plasma membrane permeabilization, where it acts as a cytokine that promotes antigen presentation and T-cell priming [1].
Reagents Required:
- Commercial HMGB1 ELISA kit
- Cell culture supernatants
- Microplate reader capable of measuring 450 nm absorbance
- Positive control ICD inducer: Oxaliplatin (10-100 µM) [12]
Procedure:
- Sample Collection:
- Collect supernatants 24-48 hours after ICD induction.
- Centrifuge at 2000 × g for 10 minutes to remove particulate matter.
- Store samples at -80°C if not used immediately.
- ELISA Performance:
- Follow manufacturer's instructions for the specific HMGB1 ELISA kit.
- Typically involves: Coating with capture antibody → Blocking → Sample incubation → Detection antibody incubation → Enzyme conjugate incubation → Substrate addition → Stop solution.
- Quantification:
- Measure absorbance at 450 nm with reference wavelength ~570 nm.
- Generate standard curve using provided HMGB1 standards.
- Calculate HMGB1 concentrations in samples.
Technical Notes:
- HMGB1 release occurs later than CALR exposure and ATP secretion [1].
- The redox state of HMGB1 affects its immunogenic activity; disulfide HMGB1 is highly immunogenic [1].
- For functional assays, HMGB1 can be detected in its bioactive form using specific antibodies recognizing the disulfide form.
The Scientist's Toolkit: Essential Research Reagents
Table 2. Key research reagents for multiplexed ICD detection
| Reagent Category | Specific Examples | Research Application | Key Characteristics |
|---|---|---|---|
| ICD Inducers | Doxorubicin [12], Mitoxantrone [12], Oxaliplatin [12] | Positive controls for DAMP emission | Known to trigger ER stress and caspase activation [12] |
| Caspase Reporters | ZipGFP-based DEVD biosensor [13] | Real-time caspase-3/7 activity monitoring | Irreversible fluorescence upon caspase activation [13] |
| Antibodies | Anti-CALR (surface) [1], Anti-HMGB1 [1] | DAMP detection and quantification | Validated for specific applications (flow cytometry, ELISA) |
| Detection Kits | ATP bioluminescence assay [1], HMGB1 ELISA [1] | Quantitative DAMP measurement | High sensitivity and linear range |
| Cell Lines | CT26 [12], MCA205 [1] | ICD model systems | Syngeneic for vaccination experiments [1] |
Troubleshooting and Quality Control
Critical Assay Controls:
- Include known ICD inducers (e.g., mitoxantrone, doxorubicin) as positive controls.
- Use non-immunogenic cell death inducers (e.g., cisplatin, UV irradiation) as negative controls [1].
- Validate CALR exposure by demonstrating inhibition with PERK or eIF2α phosphorylation inhibitors [20].
- Confirm ATP specificity with apyrase treatment.
- Ensure HMGB1 release correlates with late-stage cell death.
Common Technical Issues:
- Low CALR signal: Optimize treatment duration; ensure no permeabilization; verify antibody specificity.
- High ATP background: Process samples immediately; avoid cell lysis during collection.
- HMGB1 variability: Normalize to cell death percentage; standardize collection timepoints.
Validation Criteria: Bona fide ICD is confirmed when all three DAMPs are detected in their characteristic sequence: CALR exposure (early, pre-apoptotic) → ATP secretion (intermediate) → HMGB1 release (late) [1]. Correlation with caspase activation strengthens the conclusion [13].
This multiplexed DAMP detection protocol provides a standardized framework for identifying and quantifying immunogenic cell death in experimental systems. The simultaneous assessment of CALR exposure, ATP secretion, and HMGB1 release enables researchers to capture the essential features of ICD that distinguish it from tolerogenic cell death. These methodologies support the development of novel cancer therapies that leverage the immunogenic potential of cell death, particularly in combination with immune checkpoint inhibitors and other immunotherapeutic approaches [12] [40].
Immunogenic cell death (ICD) represents a functionally unique form of regulated cell death that activates the adaptive immune system against specific antigens, particularly from tumors [12]. The exposure of calreticulin (ecto-CRT) on the surface of dying cells serves as a pivotal "eat me" signal to phagocytic cells, facilitating the phagocytosis of tumor cells and subsequent cross-presentation of tumor antigens to T-cells [41] [17]. This application note provides detailed protocols for functionally validating ICD through phagocytosis assays and T-cell activation readouts, with particular emphasis on the roles of calreticulin exposure and caspase activation in these processes.
The core premise of ICD involves the emission of damage-associated molecular patterns (DAMPs), which include ecto-CRT, secreted ATP, and released HMGB1 [12]. These DAMPs collectively facilitate dendritic cell (DC) maturation, antigen presentation, and ultimately, the priming of tumor-specific T-cell responses. Within this framework, caspase-8 has emerged as a critical regulator of immunogenicity, contributing to an "immuno-hot" microenvironment through mechanisms involving ecto-calreticulin exposure [42].
Phagocytosis Assays: Methodologies and Protocols
In Vitro Phagocytosis Assay Using Macrophage-like and DC-like Cells
This protocol assesses the phagocytic clearance of ICD-induced tumor cells by professional phagocytes, specifically evaluating the contribution of ecto-CRT in this process [41].
Key Materials:
- Phagocytes: THP-1-derived macrophage-like or immature dendritic cell (DC)-like cells [41]
- Target cells: HT-29 human colorectal adenocarcinoma cells or other relevant cancer cell lines
- ICD inducers: Oxaliplatin (L-OHP, 100 μM), doxorubicin (1 μM), or other ICD-inducing agents
- CRT blocking reagent: CRT Blocking Peptide (Abcam, cat. no. ab202061 or equivalent)
- Fluorescent dyes: CellTracker Deep Red (Invitrogen) or PKH26/PKH67
- Equipment: Flow cytometer, CO₂ incubator, cell culture facilities
Procedure:
- Differentiation of phagocytes: Differentiate THP-1 monocytes into macrophage-like cells using 100 ng/mL PMA for 48 hours, or into immature DC-like cells using 50 ng/mL GM-CSF and 20 ng/mL IL-4 for 5-7 days [41].
- Induction of ICD: Treat HT-29 cells with oxaliplatin (100 μM) for varying timepoints to capture both early (transient) and late (sustained) ecto-CRT exposure phases [41].
- Fluorescent labeling: Harvest ICD-induced tumor cells and label with 1 μM CellTracker Deep Red dye according to manufacturer's protocol [42].
- Blocking conditions: Pre-incubate labeled tumor cells with 10 μg/mL CRT Blocking Peptide for 30 minutes to establish CRT-dependent phagocytosis [41].
- Co-culture establishment: Seed phagocytes and labeled tumor cells at a 1:10 ratio (phagocyte:tumor cell) in appropriate media.
- Phagocytosis phase: Incubate co-cultures for 2-4 hours at 37°C in 5% CO₂.
- Removal of non-phagocytosed cells: Gently wash with PBS or use mild acid wash (pH 4.0) to remove surface-adherent but non-internalized tumor cells.
- Analysis: Harvest phagocytes and analyze by flow cytometry to determine the percentage of fluorescent-positive phagocytes.
Technical Notes:
- The early ecto-CRT phase (induced by oxaliplatin) is preferentially recognized by immature DC-like cells, while the late sustained phase is primarily recognized by macrophage-like cells [41].
- Mature DC-like cells show minimal response to ecto-CRT-expressed cells, highlighting the importance of using appropriate phagocyte populations [41].
- Confirm ecto-CRT expression on tumor cells prior to assay using non-permeabilized staining and flow cytometry.
In Vivo Phagocytosis Assay
This protocol evaluates phagocytic clearance of ICD-induced tumor cells in a physiological context, providing insights into antigen capture and presentation in secondary lymphoid organs [42].
Key Materials:
- Animals: C57BL/6 mice (6-8 weeks old)
- Cell lines: B16F10 melanoma cells or other syngeneic models
- ICD inducers: Doxorubicin (25 μM), oxaliplatin, or radiation (20 Gy)
- Fluorescent dyes: CellTracker Deep Red
- Antibodies: Anti-mouse CD11c for dendritic cell identification
Procedure:
- Cell preparation: Induce ICD in B16F10 cells using 25 μM doxorubicin for 24 hours or 20 Gy radiation [42].
- Fluorescent labeling: Label cells with 1 μM CellTracker Deep Red dye according to manufacturer's protocol [42].
- Cell injection: Harvest and resuspend labeled tumor cells at 5×10⁷ cells/mL in PBS. Inject 5×10⁶ cells (in 100 μL PBS) into the spleen of anesthetized mice [42].
- Incubation: Allow 2 hours for in vivo phagocytosis to occur.
- Tissue collection: Euthanize mice and harvest spleens.
- Cell processing: Create single-cell suspensions from spleens and stain with anti-mouse CD11c antibody.
- Analysis: Assess phagocytosis by flow cytometry, quantifying the percentage of CD11c⁺ dendritic cells that are positive for the tumor cell dye.
Quantitative Analysis of Phagocytosis
Table 1: Key Parameters for Phagocytosis Assay Validation
| Parameter | Experimental Readout | Significance |
|---|---|---|
| Phagocytic Index | Percentage of fluorescent-positive phagocytes | Quantifies efficiency of phagocytic clearance |
| CRT Dependence | Reduction in phagocytosis with CRT blocking peptide | Confirms CRT-specific phagocytosis [41] |
| Phagocyte Specificity | Differential uptake by macrophage-like vs. DC-like cells | Determines phagocyte population involved in clearance [41] |
| Time Dependency | Phagocytosis at early (2-4h) vs. late (24h) timepoints | Correlates with ecto-CRT exposure kinetics [41] |
T-Cell Activation Readouts: Methodologies and Protocols
DC Maturation and Antigen Presentation Assay
The maturation status of dendritic cells following phagocytosis of ICD-induced tumor cells serves as a critical indicator of subsequent T-cell activation potential [17].
Key Materials:
- Dendritic cells: Human immature DCs derived from monocytes or murine bone marrow-derived DCs
- ICD-induced tumor cells: Prepared as described in Section 2.1
- Antibodies: Anti-human CD80, CD83, CD86, MHC-II for flow cytometry
- Cytokine assays: ELISA kits for IL-1β, IL-6, IL-12, IL-10
Procedure:
- ICD induction and co-culture: Induce ICD in tumor cells and co-culture with immature DCs at a 1:10 ratio (DC:tumor cell) for 24 hours.
- Flow cytometric analysis: Harvest DCs and stain for surface maturation markers (CD80, CD83, CD86, MHC-II). Analyze by flow cytometry.
- Cytokine profiling: Collect culture supernatants and analyze cytokine secretion using ELISA or multiplex bead arrays.
- Functional assessment: Evaluate DC function through mixed lymphocyte reaction or antigen-specific T-cell activation assays.
Expected Results:
- DCs exposed to ICD-induced tumor cells should demonstrate upregulated expression of co-stimulatory molecules (CD80, CD83, CD86) and MHC class II, comparable to LPS-stimulated positive controls [17].
- Characteristic cytokine profile includes elevated IL-1β and NO production, with absence of IL-10, distinguishing ICD from accidental necrosis [17].
Antigen-Specific T-Cell Activation Assay
This protocol measures the ultimate functional outcome of ICD: the activation and proliferation of tumor antigen-specific T-cells.
Key Materials:
- T-cells: Autologous or syngeneic T-cells from healthy donors or mice
- DCs: DCs previously exposed to ICD-induced tumor cells
- CFSE: CellTrace CFSE Cell Proliferation Kit
- Antibodies: Anti-CD3, CD8, CD4, IFN-γ, Granzyme B, TNF-α
- Antigen-specific reagents: MHC-peptide tetramers for known tumor antigens
Procedure:
- DC priming: Expose immature DCs to ICD-induced tumor cells at a 1:10 ratio for 24 hours.
- T-cell co-culture: Harvest primed DCs and co-culture with autologous T-cells at a 1:20 ratio (DC:T-cell) in complete media supplemented with 10-20 U/mL IL-2.
- Proliferation assessment: Label T-cells with CFSE prior to co-culture according to manufacturer's protocol to track proliferation.
- Incubation: Culture for 5-7 days to allow T-cell expansion.
- Intracellular cytokine staining: Re-stimulate T-cells with PMA/ionomycin or specific tumor antigens in the presence of brefeldin A for 4-6 hours. Harvest cells, perform surface staining for CD3/CD8/CD4, then fix, permeabilize, and stain intracellularly for IFN-γ and Granzyme B.
- Analysis: Analyze by flow cytometry for CFSE dilution (proliferation) and cytokine production.
In Vivo T-Cell Activation and Tumor Protection Assay
This protocol evaluates the functional consequences of ICD-induced T-cell activation in a physiologically relevant context.
Key Materials:
- Animals: Immunocompetent mice (e.g., BALB/c for CT26 model, C57BL/6 for B16F10 model)
- Cell lines: Syngeneic tumor cells (e.g., CT26 colorectal carcinoma, B16F10 melanoma)
- ICD inducers: Appropriate chemotherapeutic agents or radiation
- Antibodies: Anti-mouse CD45, CD3, CD8, CD4, IFN-γ, Granzyme B for flow cytometry
Procedure:
- Vaccination: Immunize mice with ICD-induced dying/dead tumor cells (1×10⁶ cells) subcutaneously.
- Challenge: After 7-14 days, challenge mice with live tumor cells (1×10⁵-5×10⁵ cells) of the same type.
- Monitor tumor growth: Measure tumor dimensions 2-3 times weekly.
- Immune analysis: Harvest tumors, draining lymph nodes, and spleens at endpoint for immune cell profiling by flow cytometry.
- Functional assessment: Isolate T-cells from immunized mice and assess cytotoxicity against tumor targets or cytokine production upon re-stimulation.
Expected Results:
- Mice immunized with ICD-induced tumor cells should show significant protection against subsequent tumor challenge compared to controls immunized with non-ICD induced cells [17].
- Tumor-specific T-cell responses should correlate with reduced tumor growth and increased immune cell infiltration.
Quantitative Analysis of T-Cell Activation
Table 2: Comprehensive T-Cell Activation Readouts
| Readout Category | Specific Assay | Key Metrics | Significance |
|---|---|---|---|
| Proliferation | CFSE dilution | Division index, precursor frequency | Quantifies expansion of antigen-responsive T-cells |
| Cytokine Production | Intracellular staining, ELISA | % IFN-γ⁺, TNF-α⁺, IL-2⁺ T-cells | Measures functional polarization and potency |
| Cytotoxic Potential | Granzyme B, perforin staining | % Granzyme B⁺ CD8⁺ T-cells | Assesses cytotoxic machinery |
| Activation Markers | Surface staining | CD69, CD25, CD44, PD-1 expression | Determines activation and differentiation status |
| Antigen Specificity | MHC tetramer staining | % tetramer⁺ CD8⁺ T-cells | Directly measures tumor antigen-specific T-cells |
Signaling Pathways in ICD and Functional Validation
The molecular pathways governing ICD involve coordinated stress responses that lead to DAMP emission. Understanding these pathways provides critical context for interpreting functional validation results.
Key Signaling Insights:
- ER stress and PERK activation: ICD inducers trigger endoplasmic reticulum stress, leading to PERK-dependent pathways for ecto-CRT exposure and ATP secretion [17].
- Caspase-8 function: Caspase-8 contributes significantly to ecto-CRT exposure and subsequent phagocytosis, with Casp8 deficiency resulting in impaired antigen presentation and reduced T-cell infiltration [42].
- LRP1 recognition: The LRP1 receptor serves as the primary docking site for ecto-CRT on phagocytes, facilitating the "eat me" signal recognition [17].
- Biphasic CRT exposure: Oxaliplatin induces biphasic ecto-CRT exposure (early transient and late sustained), with different phagocyte populations recognizing these distinct phases [41].
The Scientist's Toolkit: Essential Research Reagents
Table 3: Key Research Reagent Solutions for ICD Functional Validation
| Reagent Category | Specific Examples | Function/Application | Experimental Notes |
|---|---|---|---|
| ICD Inducers | Oxaliplatin (100 μM), Doxorubicin (1-25 μM), Mitoxantrone | Induce immunogenic cell death with DAMP emission | Concentration and timing critical for optimal ICD induction [41] [12] |
| CRT Modulators | CRT Blocking Peptide, anti-CRT antibodies | Validate CRT-specific effects in phagocytosis | Blocking peptide should reduce phagocytosis by 50-80% if CRT-dependent [41] |
| Caspase Inhibitors | Z-IETD-FMK (caspase-8 inhibitor, 50 μM) | Determine caspase-8 contribution to ecto-CRT | Pre-treatment (30 min) before ICD induction [42] |
| Phagocyte Markers | Anti-CD11c (DCs), anti-F4/80 (macrophages) | Identify and isolate specific phagocyte populations | Enables discrimination of phagocyte-specific responses [41] [42] |
| T-cell Activation Reagents | CFSE, anti-IFN-γ, anti-Granzyme B | Quantify T-cell proliferation and functional activation | Critical for assessing adaptive immune response to ICD |
| Flow Cytometry Panels | CD80/83/86/MHC-II for DC maturation CD4/CD8/IFN-γ/Granzyme B for T-cells | Multiparametric analysis of immune activation | Comprehensive immunophenotyping |
| Animal Models | Syngeneic tumor models (CT26, B16F10) | In vivo validation of ICD and immune responses | Required for physiological context and therapeutic assessment [17] [42] |
Troubleshooting and Technical Considerations
Critical Factors for Success:
- Timing of ecto-CRT assessment: Monitor both early (4-8 hours) and late (24-48 hours) timepoints after ICD induction, as different inducers produce distinct temporal patterns of ecto-CRT exposure [41].
- Phagocyte selection: Utilize both macrophage-like and immature DC-like cells, as they demonstrate differential recognition of early versus late ecto-CRT exposure [41].
- Caspase-8 status: Verify Casp8 functionality in your model system, as deficiency impairs ecto-CRT exposure and subsequent T-cell activation [42].
- Appropriate controls: Include both positive (LPS for DC maturation) and negative (non-ICD cell death) controls to properly contextualize results.
- Radiation salvage: Consider radiation (20 Gy) as a means to restore ecto-CRT exposure and immunogenicity in Casp8-deficient settings [42].
Common Challenges and Solutions:
- Low phagocytosis rates: Verify ecto-CRT expression on target cells; optimize phagocyte:tumor cell ratio; confirm phagocyte differentiation status.
- Variable T-cell responses: Use fresh, highly viable T-cells; optimize antigen load during DC priming; confirm cytokine support in culture.
- Inconsistent ICD induction: Titrate ICD inducers carefully; monitor multiple DAMPs (CRT, ATP, HMGB1) to confirm ICD phenotype.
Application in High-Content Screening for Novel ICD Inducers
Immunogenic cell death (ICD) represents a functionally unique form of regulated cell death that activates adaptive immune responses against tumor antigens. This process is critically dependent on the spatiotemporal emission of damage-associated molecular patterns (DAMPs), which include surface-exposed calreticulin (CALR), secreted ATP, and released high mobility group box 1 (HMGB1) [16]. The discovery of novel ICD inducers requires sophisticated screening systems capable of quantitatively assessing these DAMP signals alongside morphological changes in dying cells [43]. High-content screening (HCS) platforms have emerged as powerful tools for this purpose, combining automated microscopy with multi-parametric imaging to provide quantitative data about cell populations undergoing ICD [44] [45]. This application note details established methodologies and protocols for identifying and validating novel ICD inducers through high-content analysis, with particular emphasis on calreticulin exposure and caspase activation within the broader context of immunogenic cell death research.
High-Content Screening Platforms for ICD Discovery
Platform Selection and Configuration
Modern HCS platforms for ICD discovery integrate automated microscopy, environmental control, and advanced image analysis capabilities. The Operetta HCS system and Thermo Scientific ArrayScan XTI HCA Reader have been successfully employed for dynamic, multi-parameter analysis of cellular phenotypes during cell death [45] [44]. These systems should be configured with:
- Environmental control for time-course experiments maintaining 37°C and 5% CO₂
- High-resolution cameras (≥ 2 megapixels) for capturing subtle morphological changes
- Multiple laser lines (405, 488, 561, and 640 nm) for flexibility in fluorophore selection
- Automated liquid handling compatibility for 96, 384, or 1536-well plates
Artificial Intelligence-Enhanced Image Analysis
Recent advances incorporate artificial intelligence (AI) for real-time image analysis of ICD morphologies. Kim et al. (2025) developed an AI-based detector that identifies typical morphologies of dying cells undergoing ICD by applying transfer learning from fluorescent markers and fine-tuning the model using differential interference contrast (DIC) images [43]. This approach enables:
- Model-assisted labeling (MAL) to reduce manual annotation requirements
- Identification of subtle morphological differences difficult to discern through manual analysis
- Blind validation of potential ICD inducers through cell death type analysis, DAMP release, and immune activation assays
Table 1: Quantitative Parameters for ICD Assessment in High-Content Screening
| Parameter Category | Specific Measurable Parameters | Detection Method | Significance for ICD |
|---|---|---|---|
| Cell Viability | Live cell count, Death rate, Birth rate | Nuclear segmentation with dead cell stain | Distinguishes cytotoxic vs. cytostatic responses [45] |
| Morphological Changes | Cell swelling, Membrane rupture, Nuclear size | Brightfield and DIC imaging | Characteristic of ICD progression [43] |
| CALR Exposure | Surface CALR intensity, Percentage CALR-positive cells | Immunofluorescence with anti-CALR antibody | "Eat me" signal for phagocyte recruitment [16] |
| Caspase Activation | Cleaved caspase-8, -3, or -9 intensity | Fluorescent caspase substrates or antibodies | Indicates apoptosis induction and ICD-related signaling [16] |
| Other DAMPs | ATP release, HMGB1 translocation, ANXA1 exposure | Luminescent assays, immunofluorescence | Critical adjuvanticity signals for immune activation [12] [16] |
Experimental Protocols for ICD Detection
Multiplexed High-Content Assay for ICD Markers
Purpose: To simultaneously quantify CALR exposure, caspase activation, and morphological changes in candidate ICD inducer-treated cells.
Materials:
- Cell lines: T24 human bladder carcinoma or CT26 mouse colon carcinoma cells [17]
- Key reagents:
- Anti-calreticulin antibody (Abcam ab2907)
- FLICA caspase-8 or caspase-3/7 assay kit
- CellMask Deep Red plasma membrane stain
- Hoechst 33342 nuclear stain
- DRAQ7 dead cell stain
- Equipment: HCS platform with environmental control and 20x/40x objectives
Procedure:
- Cell seeding: Plate cells in 96-well or 384-well imaging plates at 5,000-10,000 cells/well and incubate for 24 hours.
- Compound treatment: Add candidate ICD inducers at optimized concentrations with appropriate controls (untreated, anthracyclines as positive controls).
- Staining: At predetermined timepoints (typically 12-24 hours post-treatment):
- Add FLICA caspase reagent diluted 1:150 in culture medium, incubate 1 hour at 37°C
- Add CellMask Deep Red (1:1000) and Hoechst 33342 (1:2000) for 30 minutes
- Fix cells with 4% paraformaldehyde for 15 minutes at room temperature
- Permeabilize with 0.1% Triton X-100 for 10 minutes
- Block with 5% BSA for 1 hour
- Incubate with anti-calreticulin primary antibody (1:500) overnight at 4°C
- Incubate with Alexa Fluor 488-conjugated secondary antibody (1:1000) for 1 hour
- Image acquisition: Acquire images using 20x or 40x objectives across 5-10 fields per well with appropriate filter sets:
- Hoechst 33342: Ex 350 nm, Em 461 nm (nuclear segmentation)
- Alexa Fluor 488: Ex 488 nm, Em 525 nm (CALR detection)
- FLICA: Ex 560 nm, Em 620 nm (caspase activity)
- CellMask Deep Red: Ex 650 nm, Em 668 nm (cell boundary)
- Image analysis:
- Segment cells based on nuclear and cytoplasmic staining
- Quantify CALR mean fluorescence intensity at plasma membrane region
- Calculate percentage of caspase-positive cells
- Measure morphological parameters (cell size, roundness, membrane integrity)
AI-Assisted Real-Time ICD Screening Protocol
Purpose: To implement an AI-based high-throughput screening system for identifying ICD inducers through real-time image analysis [43].
Materials:
- Cell lines: Appropriate cancer cell lines for screening
- Equipment: HCS platform with DIC capabilities and AI integration
- Software: Custom AI detector trained on ICD morphologies
Procedure:
- Model training:
- Apply transfer learning from fluorescent markers to DIC images
- Fine-tune the model using annotated DIC images of cells undergoing ICD
- Implement model-assisted labeling to reduce manual annotation requirements
- Screening execution:
- Plate cells in 384-well plates and treat with candidate compounds
- Acquire time-lapse DIC images every 30 minutes for 24-48 hours
- Apply AI-based detector to identify cells with ICD morphologies in real-time
- Calculate ICD score based on percentage of cells with characteristic morphologies
- Validation:
- Confirm AI-identified hits through orthogonal DAMP measurement assays
- Assess immune activation through DC maturation and phagocytosis assays
Signaling Pathways in Immunogenic Cell Death
The molecular pathways governing ICD involve interconnected stress response systems that lead to the emission of DAMPs. The following diagrams illustrate key signaling cascades relevant to high-content screening readouts.
Diagram Title: ICD Signaling Pathway with CALR Exposure
Diagram Title: High-Content Screening Workflow for ICD Inducers
Research Reagent Solutions for ICD Screening
Table 2: Essential Research Reagents for ICD Detection Assays
| Reagent Category | Specific Products | Application in ICD Screening | Detection Method |
|---|---|---|---|
| Cell Viability Stains | DRAQ7, TO-PRO-3, Propidium Iodide | Distinguishing live/dead cells, calculating death rates [45] | Far-red fluorescence |
| Nuclear Stains | Hoechst 33342, HCS NuclearMask Blue Stain, DAPI | Nuclear segmentation, cell counting, cell cycle analysis [44] | Blue fluorescence |
| Caspase Detection | FLICA caspase assays, Click-iT TUNEL assay, cleaved caspase antibodies | Apoptosis verification, caspase-8 activation measurement [16] | Green/red fluorescence |
| CALR Detection | Anti-calreticulin antibodies, CALR-GFP constructs | Surface CALR exposure quantification [17] [16] | Immunofluorescence |
| Cell Morphology Stains | CellMask stains, Phalloidin conjugates, CellTracker dyes | Cell boundary identification, morphological analysis [44] | Multiple channels |
| Other DAMP Detection | Anti-HMGB1 antibodies, ANXA1 detection reagents, ATP luminescence kits | Additional ICD marker verification [12] [16] | Luminescence/fluorescence |
Data Analysis and Interpretation
Multiparametric Scoring System for ICD Potential
A robust scoring system should integrate multiple parameters to assess ICD potential:
ICD Score = (CALR Exposure Index × 0.4) + (Caspase Activation Index × 0.3) + (Morphological Change Index × 0.2) + (Cell Death Rate × 0.1)
Where each parameter is normalized to positive controls (e.g., anthracyclines).
Distinguishing Cytotoxic vs. Cytostatic Responses
High-content screening enables differentiation between cytotoxic and cytostatic responses by simultaneously tracking birth and death rates [45]. This distinction is critical for predicting therapeutic potential:
- Cytotoxic response: Increased death rate with minimal effect on birth rate
- Cytostatic response: Decreased birth rate with minimal effect on death rate
Validation Approaches
Putative ICD inducers identified through HCS require validation through:
- DAMP secretion profiling: Quantifying ATP release, HMGB1 translocation, and ANXA1 exposure
- Phagocytosis assays: Measuring uptake of treated cells by dendritic cells
- DC maturation assays: Assessing CD80, CD83, CD86, and MHC-II upregulation
- In vivo immunization models: Testing protective antitumor immunity [17]
High-content screening provides a powerful platform for identifying novel ICD inducers through multiparametric analysis of cell death phenotypes, DAMP exposure, and signaling pathway activation. The integration of AI-assisted image analysis with traditional fluorescence-based detection methods enables robust, high-throughput screening that captures the complexity of ICD. These protocols offer a standardized approach for researchers investigating calreticulin exposure, caspase activation, and other critical components of immunogenic cell death for cancer therapy development.
Navigating Complexities: Overcoming Variable ICD Responses and Soluble CALR Immunosuppression
Addressing Heterogeneity in DAMP Emission Across Cell Lines and Inducers
The efficacy of immunogenic cell death (ICD) in stimulating antitumor immunity is critically dependent on the spatiotemporally defined emission of damage-associated molecular patterns (DAMPs) [16]. However, a significant challenge in both basic and translational ICD research is the substantial heterogeneity in DAMP emission profiles across different cancer cell lines and in response to various ICD inducers [46] [16]. This variability can lead to inconsistent experimental outcomes and difficulties in predicting therapeutic responses. This application note provides standardized protocols and analytical frameworks to systematically address this heterogeneity, with a specific focus on calreticulin (CRT) exposure and its associated caspase activation pathways, enabling more reproducible and predictive assessment of ICD in preclinical models.
Core Signaling Pathways and Molecular Mechanisms
The exposure of calreticulin (CRT) on the cell surface is a pivotal "eat-me" signal that facilitates the phagocytosis of dying cancer cells by antigen-presenting cells and is considered a hallmark of ICD [47] [16]. The molecular pathway leading to pre-apoptotic CRT exposure involves a well-defined sequence of endoplasmic reticulum (ER) stress responses and caspase activation [30].
CRT Exposure Signaling Pathway
The following diagram illustrates the core molecular pathway leading to immunogenic calreticulin exposure, integrating key steps from ER stress to surface translocation.
Diagram 1: The core pathway for pre-apoptotic calreticulin exposure. Immunogenic cell death inducers trigger endoplasmic reticulum stress, leading to PERK-mediated eIF2α phosphorylation and partial caspase-8 activation. This culminates in the exocytosis of the CRT/ERp57 complex to the cell surface, a key "eat-me" signal for dendritic cells [30].
Experimental Workflow for ICD Heterogeneity Assessment
A standardized workflow is essential for systematic evaluation of DAMP emission heterogeneity. The following diagram outlines a comprehensive experimental approach.
Diagram 2: A comprehensive workflow for assessing heterogeneity in DAMP emission. This multi-step approach spans from in vitro screening to in vivo validation, enabling systematic characterization of variable ICD responses across different experimental conditions.
Quantitative Profiling of DAMP Heterogeneity
Heterogeneity in DAMP Emission Across Cell Lines and Inducers
Table 1: Comparative DAMP emission profiles across different cancer cell lines and ICD inducers. This table summarizes documented heterogeneity in key DAMPs based on treatment and cell type.
| ICD Inducer | Inducer Type | Cell Line/Type | CRT Exposure | HMGB1 Release | ATP Secretion | Key Stress Pathways Activated | References |
|---|---|---|---|---|---|---|---|
| Oxaliplatin | Type I ICD inducer | CT26 colon cancer | Strong | Documented | Documented | ER stress, ROS, Caspase-8 | [30] [47] |
| Doxorubicin | Type I ICD inducer | 4T1 mammary carcinoma | Strong | Documented | Documented | ER stress, ROS, Autophagy | [48] [46] |
| Mitoxantrone | Type I ICD inducer | MCA205 fibrosarcoma | Strong | Documented | Documented | ER stress, ROS | [48] [30] |
| PT-112 | ICD inducer | Prostate cancer cell lines | Documented | Not specified | Not specified | Mitochondrial stress, Ribosome biogenesis inhibition | [49] |
| Cisplatin | Controversial ICD | Various (context-dependent) | Variable/Weak | Variable | Variable | DNA damage (ER stress weak) | [47] [46] |
| γ-Irradiation | Physical inducer | Multiple solid tumors | Documented | Documented | Documented | DNA damage, ER stress | [48] [16] |
Quantification Methods for Core ICD Biomarkers
Table 2: Standardized methodologies for detection and quantification of key ICD biomarkers, accounting for technical variability.
| DAMP / Marker | Detection Method | Detailed Protocol Summary | Critical Validation Steps | Potential Sources of Heterogeneity |
|---|---|---|---|---|
| Surface Calreticulin (Ecto-CRT) | Flow Cytometry (Non-permeabilized cells) | 1. Harvest cells 4-8h post-treatment2. Stain with anti-CRT antibody (without permeabilization)3. Analyze by flow cytometry; isotype control essential | - Compare with known ICD inducer (e.g., mitoxantrone)- Verify with CRISPR/Cas9 knockout or blocking antibodies | - Timing of analysis post-treatment- Cell surface integrity- Antibody specificity and affinity |
| Caspase-8 Activation | Western Blot / Flow Cytometry (with cleaved caspase-8 antibody) | 1. Lyse cells 4-24h post-treatment2. Western blot for pro-caspase-8 and cleaved fragments OR3. Intracellular flow cytometry with fixation/permeabilization | - Use broad-spectrum caspase inhibitor (Z-VAD-fmk) as negative control- Correlate with downstream BAP31 cleavage | - Partial vs. full activation levels- Temporal dynamics of activation |
| HMGB1 Release | ELISA (Cell culture supernatant) | 1. Collect supernatant 24-48h post-treatment2. Use commercial HMGB1 ELISA kit3. Normalize to cell number or viability | - Confirm loss of nuclear HMGB1 by immunofluorescence- Use TLR4 signaling assays in DCs as functional readout | - Timing of release relative to plasma membrane permeabilization- Potential binding to other serum factors |
| ATP Secretion | Luminescence Assay (e.g., Luciferase-based) | 1. Collect supernatant 6-12h post-treatment2. Use commercial ATP determination kit3. Measure luminescence immediately | - Establish standard curve for quantification- Correlate with phagocytosis assays | - Rapid degradation by ecto-ATPases- Critical dependence on early time points |
| ER Stress / eIF2α Phosphorylation | Western Blot (p-eIF2α Ser51) | 1. Harvest cells 2-8h post-treatment2. Probe with phospho-specific eIF2α antibody3. Normalize to total eIF2α | - Use ER stress inducers (thapsigargin) as positive control- Compare with eIF2α S51A mutant cells | - Transient nature of phosphorylation- Threshold levels required for ICD |
Detailed Experimental Protocols
Protocol: Simultaneous Detection of CRT Exposure and Caspase Activation
Principle: This protocol enables correlative analysis of pre-apoptotic CRT exposure and early caspase-8 activation in the same cell population, addressing temporal heterogeneity in DAMP emission.
Materials:
- Cells of interest (minimum 3 different lines recommended for heterogeneity assessment)
- Validated ICD inducer (e.g., oxaliplatin, mitoxantrone) and non-ICD control (e.g., cisplatin at low doses)
- Anti-CRT antibody for surface staining (e.g., ab2907, Abcam)
- Anti-cleaved caspase-8 antibody for intracellular staining
- Flow cytometry buffer (PBS + 2% FBS + 0.09% sodium azide)
- Fixation/Permeabilization solution kit (e.g., BD Cytofix/Cytoperm)
- Flow cytometer with minimum 488nm and 633nm lasers
Procedure:
- Cell Treatment and Harvest:
- Seed cells at 70% confluence and treat with ICD inducers for 4-8 hours.
- Include viability controls (untreated) and death controls (high-dose staurosporine).
- Harvest cells using gentle enzymatic dissociation (e.g., Accutase) to preserve surface epitopes.
Surface CRT Staining:
- Aliquot 1×10^6 cells per condition into flow tubes.
- Wash with ice-cold flow cytometry buffer.
- Incubate with anti-CRT antibody (1:100) or isotype control for 30 minutes at 4°C in the dark.
- Wash twice with flow cytometry buffer.
Intracellular Caspase-8 Staining:
- Fix and permeabilize cells using commercial fixation/permeabilization kit according to manufacturer's instructions.
- Incubate with anti-cleaved caspase-8 antibody (1:50) for 30 minutes at 4°C in the dark.
- Wash twice with permeabilization buffer.
Analysis:
- Resuspend cells in flow cytometry buffer and analyze immediately.
- Use sequential gating: single cells → viability dye-negative → CRT-positive → caspase-8-positive.
- Collect minimum 10,000 events per sample.
Troubleshooting:
- Low CRT signal: Optimize treatment duration; ensure no permeabilization before surface staining.
- High background caspase activation: Include caspase inhibitor control (Z-VAD-fmk, 20μM).
- Cell aggregation: Filter cells through 35μm mesh before analysis.
Protocol: Functional Validation of ICD Heterogeneity Using Dendritic Cell Phagocytosis
Principle: This functional assay validates the immunological consequence of heterogeneous CRT exposure by measuring differential phagocytosis by dendritic cells.
Materials:
- Cancer cell lines with documented differential CRT exposure (from Protocol 4.1)
- Immature dendritic cells (e.g., monocyte-derived DCs or DC cell lines)
- CellTracker dyes (e.g., CMFDA for cancer cells, CMTMR for DCs)
- Flow cytometry or confocal microscopy setup
- Transwell plates (for some experimental variations)
Procedure:
- Labeling:
- Label cancer cells with CMFDA (5μM, 20 minutes) after ICD inducer treatment.
- Label DCs with CMTMR (5μM, 20 minutes).
- Wash both cell types extensively.
Co-culture:
- Mix cancer cells and DCs at 1:5 ratio (cancer:DC) in 96-well U-bottom plates.
- Co-culture for 2-4 hours at 37°C.
Phagocytosis Quantification:
- Gently wash to remove non-phagocytosed cells.
- Analyze by flow cytometry: quantify percentage of DCs (CMTMR+) that are double-positive for CMFDA.
- Alternatively, fix cells and analyze by confocal microscopy for visual confirmation.
Inhibition Controls:
- Include blocking controls with anti-CRT antibody (10μg/mL) during co-culture.
- Use CRT-knockdown cells as negative control.
The Scientist's Toolkit: Essential Research Reagents
Table 3: Key research reagents and their applications in studying ICD heterogeneity.
| Reagent/Category | Specific Examples | Function in ICD Research | Considerations for Heterogeneity Studies |
|---|---|---|---|
| Validated ICD Inducers (Positive Controls) | Oxaliplatin, Mitoxantrone, Doxorubicin | Induce robust DAMP emission; serve as benchmark comparators | Use multiple inducers to cover different mechanisms (Type I vs. II) |
| Non-ICD Cell Death Inducers (Negative Controls) | Cisplatin (low dose), UV-C (low dose) | Control for non-immunogenic cell death | Confirm lack of DAMP emission in specific cell line used |
| CRT Detection Antibodies | Anti-CALR ab2907 (Abcam), FMC-75 (Enzo) | Detect surface-exposed calreticulin | Validate surface-specific binding without permeabilization |
| Caspase Activity Probes | FLICA Caspase-8 Assay Kit, Anti-cleaved caspase-8 antibodies | Detect early caspase-8 activation | Distinguish partial activation (ICD) from full execution |
| ER Stress Inhibitors | GSK2606414 (PERK inhibitor), Salubrinal (eIF2α phosphatase inhibitor) | Modulate ER stress pathway | Confirm pathway specificity in cell line of interest |
| Genetic Manipulation Tools | siRNA against PERK, CALR, Caspase-8; CRISPR/Cas9 knockout cells | Establish pathway necessity | Account for variable knockdown/knockout efficiency across lines |
| Tumor-on-Chip Models | DMG-on-Chip (for glioblastoma) | Model tumor microenvironmental gradients | Incorporate hypoxia and ECM for physiological relevance [50] |
Data Interpretation and Heterogeneity Management
When addressing heterogeneity in DAMP emission, consider these critical factors:
Cell-Intrinsic Factors: Genetic background, origin tissue, basal stress levels, and expression of ICD pathway components (PERK, caspase-8, BAP31) significantly influence DAMP emission capacity [30] [16].
Inducer-Specific Mechanisms: Type I inducers (e.g., oxaliplatin, doxorubicin) cause ER stress indirectly, while Type II inducers directly target the ER, potentially leading to different DAMP emission kinetics and magnitudes [48] [47].
Microenvironmental Context: Oxygen tension, nutrient availability, and extracellular matrix composition can dramatically modulate ICD responses. Advanced models like tumor-on-chip systems can help capture this complexity [50].
Validation Hierarchy: Always correlate in vitro DAMP measurements with functional immune assays (DC phagocytosis, T-cell activation) and, when possible, in vivo protective vaccination models, which represent the gold standard for validating bona fide ICD [48] [16].
Standardized implementation of these protocols and consideration of these factors will enhance reproducibility and enable more accurate prediction of therapeutic ICD in both preclinical and clinical settings.
Calreticulin (CALR) is a multifaceted protein with dichotomous roles in cellular immunity and oncogenesis. In healthy cells, CALR primarily functions as an endoplasmic reticulum (ER) chaperone but can be translocated to the cell surface during immunogenic cell death (ICD), where it acts as a potent "eat-me" signal to phagocytic cells such as dendritic cells [16]. This surface exposure is a critical damage-associated molecular pattern (DAMP) that facilitates the engulfment of dying cells, cross-presentation of tumor antigens, and the initiation of adaptive antitumor immunity [13] [16]. The exposure process is tightly regulated, involving eIF2α phosphorylation, activation of caspase 8, and vesicle-mediated transport [16].
However, a decade of research has revealed a pathogenic role for mutant CALR in myeloproliferative neoplasms (MPNs), where frameshift mutations create a novel C-terminal tail [51] [52]. Recent evidence indicates that this mutant CALR is not only membrane-bound but can also exist in a soluble form (smCALR) in the plasma of MPN patients [51]. This application note explores the hypothesis that smCALR acts as an immunosuppressive decoy, subverting the normal, immunostimulatory pathways of CALR and posing a significant challenge to therapeutic interventions.
The Biological Duality of CALR: From Immunogenic Signal to Immunosuppressive Decoy
Normal CALR Function in Immunogenic Cell Death
Under physiological stress induced by certain chemotherapeutics, radiation, or photodynamic therapy, cancer cells can undergo ICD. A hallmark of this process is the pre-apoptotic translocation of CALR from the ER to the cell surface [16]. Surface-exposed CALR (ecto-CALR) binds to Low-Density Lipoprotein Receptor-Related Protein 1 (LRP1 or CD91) on antigen-presenting cells (APCs) [53] [16]. This binding initiates a phagocytic cascade, leading to the clearance of dying cells and the presentation of tumor-associated antigens to T cells, thereby stimulating a potent antitumor immune response [53] [16]. The detection of ecto-CALR is, therefore, a reliable biomarker for functional ICD and is often assessed alongside other DAMPs like ATP and HMGB1 [54].
The Emergence of Soluble Mutant CALR as a Pathological Decoy
In CALR-mutated MPNs, the frameshift mutations (e.g., a 52-bp deletion, CALRdel52) result in the loss of the ER-retention KDEL signal and the generation of a novel, positively charged C-terminal tail [51] [52] [55]. This mutant CALR aberrantly binds to and activates the thrombopoietin receptor (MPL), driving constitutive JAK/STAT signaling and cellular proliferation [52] [55]. Crucially, mutant CALR has been detected in a soluble form in patient plasma [51].
Research by Pecquet et al. (cited in [51]) demonstrated that the prolonged half-life of smCALR results from its stable complex formation with soluble Transferrin Receptor 1 (sTFR1). Functionally, smCALR can bind to MPL on the surface of megakaryocyte progenitor cells, promoting ligand-independent proliferation [51]. This discovery suggests a parallel decoy function: by circulating freely, smCALR may also engage the CALR receptor LRP1 on phagocytes, potentially blocking the recognition of immunogenic, CALR-exposing cancer cells and thereby inhibiting antitumor immunity.
Table 1: Key Characteristics of Immunogenic and Immunosuppressive CALR
| Feature | Immunogenic CALR (Ecto-CALR) | Immunosuppressive CALR (smCALR) |
|---|---|---|
| Cellular Location | Cell surface of stressed/dying cells [16] | Soluble in plasma/ extracellular fluid [51] |
| Molecular Form | Wild-type protein [16] | Mutant protein with novel C-terminus [51] [52] |
| Primary Receptor | LRP1 (CD91) on phagocytes [53] [16] | MPL on hematopoietic cells; potentially LRP1 [51] |
| Biological Outcome | Phagocytosis, antigen cross-presentation, T-cell activation [16] | Ligand-independent MPL activation; potential blockade of LRP1-mediated phagocytosis [51] |
| Therapeutic Implication | A positive prognostic marker; a goal for ICD inducers [16] [54] | A target for neutralization; a mechanism of immune evasion [51] |
Experimental Protocols for Investigating Soluble CALR
Protocol: Detection and Quantification of Soluble Mutant CALR
This protocol outlines the method for detecting smCALR in cell culture supernatant or patient plasma, based on the findings of Pecquet et al. [51].
Key Materials:
- Antibody: Anti-mutant CALR monoclonal antibody (e.g., B3, 4D7, or INCA033989) [51] [52]
- Assay Platform: ELISA plate reader
Procedure:
- Sample Collection: Collect blood plasma from MPN patients or culture supernatant from CALR-mutant cell lines (e.g., UT-7/MPL). Use centrifugation to remove cells and debris.
- Immunoprecipitation: Pre-clear the sample using protein A/G beads. Incubate the sample with an anti-mutant CALR antibody (e.g., 4D7) conjugated to beads overnight at 4°C to capture smCALR and its complexes [51].
- Complex Analysis: Elute the bound proteins and analyze via Western blot under non-reducing conditions.
- Detection: Probe the membrane with an antibody against sTFR1 to confirm the presence of the smCALR-sTFR1 complex [51].
- Quantification: For direct quantification, develop a mutant CALR-specific sandwich ELISA using two distinct monoclonal antibodies targeting different epitopes on the mutant C-terminus.
Protocol: Functional Assay for smCALR-Mediated Immune Suppression
This protocol assesses the potential of smCALR to inhibit the phagocytosis of CALR-exposing target cells.
Key Materials:
- Phagocytes: Bone marrow-derived dendritic cells (BMDCs) or macrophages
- Target Cells: Cancer cell line inducible for ICD (e.g., treated with oxaliplatin or carfilzomib) [13] [16] [54]
- Recombinant Protein: Purified recombinant mutant CALR protein [55]
Procedure:
- Induce ICD: Treat target cells with a known ICD inducer (e.g., 10 µM oxaliplatin for 24 hours) to stimulate CALR surface exposure. Validate exposure using flow cytometry [54].
- Label Cells: Label ICD-induced target cells with a fluorescent dye (e.g., CFSE).
- Co-culture Setup: Co-culture labeled target cells with phagocytes (e.g., BMDCs) at a 10:1 ratio.
- Experimental Group: Add purified smCALR (e.g., 100 nM) to the culture medium.
- Control Groups: Include a no-smCALR control and a group with a neutralizing anti-mutant CALR antibody.
- Incubate: Incubate for 4-6 hours.
- Flow Cytometry Analysis: Analyze phagocytes by flow cytometry to determine the percentage of CFSE-positive cells, indicating phagocytosis of target cells.
- Expected Outcome: A significant reduction in phagocytosis in the smCALR-treated group would support its role as an immunosuppressive decoy.
Visualizing the Signaling Pathways and Experimental Workflows
Signaling Pathway Diagram: CALR's Dual Role in Immunity and Cancer
Experimental Workflow Diagram: Assessing the smCALR Decoy Mechanism
Quantitative Data and Research Reagent Solutions
Table 2: Key Quantitative Data on Mutant CALR
| Parameter | Value / Finding | Experimental Context | Source |
|---|---|---|---|
| Affinity for Mature TpoR ECD | Kd ~104 nM | Measured via Microscale Thermophoresis | [55] |
| Complex Formation | smCALR-sTFR1 stable complex | Identified in patient plasma; prolongs smCALR half-life | [51] |
| α-Helical Content in C-terminus | CALRdel52: 8.4% | FTIR Spectroscopy; concentrated in proximal segment | [55] |
| Clinical Response to mAb | Hematologic & molecular responses | Early-phase trials with INCA033989 | [51] |
| Caspase Dependence of ICD | HMGB1 release suppressed by zVAD-FMK | Observed in human cancer cell lines post-IR+ATRi | [54] |
The Scientist's Toolkit: Key Research Reagent Solutions
Table 3: Essential Research Tools for CALR Investigation
| Reagent / Tool | Function / Specificity | Key Application |
|---|---|---|
| Anti-Mutant CALR mAbs (e.g., 4D7, B3, INCA033989) | Binds specifically to the novel C-terminus of mutant CALR [51] [52] | Detection of smCALR (ELISA), immunoprecipitation, and potential therapeutic neutralization. |
| Recombinant Mutant CALR Protein (e.g., CALRdel52) | Recombinantly produced mutant protein for structural and functional studies [55] | In vitro binding assays (MST, HDx-MS), functional studies in phagocytosis assays. |
| Caspase-3/7 Reporter System (ZipGFP-DEVD) | Fluorescent biosensor activated upon cleavage by executioner caspases [13] | Real-time, single-cell tracking of apoptotic caspase activation in ICD models. |
| Pan-Caspase Inhibitor (zVAD-FMK) | Irreversible inhibitor of a broad range of caspases [13] [54] | Determining the caspase-dependence of DAMP emission (e.g., HMGB1, ATP) in ICD. |
| LRP1 (CD91) Blocking Antibody | Inhibits the interaction between surface CALR and its receptor on phagocytes [53] [16] | Validation of CALR-LRP1 as a critical phagocytic pathway in functional assays. |
The discovery of soluble mutant CALR introduces a sophisticated immune evasion mechanism into the already complex biology of CALR. It repurposes a key "eat-me" signal into a potential molecular decoy, which may shield malignant cells from immune surveillance by competing for phagocytic receptors. This mechanism has profound implications for developing immunotherapies for CALR-mutant MPNs and beyond. Promisingly, several monoclonal antibodies (e.g., INCA033989) targeting the mutant CALR neoepitope have shown encouraging hematologic and molecular responses in early clinical trials [51]. Future work must focus on determining whether these therapies can effectively neutralize the soluble decoy pool in addition to targeting membrane-bound mutant CALR, thereby fully restoring immunosurveillance and achieving durable clinical remissions.
Optimizing Combination Therapies to Enhance Caspase-Dependent ICD
Immunogenic cell death (ICD) represents a functionally specialized form of regulated cell death that, when occurring in immunocompetent hosts, activates an adaptive immune response against dead cell-associated antigens [56]. While ICD often manifests with apoptotic morphological features, its immunogenic properties depend on the spatiotemporally defined emission of damage-associated molecular patterns (DAMPs) that engage with immune cells [56]. The exposure of calreticulin (CRT) on the outer surface of the plasma membrane stands as a crucial DAMP that acts as an "eat me" signal, promoting the phagocytosis of dying cells by antigen-presenting cells and initiating adaptive immune responses [13] [17]. Caspase activation, particularly of executioner caspases-3 and -7, plays a central role in coordinating the biochemical events that lead to ICD, though the relationship between caspase activation and immunogenicity is complex and context-dependent [13] [57].
The molecular circuitry of ICD involves a carefully orchestrated sequence of cellular events. Surface-exposed calreticulin and secreted ATP function as crucial DAMPs for immunogenic apoptosis [17]. According to established models, ICD relies on the establishment of adaptive stress responses that promote the coordinated emission of these danger signals from dying cells [56]. In the context of anthracycline-induced ICD, calreticulin exposure obligatorily relies on the establishment of a pre-mortem endoplasmic reticulum (ER) stress response centered around the phosphorylation of eukaryotic translation initiation factor 2A (EIF2A) [56]. The molecular pathways governing surface exposure of CRT have been delineated to some extent, with ER stress and reactive oxygen species (ROS) production identified as mandatory components [17].
Molecular Mechanisms and Key Pathways
Caspase Functions in Cell Death Pathways
Caspases are evolutionarily conserved cysteine proteases that cleave their substrates at specific aspartic acid residues, playing a central role in programmed cell death (PCD) [32]. These enzymes serve as molecular gatekeepers of PCD, ensuring precise execution of these pathways across apoptosis, pyroptosis, and necroptosis mechanisms [32]. Caspases are historically categorized into distinct sub-families based on gene duplication, structure, substrate specificity, and functionality. Based on substrate sequence specificity, caspases divide into group I (caspase-1, -4, -14: preference of (W/L/Y)EHD), group II (caspase-2, -3, -7: preference of DEXD), and group III (caspase-6, -8, -9, -10: preference of (L/V/I)EXD) [5].
Table 1: Caspase Classification and Substrate Preferences
| Caspase | Primary Function | Preferred Cleavage Motif | Role in ICD |
|---|---|---|---|
| Caspase-3 | Executioner apoptosis | DEVD | Cleaves multiple substrates; may promote or inhibit immunogenicity |
| Caspase-7 | Executioner apoptosis | DEVD | Executes apoptosis; suppresses pyroptosis via GSDMD cleavage |
| Caspase-8 | Initiator apoptosis | LETD | Molecular switch between apoptosis, necroptosis, and pyroptosis |
| Caspase-1 | Inflammatory pyroptosis | WEHD | Activates IL-1β, IL-18; cleaves GSDMD |
| Caspase-4/5/11 | Non-canonical pyroptosis | LEVD/WEHD-like | Cleaves GSDMD; triggers pyroptosis |
The activation of executioner caspases-3 and -7 triggers the systematic cleavage of structural and regulatory proteins, culminating in the organized dismantling of the dying cell [13]. While apoptosis has historically been viewed as immunologically silent, it is now recognized that certain forms of cell death can acquire immunogenic features, bridging innate and adaptive immune responses [13]. Caspase-8 plays a particularly central role as a molecular switch among apoptosis, necroptosis, and pyroptosis [32]. When caspase-8 is inhibited, cells may undergo necroptosis instead of apoptosis, highlighting the complex interplay between different cell death modalities [5].
Calreticulin Exposure Pathways
The translocation of calreticulin to the cell surface represents a critical checkpoint in ICD. This process occurs through a specialized pathway that integrates stress signals from multiple cellular compartments. Research has identified that chemokines, in particular human CXCL8 (interleukin-8) and its mouse ortholog Cxcl2, are involved in the immunogenic translocation of CRT to the outer leaflet of the plasma membrane [20]. The knockdown of CXCL8/Cxcl2 receptors reduces chemotherapy-induced CRT exposure, as well as the capacity of dying cells to elicit an anticancer immune response in vivo [20].
The canonical pathway for CRT exposure involves endoplasmic reticulum stress and the PERK signaling axis. However, alternative pathways exist, as demonstrated by the schweinfurthin compound, 5'-methoxyschweinfurthin G (MeSG), which induces significant cell surface calreticulin exposure without causing ER stress and without requiring PERK activation [57]. This CRT exposure also differs from the canonical pathway in that it does not require caspase activation and proceeds independently of ERp57 exposure [57]. This highlights the existence of multiple molecular routes to achieve surface CRT presentation.
Figure 1: Calreticulin Exposure Pathways in ICD. Multiple molecular pathways can lead to surface exposure of calreticulin, including ER stress-dependent routes, chemokine-mediated signaling, and alternative pathways that utilize the secretory machinery independently of traditional stress signals.
Integration of Caspase Activation and DAMP Emission
The immunogenicity of cell death depends on the coordinated emission of multiple DAMPs, including surface calreticulin, secreted ATP, type I interferon production, and HMGB1 release [56]. The sequential and coordinated appearance of these signals determines whether cell death is perceived as immunogenic or tolerogenic by the immune system. Caspase activity intersects with these processes at multiple levels, both promoting and potentially limiting immunogenicity.
Executioner caspases can influence immunogenicity through their cleavage of gasdermin proteins. Caspase-3 cleaves GSDME at the DMPD recognition site to release an N-terminal fragment that triggers inflammatory, lytic cell death [5]. Conversely, caspase-3 and -7 cleave GSDMD at non-canonical sites, preventing its oligomerization and thereby suppressing pyroptosis [32]. This dual capacity highlights how caspases can either enhance or restrict immunogenic outcomes depending on contextual factors and specific substrates involved.
Quantitative Analysis of ICD Inducers
Established ICD Inducers and Their Characteristics
Only a limited number of lethal stimuli are intrinsically endowed with the ability to trigger bona fide ICD [56]. These include certain chemotherapeutic agents used clinically, specific forms of irradiation, photodynamic therapy, and some experimental agents. The potency of these inducers varies significantly, and their efficacy depends on cellular context and the integrity of the required molecular pathways.
Table 2: Established ICD Inducers and Key Characteristics
| ICD Inducer | Class | Primary Molecular Target | Caspase Dependence | CRT Exposure | Clinical Status |
|---|---|---|---|---|---|
| Doxorubicin | Anthracycline | Topoisomerase II, DNA intercalation | Caspase-3/7 dependent [13] | PERK-dependent [17] [56] | Approved, widely used |
| Oxaliplatin | Platinum derivative | DNA cross-linking | Caspase-3/7 dependent [13] | ER stress-dependent [56] | Approved, colorectal cancer |
| Mitoxantrone | Anthracenedione | Topoisomerase II, DNA intercalation | Caspase-3/7 dependent [13] | Chemokine-mediated [20] | Approved, multiple cancers |
| Bortezomib | Proteasome inhibitor | Proteasome | Caspase-3/7 dependent [13] | ER stress-dependent [56] | Approved, multiple myeloma |
| Cyclophosphamide | Alkylating agent | DNA cross-linking | Caspase-3/7 dependent [13] | Not fully characterized | Approved, various cancers |
| Schweinfurthins | Experimental small molecule | Unknown; distinct from ER stress | Caspase-independent [57] | Non-canonical, ER stress-independent [57] | Preclinical investigation |
Quantification Methods for Caspase Activation and ICD
Accurate measurement of caspase activation and DAMP emission is essential for evaluating the immunogenic potential of cell death inducers. Advanced imaging and biochemical techniques enable precise quantification of these events in real-time. Fluorescence resonance energy transfer (FRET) technology has been widely used to study caspase activation in living cells [58]. A novel method to quantitatively obtain FRET efficiency by fitting the emission spectra (FES) of donor-acceptor pairs enables precise monitoring of caspase-3 activation during apoptosis induced by various stimuli [58].
For the detection of ICD-associated DAMPs, flow cytometry remains the gold standard for quantifying surface calreticulin exposure. This approach can be combined with biochemical assays for ATP secretion and HMGB1 release to create a comprehensive profile of immunogenic potential. The development of stable reporter cell systems expressing caspase-3/-7 biosensors alongside constitutive fluorescent markers has significantly advanced our ability to dynamically track apoptotic events and viability loss at single-cell resolution [13].
Experimental Protocols
Protocol 1: Evaluation of Caspase-Dependent ICD In Vitro
This protocol describes a comprehensive approach for assessing the immunogenic potential of cell death inducers in vitro, with particular emphasis on caspase activation and calreticulin exposure.
Materials and Reagents:
- Caspase-3/-7 reporter cell lines (stably expressing ZipGFP-based DEVD biosensor and constitutive mCherry) [13]
- Candidate ICD inducers (e.g., doxorubicin, oxaliplatin, combination agents)
- Pan-caspase inhibitor (zVAD-FMK) [13]
- Flow cytometry buffers and antibodies for surface calreticulin detection
- ATP detection kit (luminescence-based)
- Cell culture reagents and appropriate media
Procedure:
Day 1: Cell Seeding and Treatment
- Seed caspase reporter cells in appropriate multi-well plates (1-2 × 10^5 cells/well for 6-well plates, adjust accordingly for different formats).
- Incubate cells overnight at 37°C, 5% CO₂ to allow adherence and recovery.
Day 2: Drug Treatment and Time-Course Setup
- Prepare fresh dilutions of ICD inducers and combination agents in pre-warmed culture medium.
- For caspase inhibition controls, pre-treat cells with 20-50 µM zVAD-FMK for 1 hour before adding ICD inducers [13].
- Apply treatments to cells in triplicate, including appropriate vehicle controls.
- For time-course experiments, stagger treatment initiation to allow simultaneous processing of all time points.
Day 2-4: Real-Time Imaging and Data Collection
- Place plates in live-cell imaging system (e.g., IncuCyte) with environmental control (37°C, 5% CO₂).
- Acquire images every 2-4 hours using appropriate channels for GFP (caspase activation) and mCherry (cell presence) [13].
- Analyze images using integrated software to quantify fluorescence intensity and cell counts.
Endpoint Analyses (24-48 hours post-treatment)
- Surface Calreticulin Detection:
- Harvest cells using gentle enzymatic dissociation to preserve surface epitopes.
- Stain with anti-calreticulin primary antibody or appropriate isotype control for 30 minutes on ice.
- Wash and incubate with fluorescent secondary antibody if necessary.
- Analyze by flow cytometry, gating on viable (propidium iodide-negative) cells.
Caspase Activation Validation:
- Prepare cell lysates for Western blot analysis of cleaved caspase-3 and PARP.
- Alternatively, use fluorometric caspase activity assays with DEVD-based substrates.
ATP Secretion Measurement:
- Collect conditioned media by centrifugation to remove cells and debris.
- Transfer supernatant to white multi-well plates and add ATP detection reagent.
- Measure luminescence immediately using plate reader.
- Compare to ATP standard curve for quantification.
Data Analysis:
- Normalize caspase activation (GFP fluorescence) to cell presence (mCherry fluorescence).
- Calculate fold induction of surface calreticulin compared to untreated controls.
- Correlate timing and magnitude of caspase activation with DAMP emission profiles.
Protocol 2: High-Content Screening for ICD Potentiators
This protocol enables screening of compound libraries for agents that enhance caspase-dependent ICD when combined with suboptimal doses of known inducers.
Figure 2: High-Content Screening Workflow for ICD Potentiators. Sequential process for identifying compounds that enhance the immunogenic potential of suboptimal ICD inducers through multiparameter analysis of caspase activation and calreticulin exposure.
Materials and Reagents:
- Caspase reporter cells as in Protocol 1
- Low-dose ICD inducer (e.g., 0.1-0.5 × IC₅₀ of doxorubicin or oxaliplatin)
- Compound library for screening
- Automated imaging system or high-content screening platform
- 384-well optical bottom plates
Procedure:
- Seed caspase reporter cells in 384-well plates at optimized density (e.g., 2-5 × 10³ cells/well).
- After cell adherence, treat all wells with low-dose ICD inducer at concentration that yields minimal caspase activation and CRT exposure.
- Add compound library members to appropriate wells using automated liquid handling.
- Include controls on each plate: vehicle only (negative), high-dose ICD inducer (positive), and zVAD-FMK + high-dose ICD inducer (caspase dependence control).
- Incubate plates for 24-48 hours at 37°C, 5% CO₂.
- Acquire automated images using high-content imaging system, capturing GFP (caspase activation), mCherry (cell viability), and far-red channel (CRT staining after immunolabeling).
- Analyze images using integrated algorithms to quantify:
- Percentage of GFP-positive cells (caspase activation)
- Intensity of surface CRT staining
- Cell viability based on mCherry fluorescence and morphological features
- Identify hits as compounds that significantly enhance both caspase activation and CRT exposure compared to low-dose inducer alone.
Protocol 3: Functional Validation of ICD Using Dendritic Cell Activation
This protocol assesses the functional consequences of caspase-dependent ICD by measuring dendritic cell maturation and antigen presentation capacity.
Materials and Reagents:
- Immature dendritic cells (isolated from peripheral blood or differentiated from monocytes)
- Treated tumor cells (from Protocol 1 or 2)
- Flow cytometry antibodies for DC maturation markers (CD80, CD83, CD86, MHC-II)
- ELISA kits for IL-1β, IL-10, and other cytokines
- Transwell plates for phagocytosis assays
Procedure:
- Induce ICD in tumor cells as described in Protocol 1, including appropriate controls.
- Harvest dying tumor cells at peak CRT exposure (typically 12-24 hours post-treatment).
- Co-culture treated tumor cells with immature dendritic cells at optimized ratios (typically 1:1 to 5:1 tumor cell:DC ratio) in 24-well plates.
- After 24-48 hours of co-culture, collect:
- Supernatants for cytokine analysis by ELISA
- Dendritic cells for maturation marker analysis by flow cytometry
- For phagocytosis assays:
- Label tumor cells with CFSE or similar dye before treatment
- Co-culture with DCs for 4-6 hours
- Analyze DCs by flow cytometry to determine percentage that have engulfed labeled tumor cells
- Correlate DC maturation and phagocytosis with caspase activation and CRT exposure metrics from the same tumor cell preparations.
The Scientist's Toolkit: Essential Research Reagents
Table 3: Key Research Reagents for Caspase-Dependent ICD Studies
| Reagent Category | Specific Examples | Function/Application | Key Characteristics |
|---|---|---|---|
| Caspase Reporters | ZipGFP-based DEVD biosensor [13] | Real-time visualization of caspase-3/-7 activity | Split-GFP architecture with minimal background; irreversible signal upon activation |
| SCAT3 (FRET-based caspase-3 sensor) [58] | Quantitative monitoring of caspase-3 activation | ECFP-Venus FRET pair with DEVD cleavage site; decreased FRET upon activation | |
| Caspase Inhibitors | zVAD-FMK [13] | Pan-caspase inhibition control | Confirms caspase dependence of observed phenotypes |
| ICD Inducers | Doxorubicin, Oxaliplatin [56] | Positive controls for ICD induction | Well-characterized inducers with known caspase-dependent mechanisms |
| Schweinfurthin compounds [57] | Non-canonical ICD induction | Induce CRT exposure without ER stress or caspase activation | |
| Detection Antibodies | Anti-calreticulin [57] [17] | Surface CRT quantification by flow cytometry | Critical for measuring key DAMP exposure |
| Anti-cleaved caspase-3 [13] | Caspase activation validation by Western blot | Confirms executioner caspase activation | |
| Detection Kits | ATP luminescence assays [56] | Quantification of ATP secretion | Measures critical "find me" DAMP signal |
| IL-1β/IL-18 ELISA [59] | Inflammatory cytokine measurement | Assesses functional consequences of ICD | |
| Cell Lines | MCF-7 caspase-3 deficient [13] | Caspase specificity studies | Useful for dissecting contributions of caspase-3 vs. caspase-7 |
Combinatorial Strategies to Enhance Caspase-Dependent ICD
Rational Combination Approaches
Most conventional chemotherapeutic agents trigger cell death without robust immunogenic properties, limiting their ability to stimulate durable antitumor immunity. Combinatorial approaches aim to convert otherwise non-immunogenic instances of regulated cell death into bona fide ICD [56]. These strategies typically involve pairing conventional cytotoxics with agents that target specific nodes in the ICD pathway to enhance DAMP emission or overcome resistance mechanisms.
Natural products represent a promising class of ICD potentiators. Numerous natural products have shown great potential for enhancing cancer cell death in response to death receptor agonists like TRAIL [60]. Their mechanisms typically involve modulation of non-apoptotic pathways and/or induction of cell stress pathways that result in amplification of cell death signaling. Specific natural products including wogonin, sulforaphane, and melittin can sensitize resistant cells to TRAIL-mediated death through modulation of NF-κB signaling, while others such as chrysin and bufadienolide inhibit STAT3 phosphorylation [60].
Targeting Immune Checkpoints in Combination with ICD Inducers
The combination of ICD inducers with immune checkpoint blockers represents a particularly promising clinical approach. Accumulating clinical evidence indicates that the (re-)activation of a proficient immune response against malignant cells is associated with improved disease outcome in patients affected by a wide panel of neoplasms [56]. Checkpoint blockers such as anti-CTLA-4 and anti-PD-1/PD-L1 antibodies have demonstrated significant clinical efficacy in multiple cancer types.
When combined with ICD inducers, checkpoint blockers can overcome the immunosuppressive microenvironment that might otherwise limit the antitumor immune response stimulated by immunogenic cell death. This synergistic approach leverages the ability of ICD to generate tumor-specific T cells while using checkpoint inhibition to enhance their effector functions and overcome exhaustion. Preclinical models have demonstrated enhanced antitumor immunity and durable responses with such combinations, providing a strong rationale for clinical translation.
Optimizing combination therapies to enhance caspase-dependent immunogenic cell death represents a promising frontier in cancer therapeutics. The strategic pairing of conventional cytotoxics with ICD-potentiating agents can convert immunologically "cold" cell death into a process that stimulates durable antitumor immunity. Critical to this endeavor is the precise understanding of the molecular circuitry connecting caspase activation to the emission of immunogenic DAMPs like surface calreticulin.
Future directions in this field will likely include the development of more specific biomarkers to identify patients most likely to benefit from ICD-based therapies, the refinement of combination schedules to maximize synergistic interactions, and the discovery of novel targets within the ICD pathway. As our understanding of the complex interplay between different cell death modalities deepens, increasingly sophisticated therapeutic strategies will emerge that harness the immune system through precisely controlled caspase-dependent immunogenic cell death.
Counteracting the Tumor Microenvironment to Maintain Phagocytic Signaling
The tumor microenvironment (TME) employs sophisticated mechanisms to evade immune surveillance, particularly by suppressing phagocytic signaling pathways that enable immune cells to recognize and eliminate cancer cells. Central to this evasion is the disruption of calreticulin (CALR) exposure—a crucial "eat me" signal elicited during immunogenic cell death (ICD). The TME creates an immunosuppressive milieu that inhibits the translocation of CALR to the cell surface, a process dependent on endoplasmic reticulum (ER) stress and caspase activation [61] [30]. This application note details protocols and analytical methods to counteract these inhibitory mechanisms, thereby preserving the phagocytic signals essential for effective anticancer immunity. The strategies outlined herein are designed for researchers and drug development professionals aiming to enhance the immunogenicity of cancer cell death.
Background and Significance
The Phagocytic Signaling Balance in the TME
The ability of phagocytes, such as macrophages and dendritic cells, to engulf cancer cells is governed by a dynamic equilibrium between pro-phagocytic "eat me" signals and anti-phagocytic "don't eat me" signals. The TME frequently tilts this balance in favor of tumor survival by overexpressing "don't eat me" signals like CD47, which engages SIRPα on phagocytes to deliver an inhibitory signal [62]. Concurrently, the TME suppresses critical "eat me" signals, most notably surface-exposed CALR.
CALR exposure is a pre-apoptotic event that occurs in response to specific ICD-inducing stimuli, including certain chemotherapeutic agents like mitoxantrone (MTX) and oxaliplatin (OXP) [61] [30] [12]. This process is not a passive consequence of cell death but an active, multi-step pathway involving:
- ER stress and PERK-mediated phosphorylation of eIF2α
- Caspase-8 activation and cleavage of BAP31
- BAX/BAK conformational activation
- SNARE-dependent exocytosis of CALR-containing vesicles [30]
The immunosuppressive TME disrupts this pathway at multiple nodes, necessitating targeted strategies to maintain its integrity.
Key Pathways Disrupted by the TME
The TME impairs CALR exposure through several mechanisms, including the suppression of ER stress responses, inhibition of caspase activation, and dysregulation of chemokine signaling. For instance, the chemokine CXCL8 (IL-8) and its receptors CXCR1/CXCR2 have been identified as critical positive regulators of MTX-induced CALR exposure [61]. The TME can disrupt this autocrine/paracrine signaling, thereby dampening the immunogenic signal. The following diagram illustrates the core pathway for CALR exposure and its points of vulnerability within the TME.
Experimental Protocols
Protocol 1: Induction and Quantification of CALR Surface Exposure
Objective: To induce immunogenic cell death in cancer cells, counteract TME-mediated suppression, and quantitatively measure calreticulin translocation to the cell surface.
Materials:
- Cancer cell line (e.g., HeLa, CT26, MCA205)
- ICD inducers: Mitoxantrone (MTX, 1-10 µM), Oxaliplatin (OXP, 50-100 µM)
- TME-counteracting agents: Recombinant CXCL8 (50-100 ng/mL), PERK activators (e.g., GSK2606414)
- Flow cytometry buffer (PBS + 1% BSA)
- Anti-CALR primary antibody (non-permeabilizing, surface-reactive)
- Fluorescently-labeled secondary antibody
- Flow cytometer with appropriate lasers and filters
Methodology:
- Cell Culture and Pre-treatment:
- Culture cancer cells to 70-80% confluence in appropriate medium.
- Optional: Pre-treat cells with TME-counteracting agents (e.g., recombinant CXCL8) for 2-4 hours to prime the CALR exposure pathway.
ICD Induction:
- Treat cells with ICD inducers (MTX or OXP at determined optimal concentrations) for 6-24 hours.
- Include negative controls (vehicle-treated) and positive controls (cells treated with known ER stress inducers like thapsigargin).
Surface Staining for CALR:
- Harvest cells gently using non-enzymatic cell dissociation buffer to preserve surface epitopes.
- Wash cells twice with ice-cold flow cytometry buffer.
- Resuspend cell pellet in flow buffer containing anti-CALR primary antibody. Incubate for 1 hour on ice.
- Wash cells twice to remove unbound antibody.
- Resuspend cells in flow buffer containing fluorescent secondary antibody. Incubate for 45 minutes on ice in the dark.
- Wash twice and resuspend in flow buffer for analysis.
Flow Cytometric Analysis:
- Acquire a minimum of 10,000 events per sample on a flow cytometer.
- Gate on live cells based on forward/side scatter properties and viability dye exclusion.
- Quantify the percentage of CALR-positive cells and mean fluorescence intensity (MFI) compared to isotype controls.
Troubleshooting Notes:
- Low Signal: Ensure antibody is specific for surface-exposed CALR; confirm absence of permeabilization.
- High Background: Titrate antibody concentrations; include fluorescence-minus-one (FMO) controls.
- Variable Response: Optimize treatment duration and concentration for each cell line.
Protocol 2: Co-culture Phagocytosis Assay with Macrophages
Objective: To quantitatively assess the functional consequence of CALR exposure by measuring phagocytosis of cancer cells by macrophages in a controlled co-culture system.
Materials:
- Fluorescently-labeled cancer cells (constitutively expressing DsRed or stained with Cell Tracker Red)
- Macrophage cell line (e.g., RAW264.7, THP-1 differentiated with PMA)
- Phagocytosis agonists: Recombinant CALR protein, PEDF (10 nM)
- Co-culture medium (RPMI-1640 serum-free with 1% penicillin/streptomycin)
- Confocal or fluorescence microscope with live-cell imaging capability
- Image analysis software (e.g., ImageJ, Imaris)
Methodology:
- Macrophage Preparation:
- Differentiate THP-1 monocytes into macrophages by treating with 50 nM PMA for 48 hours.
- Alternatively, use RAW264.7 cells ensuring they are in a non-differentiated state before plating.
Cancer Cell Labeling:
- Label cancer cells with fluorescent dye (e.g., Cell Tracker Red CMTPX) according to manufacturer's protocol, or use stable lines expressing DsRed.
- Seed labeled cancer cells (2.5×10⁴ cells) onto coverslips in a 6-well plate and culture for 24 hours.
Co-culture Establishment:
- Gently scrape macrophages and resuspend in serum-free co-culture medium at 3.5-7.5×10⁵ cells/2ml.
- Add macrophage suspension to cancer cell-seeded coverslips.
- Incubate co-cultures for 4-24 hours to allow phagocytosis.
Imaging and Quantification:
- Image live co-cultures using confocal microscopy with Nomarski (DIC) and fluorescence channels.
- Acquire z-stacks to capture internalized cancer cells at different focal planes.
- Quantify phagocytosis by counting the number of fluorescent cancer cells clearly internalized within macrophages per field of view.
- Analyze a minimum of 10 random fields per condition.
Troubleshooting Notes:
- Low Phagocytosis: Confirm macrophage activation status; optimize effector-to-target cell ratio (typically 10:1 to 20:1).
- Difficulty Distinguishing Internalized vs. Adherent Cells: Use z-stack imaging and surface quenching agents if necessary.
- Macrophage Detachment: Handle cells gently during medium changes and imaging.
Signaling Pathway Analysis and Data Presentation
Quantitative Analysis of CALR Exposure Kinetics
The temporal dynamics of CALR exposure vary significantly based on the inducing stimulus and the cellular context. The table below summarizes quantitative data from key studies measuring CALR surface exposure following different treatments.
Table 1: Kinetics and Magnitude of CALR Surface Exposure in Response to ICD Inducers
| Cell Line | Inducing Stimulus | Time to Peak Exposure (hours) | % CALR-Positive Cells | Key Pathway Elements Required | Citation |
|---|---|---|---|---|---|
| HeLa | Mitoxantrone (MTX, 5 µM) | 6-8 | 60-75% | PERK, eIF2α, Caspase-8, BAX/BAK, SNAREs | [61] |
| CT26 | Oxaliplatin (OXP, 100 µM) | 8-12 | 55-70% | PERK, eIF2α, Caspase-8, BAP31 | [30] |
| HeLa | Recombinant CXCL8 (50 ng/mL) | 4-6 | 50-65% | CXCR1/CXCR2, Caspase-8, PERK, BAX/BAK | [61] |
| CT26 | UVC Light (20 J/m²) | 4-6 | 45-60% | PERK, eIF2α, Caspase-8, BAP31 | [30] |
Caspase Activation Dynamics in ICD
Caspase activation, particularly of caspase-8, is a critical checkpoint in the CALR exposure pathway. The following table compares caspase specificity and their roles in the ICD process, based on studies using caspase-specific reporters and inhibitors.
Table 2: Caspase Specificity Profiles and Roles in Immunogenic Cell Death
| Caspase | Cleaves DEVD Motif | Preferred Cleavage Motif | Function/Role in ICD | Evidence in CALR Exposure |
|---|---|---|---|---|
| Caspase-3 | +++ | DEVD | Executioner apoptosis | Not required for CALR exposure [13] |
| Caspase-7 | +++ | DEVD | Executioner apoptosis | Sufficient for CALR exposure in caspase-3 deficient cells [13] |
| Caspase-8 | ++ | LETD, IETD | Initiator (extrinsic pathway) | Required for BAP31 cleavage and CALR exposure [30] |
| Caspase-9 | + | LEHD | Initiator (intrinsic pathway) | Not directly implicated in CALR exposure [13] |
The complex interplay between caspases during ICD is visualized in the following pathway diagram, which integrates caspase activation with the broader CALR exposure mechanism.
The Scientist's Toolkit: Research Reagent Solutions
The following table compiles essential reagents and their experimental applications for studying and modulating phagocytic signaling in the context of the TME.
Table 3: Essential Research Reagents for Phagocytic Signaling Studies
| Reagent Category | Specific Examples | Function/Application | Key Experimental Use |
|---|---|---|---|
| ICD Inducers | Mitoxantrone (MTX, 1-10 µM), Oxaliplatin (OXP, 50-100 µM), Doxorubicin (DOX, 1-5 µM) | Induce immunogenic cell death with CALR exposure | Positive control for ICD; testing TME-counteracting strategies [61] [12] |
| Pathway Agonists | Recombinant CXCL8/IL-8 (50-100 ng/mL), GSK2606414 (PERK activator, 1 µM) | Counteract TME suppression of CALR exposure | Enhance CALR exposure in resistant models; pathway rescue experiments [61] |
| Caspase Reporters | ZipGFP-DEVD caspase-3/7 reporter (lentiviral), Caspase-8 fluorogenic substrates (IETD- AFC) | Real-time monitoring of caspase activation | Live-cell imaging of caspase dynamics; specificity determination [13] |
| Inhibitors | Z-VAD-FMK (pan-caspase inhibitor, 20 µM), Pertussis Toxin (GPCR inhibitor, 100 ng/mL), ISRIB (eIF2α phosphorylation inhibitor, 500 nM) | Pathway dissection; confirm mechanism | Determine specific pathway requirements; negative controls [61] [13] |
| Phagocytosis Blockers | Anti-CALR neutralizing antibody, CD47-Fc fusion protein (5-10 µg/mL) | Inhibit specific phagocytic signals | Confirm CALR-dependent phagocytosis; assess specificity of uptake [62] [63] |
| Detection Reagents | Non-permeabilizing anti-CALR antibody, Annexin V conjugates, DsRed Express fluorescent protein | Labeling and detection of ICD markers | Flow cytometry, microscopy, and phagocytosis quantification [64] [30] |
The protocols and analytical frameworks presented herein provide a systematic approach for investigating and counteracting TME-mediated suppression of phagocytic signaling. By focusing on the preservation of CALR exposure—a critical "eat me" signal dependent on ER stress and caspase activation—researchers can develop more effective strategies to enhance anticancer immunity. The integration of quantitative CALR detection, functional phagocytosis assays, and pathway-specific modulation enables comprehensive evaluation of therapeutic candidates aimed at overcoming the immunosuppressive barriers of the tumor microenvironment. These methodologies support the development of next-generation cancer immunotherapies that harness the innate immune system's capacity to recognize and eliminate malignant cells through phagocytic clearance.
The canonical pathway of Immunogenic Cell Death (ICD) establishes a coordinated sequence of damage-associated molecular pattern (DAMP) exposure and release: calreticulin (CALR) translocation precedes ATP secretion, which is followed by HMGB1 release [12]. This carefully orchestrated process ensures efficient antigen presentation and T-cell priming, culminating in a potent antitumor immune response. However, emerging experimental evidence reveals a paradoxical scenario in which caspase inhibition, contrary to theoretical expectations, enhances ATP release, a key ICD hallmark.
This application note explores the mechanistic basis for this discrepancy, providing methodological guidance for its investigation. We situate these findings within a broader research thesis on ICD, positing that the point-of-no-return in cell death is not a single event but a flexible threshold influenced by compensatory pathways and cellular context [65]. Understanding these nuances is critical for developing robust assays and therapeutics that reliably induce ICD in cancer treatment.
Theoretical Background: The Interplay of Caspases and ICD Hallmarks
The Central Role of Caspases in Cell Death Pathways
Caspases are cysteine-dependent aspartate-specific proteases that function as master regulators of programmed cell death (PCD), integrating signals from multiple pathways including apoptosis, pyroptosis, and necroptosis [32]. Their activity is not merely binary but exists within a complex network of molecular interactions:
- Caspase-8 serves as a molecular switch between apoptosis, necroptosis, and pyroptosis [32]
- Caspase-1 is primarily associated with inflammasome-induced pyroptosis [32] [66]
- Caspase-2 participates in intrinsic apoptosis triggered by reactive oxygen species and ER stress [32]
Compensatory Cell Death Pathways
When one cell death pathway is inhibited, cells often activate compensatory mechanisms. For instance, inhibition of caspase-8, a key mediator of extrinsic apoptosis, can lead to enhanced necroptosis [32]. This phenotypic plasticity in death signaling means that pharmacological intervention in one pathway may inadvertently amplify another, potentially explaining enhanced DAMP release under caspase inhibition.
Table 1: Key Caspases and Their Primary Roles in Regulated Cell Death
| Caspase | Primary Role | Key Functions | Impact on ICD |
|---|---|---|---|
| Caspase-8 | Extrinsic Apoptosis Switch | Initiator caspase; molecular switch between apoptosis, necroptosis, and pyroptosis | Context-dependent; can inhibit or promote ICD |
| Caspase-1 | Inflammasome Effector | Processes IL-1β/IL-18; cleaves gasdermin D for pyroptosis | Promotes pyroptosis; enhances inflammation |
| Caspase-3 | Apoptosis Executioner | Cleaves PARP, lamin proteins; activates DNA fragmentation | Typically associated with apoptotic clearance |
| Caspase-2 | Stress Sensor | Activated by ER stress, ROS; cleaves BID | May inhibit ferroptosis via GPX4 stabilization |
Experimental Evidence: Documented Cases of Discrepant Hallmarks
Chemotherapy-Induced ICD and Caspase Inhibition
Research on anthracycline-based chemotherapeutics (e.g., doxorubicin, mitoxantrone) demonstrates that these ICD inducers trigger endoplasmic reticulum stress, leading to phosphorylation of eIF2α and subsequent exposure of CALR, ATP, and HMGB1 [12]. When caspase activity is partially inhibited in these models, the expected suppression of DAMP release is not uniformly observed. Instead, some studies report augmented ATP secretion, suggesting activation of compensatory death pathways with distinct DAMP profiles.
Platinum-Based Drugs and Differential ICD Induction
Comparative studies between oxaliplatin and cisplatin reveal important insights into discrepant hallmarks. While both platinum drugs induce similar HMGB1 secretion, only oxaliplatin consistently induces CALR translocation and robust ICD [67]. This discrepancy has been linked to oxaliplatin's unique ability to promote HMGB2 secretion alongside HMGB1, mediated by the nuclear exporter XPO1 [67]. The finding that XPO1 inhibition blocks oxaliplatin-mediated ferroptosis and CRT translocation suggests a crucial role for nuclear events in determining the quality of ICD.
Table 2: Documented Experimental Observations of Discrepant Hallmarks
| Experimental Context | Caspase Manipulation | Observed Discrepancy | Proposed Mechanism |
|---|---|---|---|
| Anthracycline-treated tumor cells | Pan-caspase inhibition (z-VAD-fmk) | Enhanced ATP release despite reduced apoptosis | Activation of compensatory necroptosis |
| Oxaliplatin vs. Cisplatin treatment | None (differential basal caspase engagement) | Oxaliplatin induces CRT translocation; cisplatin does not | Differential HMGB2 secretion and XPO1 dependence |
| Doxorubicin-induced ICD in breast cancer | Caspase-3/7 inhibition | Unchanged ATP secretion despite apoptotic suppression | Shift to autophagy-dependent vesicular ATP release |
Mechanistic Insights: Molecular Switches Compensating for Caspase Inhibition
The enhancement of ATP release upon caspase inhibition can be explained by several non-mutually exclusive mechanisms:
Pathway Switching
Inhibition of caspase-mediated apoptosis may redirect cell death toward necroptosis or pyroptosis, which are characterized by different DAMP release kinetics and magnitudes [32]. Caspase-8 inhibition particularly relieves suppression of necroptotic signaling, potentially leading to enhanced ATP release through membrane permeabilization.
Altered Vesicular Trafficking
ATP release during ICD occurs predominantly through autophagy-dependent vesicular excretion [12]. Caspase inhibition may enhance autophagic flux or alter vesicular trafficking, leading to increased ATP secretion even while other ICD hallmarks are suppressed.
Inflammasome Activation
Certain caspase inhibitors may paradoxically activate inflammasome complexes, particularly under conditions of cellular stress. Inflammasome activation can promote gasdermin D-mediated pore formation, facilitating ATP release [66].
Methodological Framework: Protocols for Investigating Discrepant Hallmarks
Protocol 1: Comprehensive DAMP Profiling Under Caspase Inhibition
Objective: To quantitatively assess multiple ICD hallmarks in tumor cells treated with ICD inducers in the presence of caspase inhibitors.
Materials:
- Tumor cell lines (e.g., CT26, MCA205, or primary tumor cells)
- ICD inducers: Doxorubicin (1-5 µM), Oxaliplatin (10-50 µM)
- Caspase inhibitors: z-VAD-fmk (pan-caspase, 20-50 µM)
- Control: z-FA-fmk (inactive analog, 20-50 µM)
Procedure:
- Seed tumor cells in 12-well plates (2×10^5 cells/well) and incubate for 24h
- Pre-treat with caspase inhibitors or vehicle control for 2h
- Add ICD inducers at specified concentrations and incubate for 12-24h
- Collect and analyze samples for ICD hallmarks:
- Surface CALR: Fix cells, stain with anti-CALR antibody and secondary Alexa Fluor 488-conjugated antibody, analyze by flow cytometry
- ATP secretion: Collect conditioned media, measure ATP using luciferase-based assay kit
- HMGB1/HMGB2 release: Concentrate conditioned media, analyze by Western blot or LC-PRM/HRMS [67]
- Include viability controls (MTT assay) to normalize DAMP measurements to cell death percentage
Protocol 2: Pathway Switching Detection
Objective: To identify compensatory cell death pathways activated upon caspase inhibition.
Materials:
- Necroptosis inhibitor: Necrostatin-1 (10-30 µM)
- Pyroptosis inhibitor: Disulfiram (1-5 µM) or specific gasdermin D inhibitor
- Autophagy inhibitor: Chloroquine (10-50 µM)
- Phospho-MLKL antibody for necroptosis detection
- Cleaved gasdermin D antibody for pyroptosis detection
Procedure:
- Seed cells as in Protocol 1
- Pre-treat with caspase inhibitor (z-VAD-fmk, 20 µM) alone or in combination with pathway-specific inhibitors
- Add ICD inducer and incubate for predetermined time
- Analyze pathway activation:
- Necroptosis: Western blot for phospho-MLKL and MLKL oligomerization
- Pyroptosis: Western blot for cleaved gasdermin D and IL-1β processing
- Autophagy: Western blot for LC3-I/II conversion and p62 degradation
- Correlate pathway activation with ATP secretion profiles from Protocol 1
Protocol 3: Functional Immune Activation Assay
Objective: To determine the functional consequences of discrepant hallmark patterns on immune cell activation.
Materials:
- Bone marrow-derived dendritic cells (BMDCs) from C57BL/6 mice
- CD8+ T-cells from OT-I transgenic mice
- ELISA kits for IFN-γ, IL-6, CXCL10
Procedure:
- Induce ICD in tumor cells as in Protocol 1 with and without caspase inhibition
- Collect conditioned media and dying cells after 24h treatment
- Co-culture dying tumor cells with BMDCs at 1:5 ratio for 24h
- Assess DC maturation by flow cytometry (CD80, CD86, MHC-II expression)
- Prime CD8+ T-cells with matured DCs for 5 days
- Measure T-cell activation:
- IFN-γ secretion by ELISA
- Proliferation by CFSE dilution
- Cytotoxic activity against target tumor cells
The Scientist's Toolkit: Essential Research Reagents
Table 3: Key Research Reagents for Investigating ICD Hallmark Discrepancies
| Reagent/Category | Specific Examples | Function/Application | Considerations |
|---|---|---|---|
| Caspase Inhibitors | z-VAD-fmk (pan-caspase)z-DEVD-fmk (caspase-3/7)z-IETD-fmk (caspase-8) | Tool compounds to inhibit specific caspase activities | Dose-response essential; monitor compensatory pathways |
| ICD Inducers | DoxorubicinOxaliplatinMitoxantrone | Induce immunogenic cell death with varying hallmark patterns | Concentration optimization critical for cell type |
| Pathway Inhibitors | Necrostatin-1 (necroptosis)VX-765 (caspase-1)MCC950 (NLRP3) | Target specific cell death pathways to map compensation | Verify specificity in model system |
| DAMP Detection | Anti-CALR antibodiesLuciferase ATP assayAnti-HMGB1/HMGB2 antibodies | Quantify hallmark exposure/release | HMGB1/HMGB2 cross-reactivity concerns [67] |
| Nuclear Export Inhibitors | Selinexor (KPT-330)Leptomycin B | Block XPO1/CRM1-mediated nuclear export | Affects multiple DAMPs including HMGB1/2 [67] |
Data Analysis and Interpretation Framework
Quantitative Assessment of Hallmark Coordination
Develop a scoring system to quantify the coordination between ICD hallmarks under different experimental conditions:
ICD Coordination Score = (Number of appropriately expressed hallmarks) / (Total number of hallmarks assessed)
Appropriate expression should be defined based on established canonical sequences (e.g., CALR exposure before ATP secretion).
Statistical Considerations
- Perform multivariate analysis to identify correlations between hallmark patterns
- Use time-course experiments to establish temporal relationships
- Employ path analysis or structural equation modeling to test hypothetical pathways
The phenomenon of enhanced ATP release upon caspase inhibition underscores the robustness and plasticity of cell death networks. Rather than representing experimental artifacts, these discrepant hallmarks reveal fundamental biological principles of pathway compensation and network regulation. From a translational perspective, these findings highlight both challenges and opportunities: while they complicate predictive biomarker development, they may also reveal novel opportunities for therapeutic intervention by selectively engaging specific DAMP combinations. Researchers should employ the comprehensive methodological framework presented here to systematically characterize ICD in their experimental systems, particularly when evaluating novel compounds or combination therapies.
Bench to Bedside: Validating ICD Biomarkers and Comparative Analysis of Clinical Inducers
Correlating CALR Exposure with Improved Clinical Outcomes in AML and NSCLC
This application note synthesizes current clinical and experimental evidence establishing calreticulin (CALR) exposure on the surface of malignant cells as a significant prognostic biomarker in acute myeloid leukemia (AML) and non-small cell lung cancer (NSCLC). The data presented herein support the quantification of surface-exposed CALR as a robust indicator of activated adaptive anti-tumor immunity and superior clinical outcomes, providing a methodological framework for researchers investigating immunogenic cell death (ICD).
Clinical Correlations: CALR Exposure and Patient Outcomes
Compiled clinical data from multiple studies demonstrate a consistent correlation between elevated CALR exposure on tumor cells and improved survival metrics across cancer types. The table below summarizes key clinical findings for AML and NSCLC.
Table 1: Correlation between CALR Exposure and Clinical Outcomes in AML and NSCLC
| Cancer Type | Correlated Clinical Outcome | Associated Immune Contexture | Reference |
|---|---|---|---|
| Acute Myeloid Leukemia (AML) | Improved relapse-free survival (RFS) and overall survival (OS) [68]. Correlation with T-cell immune responses [69]. | Increased effector memory CD4+ and CD8+ T cells specific for AML antigens; Enhanced IFN-γ secretion by autologous T cells upon stimulation [68] [69]. | |
| Non-Small Cell Lung Cancer (NSCLC) | Increased overall survival (OS); Positive correlation with patient prognosis [70] [68]. | Increased infiltration of tumors by dendritic cells (DCs) and CD8+ T cells [70] [68]. | |
| Ovarian Cancer | Increased RFS and OS [71]. | TH1 polarization and enhanced cytotoxic activity [71]. | |
| Colorectal Carcinoma (CRC) | Increased 5-year survival rate [68]. | Infiltration of tumors by CD45RO+ immune cells [68]. |
The prognostic power of CALR stems from its role as a pro-phagocytic "eat-me" signal. Surface-exposed CALR (ecto-CALR) facilitates the phagocytosis of stressed or dying cancer cells by antigen-presenting cells, such as dendritic cells, thereby initiating a robust adaptive immune response [68] [69]. The functional workflow of this process is illustrated below.
Detailed Experimental Protocols
This section provides standardized protocols for key methodologies used to investigate CALR-driven immune responses, enabling replication and application in pre-clinical research.
Protocol: DC Migration and Maturation Assay
This assay evaluates the functional capacity of tumor-derived factors to recruit and activate dendritic cells, a critical step in the anti-tumor immune cascade [70].
Key Research Reagents
Table 2: Essential Reagents for DC Migration and Maturation Assay
| Reagent / Kit | Function / Specificity | Example Catalog Number |
|---|---|---|
| Transwell System | Measures directional cell migration; 8-μm pore size recommended. | Corning, 24 wells [70] |
| Recombinant Human GM-CSF | Induces differentiation and proliferation of DC precursors. | R&D Systems, 215-GMP-050 [70] |
| Recombinant Human IL-4 | Promotes the development of immature DCs. | R&D Systems, 204-GMP-050 [70] |
| Anti-human CD83 PE | Flow cytometry antibody for detecting mature DCs. | BioLegend, 305308 [70] |
| Anti-human CCR7 PE | Flow cytometry antibody for detecting DC migration competence. | BioLegend, 353204 [70] |
| Human TNFα Precoated ELISA Kit | Quantifies TNFα secretion in cell supernatant. | DAKEWE, 1117202 [70] |
| Human CCL19/MIP-3β ELISA Kit | Quantifies CCL19 secretion in cell supernatant. | NeoBioscience, EHC036 [70] |
Step-by-Step Procedure
Generation of Immature Dendritic Cells (iDCs):
- Isolate PBMCs from healthy donor blood.
- Culture PBMCs in AIM-V medium supplemented with 800 U/ml GM-CSF and 500 U/ml IL-4 for 6 days to generate iDCs [70].
Preparation of Conditioned Supernatant:
- Culture tumor cell lines (e.g., A549 for NSCLC) under standard conditions (37°C, 5% CO₂) for 24 hours.
- Collect the cell culture supernatant by centrifugation to remove cellular debris [70].
DC Migration Assay:
- Load the conditioned supernatant into the lower chamber of a transwell system.
- Seed (1 \times 10^5) mature DCs (mDCs) in serum-free medium into the upper chamber.
- Incubate for 4 hours at 37°C.
- Count the cells that have migrated to the lower chamber to determine migration ability [70].
DC Maturation Assay:
- Suspend iDCs in the conditioned supernatant collected from tumor cells.
- After 24 hours of incubation, collect the DCs.
- Analyze the expression of the maturation marker CD83 using flow cytometry [70].
Cytokine Blocking Studies:
- Use anti-CCL19 and anti-TNFα neutralizing antibodies to block these cytokines in the supernatants from mCALR groups.
- Repeat the migration and maturation assays to confirm the specific role of these cytokines [70].
Protocol: Flow Cytometric Analysis of Ecto-CALR
This protocol details the procedure for detecting CALR on the outer membrane of live cells, a definitive readout for immunogenic cell death [69] [71].
Key Research Reagents
- Primary Antibodies: Anti-CALR antibody (e.g., for flow cytometry) and corresponding isotype control.
- Cell Staining Antibodies: Anti-CD45, anti-cytokeratin, or other lineage markers to distinguish malignant cells from tumor-infiltrating immune cells [71].
- Staining Buffer: PBS supplemented with a low concentration of FBS (e.g., 2%).
Step-by-Step Procedure
Cell Preparation:
- For suspension cells (e.g., AML blasts): Isolate mononuclear cells from patient blood or bone marrow samples using density gradient centrifugation.
- For adherent cells (e.g., from solid tumors): Mechanically dissociate and enzymatically digest tumor tissue (e.g., with Collagenase D and DNase I), then filter through a 70-μm strainer to create a single-cell suspension [71].
Cell Staining:
- Resuspend up to (1 \times 10^6) cells in staining buffer.
- Stain cells with lineage markers (e.g., anti-CD45, anti-cytokeratin) and the anti-CALR antibody or isotype control for 20 minutes at 4°C in the dark.
- Critical Note: Do not permeabilize the cells, as this will allow detection of intracellular CALR and confound the surface-exposed (ecto-) CALR measurement.
Data Acquisition and Analysis:
- Wash cells and acquire data on a flow cytometer (e.g., BD Fortessa).
- Analyze data using software such as FlowJo.
- Gate on the lineage-defined population of malignant cells (e.g., CD45⁻/cytokeratin⁺ for solid tumors) and report ecto-CALR as a percentage of positive cells or by Median Fluorescence Intensity (MFI) compared to the isotype control [69] [71].
Molecular Mechanisms: The CALR Signaling Pathway
The translocation of CALR to the cell surface is a tightly regulated process initiated by specific endoplasmic reticulum (ER) stress. The following diagram and description outline the key molecular events.
The core mechanism involves a focused endoplasmic reticulum stress response triggered by immunogenic cell death inducers (e.g., anthracyclines, oxaliplatin) [30] [68]. This leads to:
- PERK Activation and eIF2α Phosphorylation: Early activation of the ER kinase PERK results in phosphorylation of eIF2α, a quintessential step that is necessary but not sufficient for CALR exposure [30] [68].
- Caspase-8 Cleavage and Exocytosis: Phospho-eIF2α enables a sub-apoptotic activation of caspase-8, which cleaves the ER protein BAP31. This, in turn, leads to the Golgi-mediated, SNARE-dependent exocytosis of a specific CALR/ERp57 pool to the cell surface [30].
- Immune Activation via TLR4: Surface-exposed CALR can form a complex with Toll-like receptor 4 (TLR4) on immune cells. This activates the TLR4-MyD88 signaling pathway, increasing the secretion of cytokines like TNFα and CCL19, which are critical for the recruitment and maturation of dendritic cells [70].
This detailed analysis confirms surface-exposed CALR as a critical biomarker and central effector of anti-tumor immunity, providing a strong rationale for its use in prognostic stratification and therapeutic development.
Immunogenic cell death (ICD) represents a functionally unique form of regulated cell death that activates adaptive immune responses against tumor antigens, distinguishing it from tolerogenic apoptosis. The immunogenicity of ICD hinges on the spatiotemporally defined emission of damage-associated molecular patterns (DAMPs), which collectively confer adjuvanticity to dying cancer cells [16]. Among these DAMPs, the pre-apoptotic exposure of calreticulin (CALR) on the cell surface serves as a critical "eat-me" signal that facilitates phagocytic engulfment by antigen-presenting cells (APCs) and initiates T-cell priming against tumor neoantigens [72] [30]. This process of CALR translocation is orchestrated through complex signaling pathways involving endoplasmic reticulum (ER) stress, eukaryotic translation initiation factor 2α (eIF2α) phosphorylation, and caspase activation [30] [16].
The significance of ICD inducers in cancer therapy extends beyond direct cytotoxicity to encompass the establishment of systemic antitumor immunity and long-term immunological memory [72] [48]. Within this context, anthracyclines, oxaliplatin, and radiotherapy represent prominent ICD inducers with distinct molecular mechanisms and clinical applications. This application note provides a comparative analysis of these inducers, with a specific focus on their capacity to trigger CALR exposure and caspase activation, alongside detailed protocols for experimental assessment in preclinical research.
Comparative Mechanisms of Action
Molecular Pathways in ICD Induction
Table 1: Comparative DAMP Signatures of ICD Inducers
| ICD Inducer | CALR Exposure | HMGB1 Release | ATP Secretion | eIF2α Phosphorylation | ANXA1 Release | Caspase-8 Activation |
|---|---|---|---|---|---|---|
| Anthracyclines | Yes [72] | Yes [72] | Yes [72] | Yes [72] | Yes [72] | Yes [30] |
| Oxaliplatin | Yes [72] | Yes [72] | Yes [72] | Yes [72] | Yes [72] | Yes [30] |
| Radiotherapy | Yes [72] | Yes [72] | Not Specified | Yes [72] | Not Specified | Not Specified |
The induction of ICD by anthracyclines, oxaliplatin, and radiotherapy follows convergent pathways centered on ER stress response activation, though with distinct upstream triggers. All three inducers initiate a signaling cascade involving the ER-sessile kinase PERK, leading to phosphorylation of eIF2α, which results in translational arrest and serves as a critical checkpoint for subsequent CALR exposure [30]. This pathway continues with partial activation of caspase-8 (independent of caspase-3), caspase-8-mediated cleavage of BAP31, conformational activation of Bax and Bak, and culminates in SNARE-dependent exocytosis of the CALR/ERp57 complex to the plasma membrane [30]. Genetic or pharmacological inhibition of any component in this pathway—including PERK depletion, non-phosphorylatable eIF2α mutation, or caspase-8 inhibition—abolishes CALR exposure and compromises the immunogenicity of cell death [30].
Despite these commonalities, important distinctions exist among these inducers. Anthracyclines and oxaliplatin generate reactive oxygen species (ROS) that contribute to ER stress initiation, while radiotherapy directly damages cellular components including DNA and organelle membranes [72] [30]. Furthermore, the dependency on specific stress responses varies; for instance, autophagy is essential for anthracycline-induced ICD but dispensable for radiation-induced ICD [16]. These mechanistic differences translate to variations in the spectrum and kinetics of DAMP emission, ultimately influencing the potency and quality of the resulting antitumor immune response.
Visualizing Core ICD Induction Pathway
The following diagram illustrates the convergent signaling pathway through which anthracyclines, oxaliplatin, and radiotherapy induce calreticulin exposure:
Alternative and Non-Canonical Pathways
Beyond the canonical ER stress-mediated pathway, emerging evidence reveals alternative mechanisms for CALR exposure. Schweinfurthin compounds induce significant cell surface CALR exposure without triggering ER stress or requiring PERK activation [73]. This non-canonical pathway operates independently of ERp57 exposure and remains partially functional despite caspase inhibition, yet still requires an intact ER-to-Golgi transport system [73]. Additionally, chemokine signaling circuitries involving CXCL8 and its receptors (CXCR1/Cxcr2) modulate CALR exposure in human and murine cancer cells, identifying autocrine and paracrine mechanisms that can influence the immunogenicity of cell death [20]. These alternative pathways highlight the mechanistic diversity of ICD induction and present opportunities for therapeutic targeting in malignancies resistant to conventional ICD inducers.
Experimental Assessment and Protocols
Detection of CALR Exposure
Protocol: Cell Surface CALR Detection by Flow Cytometry
Cell Treatment and Preparation:
- Plate appropriate cancer cells (e.g., CT26 colon carcinoma, MCA205 fibrosarcoma) at 60-70% confluence.
- Treat cells with optimized concentrations of ICD inducers: 1-5 µM anthracyclines (doxorubicin/mitoxantrone), 10-50 µM oxaliplatin, or 2-10 Gy radiotherapy.
- Incubate for 4-16 hours to allow pre-apoptotic CALR exposure while maintaining membrane integrity.
- Harvest cells using non-enzymatic dissociation buffers to preserve surface epitopes.
Immunostaining:
- Wash cells twice with ice-cold FACS buffer (PBS + 1% BSA + 0.1% sodium azide).
- Resuspend approximately 5×10^5 cells in 100 µL FACS buffer containing primary anti-CALR antibody (1:100-1:500 dilution).
- Incubate for 45 minutes at 4°C with gentle agitation, protected from light.
- Wash twice with FACS buffer to remove unbound antibody.
- Resuspend in 100 µL FACS buffer with fluorophore-conjugated secondary antibody (1:200-1:1000 dilution) if required.
- Incubate for 30 minutes at 4°C, protected from light.
- Wash twice and resuspend in 300-500 µL FACS buffer for analysis.
Flow Cytometric Analysis:
- Use appropriate isotype controls to establish background fluorescence.
- Include viability dye (e.g., propidium iodide, 7-AAD) to exclude late apoptotic/necrotic cells.
- Analyze samples using flow cytometer, collecting at least 10,000 viable events per condition.
- Quantify CALR-positive population as percentage of viable cells and compare to untreated controls.
Troubleshooting Notes: Pre-apoptotic CALR exposure typically precedes phosphatidylserine externalization; therefore, minimal annexin V positivity should be observed in properly executed assays [30] [16]. For microscopy-based validation, fixed cells can be co-stained with anti-CALR and plasma membrane markers following similar treatment conditions.
Assessment of Caspase Activation
Protocol: Caspase-8 Activity Assay
Cell Lysis:
- Treat cells as described in Section 3.1 and harvest at appropriate timepoints (typically 4-8 hours post-treatment).
- Wash cells with ice-cold PBS and lyse using caspase assay buffer (50 mM HEPES, 100 mM NaCl, 0.1% CHAPS, 10% sucrose, 1 mM EDTA, pH 7.4) supplemented with fresh DTT (10 mM).
- Clarify lysates by centrifugation at 12,000 × g for 15 minutes at 4°C.
- Quantify protein concentration using Bradford or BCA assay.
Enzymatic Reaction:
- Prepare reaction mixture containing 50-100 µg total protein, caspase assay buffer, and 50 µM caspase-8-specific substrate (IETD-pNA or IETD-AFC) in a total volume of 100 µL.
- Incubate at 37°C for 1-2 hours, protected from light.
- Measure product formation spectrophotometrically (pNA at 405 nm) or fluorometrically (AFC excitation 400 nm, emission 505 nm).
Data Analysis:
- Express caspase activity as fold-change relative to untreated controls after subtracting background signal from substrate-only wells.
- Include positive control (cells treated with known caspase-8 activator) and negative control (reaction with caspase-8 inhibitor Z-IETD-FMK).
- Normalize activities to total protein content.
Alternative Approaches: For single-cell analysis, caspase-8 activity can be assessed using fluorogenic substrates via flow cytometry or live-cell imaging. Additionally, cleavage of endogenous caspase-8 substrates (e.g., BAP31) can be evaluated by western blotting to confirm functional activation [30].
In Vivo Validation of ICD
Protocol: Protective Tumor Vaccination Model
Vaccine Preparation:
- Culture syngeneic tumor cells (e.g., CT26, MCA205) to 70-80% confluence.
- Treat with optimal ICD-inducing concentrations of anthracyclines (0.5-2 µM), oxaliplatin (10-20 µM), or radiotherapy (5-15 Gy).
- Verify CALR exposure and DAMP emission using in vitro assays.
- Harvest cells 12-24 hours post-treatment, wash extensively with PBS, and resuspend at appropriate concentration (typically 1×10^6 cells/100 µL PBS).
Immunization and Challenge:
- Immunize immunocompetent syngeneic mice (n=5-10 per group) subcutaneously with 1×10^6 treated tumor cells in 100 µL PBS.
- Include control groups receiving equal numbers of untreated tumor cells or vehicle-treated cells.
- After 7-14 days, challenge mice with live tumor cells (1-5×10^5 cells) contralaterally.
- Monitor tumor growth by caliper measurements 2-3 times weekly for 4-8 weeks.
Immune Monitoring:
- Assess T-cell responses in vaccinated mice by IFN-γ ELISpot or intracellular cytokine staining against tumor antigens.
- Evaluate tumor infiltration by CD8+ T cells and dendritic cells by flow cytometry or immunohistochemistry at endpoint.
- For memory responses, rejector mice can be rechallenged with the same tumor cells after 60-90 days.
Validation Criteria: Successful ICD induction is demonstrated by significant protection against tumor challenge in vaccinated mice compared to controls, accompanied by robust tumor-specific T-cell responses and immunological memory [30] [16].
The Scientist's Toolkit
Table 2: Essential Research Reagents for ICD Studies
| Reagent Category | Specific Examples | Function and Application |
|---|---|---|
| Anti-CALR Antibodies | Anti-CALR polyclonal, Alexa Fluor 488-conjugated anti-CALR | Detection of surface-exposed CALR by flow cytometry, immunofluorescence, immunohistochemistry |
| Caspase Assays | IETD-pNA, IETD-AFC, FLICA Caspase-8 kits, Z-IETD-FMK inhibitor | Quantification of caspase-8 activity in cell lysates or intact cells |
| Cell Lines | CT26 (murine colon carcinoma), MCA205 (murine fibrosarcoma), 4T1 (murine mammary) | Syngeneic models for in vitro and in vivo ICD validation |
| Viability Probes | Propidium iodide, 7-AAD, Annexin V-FITC, SYTOX Green | Discrimination of viable, early apoptotic, and late apoptotic/necrotic populations |
| ER Stress Markers | Anti-phospho-eIF2α, anti-PERK, anti-BiP/GRP78 | Assessment of ER stress response activation by western blot, immunofluorescence |
| Cytokine/Chemokine Assays | CXCL8/IL-8 ELISA, Cxcl2 ELISA, ATP luminescence kits | Quantification of secreted DAMPs and immune mediators |
Research Applications and Therapeutic Implications
The strategic induction of ICD represents a promising approach to enhance anticancer immunity, particularly in combination with immune checkpoint inhibitors and other immunomodulatory agents [72] [16]. The comparative analysis presented herein informs selection of appropriate ICD inducers based on their mechanistic profiles and DAMP emission signatures. From a therapeutic perspective, anthracyclines and oxaliplatin offer clinically applicable options for inducing immunogenic cell death in multiple solid malignancies, while radiotherapy provides a locoregional modality with potential abscopal effects when combined with systemic immunotherapy [72].
Emerging research directions include the development of novel small-molecule ICD inducers that bypass resistance mechanisms associated with conventional agents [73] [48]. Additionally, biomarker-driven approaches to identify tumors with intrinsic sensitivity to ICD induction—such as defects in ER stress responses or CALR translocation pathways—may enable patient stratification for optimized therapeutic outcomes. The integration of ICD biomarkers (surface CALR, HMGB1 release, caspase activation) into early-phase clinical trials provides a rational framework for evaluating the immunogenic potential of novel therapeutic regimens and their capacity to remodel the tumor microenvironment toward enhanced immune recognition and elimination.
In Vivo Models for Validating Bona Fide ICD and Antitumor Immunity
Immunogenic cell death (ICD) represents a paradigm shift in oncology, transforming conventional cytotoxic agents into catalysts for antitumor immunity. Unlike tolerogenic cell death, ICD is characterized by the emission of damage-associated molecular patterns (DAMPs) that enable the immune system to recognize and eliminate cancer cells [12] [48]. The validation of bona fide ICD requires rigorous in vivo models that can recapitulate the complex interplay between dying tumor cells and the host immune system. This protocol details standardized methodologies for assessing ICD and its functional consequences on antitumor immunity, providing researchers with a framework for evaluating novel ICD inducers and combination strategies. The core premise of these models is that tumor cells undergoing bona fide ICD can function as an endogenous vaccine, stimulating antigen-presenting cells and ultimately leading to the establishment of tumor-specific immunological memory [48] [74].
The critical DAMPs mediating ICD include surface-exposed calreticulin (CRT), which serves as an "eat me" signal for dendritic cells; secreted adenosine triphosphate (ATP), which acts as a "find me" signal and inflammasome activator; and released high mobility group box 1 (HMGB1), which promotes antigen presentation [12] [17]. The integration of these signals in vivo leads to the activation of dendritic cells, cross-priming of cytotoxic T cells, and the establishment of long-term immunological memory capable of rejecting subsequent tumor challenges [48].
Key In Vivo Models and Methodologies
Prophylactic Tumor Vaccination Model
The prophylactic vaccination model represents the gold standard for establishing the immunogenic potential of ICD inducers. This model directly tests whether dying cancer cells can function as a vaccine to prevent subsequent tumor growth [48] [74].
Experimental Workflow:
- Step 1: ICD Induction In Vitro - Tumor cells are treated with the putative ICD inducer (e.g., doxorubicin, oxaliplatin) under optimized conditions. For doxorubicin, this typically involves short exposure (4-6 hours) to lethal concentrations (20-40 µM) [74].
- Step 2: Vaccination - Syngeneic immunocompetent mice are immunized subcutaneously with 1 × 10^6 ICD-induced dying tumor cells. Control groups receive vehicle-treated tumor cells or non-immunogenic cell death inducers [74].
- Step 3: Challenge - After 7-14 days, mice are challenged with live tumor cells of the same type. The challenge is typically administered contralaterally to the vaccination site [48].
- Step 4: Endpoint Analysis - Tumor growth is monitored over time, and protection rates are calculated. Complete protection demonstrates establishment of antigen-specific immunological memory [74].
Table 1: Validated ICD Inducers for Prophylactic Vaccination Studies
| ICD Inducer | Proposed Mechanism | Typical Concentration | Evidence Level |
|---|---|---|---|
| Doxorubicin | ER stress, ROS generation, PERK activation | 20-40 µM (4-6h exposure) | Established in multiple cancer models [74] |
| Oxaliplatin | DNA damage, ER stress | 500 µM (in vitro) / 5 mg/kg (in vivo) | Validated in colorectal cancer models [75] [12] |
| Mitoxantrone | ER stress, PERK/GCN2 activation | 3 µM (in vitro) | Proven in prostate cancer models [12] [17] |
| Photodynamic Therapy | ROS-mediated ER stress, PERK activation | Variable by photosensitizer | Demonstrated in multiple models [17] |
Therapeutic Vaccination in Established Disease Models
For evaluating the therapeutic potential of ICD inducers, models incorporating established tumors provide more clinically relevant data [74].
Metastatic Lung Cancer Model:
- Tumor cells (1 × 10^6 S1601-Luc) are administered intravenously to establish lung metastases
- After 3-4 weeks (confirmed by bioluminescent imaging), mice receive weekly subcutaneous immunizations with ICD-induced dying tumor cells for four weeks
- Metastatic burden is quantified by luminescence imaging and histological analysis of lung sections [74]
Spontaneous Tumorigenesis Model:
- Gprc5a-knockout mice develop spontaneous lung tumors following NNK induction
- ICD-based vaccinations are administered to assess protection against de novo tumor development
- This model is particularly valuable for evaluating prevention of tumorigenesis in high-risk settings [74]
Immune Monitoring and Correlative Assays
T Cell Analysis:
- Lymphocytes from tumor-draining lymph nodes and tumor tissues are analyzed by flow cytometry
- Key markers: CD4+, CD8+, IFN-γ (Th1 response), IL-4 (Th2 response)
- Intracellular cytokine staining following antigen restimulation assesses tumor-specific T cell responses [74]
Dendritic Cell Maturation:
- Co-culture of dying tumor cells with immature dendritic cells
- Surface upregulation of MHC class II, CD80, CD83, and CD86 indicates functional maturation [17]
- Cytokine profile analysis (IL-10 absent, IL-1β high, NO high) distinguishes immunogenic from tolerogenic maturation [17]
Macrophage Polarization:
- Tumor-infiltrating macrophages are analyzed for M1 (CD86+) vs M2 (CD206+) polarization
- ICD typically promotes M1 polarization, associated with antitumor immunity [74]
ICD Induction and Validation Workflows
In Vitro ICD Induction Protocol
Materials and Reagents:
- Tumor cell lines (e.g., CT26 colorectal carcinoma, B16F10 melanoma)
- Validated ICD inducers (doxorubicin, oxaliplatin, mitoxantrone)
- Cell culture medium and supplements
- Flow cytometry antibodies for DAMP detection
Step-by-Step Procedure:
- Culture tumor cells to 70-80% confluence in appropriate medium
- Treat with ICD inducer at optimized concentration (see Table 1) for specified duration
- For doxorubicin: 20-40 µM for 4-6 hours [74]
- For oxaliplatin: 500 µM for 2-4 hours [75]
- Wash cells to remove drug and continue culture in fresh medium
- Harvest cells at appropriate timepoints for DAMP analysis
Quality Control Measures:
- Verify cell death induction (annexin V/PI staining)
- Confirm pre-apoptotic state during DAMP analysis (caspase-3 activation <20%) [4]
- Include positive controls (known ICD inducers) and negative controls (non-immunogenic cell death inducers)
DAMP Detection and Quantification
Table 2: Standardized Assays for DAMP Detection
| DAMP | Detection Method | Key Reagents | Timing Post-Induction |
|---|---|---|---|
| Surface CRT | Flow cytometry, Immunofluorescence, CRT-specific peptide (CRTpep) [4] | Anti-CRT antibody, FITC-CRTpep, ^18^F-CRTpep for imaging | 2-4 hours [4] |
| Extracellular ATP | Luciferin-luciferase assay (ENLITEN ATP Assay) [74] | Luciferin-luciferase solution, luminometer | 2-4 hours [17] |
| HMGB1 Release | ELISA, Western blot [74] | Anti-HMGB1 antibody | 8-24 hours [12] |
| ER Stress Markers | Western blot [17] | Antibodies for pEIF2α, pPERK | 2-4 hours [17] |
Surface CRT Detection by Flow Cytometry:
- Harvest treated cells by gentle trypsinization
- Stain with primary anti-CRT antibody (1:100) for 30 minutes on ice
- Wash with PBS and stain with fluorophore-conjugated secondary antibody
- Analyze by flow cytometry; report percentage CRT-positive cells and mean fluorescence intensity [4]
ATP Release Assay:
- Collect supernatant from treated cells at specified timepoints
- Add 100 µl luciferin-luciferase solution to supernatants
- Measure light emission with luminometer
- Quantify using ATP standard curve [74]
Molecular Imaging of ICD Biomarkers
Recent advances enable non-invasive monitoring of ICD through molecular imaging approaches:
CRT-Specific Peptide Imaging:
- CRTpep (KLGFFKR) labeled with ^18^F for PET imaging
- Specifically binds ecto-CRT on pre-apoptotic cells treated with immunogenic drugs
- Enables early prediction of treatment response (within hours) compared to conventional imaging [4]
Imaging Protocol:
- Administer immunogenic drug (doxorubicin 5-10 mg/kg, oxaliplatin 5 mg/kg) or radiation (15 Gy)
- After 2-6 days, inject ^18^F-CRTpep (7.4 MBq/200 µL) intravenously
- Perform PET imaging 1-2 hours post-injection
- Quantify tumor uptake as percentage injected dose per gram [4]
The Scientist's Toolkit: Essential Research Reagents
Table 3: Key Research Reagent Solutions for ICD Studies
| Reagent/Category | Specific Examples | Function/Application | Experimental Notes |
|---|---|---|---|
| Validated ICD Inducers | Doxorubicin, Oxaliplatin, Mitoxantrone [12] [74] | Induce ER stress and DAMP emission | Concentration and exposure time critical; verify lot potency |
| CRT Detection Tools | Anti-CRT antibody, FITC-CRTpep, ^18^F-CRTpep [4] | Quantify surface CRT exposure | CRTpep enables live cell imaging and in vivo PET |
| Apoptosis/Cell Death Assays | Annexin V/PI, CCK-8, caspase-3 activation [74] | Confirm cell death and quantify viability | Distinguish pre-apoptotic from late apoptotic stages |
| Immune Cell Profiling Antibodies | CD4, CD8, CD80, CD83, CD86, CD11b, F4/80 [74] | Characterize immune cell infiltration and activation | Multi-color panels recommended for comprehensive profiling |
| Cytokine Detection Assays | IFN-γ ELISA, IL-4 ELISA, HMGB1 ELISA [74] | Quantify cytokine and DAMP release | Time course studies recommended |
| In Vivo Imaging Agents | ^18^F-FDG, ^18^F-CRTpep, luciferin for bioluminescence [4] | Monitor tumor burden and ICD non-invasively | Coregister with anatomical imaging |
Signaling Pathways in ICD Induction
The molecular circuitry of ICD involves coordinated stress response pathways, primarily centered on endoplasmic reticulum (ER) stress and the unfolded protein response (UPR). The diagram below illustrates the core signaling pathway:
Core ICD Signaling Pathway. This diagram illustrates the primary molecular events in immunogenic cell death, from initial stress induction to the establishment of antitumor immunity. ICD inducers trigger endoplasmic reticulum stress, leading to PERK-dependent signaling that coordinates the emission of key DAMPs (CRT, ATP, HMGB1). These signals collectively activate dendritic cells, enabling priming of tumor-specific T cells and culminating in protective antitumor immunity [48] [17].
In Vivo Vaccination Model Workflow
The prophylactic tumor vaccination model provides the most definitive evidence for bona fide ICD. The following workflow outlines the key steps and decision points:
In Vivo Vaccination Workflow. This flowchart outlines the sequential steps for validating bona fide ICD using the prophylactic tumor vaccination model. The process begins with in vitro induction of cell death followed by confirmation of DAMP emission. Immunocompetent mice are vaccinated with the dying cells, then challenged with live tumor cells. Tumor protection rates and immune correlates are analyzed to validate ICD and the establishment of protective immunological memory [48] [74].
Concluding Remarks
The in vivo models described herein provide a robust framework for validating bona fide ICD and its functional consequences on antitumor immunity. The prophylactic vaccination model remains the definitive benchmark, while therapeutic models offer clinically relevant insights into the potential of ICD inducers for cancer treatment. Integration of standardized DAMP detection assays with comprehensive immune monitoring creates a powerful platform for evaluating novel ICD-based therapies. As the field advances, molecular imaging approaches such as CRT-specific PET imaging promise to further enhance our ability to monitor ICD in real-time, potentially enabling early prediction of treatment response and personalized therapeutic adjustments. These validated models and methodologies provide the foundation for translating ICD research into meaningful clinical advances in cancer immunotherapy.
CALR as a Predictive Biomarker for Response to Immunogenic Chemotherapy
Immunogenic cell death (ICD) represents a functionally unique form of regulated cell death that activates adaptive immune responses against tumor cells, distinguishing it from tolerogenic cell death modalities [16]. The transition of immunologically "cold" tumors to "hot" tumors represents a crucial therapeutic goal in oncology, particularly for enhancing response rates to immune checkpoint inhibitors [18]. Calreticulin (CALR), a multifunctional endoplasmic reticulum (ER)-resident chaperone protein, has emerged as a critical determinant of cellular adjuvanticity and a promising predictive biomarker for response to immunogenic chemotherapy [76] [77]. When exposed on the plasma membrane of dying cancer cells, CALR serves as a potent "eat-me" signal that facilitates phagocytosis of tumor antigens by dendritic cells (DCs), enabling cross-presentation to cytotoxic T lymphocytes and initiating a tumor-specific immune response [18] [16]. This application note details the molecular mechanisms, detection methodologies, and clinical validation approaches for implementing CALR as a predictive biomarker in oncology drug development.
Molecular Mechanisms of CALR in Immunogenic Cell Death
CALR Exposure Pathway
The translocation of CALR from the ER to the cell surface during ICD follows a precisely regulated molecular pathway initiated by pre-apoptotic ER stress (Fig. 1) [16]. The core mechanism involves phosphorylation of eukaryotic translation initiation factor 2α (eIF2α) which leads to global translation arrest and activation of the ER stress response [18] [16]. This is followed by caspase-8-mediated cleavage of BAP31, which triggers anterograde transport of CALR to the Golgi apparatus [16]. The process culminates in syndecan-mediated exocytosis and VAMP1-/SNAP25-dependent fusion of CALR-containing vesicles with the plasma membrane, resulting in surface exposure of CALR as an early event in the ICD process, preceding phosphatidylserine externalization [13] [16].
Fig. 1 | CALR exposure pathway during immunogenic cell death. The process begins with endoplasmic reticulum (ER) stress induced by various stimuli, leading to phosphorylation of eIF2α, translation arrest, and caspase-8 activation, culminating in surface exposure of CALR that enables phagocytosis by antigen-presenting cells (APCs) and subsequent T-cell activation.
CALR as Part of the DAMPs Network
CALR functions within a coordinated network of damage-associated molecular patterns (DAMPs) that collectively determine the immunogenicity of cell death [18] [78]. This network includes adenosine triphosphate (ATP), which acts as a "find-me" signal to recruit macrophages and DCs; high mobility group box 1 (HMGB1), which binds Toll-like receptor 4 (TLR4) on DCs to promote antigen presentation; type I interferons; and annexin A1 (ANXA1), which directs DC homing to dying cells [18] [16]. The spatiotemporally defined emission of these DAMPs creates an immunogenic microenvironment that facilitates the breakdown of immunological tolerance toward tumor antigens [16].
Quantitative Analysis of CALR as a Predictive Biomarker
CALR Expression Across Tumor Types
Analysis of CALR expression patterns reveals significant variation across human malignancies, with implications for its utility as a predictive biomarker (Table 1). Computational analysis of The Cancer Genome Atlas (TCGA) data demonstrates that CALR expression is significantly elevated in kidney renal clear cell carcinoma (KIRC) compared to normal kidney tissue [76]. Similarly, Gene Expression Profiling Interactive Analysis (GEPIA) data indicates CALR overexpression in glioblastoma, lung cancer, breast cancer, liver cancer, and ovarian cancer relative to adjacent non-tumor tissues [77].
Table 1 | CALR as a prognostic biomarker across cancer types [76] [79]
| Cancer Type | Expression Pattern | Prognostic Significance | Immune Correlation |
|---|---|---|---|
| Bladder Cancer (BLCA) | High in ICD-high subtype | Poor prognosis with high expression | Correlated with CD8+ T cells, CD4+ memory T cells |
| Kidney Renal Clear Cell Carcinoma (KIRC) | Elevated vs. normal | High CALR = poor OS, DSS, PFI | Associated with immune infiltration |
| Head and Neck Squamous Cell Carcinoma (HNSCC) | Induced by chemotherapy | Improved survival with ICD | Regulates chemo-sensitivity |
| Acute Myeloid Leukemia (AML) | Surface exposure | Improved innate immunity | Enhanced NK cell activity |
Correlation with Therapeutic Response
The predictive capacity of CALR extends beyond prognosis to treatment response assessment. In bladder cancer, patients classified as ICD-high based on CALR and other ICD-related genes demonstrated significantly improved response to PD-1 targeted therapy compared to ICD-low patients [79]. For head and neck squamous cell carcinoma, key DAMPs including CALR, HMGB1, and ATP are closely associated with chemosensitivity, confirming their potential as predictive biomarkers for treatment response [78].
Experimental Protocols for CALR Detection
Flow Cytometry-Based CALR Surface Detection
Principle: This protocol enables quantitative assessment of CALR surface exposure, a critical early event in ICD, using antibody-based detection and flow cytometric analysis [13] [16].
Materials:
- Anti-CALR primary antibody (e.g., clone FMC 75)
- Fluorescently-labeled secondary antibody
- Flow cytometry buffer (PBS + 2% FBS)
- Appropriate isotype control antibodies
- Cell fixation solution (4% paraformaldehyde)
- Ice-cold PBS for washing
Procedure:
- Cell Preparation: Harvest treated cells using gentle non-enzymatic dissociation methods to preserve surface epitopes. Include appropriate positive controls (e.g., anthracycline-treated cells) and negative controls (untreated cells).
- Surface Staining: Wash cells twice with ice-cold PBS. Resuspend cell pellet in flow cytometry buffer containing anti-CALR antibody (1:100 dilution). Incubate for 1 hour at 4°C with gentle agitation.
- Secondary Staining: Wash cells twice with ice-cold PBS to remove unbound primary antibody. Resuspend in flow cytometry buffer containing fluorescently-labeled secondary antibody (1:200 dilution). Incubate for 45 minutes at 4°C protected from light.
- Analysis: Wash cells twice and resuspend in flow cytometry buffer for immediate analysis using a flow cytometer. Analyze a minimum of 10,000 events per sample.
- Data Interpretation: Calculate the percentage of CALR-positive cells and mean fluorescence intensity (MFI) relative to isotype controls. CALR exposure is typically considered positive when >15-20% of cells show surface staining with MFI ≥2-fold over background.
Technical Notes: Perform all steps on ice to prevent internalization of surface CALR. Include compensation controls for multicolor panels. For simultaneous assessment of apoptosis, combine with Annexin V staining following CALR detection [13].
Integrated Caspase Activation and CALR Exposure Assay
Principle: This protocol enables real-time monitoring of caspase-3/7 activation concurrent with endpoint CALR surface detection, providing temporal relationship between apoptotic execution and immunogenic signaling [13].
Materials:
- Stable caspase-3/7 reporter cell line (ZipGFP-based biosensor)
- Constitutive mCherry marker for normalization
- Time-lapse live-cell imaging system (e.g., IncuCyte)
- Flow cytometry equipment for CALR detection
- ICD-inducing agents (e.g., oxaliplatin, carfilzomib)
Procedure:
- Cell Preparation: Seed caspase-3/7 reporter cells in appropriate culture vessels for both imaging and flow cytometry. Allow adherence overnight.
- Treatment and Live-Cell Imaging: Apply ICD-inducing compounds at predetermined concentrations. Initiate time-lapse imaging with measurements every 2-4 hours for up to 80 hours.
- Caspase Activation Analysis: Quantify GFP fluorescence intensity normalized to mCherry signal. Apply automated analysis algorithms to identify apoptotic events at single-cell resolution.
- Endpoint CALR Detection: Following live-cell imaging, harvest cells and perform surface CALR staining as described in Protocol 4.1.
- Data Integration: Correlate temporal patterns of caspase activation with magnitude of CALR exposure across treatment conditions.
Technical Notes: Validate caspase specificity using pan-caspase inhibitor zVAD-FMK [13]. For 3D culture systems, optimize antibody penetration and imaging parameters accordingly.
Immunohistochemical Detection in Tissue Sections
Principle: This protocol enables spatial assessment of CALR expression and localization in formalin-fixed paraffin-embedded (FFPE) tissue sections, providing pathological context for biomarker assessment.
Materials:
- FFPE tissue sections (4-5 μm thickness)
- Anti-CALR antibody (e.g., CAB001513 for HPA)
- Antigen retrieval solution (citrate buffer, pH 6.0)
- HRP-labeled secondary detection system
- DAB chromogen substrate
- Hematoxylin counterstain
Procedure:
- Section Preparation: Deparaffinize tissue sections and rehydrate through graded alcohols. Perform heat-induced epitope retrieval in citrate buffer (20 minutes at 95°C).
- Immunostaining: Block endogenous peroxidase activity and nonspecific binding sites. Apply primary anti-CALR antibody (optimized dilution) and incubate overnight at 4°C.
- Detection: Apply HRP-conjugated secondary antibody and visualize using DAB chromogen. Counterstain with hematoxylin.
- Scoring: Evaluate staining intensity (0-3+) and percentage of positive tumor cells. Assess both subcellular localization (ER pattern vs. surface membrane) and distribution within tumor regions.
Technical Notes: Include known positive and negative control tissues in each staining run. For surface CALR detection, membrane pattern should be specifically evaluated separately from cytoplasmic ER staining [76].
Research Reagent Solutions
Table 2 | Essential research reagents for CALR and ICD research
| Reagent Category | Specific Examples | Research Application | Key Considerations |
|---|---|---|---|
| CALR Detection Antibodies | Clone FMC 75 (surface CALR); CAB001513 (IHC) | Surface exposure by flow cytometry; Tissue localization by IHC | Validate species reactivity; Confirm surface vs. total CALR specificity |
| Caspase Activity Reporters | ZipGFP DEVD-based biosensor [13] | Real-time apoptosis monitoring in live cells | Stable expression required; Caspase-3/7 specificity confirmation |
| ICD Inducers | Doxorubicin, Oxaliplatin, Carfilzomib [18] [13] | Positive controls for CALR exposure | Dose-response optimization critical; Distinguish from non-ICD inducers |
| Inhibition Reagents | CALR-blocking antibodies; zVAD-FMK (pan-caspase inhibitor) [13] [16] | Mechanism validation; Specificity controls | Titrate for functional blocking without toxicity |
| Multiplex Assay Platforms | Meso Scale Discovery (MSD) U-PLEX [80] | Simultaneous DAMP detection (CALR, HMGB1, ATP) | Superior sensitivity vs. ELISA; Cost-effective for multiple analytes |
CALR in Drug Development and Clinical Translation
Biomarker Validation Framework
The regulatory validation of CALR as a predictive biomarker requires a fit-for-purpose approach aligned with its intended context of use (COU) in drug development [81]. For CALR, this typically involves classification as a pharmacodynamic/response biomarker to inform dose selection or as a predictive biomarker for patient stratification [81]. The biomarker qualification process entails rigorous analytical validation assessing accuracy, precision, sensitivity, and specificity of the detection assay, followed by clinical validation demonstrating correlation with therapeutic response [81] [80]. Regulatory agencies including the FDA and EMA provide structured pathways for biomarker qualification through initiatives such as the Biomarker Qualification Program (BQP) and Critical Path Innovation Meetings (CPIM) [81].
Advanced Detection Technologies
While traditional ELISA has been the historical gold standard for biomarker quantification, advanced platforms offer significant advantages for CALR detection in the context of ICD (Table 3). Meso Scale Discovery (MSD) electrochemiluminescence technology provides up to 100-fold greater sensitivity than conventional ELISA, enabling detection of low-abundance CALR variants and multiplexed assessment of multiple DAMPs simultaneously [80]. Liquid chromatography tandem mass spectrometry (LC-MS/MS) further extends sensitivity while enabling absolute quantification of CALR and its post-translational modifications [80]. These advanced platforms address the critical need for precise, reproducible CALR measurement essential for regulatory decision-making.
Table 3 | Technology comparison for CALR biomarker assessment
| Platform | Sensitivity | Multiplexing Capacity | Sample Throughput | Best Application Context |
|---|---|---|---|---|
| Traditional ELISA | Moderate | Single-plex | High | Initial screening; Well-established protocols |
| Meso Scale Discovery (MSD) | High (100x ELISA) | Medium (10-plex) | Medium-high | Clinical trial support; DAMP signature profiling |
| LC-MS/MS | Very High | High (100s-1000s) | Medium | Comprehensive biomarker profiling; PTM analysis |
| Flow Cytometry | High | High (8-12 parameters) | Medium | Single-cell resolution; Surface vs. intracellular CALR |
| Immunohistochemistry | Moderate | Limited (2-4 markers) | Low | Spatial context; Tumor heterogeneity assessment |
Integrated Workflow for CALR Biomarker Implementation
A systematic approach to CALR biomarker implementation in oncology drug development involves multiple coordinated steps (Fig. 2), beginning with target identification and assay selection, progressing through preclinical validation, and culminating in clinical application and regulatory submission.
Fig. 2 | Implementation workflow for CALR biomarker development. The process begins with understanding CALR's role in immunogenic cell death (ICD) and progresses through assay development, preclinical and analytical validation, clinical correlation with treatment response, regulatory submission, and final clinical implementation for patient stratification.
CALR has established itself as a critically important predictive biomarker for response to immunogenic chemotherapy through its fundamental role as a key damage-associated molecular pattern in the ICD process. The robust correlation between CALR surface exposure and therapeutic outcomes across multiple cancer types underscores its potential utility in patient stratification, treatment selection, and drug development. Implementation of standardized detection methodologies, including flow cytometry for surface CALR assessment and advanced multiplexed platforms for DAMP signature profiling, provides the technical foundation for clinical translation. As the field advances, integration of CALR with other ICD biomarkers into composite signatures offers promising avenues for enhancing predictive accuracy and accelerating the development of novel immunotherapeutic strategies.
The pursuit of effective cancer therapeutics has increasingly focused on strategies that combine direct tumor cell killing with the engagement of the host immune system. Within this paradigm, immunogenic cell death (ICD) represents a critical process whereby dying tumor cells, through the spatiotemporal release of damage-associated molecular patterns (DAMPs), initiate an adaptive immune response against cancer antigens [54]. The endoplasmic reticulum (ER) protein calreticulin (CRT) serves as a pivotal "eat-me" signal on the surface of pre-apoptotic cells, facilitating phagocytic uptake by antigen-presenting cells and subsequent T-cell priming [30] [82]. The exposure of CRT is a hallmark of ICD induced by specific anticancer agents, including certain chemotherapeutics and radiation [20]. Recent investigations reveal that ATR inhibitors (ATRi) can potentiate the cytotoxic effects of radiotherapy (RT) and, importantly, modulate the tumor immune microenvironment [83] [84] [85]. This application note details the protocols and mechanistic insights for exploiting the synergistic combination of ATR inhibition, radiation, and immune checkpoint blockade (ICB) to enhance CRT-exposing ICD and promote antitumor immunity, framed within the context of caspase-activated pathways.
Key Mechanisms and Quantitative Evidence
Core Signaling Pathway in ICD-Associated Calreticulin Exposure
The pre-apoptotic exposure of calreticulin is a carefully orchestrated process initiated by specific cellular stressors. The following diagram outlines the core molecular pathway as characterized in the literature [30].
Figure 1: Core Pathway for Pre-Apoptotic Calreticulin Exposure. The pathway, triggered by ER stress, involves PERK/eIF2α signaling, partial caspase-8 activation, and culminates in the exocytosis of the CRT/ERp57 complex [30].
ATRi and RT Synergy in Promoting an Immunogenic Tumor Microenvironment
Combining ATR inhibition with radiation not only enhances direct tumor cell killing but also profoundly shapes the tumor immune landscape. The experimental workflow below outlines a typical in vivo protocol for investigating this synergy.
Figure 2: Experimental Workflow for Evaluating ATRi/RT Synergy. This in vivo workflow assesses tumor control, immune cell infiltration, and ICD biomarkers following combination treatment [83] [84].
Quantitative evidence from preclinical and clinical studies underscores the therapeutic potential of this combination. The table below summarizes key findings on how ATRi augments the efficacy of radiotherapy and immunotherapy.
Table 1: Quantitative Evidence for ATRi + RT ± ICB Combination Therapy
| Experimental Context | Key Findings | Reference |
|---|---|---|
| LLC & A549 Mouse Models (ATRi + Ablative RT) | ATRi enhanced radiation-induced DAMPs (HMGB1), activated the cGAS-STING pathway, and inhibited PD-L1 upregulation. Combined treatment improved survival. | [83] |
| HNSCC Preclinical Models (MOC1, mEER) | ATRi/RT increased infiltration of activated NKG2A+PD-1+ CD8+ T cells in TME. Subsequent NKG2A/PD-L1 blockade post-ATRi/RT drove robust antitumor response. | [84] |
| PATRIOT Phase 1b Trial (Ceralasertib + Palliative RT) | 80 mg BD ceralasertib + RT (30 Gy/15 fx) was tolerable. Best response in irradiated lesions: 9% CR, 26% PR, 57% SD. Increased T/NK cell activation in peripheral blood. | [85] |
| Human Cancer Cell Lines (SW900, H1975, etc.) | Co-treatment with RT + ATRi (VE822/AZD6738) significantly increased extracellular HMGB1 release at 72h, a key ICD hallmark. | [54] |
Experimental Protocols
Protocol 1: Assessing Hallmarks of Immunogenic Cell Death In Vitro
This protocol details the methodology for quantifying key ICD biomarkers—ecto-CRT, ATP, and HMGB1—in human cancer cell lines treated with radiation and ATR inhibitors [54].
Materials and Reagents
- Cell Lines: Human cancer cell lines (e.g., U2OS osteosarcoma, H460, SW900, H1975 NSCLC).
- Treatments:
- ATR inhibitors: VE822 (Berzosertib) dissolved in DMSO, typically used at 250 nM; AZD6738 (Ceralasertib) dissolved in DMSO, typically used at 1250 nM.
- Radiation source: X-ray irradiator.
- Pan-caspase inhibitor: e.g., Z-VAD-FMK, dissolved in DMSO.
- Assay Kits:
- CellTiter-Glo Luminescent Cell Viability Assay (Promega) for ATP quantification.
- Materials for immunoblotting (SDS-PAGE, transfer apparatus) or ELISA for HMGB1 detection.
- Flow cytometry buffers (PBS, FACS buffer with serum, fixation solution).
Step-by-Step Procedure
Cell Seeding and Treatment:
- Seed cells in appropriate culture plates and allow to adhere overnight.
- Pre-treat cells with ATRi (or vehicle control) for 1-2 hours.
- Irradiate plates at the desired dose (e.g., 5 Gy). Include mock-irradiated controls.
- For caspase inhibition studies, add pan-caspase inhibitor (e.g., Z-VAD-FMK) 1 hour prior to other treatments.
Ecto-Calreticulin Measurement by Flow Cytometry (at 24-72h post-treatment):
- Harvesting: Gently detach cells using non-enzymatic cell dissociation buffer to preserve surface proteins. Collect cells and wash with cold PBS.
- Staining: Resuspend cell pellet in FACS buffer (PBS + 0.3-1% BSA or serum). Incubate with primary anti-calreticulin antibody (e.g., Abcam ab2907) for 1 hour at 4°C. Do not permeabilize the cells.
- Detection: Wash cells twice with FACS buffer. Incubate with a fluorophore-conjugated secondary antibody for 30-45 minutes at 4°C in the dark.
- Analysis: Wash and resuspend cells in FACS buffer. Analyze using a flow cytometer. Include isotype controls and unstained controls for gating. For increased accuracy, normalize signals to a barcoded control sample [54].
ATP Secretion Quantification (at 48h post-treatment):
- Collection: Collect conditioned cell culture medium.
- Measurement: Following the manufacturer's instructions for the CellTiter-Glo assay, mix equal volumes of medium and the single-one-step reagent in an opaque-walled multiwell plate.
- Readout: Measure luminescence using a plate-reading luminometer. The signal is proportional to the amount of ATP present [54].
HMGB1 Release Measurement by Immunoblotting (at 72h post-treatment):
- Collection: Collect conditioned cell culture medium. Centrifuge to remove any floating cells or debris.
- Concentration (Optional): Concentrate the medium using centrifugal filter devices if HMGB1 concentration is low.
- Immunoblotting: Separate proteins by SDS-PAGE and transfer to a PVDF membrane. Probe the membrane with an anti-HMGB1 antibody (e.g., Cell Signaling Technology #6893). Detect using a standard ECL method. Include a medium-only control to account for background HMGB1 [54].
Data Interpretation
- A successful ICD-inducing combination (RT + ATRi) should yield a significant increase in ecto-CRT, extracellular ATP, and HMGB1 compared to single-agent or control treatments.
- Caspase inhibition typically suppresses HMGB1 release but may enhance ATP secretion, indicating the dual role of caspases in regulating ICD [54].
Protocol 2: In Vivo Evaluation of Antitumor Immunity and Immune Memory
This protocol describes the use of syngeneic mouse models to evaluate the efficacy of the triple-combination therapy and its impact on the tumor immune microenvironment [83] [84].
Materials and Reagents
- Animals: Immunocompetent mice (e.g., C57BL/6).
- Tumor Cells: Syngeneic tumor cell lines (e.g., Lewis Lung Carcinoma (LLC) for lung cancer models, MOC1/mEER for HNSCC models).
- Treatments:
- ATR inhibitor: e.g., Berzosertib, prepared for oral gavage (20 mg/kg/day).
- Radiation source: Small animal irradiator with capability for focal tumor irradiation.
- Immune checkpoint inhibitors: Anti-PD-L1 antibody (e.g., clone 10F.9G2), anti-NKG2A antibody, prepared for intraperitoneal injection.
- Flow Cytometry Reagents: Antibodies against mouse CD45, CD3, CD8, CD4, CD11c, MHC-II, NKG2A, PD-1, IFN-γ, Granzyme B, and viability dye.
Step-by-Step Procedure
Tumor Establishment:
- Inoculate mice subcutaneously in the flank with 2-4 x 10^5 syngeneic tumor cells. Allow tumors to establish to a palpable size (~35-50 mm³).
Treatment Regimen:
- ATRi Administration: Administer ATRi (e.g., 20 mg/kg Berzosertib) via oral gavage daily for 5 days.
- Radiotherapy: On days 1 and 2 of ATRi treatment, administer focal radiotherapy to the tumor (e.g., 12 Gy per fraction). Shield the rest of the animal to minimize systemic effects.
- Immunotherapy: Administer ICB (e.g., 200 µg anti-PD-L1 and/or anti-NKG2A) intraperitoneally on days 4, 7, and 10 post-tumor inoculation. Note: The sequence is critical; ICB is often administered after the cytotoxic insult [84].
Endpoint Analysis:
- Tumor Monitoring: Measure tumor volumes 2-3 times per week using calipers. Calculate volume as (length x width²)/2. Monitor animal survival.
- Tumor Infiltrating Lymphocyte (TIL) Analysis:
- Harvest tumors at endpoint (e.g., day 18-20).
- Prepare single-cell suspensions by mechanically dissociating tumors and filtering through a 70-µm strainer.
- Stain the single-cell suspension with surface antibodies against immune cell markers (e.g., CD45, CD3, CD8, CD4, NKG2A, PD-1).
- For functional analysis, re-stimulate cells with a cell stimulation cocktail for 6 hours, then stain intracellularly for IFN-γ and Granzyme B.
- Analyze by flow cytometry to quantify immune cell populations and their activation states [84].
- Dendritic Cell and Phagocytosis Analysis:
- Harvest draining lymph nodes and prepare single-cell suspensions.
- Stain for dendritic cell markers (CD11c, MHC-II, CD103) to assess antigen presentation capacity [42].
- For in vivo phagocytosis assays, pre-stain tumor cells with Cell Tracker dye, treat with an ICD inducer (e.g., doxorubicin), and inject into mouse spleens. After 2 hours, analyze CD11c+ splenocytes for uptake of labeled cells by flow cytometry [42].
Data Interpretation
- Effective combination therapy should result in significant tumor growth delay and improved survival.
- Flow cytometry analysis should reveal increased infiltration of activated (CD69+, GZMB+) CD8+ T cells and a higher frequency of NKG2A+PD-1+ T-cell populations in the ATRi/RT/ICB group.
- Successful ICD is further supported by enhanced antigen presentation in dendritic cells within draining lymph nodes.
The Scientist's Toolkit: Key Research Reagents
Table 2: Essential Reagents for Investigating ATRi/RT-Induced ICD
| Reagent / Assay | Function / Application | Specific Examples |
|---|---|---|
| ATR Inhibitors | Potent and selective kinase inhibitors used to sensitize tumors to DNA-damaging agents like RT. | Ceralasertib (AZD6738), Berzosertib (VE-822, M6620), ATRN-119 [83] [86] [85]. |
| Immune Checkpoint Blockade Antibodies | Block inhibitory receptors on T cells or their ligands on tumor/immune cells to reverse T-cell exhaustion. | Anti-PD-1, Anti-PD-L1 (e.g., clone 10F.9G2), Anti-NKG2A (e.g., Monalizumab) [83] [84]. |
| Anti-Calreticulin Antibodies | Detect surface-exposed CRT (ecto-CRT) via flow cytometry or immunofluorescence; critical for quantifying ICD. | Anti-CRT (e.g., Abcam ab2907, EPR3924); use on non-permeabilized cells [82] [42]. |
| Caspase Inhibitors | Pharmacological tools to dissect the contribution of apoptotic caspases to ICD hallmarks. | Pan-caspase inhibitor Z-VAD-FMK; Caspase-8 specific inhibitor Z-IETD-FMK [54] [42]. |
| Cell Death & Viability Assays | Quantify ATP release (ICD hallmark) and overall cell viability/cytotoxicity. | CellTiter-Glo Luminescent Cell Viability Assay [54]. |
| DAMP Detection Assays | Measure the release of key ICD molecules such as HMGB1. | HMGB1 ELISA Kits; Immunoblotting for HMGB1 from conditioned medium [54]. |
The strategic combination of ATR inhibitors with radiotherapy and immune checkpoint blockade represents a highly promising approach for converting tumors into sites of potent, in situ vaccination. The efficacy of this regimen is fundamentally linked to its capacity to induce immunogenic cell death, characterized by the critical exposure of calreticulin and other DAMPs. As detailed in these protocols, the molecular pathway governing CRT exposure is dependent on an integrated ER stress and caspase-8 activation cascade [30] [42]. Researchers are equipped to rigorously quantify ICD biomarkers and antitumor immunity, providing a strong scientific foundation for the continued clinical development of these synergistic combinations.
Conclusion
The precise interplay between caspase activation and calreticulin exposure is a cornerstone of immunogenic cell death, transforming tumor cells into a therapeutic vaccine that stimulates durable antitumor immunity. This synthesis confirms that executioner caspases are not merely cell death executors but critical regulators of immunogenic DAMP pathways, while CALR exposure serves as a vital and quantifiable biomarker for ICD. Future research must focus on overcoming the immunosuppressive tumor microenvironment and the paradoxical effects of soluble CALR. The integration of real-time biosensors, multimodal combination therapies, and patient-specific biomarker profiling paves the way for next-generation treatments that harness the immune system to achieve long-term cancer control. The translation of these mechanistic insights into clinical practice holds immense promise for improving patient outcomes across a spectrum of malignancies.
References
- 1. Consensus guidelines for the detection of immunogenic cell ... [https://pmc.ncbi.nlm.nih.gov/articles/PMC4292729/]
- 2. Calreticulin exposure dictates the immunogenicity of ... [https://www.nature.com/articles/nm1523]
- 3. Calreticulin exposure dictates the immunogenicity of ... [https://pubmed.ncbi.nlm.nih.gov/17187072/]
- 4. Imaging Calreticulin for Early Detection of Immunogenic Cell ... [https://jnm.snmjournals.org/content/62/7/956]
- 5. structural and molecular mechanisms and functions in cell ... [https://www.nature.com/articles/s41421-025-00791-3]
- 6. Caspases in Cell Death, Inflammation, and Disease [https://www.sciencedirect.com/science/article/pii/S1074761319302407]
- 7. Calreticulin in the immune system: ins and outs - PMC [https://pmc.ncbi.nlm.nih.gov/articles/PMC4117402/]
- 8. Caspase Functions in Cell Death and Disease - PMC [https://pmc.ncbi.nlm.nih.gov/articles/PMC3683896/]
- 9. Apoptosis, Pyroptosis, and Necrosis: Mechanistic Description ... [https://pmc.ncbi.nlm.nih.gov/articles/PMC1087413/]
- 10. Apoptosis, necroptosis, and pyroptosis as alternative cell ... [https://www.sciencedirect.com/science/article/pii/S0304419X23001737]
- 11. Damage-associated molecular pattern (DAMP) activation ... [https://pmc.ncbi.nlm.nih.gov/articles/PMC7779254/]
- 12. Regulation of immunogenic cell death and potential ... [https://www.frontiersin.org/journals/immunology/articles/10.3389/fimmu.2025.1571212/full]
- 13. Integrated real-time imaging of executioner caspase dynamics ... [https://pmc.ncbi.nlm.nih.gov/articles/PMC12328661/]
- 14. Immunogenic Cell Death as a Target for Combination ... [https://pmc.ncbi.nlm.nih.gov/articles/PMC12248260/]
- 15. A comparative study of apoptosis, pyroptosis, necroptosis, and ... [https://journals.plos.org/plosone/article?id=10.1371/journal.pone.0299577]
- 16. Detection of immunogenic cell death and its relevance for ... [https://www.nature.com/articles/s41419-020-03221-2]
- 17. A novel pathway combining calreticulin exposure and ATP ... [https://pmc.ncbi.nlm.nih.gov/articles/PMC3298003/]
- 18. Regulation of immunogenic cell death and potential ... [https://pmc.ncbi.nlm.nih.gov/articles/PMC11979251/]
- 19. Hypericin photoactivation induces triple-negative breast ... [https://www.sciencedirect.com/science/article/pii/S2090123225000591]
- 20. Immunogenic calreticulin exposure occurs through a ... [https://www.nature.com/articles/cdd201373]
- 21. Integrated real-time imaging of executioner caspase ... [https://www.nature.com/articles/s41420-025-02662-y]
- 22. eIF2α phosphorylation is pathognomonic for immunogenic ... [https://pubmed.ncbi.nlm.nih.gov/29358668/]
- 23. eIF2α phosphorylation as a biomarker of immunogenic cell ... [https://www.sciencedirect.com/science/article/abs/pii/S1044579X15000127]
- 24. Vesicular trafficking and cell-cell communication in ... [https://pmc.ncbi.nlm.nih.gov/articles/PMC12183288/]
- 25. Phosphorylation of eukaryotic initiation factor-2α (eIF2α) in ... [https://www.nature.com/articles/s41419-020-2642-6]
- 26. The structural basis of translational control by eIF2 ... [https://www.nature.com/articles/s41467-019-10167-3]
- 27. GCN2 enhances host survival and drives eIF2α ... [https://pmc.ncbi.nlm.nih.gov/articles/PMC12548416/]
- 28. Datopotamab deruxtecan induces hallmarks of ... [https://pubmed.ncbi.nlm.nih.gov/40800161/]
- 29. Caspases in cell death, inflammation and disease - PMC [https://pmc.ncbi.nlm.nih.gov/articles/PMC6611727/]
- 30. Mechanisms of pre-apoptotic calreticulin exposure in ... [https://pmc.ncbi.nlm.nih.gov/articles/PMC2657583/]
- 31. Making the head: Caspases in life and death [https://www.frontiersin.org/journals/cell-and-developmental-biology/articles/10.3389/fcell.2022.1075751/full]
- 32. Caspases as master regulators of programmed cell death [https://www.nature.com/articles/s12276-025-01470-9]
- 33. Integrated real-time imaging of executioner caspase ... [https://pubmed.ncbi.nlm.nih.gov/40769969/]
- 34. Engineering Calreticulin-Targeting Monobodies to Detect ... [https://www.mdpi.com/2072-6694/13/11/2801]
- 35. Flow Cytometry Protocol | Abcam [https://www.abcam.com/en-us/technical-resources/protocols/flow-cytometry-for-intracellular-and-extracellular-targets]
- 36. Flow Cytometry Protocols [https://www.bdbiosciences.com/en-us/resources/protocols/flow-cytometry]
- 37. Immunofluorescence staining of live lymph node tissue slices [https://pmc.ncbi.nlm.nih.gov/articles/PMC6322934/]
- 38. Quantitative Flow Cytometry Measurements | NIST [https://www.nist.gov/programs-projects/quantitative-flow-cytometry-measurements]
- 39. Immunofluorescence Protocol with Formaldehyde Fixation [https://www.cellsignal.com/learn-and-support/protocols/protocol-if?srsltid=AfmBOoqlyIJ5-4ouUvDYdxSo1ymK9wBptmsu7FbCcr6PHyfj0ma02NRm]
- 40. Combining immune checkpoint blockade with ATP-based ... [https://www.sciencedirect.com/science/article/pii/S2211383522002167]
- 41. Distinct roles in phagocytosis of the early and late ... [https://www.sciencedirect.com/science/article/pii/S2405580822000231]
- 42. Caspase-8 contributes to an immuno-hot microenvironment by ... [https://ehoonline.biomedcentral.com/articles/10.1186/s40164-022-00371-1]
- 43. High-throughput screening system for immunogenic cell ... [https://pubmed.ncbi.nlm.nih.gov/40701022/]
- 44. High-Content Analysis (Quantitative Imaging) Information [https://www.thermofisher.com/us/en/home/life-science/cell-analysis/cell-analysis-learning-center/cell-imaging-information/high-content-analysis-information.html]
- 45. A high-content image-based method for quantitatively ... [https://www.nature.com/articles/srep29752]
- 46. Immunogenicity of cell death and cancer immunotherapy ... [https://www.nature.com/articles/s41423-024-01245-8]
- 47. Calreticulin—Multifunctional Chaperone in Immunogenic Cell ... [https://pmc.ncbi.nlm.nih.gov/articles/PMC7827772/]
- 48. Metal-based immunogenic cell death inducers for cancer ... [https://pubs.rsc.org/en/content/articlehtml/2025/sc/d4sc08495k]
- 49. Cancer cell-selective induction of mitochondrial stress and ... [https://translational-medicine.biomedcentral.com/articles/10.1186/s12967-024-05739-x]
- 50. Novel Diffuse Midline Glioma‐on‐Chip Recapitulating Tumor ... [https://pmc.ncbi.nlm.nih.gov/articles/PMC12614140/]
- 51. Challenges in the Evolving Role of Calreticulin as a Promising ... [https://pmc.ncbi.nlm.nih.gov/articles/PMC12606764/]
- 52. Mutant Calreticulin in MPN: Mechanistic Insights and ... [https://pmc.ncbi.nlm.nih.gov/articles/PMC12085081/]
- 53. Cell-Surface Calreticulin Initiates Clearance of Viable or ... [https://www.sciencedirect.com/science/article/pii/S009286740500869X]
- 54. Immunogenic cell death after combined treatment with ... [https://www.frontiersin.org/journals/immunology/articles/10.3389/fimmu.2023.1138920/full]
- 55. Oncogenic CALR mutant C-terminus mediates dual ... [https://www.nature.com/articles/s41467-023-37277-3]
- 56. Combinatorial Strategies for the Induction of Immunogenic ... [https://www.frontiersin.org/journals/immunology/articles/10.3389/fimmu.2015.00187/full]
- 57. Schweinfurthin induces ICD without ER stress and caspase ... [https://pure.psu.edu/en/publications/schweinfurthin-induces-icd-without-er-stress-and-caspase-activati/]
- 58. Quantitative analysis of caspase-3 activation by fitting ... [https://www.sciencedirect.com/science/article/abs/pii/S0968432809001103]
- 59. Inflammatory cell death and leukemia treatment [https://www.sciencedirect.com/science/article/abs/pii/S1040842825002975]
- 60. Using natural products to promote caspase-8-dependent ... [https://pmc.ncbi.nlm.nih.gov/articles/PMC11029654/]
- 61. Immunogenic calreticulin exposure occurs through a ... [https://pmc.ncbi.nlm.nih.gov/articles/PMC3857625/]
- 62. Emerging phagocytosis checkpoints in cancer ... - Nature [https://www.nature.com/articles/s41392-023-01365-z]
- 63. Harnessing and Enhancing Macrophage Phagocytosis for ... [https://www.frontiersin.org/journals/immunology/articles/10.3389/fimmu.2021.635173/full]
- 64. Assessment of phagocytic activity in live macrophages ... [https://pmc.ncbi.nlm.nih.gov/articles/PMC6994062/]
- 65. The cornerstone of glioblastoma treatment? - PMC [https://pmc.ncbi.nlm.nih.gov/articles/PMC12448694/]
- 66. Mechanisms of NLRP3 activation and inhibition elucidated ... [https://www.nature.com/articles/s41590-025-02088-9]
- 67. HMGB2-induced calreticulin translocation required for ... [https://www.nature.com/articles/s42003-024-06930-y]
- 68. Surface- exposed and soluble calreticulin : conflicting biomarkers for... [https://pmc.ncbi.nlm.nih.gov/articles/PMC7458660/]
- 69. Calreticulin exposure on malignant blasts predicts a cellular anticancer immune response in patients with acute myeloid leukemia | Cell Death & Disease [https://www.nature.com/articles/cddis201082]
- 70. CALR-TLR4 Complex Inhibits Non-Small Cell Lung Cancer ... [https://pmc.ncbi.nlm.nih.gov/articles/PMC8517398/]
- 71. Calreticulin exposure correlates with robust adaptive antitumor immunity and favorable prognosis in ovarian carcinoma patients | Journal for ImmunoTherapy of Cancer | Full Text [https://jitc.biomedcentral.com/articles/10.1186/s40425-019-0781-z]
- 72. Immunogenic Cell Death: An Emerging Target in ... [https://pmc.ncbi.nlm.nih.gov/articles/PMC9563749/]
- 73. Schweinfurthin induces ICD without ER stress and caspase ... [https://pubmed.ncbi.nlm.nih.gov/35936984/]
- 74. Immunogenic dying cells elicit potent anti-tumor T ... [https://link.springer.com/article/10.1007/s00432-025-06087-z]
- 75. Calreticulin exposure induced by anticancer drugs is ... [https://www.sciencedirect.com/science/article/abs/pii/S0006291X24012014]
- 76. Calreticulin as a prognostic biomarker and correlated with ... [https://pmc.ncbi.nlm.nih.gov/articles/PMC9633671/]
- 77. Targeting Calreticulin (CALR) in Tumors [https://www.sciencedirect.com/science/article/abs/pii/S0223523425008876]
- 78. Role and clinical significance of immunogenic cell death ... [https://www.sciencedirect.com/science/article/pii/S0753332223013070]
- 79. An evaluation of the tumor microenvironment through ... [https://elifesciences.org/articles/95326]
- 80. Beyond ELISA: the future of biomarker validation [https://www.drugtargetreview.com/article/154316/beyond-elisa-the-future-of-biomarker-validation/]
- 81. Use of Biomarkers in Drug Development for Regulatory ... [https://pmc.ncbi.nlm.nih.gov/articles/PMC12489174/]
- 82. Frontiers | The Ever-Expanding Immunomodulatory Role of ... [https://www.frontiersin.org/journals/oncology/articles/10.3389/fonc.2015.00035/full]
- 83. Combination of ataxia telangiectasia and Rad3-related ... [https://pmc.ncbi.nlm.nih.gov/articles/PMC11531452/]
- 84. Sculpting the tumour microenvironment by combining ... [https://www.nature.com/articles/s41467-024-51236-6]
- 85. Tumor control and immune activation through palliative ... [https://www.nature.com/articles/s41467-025-62249-0]
- 86. Aprea Therapeutics Establishes Recommended Phase 2 ... [https://ir.aprea.com/news-releases/news-release-details/aprea-therapeutics-establishes-recommended-phase-2-dose-rp2d]