Cytochrome c Release in Intrinsic Apoptosis: Molecular Mechanisms, Regulation, and Therapeutic Implications
This article provides a comprehensive analysis of the cytochrome c release mechanism within the intrinsic apoptotic pathway, tailored for researchers, scientists, and drug development professionals.
Cytochrome c Release in Intrinsic Apoptosis: Molecular Mechanisms, Regulation, and Therapeutic Implications
Abstract
This article provides a comprehensive analysis of the cytochrome c release mechanism within the intrinsic apoptotic pathway, tailored for researchers, scientists, and drug development professionals. It synthesizes current understanding of the molecular events initiating mitochondrial outer membrane permeabilization (MOMP), the pivotal role of BCL-2 family proteins, and the consequences of cytochrome c release for apoptosome formation and caspase activation. The scope extends to methodological approaches for detecting and quantifying cytochrome c release, addresses common challenges in experimental models, and explores the pathway's validation across different biological systems. Finally, the discussion covers the significant implications for targeting this pathway in cancer therapy and other human diseases, providing a foundational resource for both basic research and translational applications.
The Fundamental Biology of Cytochrome c Release: From Basic Localization to Apoptotic Trigger
Cytochrome c is a multifunctional mitochondrial hemoprotein that plays two quintessential roles in cellular fate: it is indispensable for electron transport in aerobic respiration and acts as a pivotal signaling molecule in the initiation of intrinsic apoptosis. This whitepaper delves into the sophisticated mechanisms governing cytochrome c's release from mitochondria, a decisive event in the intrinsic apoptotic pathway. We examine the protein's structural domains that facilitate its dual functions, the key regulatory checkpoints involving BCL-2 family proteins, and the subsequent formation of the apoptosome complex. Furthermore, this review synthesizes current experimental methodologies for studying cytochrome c release and discusses the therapeutic implications of targeting this pathway in drug development, particularly for cancer therapeutics where apoptotic evasion is a hallmark of disease.
Cytochrome c (Cyt c) is a nuclear-encoded, mitochondrial hemoprotein that serves as a critical nexus in cellular homeostasis, embodying a dual function that is as paradoxical as it is essential [1]. Its primary and historical role is as an essential electron carrier in the mitochondrial electron transport chain (ETC), where it shuttles electrons between Complex III (coenzyme Q-cytochrome c reductase) and Complex IV (cytochrome c oxidase) to facilitate oxidative phosphorylation (OxPhos) and adenosine triphosphate (ATP) production [2] [3] [4]. This function is vital for life, as evidenced by the embryonic lethality in cytochrome c-knockout mice during mid-gestation, coinciding with the metabolic shift to aerobic energy production [1].
In a contrasting role, cytochrome c is a central signaling molecule in programmed cell death. In response to diverse cellular stress signals, cytochrome c is released from the mitochondrial intermembrane space into the cytosol, where it triggers the activation of the caspase cascade via apoptosome formation [5] [6] [7]. This process is indispensable for the elimination of damaged or superfluous cells, and its dysregulation is a hallmark of numerous diseases, including cancer and neurodegenerative disorders [5] [1]. This whitepaper will deconstruct the mechanisms of cytochrome c's release and apoptotic activity, framing it within the broader context of intrinsic pathway research.
Structural Determinants of Dual Functionality
The ability of cytochrome c to perform its two distinct roles is encoded in its highly conserved structure. It is a small (104 amino acids in mammals), water-soluble protein with a high isoelectric point (pI ~9.6), owing to its abundance of lysine residues [3] [1].
- Heme Group and Electron Transfer: The core of its function lies in the heme c group, a prosthetic group covalently attached to the protein backbone via thioether bonds with Cys14 and Cys17 [7] [1]. The heme iron is coordinated by His18 and Met80, which are critical for its redox activity [1]. This structure allows the iron to oscillate between ferrous (Fe²⁺) and ferric (Fe³⁺) states, facilitating single electron transfer [2] [4]. Key lysine residues (e.g., Lys8, Lys13, Lys27, Lys72, Lys86, Lys87) surrounding the solvent-exposed heme edge are essential for electrostatic interactions with its redox partners, cytochrome c1 (Complex III) and cytochrome c oxidase (Complex IV) [7].
- Apoptotic Signaling Interface: The same lysine-rich domain is also crucial for its apoptotic function. Structural studies, including cryo-electron microscopy, have revealed that specific cytochrome c residues (including Lys7, Lys25, Trp59, Glu62, Lys72, and Ile75) interact with Apoptotic Protease Activating Factor 1 (Apaf-1) [7]. The binding of cytochrome c to Apaf-1 is a critical step that relieves Apaf-1's autoinhibition, enabling apoptosome assembly. Notably, the K72A mutation in cytochrome c ablates its ability to activate Apaf-1 while preserving its electron transfer function, demonstrating a clear structural and functional segregation of its two roles [7].
Table 1: Key Structural Features of Cytochrome c and Their Functional Implications
| Structural Feature | Description | Functional Role |
|---|---|---|
| Heme c Group | Iron porphyrin cofactor; iron coordinated by His18 and Met80 [1] | Redox activity; electron shuttling between Complex III and IV [2] |
| CXXCH Motif | Highly conserved sequence (Cys14, Cys17, His18) [3] [7] | Covalent heme attachment via thioether bonds [7] |
| Lysine-Rich Patch | Cluster of positively charged residues (e.g., Lys8, Lys13, Lys72) [7] | Electrostatic docking with respiratory complexes and Apaf-1 [7] |
| Evolutionary Conservation | 34 of 104 amino acids are invariant across species [3] | Underpins essential, non-redundant functions in respiration and apoptosis [4] |
The Intrinsic Apoptotic Pathway: Cytochrome c Release as a Point of No Return
The intrinsic apoptotic pathway is initiated by internal cellular stressors, such as DNA damage, oxidative stress, or growth factor withdrawal. A key event in this pathway is the mitochondrial outer membrane permeabilization (MOMP), which allows cytochrome c to escape into the cytosol.
Regulation by BCL-2 Family Proteins
The permeabilization of the mitochondrial outer membrane is tightly regulated by the BCL-2 protein family, which consists of both pro-apoptotic and anti-apoptotic members [8] [6].
- Pro-apoptotic Effectors: Proteins like BAX and BAK are the ultimate executioners of MOMP. In response to apoptotic signals, they undergo conformational activation, translocate to the mitochondria, and oligomerize to form pores in the outer mitochondrial membrane [8] [6]. Cells deficient in both Bax and Bak are highly resistant to intrinsic apoptotic stimuli and cytochrome c release [6].
- Anti-apoptotic Guardians: Proteins like Bcl-2 and Bcl-xL reside on the outer mitochondrial membrane and act to restrain BAX and BAK, thereby preventing MOMP and cytochrome c release [6]. Overexpression of Bcl-2/Bcl-xL confers resistance to apoptosis, as demonstrated in etoposide-treated Jurkat cell studies [6].
- Sensitizers and Activators: BH3-only proteins (e.g., BIM, BID, PUMA) act as sentinels for cellular damage. They can either directly activate BAX/BAK or neutralize the anti-apoptotic Bcl-2 proteins, thus tipping the balance towards apoptosis [8] [6].
Cardiolipin Peroxidation and Release
A critical preparatory step for cytochrome c release is its dissociation from the inner mitochondrial membrane. Cytochrome c is loosely associated with the inner membrane via electrostatic interactions with the phospholipid cardiolipin [5] [3]. During apoptosis induction, cytochrome c exhibits a peroxidase activity that catalyzes the oxidation of cardiolipin [5] [1]. Oxidation of cardiolipin reduces its negative charge and binding affinity for the positively charged cytochrome c, liberating the protein into the intermembrane space and facilitating its subsequent release through BAX/BAK pores [5] [1].
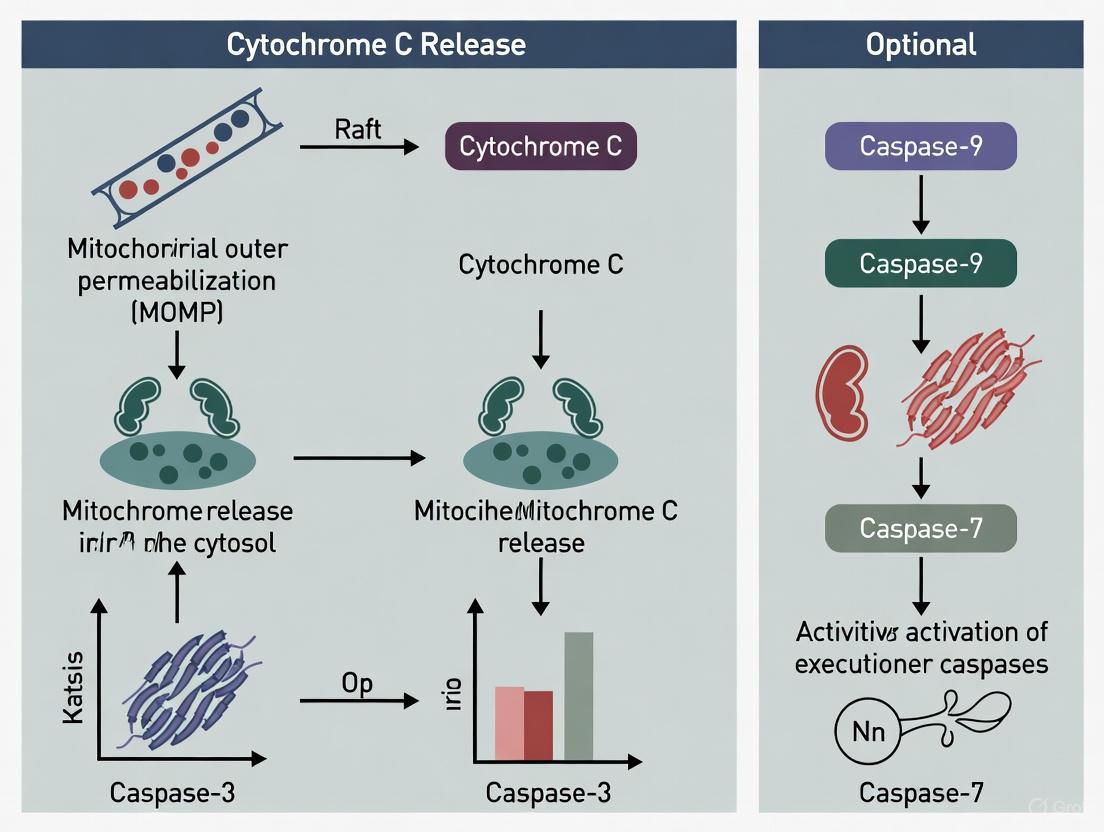
The following diagram illustrates the sequence of events in the intrinsic apoptotic pathway, culminating in cytochrome c release and apoptosome-mediated caspase activation.
Experimental Methodologies for Studying Cytochrome c Release
Investigating the dynamics of cytochrome c release and its functional consequences requires a suite of well-established biochemical and cell biological techniques. The following section details key experimental protocols.
Subcellular Fractionation and Immunoblotting
This classic biochemical approach is used to directly monitor the translocation of cytochrome c from mitochondria to the cytosol.
- Workflow:
- Apoptosis Induction: Treat cells (e.g., Jurkat T-lymphocytes) with an intrinsic apoptotic stimulus such as etoposide (e.g., 10 μM) [6].
- Cell Permeabilization: Harvest cells and subject them to gentle, digitonin-based permeabilization. Digitonin selectively perforates the cholesterol-rich plasma membrane while leaving intracellular organelles, including mitochondria, intact [6].
- Fractionation: Centrifuge the permeabilized cell suspension. The supernatant (S) contains the cytosolic fraction, while the pellet (P) contains the heavy membrane fraction (enriched with mitochondria) [6].
- Western Blot Analysis: Resolve the proteins from both fractions by SDS-PAGE and perform immunoblotting using antibodies specific for cytochrome c. The appearance of cytochrome c in the cytosolic fraction is a definitive marker of its release. Controls should include markers for compartment purity, such as cytochrome c oxidase (mitochondria) and tubulin or lactate dehydrogenase (cytosol) [6].
Flow Cytometry for Apoptotic Phenotypes
While not a direct measure of cytochrome c, flow cytometry is used to quantify downstream apoptotic events that confirm the functional consequence of its release.
- Annexin V/Propidium Iodide (PI) Staining: This assay detects phosphatidylserine externalization (an early apoptotic event) and loss of plasma membrane integrity (a late apoptotic/necrotic event). Cells are stained with annexin V-FITC and PI, and analyzed by flow cytometry to distinguish live (annexin V⁻/PI⁻), early apoptotic (annexin V⁺/PI⁻), and late apoptotic/necrotic (annexin V⁺/PI⁺) populations [6] [9].
- Mitochondrial Membrane Potential (ΔΨm) Measurement: The fluorescent dye DiIC1(5) is a potentiometric probe that accumulates in polarized mitochondria. A collapse in ΔΨm, which often accompanies MOMP and cytochrome c release, results in a loss of fluorescence, detectable by flow cytometry [6].
Table 2: Key Research Reagents for Studying Cytochrome c in Apoptosis
| Reagent / Tool | Function / Application | Example in Research |
|---|---|---|
| Etoposide | DNA-damaging chemotherapeutic agent; induces intrinsic apoptosis [6] | Standard stimulus for studying cytochrome c release in Jurkat cells [6] |
| Digitonin | Mild detergent for selective plasma membrane permeabilization [6] | Used in subcellular fractionation to isolate cytosolic contents [6] |
| Anti-Cytochrome c Antibody | Immunodetection of cytochrome c localization [6] | Western blotting of cytosolic and mitochondrial fractions [6] |
| BAX/BAK deficient cells | Genetic models to study necessity of effector proteins [6] | Demonstrates absolute requirement for MOMP and cytochrome c release [6] |
| Bcl-2/Bcl-xL overexpression | Genetic model of anti-apoptotic signaling [6] | Confirms inhibition of cytochrome c release and apoptosis resistance [6] |
| Caspase Inhibitors (e.g., z-VAD-fmk) | Pan-caspase inhibitor [8] | Used to dissect caspase-dependent and -independent aspects of cytochrome c-induced death [8] |
Yeast as a Model Organism
The baker's yeast Saccharomyces cerevisiae has proven to be a powerful tool for elucidating the conserved, core mechanisms of cytochrome c-mediated apoptosis.
- Protocol for Acetic Acid-Induced PCD: Stationary-phase yeast cells are resuspended in treatment medium at pH 3.0 and exposed to acetic acid (e.g., 140 mM) for 200 minutes [9]. Viability is assessed by colony-forming unit (CFU) counts.
- Readouts: In this model, cytochrome c release can be detected by immunoblotting of subcellular fractions. Associated events like reactive oxygen species (ROS) production, depletion of cytochrome c oxidase, and loss of ΔΨm can be measured polarographically and spectroscopically [9]. The use of yeast mutants (e.g., ρ⁰ strains lacking mitochondrial DNA) provides genetic evidence for the mitochondria-dependent nature of the process [9].
The experimental workflow for a comprehensive analysis integrating several of these techniques is outlined below.
Implications for Drug Development and Disease Therapeutics
The central role of cytochrome c release in apoptosis makes it an attractive target for therapeutic intervention, especially in oncology.
- Cancer and Apoptotic Evasion: Many cancers exhibit reduced levels of cytochrome c or impaired release mechanisms, contributing to apoptotic resistance and tumor survival [5]. For instance, lower cytochrome c levels in advanced glioma stages correlate with poorer prognosis [5]. Restoring cytochrome c function or sensitizing cells to its release is a key therapeutic strategy.
- Targeting Regulatory Nodes: Intense research focuses on developing BH3-mimetics, small molecules that inhibit anti-apoptotic Bcl-2 proteins (like Bcl-2 itself or Bcl-xL) [7]. By neutralizing these guardians, BH3-mimetics promote BAX/BAK activation, MOMP, and cytochrome c release, thereby forcing cancerous cells into apoptosis. Drugs like venetoclax (targeting Bcl-2) are clinical validations of this approach.
- Post-Translational Modifications (PTMs): Phosphorylation, acetylation, and nitration of cytochrome c can fine-tune its functions, influencing both electron transport and apoptotic potency [5] [7] [1]. For example, phosphorylation at Tyr48 inhibits apoptosis, effectively turning cytochrome c into an anti-apoptotic switch [3]. Understanding these PTMs offers novel avenues for drug discovery, aiming to modulate cytochrome c's activity rather than just its expression.
Cytochrome c stands as a paradigm of biological efficiency, where a single protein integrates multiple cellular signals to govern the critical decision between life and death. Its dual role is not a contradiction but a sophisticated adaptation: it is the linchpin of aerobic energy production and the messenger of cellular suicide. The precise mechanism of its release from mitochondria, governed by the BCL-2 family and cardiolipin peroxidation, remains a focal point of intrinsic pathway research. Continued elucidation of the regulatory networks controlling cytochrome c, aided by advanced genetic models and detection technologies, holds immense promise for developing targeted therapies that can reinstate apoptotic programs in diseases defined by their absence, such as cancer, and protect vulnerable cells in degenerative conditions.
The BCL-2 protein family serves as the central arbiters of the mitochondrial apoptosis pathway, integrating diverse cellular stress signals to determine cell fate. The pivotal event controlled by this family is the mitochondrial outer membrane permeabilization (MOMP), a decisive step that leads to the release of cytochrome c and other apoptogenic factors from the mitochondrial intermembrane space. Once cytochrome c is released into the cytosol, it triggers the formation of the apoptosome and the subsequent activation of caspase cascades that execute programmed cell death. The critical role of BCL-2 family interactions in regulating cytochrome c release places them at the heart of intrinsic apoptosis research, with profound implications for understanding cancer pathogenesis and developing targeted therapies.
The BCL-2 Family: Architects of Cellular Fate
Structural and Functional Classification
The BCL-2 family consists of evolutionarily conserved proteins that share Bcl-2 homology (BH) domains (BH1-BH4). These proteins are structurally characterized by a globular fold comprising a central hydrophobic α-helix surrounded by amphipathic α-helices, resembling the pore-forming domains of bacterial toxins [10] [11]. Based on their function and domain organization, family members are classified into three principal subgroups:
Table 1: Classification of Principal BCL-2 Family Proteins
| Subgroup | Representative Members | BH Domains | Primary Function |
|---|---|---|---|
| Anti-apoptotic | BCL-2, BCL-xL, BCL-w, MCL-1, A1 | BH1-BH4 | Promote cell survival by inhibiting pro-apoptotic members |
| Pro-apoptotic Effectors | BAX, BAK, BOK | BH1-BH3 | Direct mediators of MOMP |
| BH3-only Sensitizers | BIM, BID, PUMA, BAD, NOXA, BMF, HRK | BH3 only | Stress sensors that initiate or promote apoptosis |
The hydrophobic groove formed by the BH1-BH3 domains on the surface of anti-apoptotic proteins serves as the critical binding site for the BH3 α-helix of pro-apoptotic partners. This interaction is fundamental to the life-death balance maintained by the family [12] [11].
Anti-apoptotic Members: Guardians of Survival
Anti-apoptotic proteins such as BCL-2, BCL-xL, and MCL-1 function as crucial survival factors by preserving mitochondrial membrane integrity. They neutralize pro-apoptotic family members through direct binding, thereby preventing MOMP and cytochrome c release. Gene targeting studies reveal distinct but partially overlapping physiological roles: BCL-2 is essential for the survival of mature lymphocytes and kidney cells, BCL-xL for developing neurons and erythrocytes, and MCL-1 for early embryogenesis and hematopoietic progenitors [12].
Pro-apoptotic Effectors: Executioners of MOMP
BAX and BAK are the essential multidomain pro-apoptotic effectors required for mitochondrial permeabilization. Cells deficient in both BAX and BAK are profoundly resistant to diverse apoptotic stimuli, including the overexpression of BH3-only proteins [12]. In healthy cells, BAX resides predominantly in the cytosol as a monomer, while BAK is constitutively integrated into the mitochondrial membrane. Upon activation by BH3-only proteins, both undergo conformational changes, oligomerize, and form pores that facilitate cytochrome c release [12] [10].
BH3-only Proteins: Sentinels of Cellular Stress
The BH3-only proteins act as specialized sensors that become activated in response to specific intracellular damage signals. For instance, DNA damage induces p53-mediated transcriptional upregulation of PUMA and NOXA, while growth factor withdrawal leads to the activation of BAD [12]. Once activated, they promote apoptosis by binding to and neutralizing anti-apoptotic family members, and in some cases, by directly activating BAX and BAK [12] [13].
Molecular Mechanisms Governing Cytochrome c Release
The Pivotal Role of Cytochrome c
Cytochrome c is a nuclear-encoded hemoprotein normally confined to the mitochondrial intermembrane space, where it functions as an indispensable electron shuttle in the respiratory chain between Complex III and Complex IV [1] [14]. Its release into the cytosol represents a point of commitment in the intrinsic apoptotic pathway. Cytosolic cytochrome c binds to APAF-1, triggering apoptosome formation and the subsequent activation of caspase-9 and the executioner caspase-3 [14].
Mechanisms of Cytochrome c Mobilization and Release
The release of cytochrome c is a tightly regulated, multi-stage process:
- Mobilization from the Inner Membrane: A significant fraction of cytochrome c is electrostatically and hydrophobically bound to the phospholipid cardiolipin in the inner mitochondrial membrane. Detachment, or mobilization, is a prerequisite for its release. This can be facilitated by cardiolipin oxidation, which reduces its affinity for cytochrome c, or by increased cytosolic calcium levels, which weaken their electrostatic interaction [14].
- Translocation through the OMM: The permeabilization of the outer mitochondrial membrane is controlled by BAX and BAK oligomers. The prevailing hypothesis suggests that these oligomers form a pore, the Mitochondrial Apoptosis-induced Channel (MAC), which allows for the diffusion of cytochrome c and other IMS proteins into the cytosol [12] [14]. This model is supported by the structural similarity of BCL-2 family proteins to bacterial pore-forming toxins and the ability of recombinant BAX to form cytochrome c-permeable pores in artificial liposomes [12].
The following diagram illustrates the core signaling pathway through which the BCL-2 family regulates cytochrome c release and apoptosis.
Experimental Approaches for Studying BCL-2 Family Interactions
Research into the BCL-2 family employs a multi-faceted methodological arsenal to decipher complex protein interactions and functional outcomes.
Structural Biology Techniques
X-ray crystallography and NMR spectroscopy have been instrumental in elucidating the three-dimensional structures of multiple BCL-2 family members, including BCL-xL, BCL-2, BAX, and BID [11]. These studies revealed the conserved fold and the critical hydrophobic groove on anti-apoptotic proteins. Furthermore, structures of BCL-xL in complex with BH3 peptides have shown that the BH3 domain binds the groove as an amphipathic α-helix, providing a molecular blueprint for drug discovery efforts [11].
- Protocol Outline: Crystallography of BCL-2 Family Proteins
- Protein Expression & Purification: Recombinant human BCL-2 protein (e.g., BCL-xL) is expressed in E. coli and purified via affinity and size-exclusion chromatography.
- Crystallization: The protein is concentrated and subjected to sparse matrix screening to identify crystallization conditions, often using vapor diffusion methods.
- Data Collection & Structure Solution: X-ray diffraction data is collected at a synchrotron source. The structure is solved by molecular replacement using a known homologous structure.
- Complex Analysis: For co-crystals with BH3 peptides, the peptide is synthesized and soaked into crystals or co-crystallized with the protein.
Analyzing Protein Interactions and MOMP
Surface Plasmon Resonance (SPR) and Isothermal Titration Calorimetry (ITC) are widely used to quantitatively measure the binding affinities (KD) between anti-apoptotic proteins and BH3 peptides or mimetics [12] [15]. To study the functional consequence of these interactions, researchers employ liposome-based assays to reconstitute MOMP in a defined system. Recombinant BAX/BAK is incubated with liposomes mimicking the mitochondrial outer membrane, and cytochrome c release is measured spectrophotometrically or by ELISA [12].
Cellular and Genetic Models
Gene-targeted mice deficient in specific BCL-2 family members have been pivotal in defining their non-redundant physiological functions. For example, bim^-/-^ mice accumulate excess lymphocytes and display resistance to specific apoptotic stimuli, while puma^-/-^ mice are resistant to DNA damage-induced apoptosis [12]. In cellular studies, BH3 profiling is a functional assay that measures mitochondrial priming by challenging permeabilized cells with synthetic BH3 peptides and monitoring membrane potential or cytochrome c release to predict apoptotic sensitivity [15].
Table 2: Key Research Reagents for Studying the BCL-2 Family
| Reagent / Tool | Category | Primary Function in Research |
|---|---|---|
| Recombinant BCL-xL / BCL-2 Protein | Protein | Structural studies (X-ray, NMR) and in vitro binding assays (SPR, ITC). |
| BH3 Peptides (e.g., from BIM, BID) | Peptide | To map interaction sites and measure binding affinity for anti-apoptotic proteins. |
| Liposomes (with mitochondrial lipid composition) | Lipid Vesicle | In vitro reconstitution of MOMP to study pore formation by BAX/BAK. |
| BH3 Mimetics (e.g., Venetoclax, Navitoclax) | Small Molecule Inhibitor | Tool compounds to specifically inhibit anti-apoptotic proteins in cellular and in vivo models. |
| BAX/BAK Double-Knockout Cell Lines | Cellular Model | To definitively establish the requirement of these effectors for intrinsic apoptosis. |
The following workflow diagram maps the key experimental approaches from initial protein study to functional validation.
Therapeutic Targeting of the BCL-2 Family in Human Disease
The pivotal role of the BCL-2 family in controlling apoptosis makes it an attractive target for cancer therapy. BH3 mimetics are a class of small-molecule drugs designed to occupy the hydrophobic groove of anti-apoptotic proteins, thereby disrupting their protective function and freeing pro-apoptotic proteins to trigger apoptosis in malignant cells [15] [13].
Venetoclax (ABT-199), a highly selective BCL-2 inhibitor, has demonstrated remarkable efficacy in the treatment of certain hematological malignancies, such as chronic lymphocytic leukemia (CLL) and acute myeloid leukemia (AML) [15] [13]. Its clinical success validates the mechanism of directly targeting the BCL-2 family to reactivate apoptosis. However, resistance can emerge through various mechanisms, including upregulation of other anti-apoptotic proteins like MCL-1 or mutations in BCL-2 itself (e.g., F104L/C) that reduce drug binding affinity without impairing pro-survival function [13]. These challenges have spurred the development of next-generation mimetics targeting MCL-1 and BCL-xL, as well as combination regimens designed to overcome resistance.
The BCL-2 family operates as an exquisitely regulated signaling hub, interpreting a vast array of intracellular signals to govern the commitment to mitochondrial apoptosis via cytochrome c release. Continued structural and mechanistic research is deepening our understanding of the complex interactions between its members. The successful translation of this knowledge into clinical therapies, exemplified by BH3 mimetics, highlights the profound impact of fundamental apoptosis research. Future efforts will focus on refining these targeted agents, overcoming resistance mechanisms, and expanding their utility across a broader spectrum of cancers.
The intrinsic apoptosis pathway represents a crucial cellular defense mechanism, eliminating damaged or potentially dangerous cells through a mitochondria-dependent process. Central to this pathway is cytochrome c (cyt c), a multifunctional protein that normally resides in the mitochondrial intermembrane space, where it serves as an essential electron carrier in the respiratory chain [5] [14]. Upon reception of potent intracellular stress signals, cyt c is released into the cytosol, where it initiates the assembly of the apoptosome complex, leading to caspase activation and programmed cell death [14] [16].
Understanding the specific molecular triggers that provoke cyt c release is fundamental to cancer biology, neurodegenerative research, and therapeutic development. This technical guide examines the principal intrinsic stimuli—DNA damage, oxidative stress, and metabolic dysfunction—detailing their mechanisms, experimental assessment, and interplay within the context of cyt c-mediated apoptosis. The focused examination of these triggers provides critical insights for manipulating cell death pathways in disease intervention, particularly in cancer treatment where resistance to apoptosis constitutes a hallmark of malignancy [5] [16].
Molecular Triggers of Cytochrome c Release
DNA Damage
DNA damage activates sophisticated sensor networks that ultimately converge on mitochondria to initiate apoptosis. Genotoxic insults from both exogenous sources (e.g., ionizing radiation, chemotherapeutic agents) and endogenous sources (e.g., replication stress, reactive oxygen species) trigger signaling cascades primarily mediated by the p53 tumor suppressor protein [17]. Activated p53 transcribes pro-apoptotic Bcl-2 family proteins, including Bax and Bak, which translocate to mitochondria where they oligomerize and facilitate mitochondrial outer membrane permeabilization (MOMP), enabling cyt c release [14].
The specific type of DNA lesion influences the activation kinetics and magnitude of the apoptotic response. Double-strand breaks typically engage the ATM-Chk2 pathway, while replication stress and single-strand breaks activate ATR-Chk1 signaling. Both pathways stabilize and activate p53, connecting nuclear damage to mitochondrial apoptosis [17]. Additionally, DNA damage can promote cyt c release through p53-independent mechanisms involving direct activation of pro-apoptotic proteins or through metabolic disruptions.
Table 1: DNA Damage Types and Their Impact on Cytochrome c Release
| Damage Type | Primary Sensors | Key Signaling Components | Effect on Cytochrome c Release |
|---|---|---|---|
| Double-strand breaks | ATM, DNA-PK | p53, Bax, PIDDosome | Strong induction via Bak/Bax oligomerization |
| Oxidative base damage (8-oxoG) | OGG1, APE1 | PARP1, XRCC1 | Moderate induction; context-dependent |
| Replication stress | ATR, Chk1 | p53, Caspase-2 | Delayed but sustained release |
| Bulky adducts | NER machinery | p53, p73 | Variable induction based on repair efficiency |
Oxidative Stress
Reactive oxygen species (ROS) function as double-edged swords in cellular physiology—at physiological levels, they participate in signaling pathways, but at pathological levels, they induce oxidative stress that triggers apoptosis [18]. Key ROS include superoxide anion (O₂•⁻), hydrogen peroxide (H₂O₂), and the highly reactive hydroxyl radical (•OH). Mitochondria represent both a primary source and target of ROS, creating amplification loops that promote cyt c release [18].
Oxidative stress facilitates cyt c release through multiple interconnected mechanisms. ROS directly oxidize cardiolipin, a phospholipid that anchors cyt c to the inner mitochondrial membrane [14]. Cardiolipin oxidation reduces its binding affinity for cyt c, mobilizing the protein within the intermembrane space and facilitating its release through permeabilized outer membranes [5]. Additionally, ROS activate several Bcl-2 family proteins, inhibit anti-apoptotic proteins through oxidation, and induce permeability transition pore opening, collectively promoting MOMP [18].
The redox state of cyt c itself influences its apoptotic function. Reduced cyt c (Fe²⁺) is more effective in caspase activation compared to oxidized cyt c (Fe³⁺), and cancer cells often exhibit altered cyt c redox states that may contribute to apoptosis resistance [16].
Metabolic and Other Intrinsic Stimuli
Beyond classical triggers, various metabolic disturbances can initiate intrinsic apoptosis. Nutrient deprivation, growth factor withdrawal, and severe metabolic stress engage pro-apoptotic signaling through multiple pathways, including impaired ATP production, disrupted calcium homeostasis, and altered NAD+/NADH ratios [19].
The Warburg effect, wherein cancer cells preferentially utilize glycolysis despite oxygen availability, represents a metabolic adaptation with implications for apoptosis sensitivity. Interestingly, despite reduced mitochondrial content in some cancers, respiratory capacity per mitochondrion may be enhanced through bioenergetic adaptations, creating potential vulnerabilities for targeted therapies [19]. ER stress represents another potent trigger, where unfolded protein accumulation activates the PERK-ATF4-CHOP pathway, transcriptionally upregulating pro-apoptotic Bcl-2 family members that promote cyt c release [5].
Experimental Analysis of Trigger Mechanisms
Detection Methods for Cytochrome c Release
Establishing robust experimental protocols is essential for investigating cyt c release mechanisms. The following methodologies represent gold standards in the field:
Immunofluorescence Microscopy: This technique visualizes cyt c localization in fixed cells. Under normal conditions, cyt c displays a punctate mitochondrial pattern that becomes diffuse upon apoptosis induction. The protocol involves: (1) culturing cells on glass coverslips; (2) applying apoptotic stimuli; (3) fixation with paraformaldehyde; (4) permeabilization with Triton X-100; (5) blocking with BSA; (6) incubation with anti-cytochrome c antibody; (7) fluorescent secondary antibody detection; and (8) confocal microscopy imaging. Co-staining with mitochondrial markers (e.g., TOM20) confirms release completeness [14].
Subcellular Fractionation and Western Blotting: This biochemical approach quantifies cyt c redistribution. Cells are fractionated into mitochondrial and cytosolic components using differential centrifugation. The protocol includes: (1) gentle homogenization to preserve mitochondrial integrity; (2) sequential centrifugation at 800×g to remove nuclei and 10,000×g to pellet mitochondria; (3) high-speed centrifugation (100,000×g) to obtain cytosolic fraction; (4) Western blotting of fractions using anti-cytochrome c antibody. Purity of fractions should be verified using compartment-specific markers (e.g., COX IV for mitochondria, LDH for cytosol) [14].
Live-Cell Imaging with Fluorescent Proteins: Real-time tracking of cyt c release employs cells expressing cyt c-GFP fusion proteins or stained with cyt c-specific fluorescent probes (e.g., Alexa Fluor-labeled antibodies introduced via streptolysin O permeabilization). This approach reveals kinetics and heterogeneity of release responses within cell populations [14].
Assessing DNA Damage-Induced Apoptosis
Comprehensive evaluation of DNA damage-triggered cyt c release requires integrated assessment of DNA lesion formation, damage signaling, and mitochondrial engagement:
γH2AX Immunostaining: Phosphorylated histone H2AX (γH2AX) foci quantification serves as a sensitive marker for double-strand breaks. Cells are fixed and stained with anti-γH2AX antibody followed by fluorescent secondary antibody. Foci are counted manually or using automated imaging systems, with correlation to cyt c release timing [17].
Comet Assay: Single-cell gel electrophoresis detects DNA strand breaks at the individual cell level. Cells are embedded in agarose, lysed, subjected to electrophoresis, stained with DNA-binding dye, and analyzed for tail moment (reflecting DNA damage). This technique reveals heterogeneity in damage response [17].
Western Blotting for DNA Damage Signaling: Key signaling components including phospho-ATM, phospho-Chk2, phospho-p53, and total p53 levels are monitored by Western blot following genotoxic insult. Temporal analysis establishes signaling kinetics relative to cyt c release [17].
Monitoring Oxidative Stress Involvement
Determining ROS contribution to cyt c release employs multiple complementary approaches:
Fluorescent ROS Sensors: Cell-permeable dyes (e.g., H₂DCFDA for general ROS, MitoSOX for mitochondrial superoxide) provide dynamic assessment of oxidative stress. Cells are loaded with dye, exposed to apoptotic stimuli, and fluorescence is measured by flow cytometry or microscopy. Concurrent monitoring of mitochondrial membrane potential (with TMRE or JC-1) helps establish causal relationships [18].
Cardiolipin Oxidation Assessment: Antibodies specific to oxidized cardiolipin enable detection of this key event in cyt c mobilization. Immunofluorescence or flow cytometry with anti-oxidized cardiolipin antibody (e.g., clone 2C6) reveals cardiolipin oxidation preceding cyt c release [5].
Antioxidant Interventions: Pharmacological (e.g., N-acetylcysteine, mito-TEMPO) or genetic (e.g., SOD overexpression) antioxidant approaches test necessity of ROS in cyt c release. Attenuation of release with specific antioxidants implicates particular ROS species in the process [18].
Table 2: Key Research Reagents for Studying Cytochrome c Release
| Reagent Category | Specific Examples | Application/Function | Technical Notes |
|---|---|---|---|
| DNA Damage Inducers | Etoposide, Camptothecin, UV-C radiation | Induce specific DNA lesion types to trigger apoptosis | Dose-response critical; consider cell type sensitivity |
| Oxidative Stress Probes | H₂DCFDA, MitoSOX Red, MitoTracker | Detect and quantify ROS production and localization | Confirm specificity with appropriate controls |
| Apoptosis Inhibitors | Z-VAD-FMK (pan-caspase), Cyclosporin A (MPTP inhibitor) | Determine caspase-dependence and MPTP involvement | Use multiple concentrations to verify specificity |
| Antibodies for Detection | Anti-cytochrome c, Anti-COX IV, Anti-γH2AX | Assess subcellular localization and damage markers | Validate specificity with knockout/knockdown controls |
| Mitochondrial Dyes | TMRE, JC-1, MitoTracker | Monitor membrane potential and morphology | Correlate depolarization with cyt c release timing |
Integrated Signaling Pathways
The molecular triggers of cyt c release engage in extensive crosstalk, creating a network that integrates diverse stress signals into a commitment to apoptosis. DNA damage, oxidative stress, and metabolic perturbations often co-occur and amplify each other—for example, DNA damage increases ROS production, which exacerbates additional DNA lesions and lipid peroxidation [17] [18].
The pathway diagram below illustrates the convergence of multiple stress signals on mitochondrial cyt c release:
Integrated Stress Signaling to Cytochrome c Release
This integrated network demonstrates how disparate stress signals converge on mitochondrial regulation, with Bcl-2 family proteins serving as central gatekeepers. The relative contribution of each pathway varies by cell type and stressor intensity, creating context-specific apoptotic responses that can be leveraged for therapeutic targeting.
The Scientist's Toolkit: Research Reagent Solutions
Advancing research on cyt c release mechanisms requires specialized reagents and tools. The following table summarizes essential research solutions for investigating intrinsic apoptotic triggers:
Table 3: Advanced Research Tools for Cytochrome c Release Studies
| Tool Category | Specific Products | Research Application | Key Considerations |
|---|---|---|---|
| Cyt c Release Assay Kits | Abcam Cytochrome c Release Assay Kit, BioVision Cytochrome c Release Apoptosis Assay Kit | Standardized measurements of cyt c translocation | Compare mitochondrial vs. cytosolic fractions; include integrity controls |
| Genetically Encoded Sensors | cyto-GFP (cyt c-GFP fusion), RFP-cyto-GFP (dual localization) | Real-time tracking of release kinetics in live cells | Verify normal respiratory function after labeling |
| ROS/RNS Detection Probes | CellROX series, DAF-FM diacetate, MitoPY1 | Specific detection of different reactive species | Confirm subcellular localization with compartment markers |
| DNA Damage Reporter Cells | 53BP1-GFP, MDC1-GFP reporter lines | Correlate DNA damage foci with apoptotic commitment | Establish baseline foci counts for cell type |
| Bcl-2 Family Modulators | ABT-199 (venetoclax), AMA-37 (Bax activator) | Test specific protein requirements in release | Use multiple structurally distinct modulators to confirm effects |
| Mitochondrial Isolation Kits | MITOISO2, Abcam Mitochondrial Isolation Kit | Obtain pure mitochondrial fractions for in vitro studies | Assess cross-contamination with other compartments |
Therapeutic Implications and Research Perspectives
The molecular triggers of cyt c release represent promising targets for therapeutic intervention, particularly in oncology where apoptosis evasion is fundamental to pathogenesis [16]. Chemotherapeutic agents and radiotherapy intentionally induce DNA damage to activate cyt c release in cancer cells, while resistance mechanisms often involve upregulation of anti-apoptotic Bcl-2 family proteins [5] [16].
Emerging strategies include direct targeting of cyt c interactions, such as promoting its release using BH3 mimetics that neutralize anti-apoptotic Bcl-2 proteins, or sensitizing cancer cells to cyt c-mediated caspase activation by modulating its redox state [16]. Natural compounds like apigenin, moringa isothiocyanate, and diallyl trisulfide demonstrate promising pro-apoptotic effects through mitochondrial targeting in preclinical breast cancer models [16].
Future research directions should focus on single-cell analysis of cyt c release heterogeneity, structural biology of cyt c interactions with cardiolipin and APAF-1, and development of trigger-specific biomarkers predicting therapeutic response. The complex interplay between metabolic reprogramming, oxidative stress regulation, and apoptosis sensitivity presents particularly fertile ground for investigation, especially in the context of tumor-specific metabolic dependencies [19].
Understanding the precise molecular triggers of cytochrome c release provides not only fundamental insights into cellular homeostasis but also practical therapeutic opportunities for manipulating cell death in human disease.
Mitochondrial outer membrane permeabilization (MOMP) is a decisive event in the intrinsic pathway of apoptosis, serving as the primary mechanism responsible for cytochrome c release and the subsequent activation of caspases that execute cell death [20] [21]. This process is meticulously regulated by the B-cell lymphoma 2 (BCL-2) family of proteins, which integrate diverse apoptotic stimuli to determine cellular fate [20] [14]. The permeabilization of the mitochondrial outer membrane allows proteins normally confined to the intermembrane space, such as cytochrome c and SMAC/DIABLO, to escape into the cytosol [20] [14]. Once in the cytosol, cytochrome c facilitates the formation of the apoptosome, a complex that activates caspase-9 and initiates a proteolytic cascade leading to apoptotic cell dismantling [22] [14].
Understanding MOMP is not merely of academic interest but holds significant therapeutic potential. Dysregulation of apoptosis is a hallmark of cancer, with many malignancies exhibiting overexpression of anti-apoptotic proteins to evade cell death [20] [22]. Conversely, excessive apoptosis contributes to neurodegenerative diseases and tissue damage [22] [23]. Therefore, elucidating the molecular mechanisms governing MOMP, including the critical role of membrane lipids and protein-lipid interactions, provides crucial insights for developing novel therapeutics that can modulate cell death pathways in human diseases [24].
BCL-2 Protein Family: Master Regulators of MOMP
The BCL-2 protein family serves as the central regulatory module controlling MOMP through a delicate balance between pro-apoptotic and anti-apoptotic signals [20] [21]. These proteins are classified structurally and functionally into three principal groups, as detailed in Table 1.
Table 1: Classification and Function of BCL-2 Protein Family Members
| Category | Examples | BH Domains | Primary Function in Apoptosis |
|---|---|---|---|
| Anti-apoptotic | Bcl-2, Bcl-xL, Mcl-1 | BH1-BH4 | Bind and inhibit pro-apoptotic effectors; preserve membrane integrity [20] [22] |
| Pro-apoptotic Effectors | Bax, Bak, Bok | BH1-BH3 | Directly mediate MOMP through oligomerization and pore formation [20] [21] |
| BH3-only Proteins | Bid, Bim, Bad, Puma, Noxa | BH3 only | Sense cellular damage; activate Bax/Bak or inhibit anti-apoptotic members [20] [22] |
In healthy cells, Bax is predominantly cytosolic, while Bak is constitutively integrated into the mitochondrial outer membrane [24] [25]. Upon receipt of an apoptotic stimulus, BH3-only proteins become activated and initiate a cascade that culminates in Bax/Bak activation [20]. The "activator" BH3-only proteins (e.g., Bid, Bim) directly engage Bax and Bak, inducing conformational changes that expose their membrane-insertion domains [20] [21]. Meanwhile, "sensitizer" BH3-only proteins (e.g., Bad, Noxa, Puma) function by neutralizing anti-apoptotic BCL-2 proteins, thereby displacing their inhibitory hold on Bax and Bak [20] [22]. This intricate interplay ensures that MOMP proceeds only when the balance definitively shifts in favor of pro-apoptotic signals.
Diagram: BCL-2 Protein Regulation of MOMP
Molecular Mechanisms of Pore Formation
The precise architecture of the apoptotic pore remains a subject of intense investigation, with several models proposed to explain how Bax and Bak permeabilize the mitochondrial outer membrane.
Bax/Bak Oligomerization and Lipidic Pores
The prevailing model suggests that activated Bax and Bak undergo extensive oligomerization, forming large complexes that ultimately disrupt membrane integrity [20] [25]. These oligomers are thought to create proteolipidic pores where both protein and lipid components contribute to the pore structure [24] [26]. This model shares similarities with the "toroidal pore" mechanism described for antimicrobial peptides, where lipid headgroups line the pore interior alongside protein elements [26]. Evidence for this includes the observation that Bax and Bak can form ring-like structures visible by electron microscopy [24], and that pore formation is influenced by membrane lipid composition [24] [25].
A landmark study using lipid nanodisc technology to isolate BAK in near-native membrane environments revealed that the local lipid environment surrounding BAK assemblies becomes significantly enriched in unsaturated lipid species during apoptosis [24]. This lipid unsaturation was shown to actively promote BAX pore activity in model membranes, isolated mitochondria, and cellular systems [24]. Molecular dynamics simulations further supported these findings, demonstrating enrichment of unsaturated lipids at the pore rim and suggesting they facilitate membrane curvature necessary for pore formation [24].
Catalytic Pore Facilitation Model
Interestingly, studies using native mitochondrial outer membranes (MOMs) revealed that Bax-mediated pore formation occurs more efficiently in biological membranes than in synthetic liposomes, suggesting resident MOM proteins facilitate this process [25]. Kinetic analyses demonstrated a distinct lag phase in native membranes not observed in liposomes, leading to a proposed two-tiered model where Bax activation first promotes assembly of a multimeric complex (the "catalyst"), which then facilitates Bax-dependent pore formation [25]. This catalyst appears distinct from Bax itself and exhibits phase transition-like behavior sensitive to membrane lipid packing [25]. While the identity of this catalyst remains unknown, its existence underscores the complexity of MOMP in physiological contexts.
Diagram: Pore Formation Models in MOMP
Cytochrome c Release in the Intrinsic Pathway
Cytochrome c plays a dual role in cellular physiology—in healthy mitochondria, it resides in the intermembrane space where it functions as an essential electron shuttle in the respiratory chain, but upon MOMP, it becomes a potent apoptotic activator when released into the cytosol [14] [27]. The release process involves at least two critical phases: mobilization from its membrane associations and translocation through the permeabilized outer membrane.
In its physiological role, a significant proportion of cytochrome c is electrostatically bound to cardiolipin, a mitochondria-specific phospholipid located primarily in the inner membrane [14]. The interaction between cytochrome c (net charge +8 at physiological pH) and anionic cardiolipin occurs through both electrostatic bonding and hydrophobic interactions, with one acyl chain of cardiolipin inserting into a hydrophobic channel of cytochrome c [14]. During apoptosis, cytochrome c must be mobilized from these cardiolipin associations, potentially through cardiolipin oxidation by reactive oxygen species (ROS) or phospholipase A2 activity, which significantly reduces cytochrome c's binding affinity [14]. Alternatively, increased cytosolic calcium levels may weaken the electrostatic interaction, facilitating detachment [14].
Once mobilized, cytochrome c translocates to the cytosol through Bax/Bak-dependent pores in the outer membrane [14] [27]. This release is remarkably rapid and complete in apoptotic cells, occurring within approximately 5 minutes of MOMP induction [21]. In the cytosol, cytochrome c binds to Apoptotic Protease-Activating Factor 1 (Apaf-1), promoting the formation of the apoptosome complex which activates caspase-9, ultimately leading to caspase-3 activation and apoptotic cell death [22] [14].
Table 2: Key Events in Cytochrome c Release and Apoptosis Activation
| Event | Key Players | Experimental Evidence |
|---|---|---|
| Cytochrome c Mobilization | Cytochrome c, Cardiolipin, ROS, Calcium | Detachment from inner membrane observed in isolated mitochondria; cardiolipin oxidation reduces binding affinity [14] |
| Pore Formation | Bax, Bak, Lipid co-factors | Bax/Bak oligomers visualized by EM; liposome permeabilization assays; BAX/BAK DKO cells resistant to MOMP [20] [24] [21] |
| Cytochrome c Release | Permeabilized MOM, IMS proteins | Live-cell imaging shows rapid, complete release; detected by immunofluorescence and subcellular fractionation [14] [21] |
| Apoptosome Formation | Cytochrome c, Apaf-1, Caspase-9 | Reconstituted in cell-free systems; deficient in cytochrome c knockout cells [22] [14] |
| Caspase Activation | Caspase-9, Caspase-3/7 | Cleavage assays and FRET-based reporters; blocked by caspase inhibitors [22] [14] |
Role of Membrane Lipid Composition in MOMP
Emerging research has illuminated the critical influence of membrane lipid composition on MOMP regulation, moving beyond the traditional protein-centric view. The mitochondrial outer membrane possesses a unique lipid composition that differs from other cellular membranes, and this composition appears dynamically regulated during apoptosis [24].
A groundbreaking 2024 study employed comparative lipidomics of BAK isolated in lipid nanodiscs and revealed a significant enrichment of unsaturated lipid species in the proximal membrane environment of BAK during apoptosis [24]. Specifically, phosphatidylcholine (PC) and phosphatidylethanolamine (PE) showed increased polyunsaturated species at the expense of saturated forms in apoptotic mitochondrial membranes [24]. Functional experiments demonstrated that unsaturated lipids directly promote BAX pore activity across model membrane systems, isolated organelles, and cellular contexts [24]. Accordingly, depletion of FADS2, a key enzyme in fatty acid poly-unsaturation, decreased apoptosis sensitivity and activation of the cGAS/STING pathway downstream of mitochondrial DNA release [24].
The significance of specific lipid species extends beyond unsaturation. Cardiolipin, a mitochondrial signature phospholipid, has been implicated in BAX activity and oligomerization [24] [14]. While cardiolipin is predominantly located in the inner mitochondrial membrane, it is present in the outer membrane at lower concentrations (approximately 1-3% of total lipid content) and may facilitate Bax membrane insertion and oligomerization [24] [14]. The emerging paradigm suggests that local lipid microenvironments create favorable conditions for Bax/Bak activation and pore formation, with lipid composition serving as an critical regulatory layer in MOMP control.
Experimental Approaches for Studying MOMP
Investigating the dynamic process of MOMP requires a multifaceted methodological approach spanning biochemical, biophysical, and cell biological techniques.
Lipidomics and SMALP Isolation
The isolation of membrane protein complexes with their native lipid environment represents a significant advancement for studying protein-lipid interactions. As employed in recent research, this involves solubilizing mitochondrial membranes from apoptotic and healthy cells using styrene-maleic acid (SMA) copolymers, which form lipid nanodiscs (SMALPs) that preserve the native membrane environment [24]. BAK-containing SMALPs are then enriched via affinity purification (e.g., using GFP-Trap beads for tagged BAK) and subjected to lipid extraction for subsequent liquid chromatography-tandem mass spectrometry (LC-MS/MS) analysis [24]. This approach allows quantitative comparison of lipid species associated with BAK under different physiological states, revealing apoptosis-specific lipid changes such as increased polyunsaturated PC and PE species [24].
Kinetic Analysis of Pore Formation
Kinetic studies using isolated mitochondrial outer membrane vesicles (OMVs) have been instrumental in elucidating the multi-step nature of MOMP. The experimental protocol involves isolating OMVs from mouse liver mitochondria, loading them with fluorescent dextrans of varying sizes, and incubating with recombinant Bax and cBid (activator) while monitoring fluorescence dequenching due to dextran release [25]. Data analysis employs mathematical modeling to determine rate constants and identify distinct reaction phases. This approach revealed the lag phase characteristic of native MOMs and supported the catalyst-dependent model of pore formation [25].
Membrane Permeabilization Assays
Multiple complementary assays exist for monitoring membrane permeabilization in various experimental systems:
- Liposome leakage assays: Synthetic liposomes with defined lipid composition are loaded with fluorescent markers and incubated with recombinant BCL-2 proteins; marker release indicates membrane permeabilization [20] [26].
- Isolated mitochondria systems: Mitochondria isolated from tissues or cells are treated with apoptotic stimuli, and cytochrome c release is detected in supernatants by immunoblotting [24] [25].
- Live-cell imaging: Cells expressing fluorescent cytochrome c or stained with mitochondrial membrane potential dyes (e.g., TMRE) are monitored in real-time during apoptosis induction [22] [24].
Table 3: Key Research Reagents and Experimental Tools for MOMP Research
| Reagent/Tool | Function/Application | Experimental Utility |
|---|---|---|
| Recombinant Bax/Bak proteins | Study pore formation in vitro | Used in liposome and OMV assays to reconstitute MOMP [25] |
| BH3 mimetics (e.g., Venetoclax) | Inhibit anti-apoptotic BCL-2 proteins | Therapeutic compounds that induce apoptosis in cancer cells [22] |
| SMA copolymers | Solubilize membrane proteins with native lipids | Enable isolation of BAK with proximal lipid environment for lipidomics [24] |
| TMRE | Mitochondrial membrane potential dye | Loss of fluorescence indicates mitochondrial depolarization during early apoptosis [22] [24] |
| Caspase activity assays | Measure caspase-3/7 and caspase-9 activity | Fluorogenic substrates detect caspase activation downstream of MOMP [22] |
| Cytochrome c antibodies | Detect cytochrome c release | Immunoblotting and immunofluorescence to monitor localization [22] [14] |
Diagram: Experimental Workflow for Lipidomics-MOMP Analysis
The mechanism of mitochondrial outer membrane permeabilization represents a convergence point for protein-protein and protein-lipid interactions that collectively determine cellular fate. While significant progress has been made in understanding the roles of BCL-2 family proteins in initiating MOMP, emerging research highlights the critical contribution of membrane lipid composition, particularly lipid unsaturation, in facilitating Bax/Bak pore formation [24]. The integration of structural, biochemical, and biophysical approaches continues to refine our understanding of the apoptotic pore architecture, with current evidence supporting a model where activated Bax and Bak form proteolipidic pores whose activity is enhanced by specific lipid environments and potentially facilitated by additional mitochondrial factors [24] [25] [26].
For drug development professionals, these mechanistic insights offer promising therapeutic avenues. The demonstration that lipid desaturase activity influences apoptosis sensitivity suggests that modulation of membrane lipid composition might represent a novel strategy for overcoming apoptosis resistance in cancer cells [24]. Similarly, the development of BH3 mimetics that target specific anti-apoptotic BCL-2 family members exemplifies how basic research on MOMP regulation can translate into clinically effective therapies [22]. Future research aimed at definitively identifying the catalytic component(s) that facilitate Bax pore formation in native membranes, and further elucidating the spatial and temporal dynamics of lipid changes during apoptosis, will undoubtedly yield new opportunities for therapeutic intervention in diseases characterized by dysregulated cell death.
Cytochrome c is predominantly recognized for its fundamental role in the mitochondrial electron transport chain and its complete release during intrinsic apoptosis, leading to caspase activation and cell death. However, emerging research reveals a more complex paradigm in which cytochrome c exhibits functions beyond this all-or-nothing phenomenon. This review synthesizes current understanding of sub-lethal cytochrome c signaling and partial mobilization events, examining molecular mechanisms, regulatory processes, and functional consequences. We explore how partial release contributes to cellular homeostasis, differentiation, and DNA damage response without triggering full apoptosis. The article provides comprehensive quantitative analysis of cytochrome c release dynamics, detailed experimental protocols for studying sub-lethal mobilization, and essential research tools for investigating this nuanced aspect of cell biology. These insights refine our understanding of cellular life-death decisions and present novel therapeutic opportunities for cancer and degenerative diseases.
Cytochrome c is a multifunctional hemoprotein primarily known for its indispensable role in mitochondrial respiration, where it shuttles electrons between Complex III and Complex IV [14]. For decades, its apoptotic function has been characterized as an all-or-nothing process, where complete release from mitochondrial intermembrane space triggers apoptosome formation and caspase-mediated cell death [14] [28]. However, recent evidence challenges this binary perspective, revealing that cytochrome c can transmit sub-lethal signals through partial mobilization that influence cellular physiology without committing the cell to death [27].
This emerging paradigm recognizes that cytochrome c release occurs along a spectrum, with partial mobilization activating cellular processes distinct from full apoptosis. The concept of "partial release" suggests mitochondrial outer membrane permeabilization (MOMP) may not invariably lead to cell death, allowing for limited cytochrome c redistribution with functional consequences [27]. Understanding these nuanced functions is critical for comprehending cellular adaptation to stress and developing targeted therapies that modulate rather than simply trigger cell death pathways.
The molecular mechanisms governing partial cytochrome c mobilization involve regulated alterations in mitochondrial membrane permeability controlled by BCL-2 family proteins, without complete commitment to the apoptotic cascade [14] [28]. This review examines the current evidence for sub-lethal cytochrome c functions, detailing the mechanisms of partial release, its functional consequences in cellular physiology and pathology, and advanced methodologies for its investigation.
Molecular Mechanisms of Partial Cytochrome c Mobilization
Regulatory Control by BCL-2 Family Proteins
The BCL-2 protein family serves as the primary regulator of cytochrome c release, maintaining a delicate balance between cell survival and death. This family comprises three functional groups: pro-apoptotic effector proteins (Bax, Bak, Bok), pro-apoptotic BH3-only proteins (Bid, Bad, Bim, Puma, Noxa), and anti-apoptotic proteins (Bcl-2, Bcl-xL, Bcl-w, Mcl-1) [28] [22]. In the intrinsic pathway, cellular stresses like DNA damage or oxidative stress activate BH3-only proteins, which then engage and activate Bax and Bak. These effectors oligomerize to form pores in the mitochondrial outer membrane, facilitating cytochrome c release [28].
The extent of cytochrome c release is determined by the dynamic equilibrium between these opposing BCL-2 family members. Partial cytochrome c mobilization occurs when this equilibrium is subtly perturbed rather than completely disrupted, resulting in limited permeabilization of the mitochondrial outer membrane. This can happen through several mechanisms: moderate activation of BH3-only proteins, incomplete Bax/Bak oligomerization, or transient pore formation that allows limited cytochrome c passage without complete mitochondrial commitment to apoptosis [14] [27]. The heterogeneity of mitochondrial populations within single cells further contributes to this partial release phenomenon, with some mitochondria releasing their cytochrome c content while others remain intact [27].
Cytochrome c-Cardiolipin Interactions and Mobilization
Within mitochondria, cytochrome c is anchored to the inner membrane through associations with the phospholipid cardiolipin, which governs its retention and mobilization [14]. At physiological pH, cytochrome c carries a net positive charge (+8), facilitating strong electrostatic interactions with anionic cardiolipin molecules. Additionally, cytochrome c contains a hydrophobic channel through which one acyl chain of cardiolipin can insert, while the remaining chains remain embedded in the membrane, providing dual-mode anchoring [14].
Detachment of cytochrome c from cardiolipin represents a critical step in its mobilization and can occur through several mechanisms. Cardiolipin oxidation significantly reduces its affinity for cytochrome c, facilitating release [14]. This oxidation can be mediated by reactive oxygen species (ROS), phospholipase A2, or the cardiolipin-cytochrome c complex itself, with the latter process potentially accelerated by conformational changes in cytochrome c when bound to cardiolipin [14]. Increased cytosolic calcium concentrations can also weaken the electrostatic interaction between cytochrome c and cardiolipin, promoting detachment [14]. In partial release scenarios, these processes may occur in a limited, compartmentalized manner rather than throughout the entire mitochondrial network.
Permeabilization Thresholds and Sub-apoptotic Signaling
The concept of a permeabilization threshold is central to understanding partial cytochrome c mobilization. Cells may exhibit heterogeneity in their susceptibility to MOMP, with variations in BCL-2 family expression profiles, mitochondrial membrane composition, and cellular stress response pathways influencing this threshold [27]. Sub-lethal stress signals may induce MOMP in only a subset of mitochondria or create pores that permit limited cytochrome c efflux without complete cellular commitment to apoptosis.
In these scenarios, the limited cytochrome c released into the cytosol may be insufficient to fully activate the apoptosome and caspase cascade, especially given the high ATP concentration required for apoptosome formation (approximately 0.5-5 mM cytochrome c in the intermembrane space) [29]. Instead, sub-apoptotic cytochrome c concentrations may engage alternative signaling pathways or produce localized effects that influence cellular physiology without triggering death. The presence of endogenous inhibitors, including IAP (Inhibitor of Apoptosis Proteins) families, may further buffer against full caspase activation following limited cytochrome c release [30].
Quantitative Analysis of Cytochrome c Release Dynamics
Parameters of Partial Cytochrome c Release
Advanced quantification techniques have revealed that cytochrome c release exists along a continuum rather than as a binary event. The following table summarizes key quantitative parameters associated with partial versus complete cytochrome c mobilization, derived from experimental studies using fluorescence imaging, subcellular fractionation, and cytochrome c-GFP tracking systems [29].
Table 1: Quantitative Parameters of Cytochrome c Release
| Parameter | Partial Release | Complete Release | Measurement Techniques |
|---|---|---|---|
| Percentage of Cellular Cytochrome c Released | 10-30% | 70-100% | Cellular fractionation with Western blot densitometry [29] |
| Mitochondria Affected | 15-40% of mitochondria per cell | >80% of mitochondria per cell | Cytochrome c-GFP fluorescence tracking [29] |
| Caspase-3 Activation | Minimal or absent (≤15% of full activation) | Robust (>80% of maximum) | Fluorogenic caspase-3 substrate cleavage assays [31] |
| Cytochrome c Release Kinetics | Slow, asynchronous over 2-6 hours | Rapid, synchronous within 30 minutes | Live-cell imaging of cytochrome c-GFP [29] |
| Cell Fate Outcome | Survival with modified function | Apoptotic death | Long-term cell tracking and viability assays [27] |
| ATP Concentration for Apoptosome Formation | Below threshold (~0.5-1 mM) | Above threshold (>1 mM) | ATP depletion/addition experiments [14] |
Biochemical Regulation of Release Thresholds
The transition between partial and complete cytochrome c release is governed by precise biochemical regulation. The affinity between cytochrome c and APAF-1, crucial for apoptosome formation, depends on specific molecular interactions. Lys72 of cytochrome c is particularly critical for stable interaction with APAF-1, with mutations at this position (e.g., Lys72Ala) substantially reducing apoptotic activity while preserving respiratory function [14]. In knock-in mice, the Lys72Ala mutation results in embryonic lethality and brain developmental defects similar to APAF-1 and caspase-9 knockouts, confirming the functional significance of this interaction [14].
The ionic strength of the cellular environment significantly influences cytochrome c release dynamics. Experimental studies using isolated mitochondria have demonstrated that physiological potassium concentrations (50-80 mM) can promote cytochrome c release from the inner mitochondrial membrane without requiring additional biochemical events [14]. This suggests that physiological fluctuations in intracellular ion concentrations may contribute to partial cytochrome c mobilization under sub-lethal conditions.
Table 2: Molecular Determinants of Cytochrome c Release Thresholds
| Regulatory Factor | Effect on Release Threshold | Impact on Partial Release |
|---|---|---|
| BCL-2/Bax Ratio | High ratio increases threshold, low ratio decreases it | Moderate ratios favor partial release [28] |
| Cardiolipin Oxidation State | Increased oxidation lowers retention capacity | Moderate oxidation enables selective release [14] |
| Ionic Strength | High K+ (50-80 mM) promotes mobilization | Physiological fluctuations may regulate partial release [14] |
| Cytochrome c Mutations (e.g., Lys72Ala) | Disrupts APAF-1 binding | Permits respiratory function without apoptosis [14] |
| Cristae Remodeling | Facilitates complete cytochrome c pool access | Limited remodeling may restrict release [14] |
Experimental Approaches for Studying Sub-lethal Cytochrome c Functions
Quantitative Assay for Cytochrome c Release
Accurately quantifying cytochrome c release patterns is essential for distinguishing partial from complete mobilization. The digitonin-based selective permeabilization assay coupled with flow cytometry provides a robust method for this purpose [29]. This approach enables rapid, non-subjective quantification of cells with cytoplasmic cytochrome c in both adherent and non-adherent populations.
Protocol for Quantitative Cytochrome c Release Assay [29]:
Cell Preparation: Harvest approximately 1×10^5 cells and wash with PBS containing 100 mM KCl to maintain physiological ionic strength.
Selective Permeabilization: Treat cells with 100 μl digitonin (50 μg/ml in PBS with 100 mM KCl) for 5 minutes on ice. Monitor permeabilization efficiency using trypan blue exclusion (>95% permeabilization indicates optimal treatment).
Fixation: Add paraformaldehyde (4% in PBS) for 20 minutes at room temperature to preserve subcellular structures. Wash three times with PBS.
Blocking and Staining: Incubate cells in blocking buffer (3% BSA, 0.05% saponin in PBS) for 1 hour. Then incubate overnight at 4°C with anti-cytochrome c monoclonal antibody (e.g., clone 6H2.B4) diluted 1:200 in blocking buffer.
Detection: Wash cells three times and incubate for 1 hour at room temperature with PE-labeled secondary antibody (1:200 dilution in blocking buffer). Analyze by flow cytometry detecting PE fluorescence in FL-2 channel.
Controls and Validation: Include untreated cells as high fluorescence controls and cells with full cytochrome c release (e.g., treated with apoptotic inducers) as low fluorescence controls. Confirm FACS analysis by fluorescence microscopy.
This method offers significant advantages over Western blot-based approaches, which provide averaged results from cell populations and cannot distinguish whether all cytochrome c is cytoplasmic in a small percentage of cells or all cells have partially redistributed their cytochrome c [29]. The flow cytometry approach captures this heterogeneity at single-cell resolution.
Monitoring Partial Release in Live Cells
For real-time monitoring of cytochrome c release dynamics, live-cell imaging of cytochrome c-GFP provides unparalleled temporal resolution [29]. This approach reveals that cytochrome c release in individual cells is rapid and complete once initiated, but the timing varies between cells within a population. For studying partial release, this technique can be combined with mild apoptotic stimuli or stress conditions that don't trigger full commitment to apoptosis.
Critical considerations for live-cell imaging:
- Use low-level GFP expression to avoid artifacts from protein overexpression
- Employ photostable fluorophores and minimize phototoxicity during time-lapse imaging
- Correlate cytochrome c release with mitochondrial membrane potential using dyes like TMRE
- Combine with caspase activity reporters to distinguish sub-lethal from lethal release
Non-Apoptotic Functions of Cytochrome c
Regulation of DNA Damage Response
Emerging evidence indicates that cytochrome c participates in DNA damage response pathways independently of its apoptotic function. Caspases, particularly caspase-3 and caspase-7, can directly cleave DNA repair proteins, modulating their activity in ways that influence genomic stability [31]. For example, caspase-mediated cleavage of PARP-1 [poly(ADP-ribose) polymerase 1] inhibits DNA repair during apoptosis, but at sub-lethal levels may fine-tune DNA damage response [31].
In the absence of full apoptosis, limited cytochrome c release and subsequent low-level caspase activation may influence cell cycle checkpoints and DNA repair efficiency. Caspase-2, activated in response to DNA damage, can engage the intrinsic pathway without immediately triggering cell death, potentially through limited cytochrome c mobilization [31]. This sub-lethal signaling may provide a mechanism for eliminating cells with persistent DNA damage while allowing repair in less severely damaged cells.
Differentiation and Cellular Homeostasis
Sub-lethal cytochrome c signaling contributes to cellular differentiation and tissue homeostasis. During development, precise control of cell population sizes requires nuanced signaling beyond all-or-nothing apoptosis. Limited cytochrome c release may provide a mechanism for modulating cellular physiology without elimination [27].
In neuronal systems, sub-apoptotic cytochrome c release has been implicated in synaptic plasticity and remodeling, potentially through localized regulation of energy metabolism or modest activation of proteolytic cascades that modify cellular architecture without causing death. Similarly, in hematopoietic systems, partial cytochrome c mobilization may contribute to lineage commitment and differentiation decisions [27].
Research Tools and Reagent Solutions
Table 3: Essential Research Reagents for Studying Sub-lethal Cytochrome c Functions
| Reagent/Category | Specific Examples | Research Application | Key Features |
|---|---|---|---|
| Cytochrome c Detection Antibodies | Anti-cytochrome c clone 6H2.B4 [29] | Immunofluorescence, Western blotting | Specific for native conformation; works in fixed cells |
| Selective Permeabilization Agents | Digitonin [29] | Plasma membrane permeabilization | Selective cholesterol binding; preserves mitochondrial integrity |
| Apoptosis Inducers/Inhibitors | Venetoclax (BCL-2 inhibitor) [22], Campothecin [22] | Modulating release thresholds | Tool for establishing partial vs. complete release conditions |
| Live-Cell Imaging Tools | Cytochrome c-GFP constructs [29], MitoTracker Red [22], TMRE [22] | Real-time release kinetics | Enables single-cell analysis of release dynamics |
| Caspase Activity Assays | Fluorogenic caspase substrates (DEVD- AFC/AMC) [31] | Distinguishing sub-lethal vs. lethal release | Sensitive detection of low-level caspase activity |
| Mitochondrial Function Probes | JC-1, TMRM, MitoSOX [22] | Correlating release with mitochondrial status | Assesses membrane potential and ROS production |
| BCL-2 Family Modulators | ABT-737 (BH3 mimetic) [22], BIM peptides [28] | Regulating release thresholds | Tools for precise manipulation of MOMP |
Pathway Diagrams
Cytochrome c in Intrinsic Apoptosis and Sub-lethal Signaling
Experimental Workflow for Partial Release Detection
The paradigm of cytochrome c function has expanded significantly beyond its binary role in respiration and apoptosis. Evidence now compellingly demonstrates that cytochrome c participates in sub-lethal cellular signaling through partial mobilization events, creating a nuanced regulatory layer in cellular stress response. These partial release phenomena, governed by the BCL-2 family protein equilibrium and cytochrome c-cardiolipin interactions, enable cells to integrate stress signals without committing to apoptosis.
Understanding these mechanisms has profound implications for therapeutic development, particularly in cancer and degenerative diseases. In oncology, manipulating partial release thresholds may sensitize resistant tumors to treatment without excessive toxicity. Conversely, in neurodegenerative conditions, enhancing cellular capacity to manage sub-lethal cytochrome c release may promote neuronal survival. Future research should focus on precisely quantifying release thresholds, identifying molecular switches between partial and complete release, and developing targeted interventions that specifically modulate sub-lethal cytochrome c functions while preserving its essential roles in cellular metabolism.
Detecting and Harnessing Cytochrome c Release: Techniques and Therapeutic Applications
The intrinsic apoptotic pathway is a genetically programmed cell death process essential for development and tissue homeostasis, and its dysregulation is a hallmark of diseases ranging from neurodegeneration to cancer. At the core of this pathway lies cytochrome c (cyt c), a mitochondrial protein that plays a dual role in cellular survival and death. In healthy cells, cyt c functions as an electron shuttle in the respiratory chain within the mitochondrial intermembrane space. However, upon apoptotic stimulation, cyt c is released into the cytosol where it binds to Apaf-1, forming the apoptosome complex that activates caspase-9 and initiates a proteolytic cascade leading to cell dismantling [27]. The investigation of cyt c release mechanisms and regulation has relied heavily on two seemingly disparate experimental model systems: sympathetic neurons and cancer cell lines. This technical guide examines how these complementary models have advanced our understanding of the intrinsic apoptosis pathway, providing detailed methodologies, comparative analysis, and practical resources for researchers in the field.
Molecular Mechanisms of Cytochrome c Release
The Fundamental Process of Cytochrome c Release
Cytochrome c release from mitochondria represents a critical commitment point in the intrinsic apoptosis pathway. In healthy cells, cyt c is localized to the mitochondrial intermembrane and intercristae spaces, where it interacts with cardiolipin and functions in electron transport [27]. Multiple pro-apoptotic stimuli induce permeabilization of the outer mitochondrial membrane, facilitating communication between intermembrane and intercristae spaces and promoting mobilization of cyt c from cardiolipin, enabling its release into the cytosol [27].
The released cyt c mediates the allosteric activation of apoptosis-protease activating factor 1 (Apaf-1), which is required for proteolytic maturation of caspase-9 and caspase-3 [27]. This cascade ultimately leads to apoptotic dismantling of the cell. However, research has revealed that cytosolic cyt c is also associated with vital cell functions such as differentiation, suggesting that its release does not always occur in an all-or-nothing fashion and that mitochondrial outer membrane permeabilization may not invariably lead to cell death [27].
Key Regulatory Factors
The release and apoptotic activity of cyt c are regulated by multiple cellular factors:
- Bcl-2 Family Proteins: The pro-apoptotic protein Bax triggers cytochrome c efflux from mitochondria, while anti-apoptotic Bcl-2 prevents its redistribution [32].
- Redox Environment: The pro-apoptotic activity of cyt c is influenced by its redox state, with increases in reactive oxygen species (ROS) following apoptotic insults leading to oxidation and activation of cytochrome c [33].
- Glucose Metabolism: In healthy neurons and cancer cells, cyt c is reduced and held inactive by intracellular glutathione (GSH) generated through glucose metabolism via the pentose phosphate pathway [34].
Sympathetic Neuron Models
Experimental System Fundamentals
Sympathetic neurons from rodent superior cervical ganglia (SCG) have served as a premier model for studying cytochrome c regulation in post-mitotic cells. These neurons exhibit remarkable resistance to cytochrome c-mediated apoptosis despite successful cytochrome c release, providing insights into regulatory mechanisms beyond mitochondrial permeabilization [33]. This system is particularly valuable for studying neurotrophic factor deprivation-induced apoptosis, relevant to neurodegenerative conditions and neuronal development.
Primary Culture Protocol:
- Isolate superior cervical ganglia from newborn rats
- Culture neurons in the presence of nerve growth factor (NGF) for 5-7 days to establish mature cultures
- Induce apoptosis by NGF withdrawal or other apoptotic stimuli
- Employ caspase inhibitors like BAF (100 μM) to rescue neurons for recovery studies [32]
Key Methodologies and Applications
Cytochrome c Release Detection:
- Subcellular Fractionation: Harvest neurons in isotonic buffer (210 mM mannitol, 70 mM sucrose, 1 mM EDTA, 10 mM Hepes, pH 7.5) with protease inhibitors. Homogenize with Dounce homogenizer, centrifuge at 900g for 5 min to remove nuclei, then at 10,000g for 30 min to obtain heavy membrane fraction (mitochondrial) and cytosolic fractions [32].
- Western Blotting: Analyze cytochrome c distribution using anti-cytochrome c antibodies (e.g., monoclonal antibody from PharMingen) in both fractions [32].
- Immunocytochemistry: Fix neurons with 4% paraformaldehyde, permeabilize with 0.2% Triton X-100, incubate with anti-cytochrome c antibody (1:15 dilution), and visualize with fluorescein-labeled secondary antibody [32].
Microinjection Techniques: Direct cytosolic injection of cytochrome c (2.5 μg/μl) in the presence or absence of modulating agents like hydrogen peroxide (to create oxidized environment) or cell-permeable glutathione (to enhance reduced environment) [33].
Seminal Findings from Neuronal Models
Research using sympathetic neurons has yielded several fundamental insights:
- Reversible Cytochrome c Release: In NGF-deprived sympathetic neurons protected by caspase inhibitors, mitochondria depleted of cytochrome c can recover their cytochrome c content upon NGF re-exposure through a process requiring de novo protein synthesis [35] [32].
- Redox Regulation of Cytochrome c: Healthy neurons maintain a reduced environment that keeps cytochrome c in an inactive state, while apoptotic stimuli create an oxidized environment that permits cytochrome c-mediated apoptosis [34].
- XIAP-Independent Regulation: Even in XIAP-deficient neurons, released endogenous cytochrome c fails to induce apoptosis, indicating additional regulatory mechanisms beyond IAP inhibition [33].
Cancer Cell Line Models
Pancreatic Carcinoma Cell Lines
Human pancreatic carcinoma cell lines have been extensively utilized to investigate defects in the cytochrome c-dependent apoptotic apparatus in cancer [36]. These models are particularly valuable due to the extreme chemotherapy resistance of pancreatic cancer, suggesting fundamental apoptosis deficiencies.
Key Cell Lines and Characteristics:
- AsPC-1, BxPC-3, MiaPaCa-2, Panc-1: Commonly used lines with varying differentiation status
- PaTu8988t and PaTu8988s: Paired lines from the same patient representing differentiated and undifferentiated/metastatic phenotypes respectively [36]
Experimental Approach:
- Culture cells in appropriate media (DMEM or RPMI with 10% FCS)
- Prepare cytosolic fractions by hypotonic lysis (20 mM HEPES-KOH pH 7.5, 10 mM KCl, 1.5 mM MgCl2, 1 mM Na-EDTA, 1 mM Na-EGTA) with protease inhibitors and 2 mM DTT
- Passage through 22-gauge needle until 80-100% cell lysis
- Centrifuge at 10,000g and collect supernatant as cytosolic fraction [36]
Breast Cancer Models
Breast cancer cell lines have been instrumental in understanding cytochrome c regulation in hormonally responsive cancers and have identified potential therapeutic approaches.
Therapeutic Targeting Strategies:
- Cell-Penetrating Peptides: DPT-C9h peptide designed to disrupt caspase-9/PP2A interaction induces caspase-9-dependent apoptosis [37]
- Natural Compounds: Plant-derived compounds like apigenin, catalpol, and diallyl trisulfide promote cytochrome c release and apoptosis [16]
- Redox Modulation: Inhibition of glucose metabolism through pentose phosphate pathway inhibitors (DHEA, 6-AN) increases ROS and sensitizes cancer cells to cytochrome c-mediated apoptosis [34]
Comparative Analysis of Experimental Findings
Cytochrome c Release and Apoptotic Activation
Table 1: Comparative Responses to Cytochrome c Release in Different Model Systems
| Experimental Model | Cytochrome c Release Mechanism | Apoptotic Response | Key Regulatory Factors |
|---|---|---|---|
| Sympathetic Neurons (NGF-maintained) | tBid-induced release intact | Resistant to apoptosis even with cytochrome c release | Reduced redox environment; High GSH; Active pentose phosphate pathway |
| Sympathetic Neurons (NGF-deprived) | tBid-induced release intact | Sensitive to cytochrome c-mediated apoptosis | Oxidized environment; Increased ROS; Decreased reduction capacity |
| Pancreatic Carcinoma Cells | Variable response to stimuli | Generally resistant; varies between lines | Expression levels of Apaf-1, caspases; IAP proteins |
| Breast Cancer Cells | Inducible by chemotherapeutic agents | Generally sensitive to exogenous cytochrome c | Bcl-2 family balance; Cyt c redox state; Survival signaling pathways |
Quantitative Analysis of Cytochrome c Responses
Table 2: Quantitative Assessment of Cytochrome c-Mediated Apoptosis in Experimental Models
| Model System | Cytochrome c Concentration | Caspase Activation | Apoptosis Induction | Modifying Factors |
|---|---|---|---|---|
| Sympathetic Neurons | Endogenous release via tBid | Minimal in healthy cells | <10% apoptosis | NGF maintenance prevents activation |
| Sympathetic Neurons + DHEA | Endogenous release via tBid | Robust caspase-9 processing | >80% apoptosis | PPP inhibition increases ROS |
| Pancreatic Cancer Lines | 10-100 μg/ml exogenous cyt c | Variable processing between lines | 15-85% variation in response | Correlates with Apaf-1/caspase levels |
| MCF-7 Breast Cancer | Natural extract-induced release | Caspase-9/3 activation | Significant growth inhibition | Enhanced by Bax expression |
Visualization of Key Mechanisms and Workflows
Cytochrome c Release and Apoptotic Signaling Pathway
Diagram Title: Cytochrome c-Mediated Apoptotic Pathway and Regulation
Experimental Workflow: Neuronal vs. Cancer Cell Models
Diagram Title: Experimental Workflows for Cytochrome c Research
The Scientist's Toolkit: Essential Research Reagents
Table 3: Key Research Reagents for Cytochrome c Release Studies
| Reagent/Category | Specific Examples | Function/Application | Experimental Use |
|---|---|---|---|
| Apoptosis Inducers | tBid, BH3 peptides, Bax protein | Trigger cytochrome c release from mitochondria | Neuronal microinjection; Cell-free systems |
| Caspase Inhibitors | BAF, z-VAD-fmk | Block caspase activity to study pre-caspase events | Neuronal rescue experiments; Pathway dissection |
| Redox Modulators | H₂O₂, GSH, DEM, BSO | Alter cellular redox environment | Test cytochrome c redox sensitivity |
| Metabolic Inhibitors | DHEA, 6-AN | Inhibit pentose phosphate pathway | Study glucose metabolism-apoptosis connection |
| Cell-Penetrating Peptides | DPT-C9h | Disrupt specific protein interactions | Therapeutic potential in cancer models |
| Detection Antibodies | Anti-cytochrome c, Anti-Apaf-1, Anti-caspases | Detect expression and localization | Western blot, Immunocytochemistry |
| Viability Assays | Annexin V, PI staining, MTT | Quantify apoptosis and cell death | End-point analysis across models |
Technical Protocols for Core Methodologies
Cytochrome c Release Assay in Cell-Free Systems
Cytosolic Extract Preparation:
- Culture cells to sub-confluent state in appropriate medium
- Wash cells in phosphate-buffered saline, trypsinize, and pellet by centrifugation
- Resuspend cell pellet in hypotonic lysis buffer (20 mM HEPES-KOH pH 7.5, 10 mM KCl, 1.5 mM MgCl₂, 1 mM Na-EDTA, 1 mM Na-EGTA) supplemented with protease inhibitor cocktail and 2 mM DTT
- Incubate on ice for 15 minutes to allow swelling
- Lyse cells by passaging 5-20 times through a 22-gauge needle until 80-100% cell lysis (confirm by eosin exclusion)
- Centrifuge lysate at 10,000g for 30 minutes at 4°C
- Collect supernatant as cytosolic fraction and immediately freeze at -70°C [36]
Caspase Activation Assay:
- Thaw cytosolic extracts on ice and determine protein concentration
- Incubate extracts with varying concentrations of cytochrome c (10-100 μg/ml) in the presence of 1 mM dATP and 1 mM DTT
- Maintain reaction at 37°C for 1 hour
- Measure effector caspase activity using fluorogenic substrate Ac-DEVD-AMC
- Monitor fluorescence (excitation 360 nm, emission 460 nm) over time
- Calculate regression coefficient of linear fluorescence increase as effector caspase activity [36]
Redox State Modulation Protocol
Manipulating Neuronal Redox Environment:
- Maintain sympathetic neurons from XIAP-deficient mice to eliminate IAP confounding effects
- Create oxidized environment: Treat with low-level H₂O₂ (10-50 μM) for 2-4 hours prior to cytochrome c challenge
- Create reduced environment: Treat with cell-permeable glutathione (GSH, 1-5 mM) for 2-4 hours prior to cytochrome c challenge
- Inhibit glutathione synthesis: Treat with buthionine-sulfoximine (BSO, 100-500 μM) for 12-24 hours
- Inhibit pentose phosphate pathway: Treat with dehydroepiandrosterone (DHEA, 50-200 μM) or 6-anicotinamide (6-AN, 1-5 mM) for 12-24 hours [33] [34]
Reduction of Exogenous Cytochrome c:
- Prepare oxidized cytochrome c solution (1-5 mg/ml in appropriate buffer)
- Incubate with cytochrome c reductase (follow manufacturer's concentration) or 1-5 mM dithiothreitol (DTT) for 30-60 minutes at 25°C
- Verify reduction by spectrophotometry (reduced cyt c has characteristic 550 nm peak)
- Use reduced cytochrome c for microinjection or cell-free systems within 2 hours [33]
The complementary use of sympathetic neuron and cancer cell line models has revealed the complex regulation of cytochrome c-mediated apoptosis. From neurons, we have learned that cytochrome c release is not necessarily committed to cell death and can be reversed under specific conditions. From cancer models, we understand how malignant cells exploit regulatory mechanisms to evade apoptosis. The emerging paradigm indicates that both systems share fundamental regulatory principles, particularly regarding redox control of cytochrome c activity through glucose metabolism.
These experimental approaches continue to evolve with advanced imaging techniques, genetic manipulation tools, and more sophisticated cell-free systems. The integration of findings from both model systems provides a more comprehensive understanding of cytochrome c biology with significant implications for therapeutic development in neurodegenerative diseases and cancer. Researchers should consider the comparative strengths of each system when designing experiments to probe specific aspects of the intrinsic apoptosis pathway.
This technical guide details three cornerstone methodologies—subcellular fractionation, immunofluorescence, and live-cell imaging—within the specific context of researching the mitochondrial intrinsic apoptosis pathway. A central event in this pathway is the release of cytochrome c (Cyt c) from the mitochondrial intermembrane space into the cytosol, which triggers the formation of the apoptosome and the subsequent activation of executioner caspases, leading to programmed cell death [38] [39]. Understanding the mechanisms governing Cyt c release is crucial for fundamental biology and has significant implications for drug discovery, particularly in cancer and neurodegenerative diseases. This document provides an in-depth analysis of each technique's principles, protocols, and application to the study of this critical apoptotic event, serving as a resource for researchers and drug development professionals.
Methodological Foundations and Applications in Cytochrome c Research
The following table summarizes the core attributes, applications, and limitations of the three key methodologies in the context of intrinsic pathway research.
Table 1: Core Methodologies for Investigating the Intrinsic Apoptosis Pathway
| Methodology | Core Principle | Key Application in Cyt c Research | Primary Output | Key Advantages | Inherent Limitations |
|---|---|---|---|---|---|
| Subcellular Fractionation | Physical separation of cellular components based on properties like density, size, and charge via differential and density-gradient centrifugation [40]. | Quantitative analysis of Cyt c release from mitochondria; assessment of subcellular drug disposition [41] [42] [43]. | Isolated organelle fractions (e.g., pure mitochondria) for biochemical analysis. | Provides quantitative, biochemical data on protein localization and distribution. | Disrupts native cellular context; potential for cross-contamination between fractions. |
| Immunofluorescence | Localization of target antigens within fixed cells or tissues using labeled antibodies, coupled with fluorescence microscopy [44]. | Spatial visualization of Cyt c release, showing its transition from a punctuate mitochondrial pattern to a diffuse cytoplasmic distribution. | High-resolution, static images of protein localization. | Excellent spatial resolution; allows for co-localization studies with other organelle markers. | Provides only a snapshot in time; potential for artifacts from fixation and permeabilization. |
| Live-Cell Imaging | Direct, real-time observation of dynamic processes in living cells using fluorescent tags and advanced microscopy [45] [46]. | Kinetic analysis of Cyt c release and subsequent events (e.g., caspase activation) in single cells; reveals heterogeneity in apoptotic responses. | Time-lapse videos of cellular processes. | Captures dynamic kinetics and cellular heterogeneity in real time. | Risk of phototoxicity and photobleaching; requires sophisticated equipment and analysis tools. |
Subcellular Fractionation: A Quantitative Approach
Subcellular fractionation is a foundational biochemical technique for obtaining quantitative data on the intracellular distribution of proteins and drugs.
Detailed Experimental Protocol: Mitochondrial Isolation
A standard protocol for isolating mitochondria from cultured cells, a prerequisite for studying Cyt c release, involves the following steps [40]:
- Cell Harvest and Homogenization: A pellet of cultured cells (e.g., the human leukemic cell line U-937) is resuspended in a cold, isotonic homogenization buffer (e.g., containing 0.25 M sucrose, 10 mM Tris-HCl, pH 7.4, 1 mM EDTA, and protease inhibitors). The cells are then gently disrupted using a Dounce homogenizer. The high-sucrose buffer maintains osmotic pressure to preserve organelle integrity.
- Differential Centrifugation:
- Low-Speed Spin: The homogenate is centrifuged at low speed (e.g., 1,000 × g for 10 minutes at 4°C) to pellet intact cells, nuclei, and heavy debris.
- Mitochondrial Pellet: The resulting post-nuclear supernatant is transferred to a new tube and centrifuged at a higher speed (e.g., 12,000 × g for 15 minutes at 4°C). This pellets the crude mitochondrial fraction, which also contains other dense organelles like lysosomes and peroxisomes.
- Cytosolic Supernatant: The supernatant from this spin represents the cytosolic fraction and can be saved for further analysis, such as western blotting for released Cyt c.
- Washing and Resuspension: The crude mitochondrial pellet is gently resuspended in fresh homogenization buffer and re-centrifuged at 12,000 × g to wash away contaminating proteins. The final, enriched mitochondrial pellet is resuspended in an appropriate buffer for downstream applications (e.g., respiration assays or protein quantification).
To achieve higher purity, the crude mitochondrial fraction can be further purified using density-gradient centrifugation in media such as Percoll or iodixanol, which separates organelles based on their buoyant densities [40].
Application: Quantifying Cytochrome c Release
To study apoptosis, researchers induce the intrinsic pathway (e.g., with UV radiation or chemotherapeutic agents) in one population of cells while keeping another as a control. After subcellular fractionation, the cytosolic and mitochondrial fractions are analyzed by western blotting. In healthy cells, Cyt c is detected only in the mitochondrial fraction. Upon apoptosis induction, a significant increase in Cyt c is observed in the cytosolic fraction, providing direct biochemical evidence of mitochondrial outer membrane permeabilization (MOMP) [38] [39]. This approach can be coupled with high-performance liquid chromatography (HPLC) for precise quantification of small molecules, such as anticancer drugs, within isolated fractions [41] [42].
Immunofluorescence: Spatial Localization
Immunofluorescence (IF) provides high-resolution spatial information about protein localization within the cellular architecture.
Detailed Experimental Protocol
A standard indirect immunofluorescence protocol for visualizing cytochrome c involves several key stages [44]:
- Sample Preparation and Fixation: Cells grown on glass coverslips are rinsed with phosphate-buffered saline (PBS) and then fixed, typically with a crosslinking agent like 4% paraformaldehyde for 15-20 minutes at room temperature. Fixation preserves cellular structure and immobilizes antigens.
- Permeabilization and Blocking: Cells are permeabilized with a detergent (e.g., 0.1% Triton X-100 in PBS) for 10 minutes to allow antibodies access to the interior of the cell. A blocking step (e.g., with 5% bovine serum albumin or normal serum) is then performed for 1 hour to reduce non-specific antibody binding.
- Antibody Incubation:
- Primary Antibody: The sample is incubated with a primary antibody specific for cytochrome c (e.g., a mouse anti-cytochrome c IgG) for 1-2 hours at room temperature or overnight at 4°C.
- Washing: Unbound antibody is removed by washing several times with PBS.
- Secondary Antibody: A fluorochrome-conjugated secondary antibody (e.g., Alexa Fluor 488-conjugated goat anti-mouse IgG) is applied for 1 hour in the dark. This step provides signal amplification.
- Counterstaining and Mounting: A nuclear counterstain, such as DAPI (4',6-diamidino-2-phenylindole), is often applied. The coverslip is then mounted onto a glass slide using an anti-fade mounting medium to preserve fluorescence.
Application: Visualizing Cytochrome c Release
In non-apoptotic cells, immunofluorescence reveals cytochrome c in a punctate pattern that co-localizes with mitochondrial markers, outlining the mitochondrial network. Upon induction of apoptosis, this pattern is lost, and a diffuse, pan-cellular fluorescence is observed, confirming the release of Cyt c from mitochondria into the cytosol [38]. This visual proof is a cornerstone of apoptosis research. Optimization steps, such as antigen retrieval methods and the use of signal-enhancing reagents, can be critical for improving the signal-to-noise ratio in IF [44].
Live-Cell Imaging: Kinetic Analysis
Live-cell imaging allows for the direct observation of dynamic biological processes, such as Cyt c release, as they unfold in real time.
Technical Foundations and Workflow
The core workflow involves:
- Fluorescent Labeling: Cytochrome c is tagged with a fluorescent protein (e.g., GFP) either via transfection or by using fluorescently labeled protein binders. Cells can also be loaded with dyes that mark other organelles (e.g., MitoTracker for mitochondria) [47].
- Microscopy and Environmental Control: Cells are imaged on a microscope (e.g., spinning-disk confocal or light-sheet) equipped with an environmental chamber that maintains physiological temperature, humidity, and CO₂ levels to ensure cell viability throughout the experiment.
- Image Acquisition and Analysis: Time-lapse images are captured at regular intervals. Advanced computational methods, such as the Richardson–Lucy spectral unmixing algorithm (RLSU), can be employed to accurately unmix signals from multiple fluorophores, even in low signal-to-noise ratio conditions typical of live-cell imaging [47].
Application: Monitoring Apoptosis Kinetics
Live-cell imaging of cells expressing Cyt c-GFP reveals the precise timing and kinetics of its release. This is not an all-or-nothing event across the entire cell population; individual cells undergo release at different times after the apoptotic stimulus. The process itself is typically rapid, occurring within minutes for a single cell, and can be correlated with other apoptotic markers, such as caspase activation or changes in mitochondrial membrane potential (detected with dyes like JC-1 or TMRM) [45] [39] [47]. The market for live-cell imaging is growing, valued at approximately USD 2.88 billion in 2024, driven by its critical role in drug discovery and the development of advanced technologies like AI-powered imaging platforms [45] [46].
Integrated Workflow and Signaling Pathway
The following diagram synthesizes the methodological workflows and their relationship to the intrinsic apoptosis pathway, illustrating how each technique provides complementary data on the process of cytochrome c release.
Diagram 1: Integrated methodological workflows for studying cytochrome c release via the intrinsic apoptosis pathway. Each technique (Subcellular Fractionation, Immunofluorescence, Live-Cell Imaging) probes the central event of cytochrome c release, providing quantitative, spatial, and kinetic data, respectively. MOMP: Mitochondrial Outer Membrane Permeabilization.
Research Reagent Solutions
The following table catalogues essential reagents and tools utilized in experiments investigating cytochrome c release and intrinsic apoptosis.
Table 2: Key Research Reagents for Cytochrome c and Apoptosis Studies
| Reagent / Tool | Function / Specific Example | Key Application in Cyt c Research |
|---|---|---|
| Cell Lines | Model systems for study. U-937 human leukemic cell line [41]; ColorfulCell plasmid system expressing multiple organelle-targeted fluorescent proteins [47]. | Used for subcellular fractionation and drug disposition studies; enables multiplexed live-cell imaging of organelle dynamics. |
| Centrifugation Media | Media for density-based separation of organelles. Sucrose, mannitol, Percoll, iodixanol (OptiPrep) [40]. | Used in differential and density-gradient centrifugation to isolate pure mitochondrial and cytosolic fractions. |
| Antibodies | Proteins for specific antigen detection. Primary antibodies against cytochrome c; fluorescently-labeled secondary antibodies [44]. | Essential for immunofluorescence visualization and western blot confirmation of cytochrome c localization and release. |
| Fluorescent Probes & Dyes | Markers for visualization and functional assays. Lysotracker Red [41]; MitoTracker; DAPI; Hoechst; Annexin V [39]; JC-1/TMRM [39]. | Label lysosomes and mitochondria; stain nuclei; detect phosphatidylserine externalization (early apoptosis); measure mitochondrial membrane potential (ΔΨm). |
| Fluorescent Proteins & Tags | Genetic tags for live-cell imaging. GFP, TagBFP, mCherry, and other fusions with cytochrome c or organelle markers [47]. | Enable real-time, kinetic tracking of cytochrome c location and release in living cells. |
| Apoptosis Inducers | Chemical or physical agents to trigger the intrinsic pathway. UV radiation, chemotherapeutic agents (e.g., Doxorubicin [41]), staurosporine. | Positive controls for experimentally inducing mitochondrial outer membrane permeabilization and cytochrome c release. |
| Spectral Unmixing Software | Computational tools for separating overlapping fluorescent signals. Richardson–Lucy Spectral Unmixing (RLSU) algorithm [47]. | Critical for accurate live-cell imaging when using multiple fluorophores with overlapping emission spectra. |
Subcellular fractionation, immunofluorescence, and live-cell imaging are powerful, complementary methodologies that, when integrated, provide a comprehensive understanding of the cytochrome c-dependent intrinsic apoptosis pathway. Subcellular fractionation offers robust quantitative data on the biochemical event of release, immunofluorescence delivers high-resolution spatial context, and live-cell imaging reveals the dynamic kinetics and heterogeneity of the process in real time. The continuous advancement of these technologies—such as improved fractionation protocols for proteomics, enhanced antibody signal amplification, and the integration of AI with live-cell imaging—promises to yield even deeper insights into the regulation of cell death. This knowledge is invaluable for identifying novel therapeutic targets and screening compounds for drug development in diseases characterized by dysregulated apoptosis.
Apoptosis, or programmed cell death, is a fundamental process for maintaining cellular homeostasis, with its dysregulation implicated in diseases ranging from cancer to neurodegeneration [48] [39]. A pivotal event in the intrinsic apoptotic pathway is the release of cytochrome c from the mitochondrial intermembrane space into the cytosol [38]. This release occurs following cellular stress signals, such as DNA damage or oxidative stress, which trigger mitochondrial outer membrane permeabilization (MOMP) [38] [39]. Once in the cytosol, cytochrome c binds to the adaptor protein Apaf-1, facilitating the formation of the apoptosome complex. This complex recruits and activates caspase-9, which in turn proteolytically cleaves and activates downstream effector caspases, such as caspase-3 and -7, culminating in the organized dismantling of the cell [38] [39]. This technical guide details the core methodologies for measuring two critical downstream outcomes of this cascade: caspase activation and DNA fragmentation, providing researchers with robust protocols for quantifying apoptotic progression.
Caspase Activation Assays
Caspases are a family of cysteine proteases synthesized as inactive zymogens that become activated through proteolytic cleavage during apoptosis. Their activity represents a committed step in the cell death process [49] [39].
Key Methodologies and Principles
Caspase activation can be detected by several methods, each with unique strengths and applications. The table below summarizes the primary approaches for detecting caspase activation.
Table 1: Key Caspase Activation Assay Methodologies
| Method | Principle | Key Outputs | Advantages | Limitations |
|---|---|---|---|---|
| Fluorogenic/Luminescent Substrate Assays [50] [51] | Caspases cleave synthetic substrates (e.g., DEVD) conjugated to a fluorophore or luminogen, releasing a fluorescent or luminescent signal. | Fluorescence/ Luminescence intensity proportional to caspase activity. | Amenable to high-throughput screening; quantitative. | Measures activity in a population, not single cells. |
| Immunoblotting [49] [48] | Antibodies detect the cleavage of procaspases into active fragments or the cleavage of caspase substrates (e.g., PARP). | Presence and intensity of protein bands indicating cleavage. | Confirms specific caspase activation and provides semi-quantitative data. | Semi-quantitative; requires cell lysis. |
| Flow Cytometry/Microscopy with Active Caspase Antibodies [48] | Antibodies specifically recognizing the active conformation of caspases are used to label cells. | Percentage of positively stained cells and fluorescence intensity. | Single-cell resolution within a population; can be multiplexed with other probes. | Requires specific, validated antibodies. |
| Live-Cell Analysis with Cell-Permeant Reagents [50] [51] | Non-fluorescent, cell-permeant substrates (e.g., NucView) are cleaved by active caspases, releasing a DNA-binding dye that stains nuclei. | Real-time kinetic data and visualization of apoptotic morphology. | Enables real-time, kinetic analysis without cell disruption; visual validation. | Substrate access can be variable. |
Detailed Experimental Protocol: Fluorometric Caspase-3/7 Activity Assay
This protocol is adapted for a plate-reader format to quantify the activity of executioner caspases-3 and -7, key effectors downstream of cytochrome c-induced caspase-9 activation [48].
Materials:
- Research Reagent Solutions: Cell lysis buffer, Fluorogenic caspase-3/7 substrate (Ac-DEVD-AFC or similar), Reaction buffer, Positive control inducer (e.g., 1 µM Staurosporine), ATP, dATP
- Equipment: Microcentrifuge, Spectrophotometer or fluorometric microplate reader, Cell culture incubator
Procedure:
- Cell Treatment and Harvest: Induce apoptosis in cells (e.g., with 1 µM Staurosporine for 4-6 hours). Harvest cells by gentle centrifugation (300 x g for 5 minutes). Wash the cell pellet with cold PBS.
- Cell Lysis: Lyse the cell pellet in a chilled, appropriate lysis buffer (e.g., containing 1% Triton X-100, 10 mM Tris-HCl pH 7.4, 5 mM EDTA) for 30 minutes on ice. Centrifuge the lysate at 12,000 x g for 15 minutes at 4°C to remove cellular debris.
- Protein Quantification: Determine the protein concentration of the supernatant using a standard protein assay (e.g., BCA assay). This step is critical for normalizing caspase activity.
- Reaction Setup: In a 96-well plate, combine:
- 50 µg of total protein lysate.
- Reaction buffer (e.g., 100 mM HEPES, pH 7.4, 1% sucrose, 0.1% CHAPS).
- The fluorogenic substrate (e.g., 50 µM Ac-DEVD-AFC).
- Bring the total volume to 100 µL with reaction buffer. The presence of ATP or dATP (1-2 mM) can be included to support apoptosome function in reconstitution experiments [38].
- Incubation and Measurement: Incubate the reaction mixture at 37°C for 1-2 hours. Protect the plate from light. Measure the fluorescence (Ex/Em ~400/505 nm for AFC) at regular intervals using a fluorometric plate reader.
- Data Analysis: Calculate caspase activity as the change in fluorescence per unit time per microgram of protein. Compare treated samples to untreated controls and a blank (reaction mixture without lysate).
Diagram: Workflow for Caspase-3/7 Fluorometric Assay
DNA Fragmentation Assays
DNA fragmentation into oligonucleosomal-sized pieces is a biochemical hallmark of the late execution phase of apoptosis, resulting from the activation of caspase-dependent nucleases like CAD (Caspase-Activated DNase) [52] [39].
Key Methodologies and Principles
Several techniques are available to detect this characteristic DNA cleavage, ranging from simple gel-based methods to sophisticated quantitative assays.
Table 2: Key DNA Fragmentation Assay Methodologies
| Method | Principle | Key Outputs | Advantages | Limitations |
|---|---|---|---|---|
| DNA Laddering (Gel Electrophoresis) [52] [39] | Extraction and separation of genomic DNA on an agarose gel to visualize internucleosomal cleavage. | Characteristic "ladder" of DNA fragments in ~180-200 bp increments. | Simple, cost-effective, and provides visual hallmark of apoptosis. | Semi-quantitative; requires large number of cells; low sensitivity. |
| TUNEL Assay (TdT dUTP Nick End Labeling) [48] [53] | Enzyme Terminal deoxynucleotidyl Transferase (TdT) labels 3'-OH ends of DNA breaks with fluorescent dUTP. | Fluorescence intensity (flow cytometry) or stained nuclei (microscopy). | High sensitivity; can detect early fragmentation; single-cell resolution. | Can give false positives if not optimized; measures strand breaks, not always apoptosis-specific. |
| Comet Assay (Single-Cell Gel Electrophoresis) [54] | Individual cells embedded in agarose are lysed and subjected to electrophoresis; damaged DNA migrates, forming a "comet tail." | Tail length, intensity, and moment, quantifying DNA damage. | Extremely sensitive; can detect low levels of damage; single-cell resolution. | Technically challenging; not high-throughput. |
| Sperm Chromatin Structure Assay (SCSA) [55] [54] | Sperm DNA is denatured; metachromatic dye acridine orange fluoresces red with single-stranded DNA. | DNA Fragmentation Index (%DFI). | High-throughput; standardized for sperm DNA fragmentation. | Primarily used in andrology research. |
Detailed Experimental Protocol: DNA Laddering Assay
This classic protocol provides a robust, semi-quantitative method for confirming apoptosis through the visualization of internucleosomal DNA cleavage [52].
Materials:
- Research Reagent Solutions: Lysis buffer (10 mM Tris pH 7.4, 5 mM EDTA, 0.2% Triton X-100), DNase-free RNase A (10 mg/mL), Proteinase K (20 mg/mL), Phenol/Chloroform/Isoamyl Alcohol (25:24:1), Ethanol, 3M Sodium Acetate (pH 5.2), Tris-Acetate-EDTA (TAE) buffer, Ethidium bromide or safer DNA stain
- Equipment: Refrigerated microcentrifuge, Water bath or incubator (37°C, 65°C), Agarose gel electrophoresis system, UV transilluminator or gel doc system
Procedure:
- Harvest and Lyse Cells: Pellet 1-5 x 10^6 cells by centrifugation. Carefully resuspend the cell pellet in 0.5 mL of cold lysis buffer. Vortex and incubate on ice for 30 minutes.
- Separate Fragmented DNA: Centrifuge the lysate at 27,000 x g for 30 minutes at 4°C. The supernatant contains the fragmented, low-molecular-weight DNA, while the pellet contains intact chromatin and cell debris.
- Precipitate DNA: Transfer the supernatant to a new tube. Add 50 µL of 5 M NaCl and vortex. Add 600 µL of 100% ethanol and 150 µL of 3 M sodium acetate (pH 5.2). Mix thoroughly and incubate at -80°C for 1 hour to precipitate the DNA.
- Pellet and Wash DNA: Centrifuge at 20,000 x g for 20 minutes at 4°C to pellet the DNA. Carefully discard the supernatant without disturbing the loose pellet. Wash the pellet with 500 µL of 70% ethanol and centrifuge again for 15 minutes.
- Digest RNA and Proteins: Air-dry the pellet and resuspend it in 400 µL of extraction buffer (10 mM Tris, 5 mM EDTA). Add 2 µL of DNase-free RNase A and incubate for 5 hours at 37°C. Then, add 25 µL of Proteinase K and 40 µL of buffer (100 mM Tris pH 8.0, 100 mM EDTA, 250 mM NaCl) and incubate overnight at 65°C.
- Purify and Precipitate DNA: Extract the DNA once with an equal volume of Phenol/Chloroform/Isoamyl Alcohol. Centrifuge and transfer the aqueous upper phase to a new tube. Precipitate the DNA with ethanol as in step 3, and finally resuspend the air-dried pellet in 20 µL of TAE buffer.
- Visualize DNA Fragmentation: Load the DNA sample onto a 2% agarose gel containing 1 µg/mL ethidium bromide. Run the gel at 50 V for 2 hours in 0.5x TBE buffer. Visualize the DNA under UV light. Apoptotic samples will show a characteristic ladder pattern, while viable cells will show a high molecular weight band, and necrotic cells may show a "smear."
Diagram: Relationship Between Cytochrome c Release and DNA Fragmentation
The Scientist's Toolkit: Essential Research Reagents
The following table catalogs key reagents essential for conducting the assays described in this guide.
Table 3: Essential Research Reagents for Apoptosis Assays
| Reagent/Category | Specific Examples | Function in Apoptosis Assay |
|---|---|---|
| Caspase Substrates | Ac-DEVD-AFC, Ac-DEVD-AMC, NucView 488 Caspase-3/7 Substrate [50] [51] | Fluorogenic or chromogenic probes cleaved by active caspases to generate a measurable signal. |
| Antibodies for Immunodetection | Anti-active Caspase-3, Anti-cleaved PARP, Anti-cytochrome c [49] [48] | Detect specific protein cleavage or subcellular relocation (e.g., cytochrome c release) via Western blot or immunofluorescence. |
| Viability & Membrane Probes | Annexin V conjugates (FITC, PE), Propidium Iodide (PI), 7-AAD [48] | Label exposed phosphatidylserine (Annexin V) or permeabilized membranes (PI) to distinguish apoptotic from necrotic cells. |
| DNA Staining & Labeling | Terminal deoxynucleotidyl Transferase (TdT), Tunnelyte-dUTP, Acridine Orange, Ethidium Bromide [52] [53] | Enzymes and tags for TUNEL assay; intercalating dyes for visualizing DNA on gels or quantifying fragmentation. |
| Apoptosis Inducers | Staurosporine, Camptothecin, TNF-α + Cycloheximide [50] [51] | Positive control compounds that trigger intrinsic or extrinsic apoptosis pathways to validate assays. |
| Critical Buffers & Kits | Cell Lysis Buffer, Incucyte Caspase-3/7 Dyes, Cell Meter TUNEL Apoptosis Assay Kits [52] [50] [53] | Optimized solutions and commercial kits for specific, reproducible assay performance. |
The precise measurement of caspase activation and DNA fragmentation is indispensable for delineating the apoptotic cascade initiated by cytochrome c release. While DNA laddering provides a classical confirmation of late-stage apoptosis, TUNEL and comet assays offer greater sensitivity for quantification and single-cell analysis. Similarly, caspase activity assays, particularly those adaptable to live-cell kinetic analysis, provide powerful insights into the timing and commitment to cell death. The choice of assay(s) should be guided by the specific research question, required throughput, and need for quantification. Often, a combination of these methodologies, corroborated with the detection of cytochrome c release itself, provides the most comprehensive assessment of apoptotic activity in intrinsic pathway research.
Cytochrome c Release as a Biomarker for Treatment Efficacy and Toxicity
Cytochrome c (cyt c) is a multifunctional hemoprotein primarily known for its vital role in the mitochondrial electron transport chain, where it facilitates ATP synthesis [14] [56]. However, its translocation from the mitochondrial intermembrane space to the cytosol serves as the pivotal trigger for the intrinsic apoptotic pathway [14] [57]. Beyond its intracellular roles, cytochrome c is released into the extracellular space following cellular damage, detectable in serum and urine, which positions it as a promising, quantifiable biomarker for monitoring treatment-induced cell death and tissue injury [58] [59]. This technical guide elaborates on the mechanistic role of cytochrome c release, its application in assessing therapeutic efficacy and toxicity in drug development, and provides detailed methodologies for its detection and quantification.
Cytochrome c in the Intrinsic Apoptotic Pathway
Molecular Mechanisms of Release
The release of cytochrome c from mitochondria is a decisive step in intrinsic apoptosis, initiated by diverse cellular stresses, including DNA damage and metabolic stress [14] [56]. In healthy cells, cytochrome c is confined to the mitochondrial intermembrane space, often associated with the phospholipid cardiolipin in the inner membrane [14]. Pro-apoptotic stimuli, regulated by the BCL-2 protein family, lead to mitochondrial outer membrane permeabilization (MOMP). This process facilitates the mobilization of cytochrome c from cardiolipin and its subsequent translocation into the cytosol [14] [56].
Apoptosome Formation and Caspase Activation
Upon entering the cytosol, cytochrome c binds to the adapter protein Apoptotic Protease-Activating Factor 1 (Apaf-1) in the presence of ATP/dATP. This binding triggers the oligomerization of Apaf-1 into a wheel-like signaling complex known as the apoptosome, which exhibits a heptameric structure in humans [57] [56]. The apoptosome then recruits and activates the initiator caspase, procaspase-9, which in turn cleaves and activates effector caspases-3 and -7, executing the apoptotic program [57] [56]. The figure below illustrates this key signaling pathway.
Cytochrome c as a Biomarker for Treatment Efficacy
Monitoring Chemotherapy-Induced Apoptosis
The quantification of cytochrome c in patient serum serves as a non-invasive method to monitor the efficacy of apoptosis-inducing cancer therapies. Effective chemotherapy promotes mitochondrial outer membrane permeabilization, leading to the release of cytochrome c into the cytoplasm and subsequently into the bloodstream [58] [59].
Key Clinical Evidence:
- In patients with non-small cell lung cancer, serum cytochrome c levels increased more than 13-fold after the first cycle of conventional chemotherapy [58] [59].
- In patients with operable malignant tumors, survival was poorer in patients with serum cytochrome c levels below 40 ng/mL. The optimal cut-off values for predicting metastasis and invasion were 22.7 ng/mL and 22.3 ng/mL, respectively [59].
- Research in breast cancer has identified eight cytochrome c-related prognostic genes (CETP, CLEC11A, CYP2A6, CYP2A7, GZMB, HGF, LDHC, and PLAU). A risk model based on these genes demonstrated that low-risk individuals have significantly higher survival rates [60].
Quantitative Data on Serum Cytochrome c Levels
Table 1: Serum Cytochrome c Levels in Pathological Conditions and Treatment Response
| Condition / Intervention | Serum Cytochrome c Level | Clinical Significance / Correlation |
|---|---|---|
| Healthy Individuals | 13.6 - 39.8 ng/mL [59], ~112 pg/mL [59] | Baseline reference range. |
| Newly Diagnosed NSCLC | ~3-fold lower than healthy [58] | Suggests apoptosis inhibition in cancer. |
| Post-Chemotherapy (NSCLC) | >13-fold increase from pre-treatment [58] [59] | Indicates therapy-induced apoptosis. |
| Operable Malignant Tumors | Median: 20.6 ng/mL [59] | Levels >40 ng/mL correlated with poorer survival [59]. |
| Acute Liver Failure | Mean: 10,686 pg/mL [59] | Correlated with severity of hepatic coma. |
| Systemic Inflammatory Response Syndrome (SIRS) | Mean: 12.09 ng/mL (Sepsis) to 39.1 ng/mL (Acute Pancreatitis) [59] | Correlated with APACHE II and multiorgan failure scores. |
Cytochrome c as a Biomarker for Treatment Toxicity
Drug-induced tissue injury often involves mitochondrial damage and the initiation of apoptosis or necrosis, leading to cytochrome c release into the circulation. Its detection can serve as an early, sensitive biomarker for organ toxicity, particularly in the liver and kidneys [61] [59] [62].
Drug-Induced Liver Injury (DILI)
In rodent models of acetaminophen- or D-galactosamine-induced hepatotoxicity, serum and urinary cytochrome c levels increased in a dose- and time-dependent manner, peaking at 24 hours [61]. Immunohistochemistry confirmed the transit of cytochrome c from mitochondria to the cytoplasm and then into the peripheral circulation in damaged hepatocytes [61]. The utility of urinary cytochrome c was particularly notable, showing a time-dependent increase as early as 6 hours post-insult, whereas traditional markers like ALT and AST showed irregular patterns [61].
Drug-Induced Acute Kidney Injury (AKI)
Cytochrome c shows potential as an early, non-invasive biomarker for AKI. Its release indicates mitochondrial damage, one of the earliest events in cellular injury [62]. It has been detected in the plasma and urine in experimental and clinical AKI [59] [62]. However, a disadvantage is its transient increase and lack of specificity to the kidney, as it is a general marker of cell death burden in any organ [62].
Experimental Protocols for Detection and Analysis
Detecting Cytochrome c in Serum and Plasma
Objective: To quantify extracellular cytochrome c levels for monitoring treatment efficacy or toxicity.
Methodology Details:
- Sample Collection: Collect blood samples in serum separator tubes or EDTA/ heparin plasma tubes. Centrifuge at 1000-2000 × g for 10 minutes to separate serum/plasma. Aliquot and store at -80°C [58] [59].
- Quantification Assays:
- Immunoassays: Enzyme-linked Immunosorbent Assay (ELISA) is widely used. Commercial kits with anti-cytochrome c antibodies are available. The assay involves capturing cytochrome c on an antibody-coated plate, followed by detection with a labeled secondary antibody and a colorimetric substrate [58] [59].
- Advanced Biosensors: Antibody-free biosensors offer high sensitivity.
- Electrochemical Biosensors: Utilize cytochrome c's electrical properties. Cytochrome c fitting into nanocavities or transferring electrons to an electrode (e.g., glassy carbon electrode with carbon nanofibers) generates a measurable current change [58].
- Aptamer-based Biosensors: An cytochrome c-specific aptamer is immobilized on a surface. Binding to cytochrome c can be measured via differential pulse voltammetry [58] or surface-enhanced Raman scattering (SERS) [58].
- Fluorescence-based Biosensors: Use quantum dots whose fluorescence is quenched upon cytochrome c binding [58].
Experimental Workflow for Biomarker Validation
The following diagram outlines a comprehensive experimental workflow for validating cytochrome c release as a biomarker, from in vitro models to clinical correlation.
In Vitro Analysis of Cytochrome c Release
Objective: To confirm cytochrome c release and its mechanism in cell culture models.
Protocol Steps:
- Cell Culture and Treatment: Culture relevant cell lines (e.g., cancer cells for efficacy, hepatocytes for toxicity). Treat with the compound of interest and appropriate controls [60].
- Subcellular Fractionation:
- Harvest cells and wash with PBS.
- Resuspend cell pellet in a hypotonic buffer and homogenize.
- Centrifuge at low speed (e.g., 800 × g) to remove nuclei and unbroken cells.
- Centrifuge the supernatant at high speed (e.g., 12,000 × g) to obtain the heavy membrane fraction (enriched with mitochondria) and the cytosolic fraction (supernatant) [60].
- Detection of Cytochrome c:
- Western Blotting: Separate proteins from the cytosolic and mitochondrial fractions by SDS-PAGE. Transfer to a membrane and probe with anti-cytochrome c antibody. The appearance of cytochrome c in the cytosolic fraction indicates release [58].
- Immunocytochemistry (ICC): Seed cells on coverslips, treat, and fix. Permeabilize cells, stain with anti-cytochrome c antibody and a fluorescent secondary antibody, and counterstain with a mitochondrial marker (e.g., MitoTracker). Analyze via confocal microscopy for cytochrome c localization [61].
The Scientist's Toolkit: Essential Reagents and Materials
Table 2: Key Research Reagent Solutions for Cytochrome c Studies
| Reagent / Material | Function and Application | Specific Examples / Notes |
|---|---|---|
| Anti-Cytochrome c Antibodies | Core reagents for detection via Western Blot, ICC, IHC, and ELISA. | Monoclonal antibodies are preferred for consistency in immunoassays [61] [58]. |
| Commercial ELISA Kits | Ready-to-use kits for standardized quantification of cytochrome c in serum, plasma, or cell culture supernatants. | Multiple vendors offer kits; validation for specific sample types (e.g., human vs. rodent) is recommended [58] [59]. |
| Apaf-1 Protein | Essential for in vitro reconstitution of the apoptosome complex and studying caspase activation kinetics. | Recombinant, active protein is required for functional studies [57] [56]. |
| Caspase Activity Assays | Fluorogenic or colorimetric substrates to measure the downstream enzymatic activity of caspases (e.g., Caspase-3/9) as a functional readout of cytochrome c release. | substrates like Ac-DEVD-AMC (for caspase-3) and Ac-LEHD-AMC (for caspase-9) [16] [56]. |
| Mitochondrial Isolation Kits | For preparing purified mitochondrial fractions from cells or tissues to study cytochrome c release mechanisms in vitro. | Kits typically provide reagents for homogenization and differential centrifugation [60]. |
| Cytochrome c Aptamers | Synthetic DNA or RNA oligonucleotides that bind cytochrome c with high affinity; used in developing novel biosensors. | Offer an alternative to antibodies in detection platforms [58]. |
| Recombinant Cytochrome c Protein | Used as a positive control in assays, for standard curves in quantification, and in studies delivering exogenous cytochrome c to cells. | Somatic isoform is standard for most apoptosis studies [58] [16]. |
Cytochrome c release provides a critical and quantifiable link between cellular stress mechanisms and measurable biological outcomes. Its dual role as a biomarker for treatment efficacy, by indicating successful apoptosis induction in cancer cells, and for treatment toxicity, by signaling unwanted mitochondrial damage in healthy tissues, makes it invaluable in drug development. While challenges remain regarding its organ specificity and transient detection window, advanced biosensors and standardized protocols are enhancing its utility. Integrating cytochrome c monitoring into preclinical and clinical frameworks holds significant promise for personalizing therapies, optimizing dosing, and improving drug safety profiles.
The intrinsic apoptotic pathway is a tightly regulated, mitochondrial-controlled process essential for maintaining tissue homeostasis and eliminating damaged cells. At the heart of this pathway lies cytochrome c, a vital component of the electron transport chain that, when released into the cytosol, triggers the formation of the apoptosome and initiates caspase-dependent apoptosis [38]. In healthy cells, cytochrome c resides in the mitochondrial intermembrane space, but various cellular stresses induce mitochondrial outer membrane permeabilization (MOMP), facilitating its release and activation of the caspase cascade [63] [38]. Malignant cells frequently evade this programmed cell death by overexpressing anti-apoptotic proteins from the B-cell lymphoma-2 (BCL-2) family, which regulate MOMP and prevent cytochrome c release [64] [65]. This review explores the development of BCL-2 inhibitors as therapeutic agents, their mechanisms of action centered on cytochrome c release, and strategies to overcome resistance mechanisms in cancer treatment.
The BCL-2 Protein Family: Regulators of Mitochondrial Apoptosis
Classification and Structure
The BCL-2 protein family constitutes the essential gatekeepers of the intrinsic apoptotic pathway, functioning through a complex network of protein-protein interactions. These proteins are classified into three functional groups based on their structure and role in apoptosis regulation:
- Anti-apoptotic proteins (BCL-2, BCL-XL, MCL-1, BCL-W, BFL-1): Characterized by the presence of four BCL-2 homology (BH) domains (BH1-BH4), these proteins possess a hydrophobic groove that binds the BH3 domains of pro-apoptotic family members [66] [63]. Their primary function is to preserve mitochondrial integrity and prevent cytochrome c release.
- Pro-apoptotic effector proteins (BAX, BAK, BOK): These multidomain proteins contain BH1-BH3 domains and function as the executioners of MOMP. Upon activation, they oligomerize to form pores in the mitochondrial outer membrane, facilitating cytochrome c release [64] [63].
- BH3-only proteins (BIM, BID, PUMA, BAD, NOXA, HRK, BMF, BIK): These sentinel proteins sense cellular stress and damage, then interact with other BCL-2 family members to promote apoptosis either by activating BAX/BAK directly or by neutralizing anti-apoptotic proteins [66] [63].
Molecular Mechanism of Cytochrome c Release
The commitment to mitochondrial apoptosis occurs through a carefully orchestrated process of protein interactions. In response to cellular stress signals such as DNA damage, oncogenic stress, or cytotoxic insult, BH3-only proteins become activated and engage with their BCL-2 family counterparts [63]. The "activator" BH3-only proteins (BIM, BID, and to a lesser extent PUMA) can directly bind to and conformationally activate the effector proteins BAX and BAK [63]. Once activated, BAX and BAK undergo oligomerization at the mitochondrial outer membrane, forming proteolipid pores that cause MOMP [64] [38]. This permeabilization allows cytochrome c and other pro-apoptotic factors (SMAC/DIABLO, AIF, EndoG) to escape into the cytosol [38]. Cytochrome c then binds to APAF-1, triggering apoptosome formation and initiating the caspase cascade that executes cell death [38].
Table 1: The BCL-2 Protein Family: Classification and Function
| Category | Representative Members | BH Domains | Primary Function |
|---|---|---|---|
| Anti-apoptotic | BCL-2, BCL-XL, MCL-1, BCL-W, BFL-1 | BH1-BH4 | Sequester pro-apoptotic proteins and prevent MOMP |
| Pro-apoptotic Effectors | BAX, BAK, BOK | BH1-BH3 | Form mitochondrial pores to enable cytochrome c release |
| BH3-only Proteins | BIM, BID, PUMA, BAD, NOXA | BH3 only | Sense cellular stress and initiate apoptosis signaling |
Figure 1: BCL-2 Family Regulation of Cytochrome c Release and Intrinsic Apoptosis. Cellular stress activates BH3-only proteins, which neutralize anti-apoptotic proteins and activate pro-apoptotic effectors. This leads to mitochondrial outer membrane permeabilization (MOMP), cytochrome c release, and caspase-dependent apoptosis.
Development of BCL-2 Inhibitors: From Bench to Bedside
Evolution of BH3-Mimetic Therapeutics
The development of BCL-2 inhibitors represents a landmark achievement in targeted cancer therapy, stemming from decades of fundamental research on apoptotic regulation. The strategic design of these compounds centers on mimicking the function of native BH3-only proteins, thereby disrupting the protective interactions between anti-apoptotic and pro-apoptotic BCL-2 family members [67] [66]. The trajectory of BH3-mimetic development has progressed through several generations:
- First-generation inhibitors: ABT-737 was the first potent, small-molecule BH3-mimetic developed using NMR-based screening and structure-based design [67] [66]. This compound exhibited high affinity for BCL-2, BCL-XL, and BCL-W but lacked oral bioavailability, limiting its clinical utility [67].
- Second-generation inhibitors: Navitoclax (ABT-263) was developed as an orally bioavailable analog of ABT-737 [67]. While demonstrating clinical efficacy in lymphoid malignancies, navitoclax caused dose-limiting thrombocytopenia due to its inhibition of BCL-XL, which is essential for platelet survival [67] [66].
- Third-generation inhibitors: Venetoclax (ABT-199) was specifically engineered to achieve high selectivity for BCL-2 while sparing BCL-XL [67] [66]. This strategic selectivity profile maintained anticancer activity while avoiding the thrombocytopenia associated with BCL-XL inhibition, leading to its FDA approval in 2016 [67] [66].
Mechanism of Action of Selective BCL-2 Inhibitors
Venetoclax and other selective BCL-2 inhibitors function by precisely targeting the hydrophobic groove of BCL-2, the binding site for BH3 domains of pro-apoptotic proteins [67] [68]. By occupying this groove, venetoclax competitively displaces pro-apoptotic proteins such as BIM, which are then free to activate BAX and BAK [68] [63]. This direct antagonism of BCL-2's anti-apoptotic function releases the molecular brakes on apoptosis, permitting cytochrome c release and caspase activation in malignant cells that depend on BCL-2 for survival [68] [69].
Table 2: Developed BCL-2 Inhibitors: Properties and Clinical Status
| Compound | Targets | Development Status | Primary Applications | Key Limitations |
|---|---|---|---|---|
| ABT-199 (Venetoclax) | BCL-2 | FDA-approved | CLL, AML, MM | Resistance mechanisms |
| S55746 (BCL201) | BCL-2 | Phase 1 | Hematologic cancers | Under investigation |
| APG-2575 (Lisaftoclax) | BCL-2 | Phase 1/2 | Hematologic cancers | Under investigation |
| ABT-263 (Navitoclax) | BCL-2, BCL-XL, BCL-W | Phase 1/2 | Hematologic cancers, solid tumors | Thrombocytopenia |
| AZD4320 | BCL-2, BCL-XL | Preclinical | Hematologic cancers, mesothelioma | Under investigation |
| AZD0466 | BCL-2, BCL-XL | Phase 1/2 | Hematologic cancers, solid tumors | Under investigation |
| GX15-070 (Obatoclax) | BCL-2, BCL-XL, BCL-W, MCL-1 | Phase 1/2 | Hematologic cancers, solid tumors | Neurological toxicity |
| AT-101 | BCL-2, BCL-XL, BCL-W, MCL-1 | Phase 1/2 | Hematologic cancers, solid tumors | Limited efficacy |
Current Clinical Applications and Predictive Biomarkers
Hematologic Malignancies
BCL-2 inhibition has demonstrated remarkable efficacy across various hematologic malignancies, fundamentally reshaping treatment paradigms:
- Chronic Lymphocytic Leukemia (CLL): Venetoclax has achieved exceptional response rates in CLL, particularly in patients with high BCL-2 dependence [69]. BH3-profiling studies have revealed that BCL-2 dependence serves as a favorable predictive biomarker for treatment response, independent of traditional genetic markers such as IGHV mutational status or TP53 mutations [69].
- Acute Myeloid Leukemia (AML): Venetoclax in combination with hypomethylating agents has emerged as a standard treatment for elderly AML patients unfit for intensive chemotherapy [67] [70]. The efficacy correlates with the pre-existing mitochondrial priming of leukemic cells and their dependence on BCL-2 for survival [67].
- Multiple Myeloma (MM): Approximately 35% of MM patients exhibit BCL-2 overexpression, which is associated with poor prognosis [68]. Venetoclax has demonstrated particular efficacy in the subset of MM patients with the t(11;14) translocation, where BCL-2 dependence is pronounced [68].
Functional Assessment of Treatment Response
BH3-profiling has emerged as a powerful functional precision medicine technique for predicting response to BCL-2-targeted therapies. This assay measures cytochrome c release from mitochondria in response to synthetic BH3 peptides that specifically target different anti-apoptotic proteins [63] [69]. The methodology involves:
- Isolation of primary tumor cells from patient samples with viability >60% and enrichment for malignant cells >85% [69].
- Permeabilization of cellular membranes to allow controlled access of BH3 peptides to mitochondria while retaining cytochrome c.
- Exposure to specific BH3 peptides including BAD (BCL-2/BCL-XL-specific), HRK (BCL-XL-specific), MS1 (MCL-1-specific), and FS1 (BFL-1-specific), along with the mimetic drug venetoclax [69].
- Quantification of cytochrome c release via immunofluorescence or flow cytometry to determine relative dependence on specific anti-apoptotic proteins.
- Interpretation of results: Greater cytochrome c release at low peptide concentrations indicates higher functional dependence on the corresponding anti-apoptotic protein [69].
Figure 2: BH3-Profiling Workflow for Predicting BCL-2 Inhibitor Response. This functional assay measures cytochrome c release in response to specific BH3 peptides to quantify anti-apoptotic protein dependence and predict treatment sensitivity.
Resistance Mechanisms and Combination Strategies
Molecular Mechanisms of Resistance
Despite the impressive clinical efficacy of BCL-2 inhibitors, resistance remains a significant challenge through various adaptive mechanisms:
- Upregulation of alternative anti-apoptotic proteins: Malignant cells frequently compensate for BCL-2 inhibition by increasing expression of other anti-apoptotic family members, particularly MCL-1 and BCL-XL [67] [65]. This molecular adaptation maintains the block on cytochrome c release and apoptosis induction.
- Genetic mutations in BCL-2: Specific mutations in the BH3-binding groove of BCL-2 can reduce venetoclax binding affinity, diminishing its inhibitory activity [67] [70].
- Alterations in pro-apoptotic proteins: Decreased expression or function of BH3-only proteins (particularly BIM) or effector proteins (BAX/BAK) can raise the threshold for MOMP and cytochrome c release, conferring resistance [65].
- Microenvironmental protection: Stromal cells in the tumor microenvironment can provide survival signals that counteract BCL-2 inhibition through cytokine production and direct cell-cell contacts [68].
Innovative Strategies to Overcome Resistance
Contemporary research has focused on rational combination therapies and novel agents to circumvent resistance mechanisms:
- Dual BCL-2/BCL-XL inhibitors: Compounds such as AZD0466 and APG-1252 target both BCL-2 and BCL-XL, potentially overcoming resistance mediated by BCL-XL upregulation [67]. However, the therapeutic window must be carefully managed to avoid platelet toxicity from BCL-XL inhibition.
- MCL-1 inhibitors: Several MCL-1-specific inhibitors are in clinical development to address resistance driven by MCL-1 overexpression [66]. However, early-stage trials have encountered challenges with cardiac toxicity, prompting exploration of alternative targeting strategies [66].
- BCL-2 inhibitor combinations: Venetoclax combined with other targeted agents demonstrates synergistic efficacy:
- With BTK inhibitors (ibrutinib, acalabrutinib): Simultaneously targets BCR signaling and apoptosis pathways [69].
- With CDK9 inhibitors: Suppresses MCL-1 transcription by inhibiting RNA polymerase II phosphorylation [67].
- With proteasome inhibitors (bortezomib, carfilzomib): Promotes accumulation of pro-apoptotic proteins while simultaneously disrupting protein homeostasis [64].
- With hypomethylating agents (azacitidine, decitabine): Sensitizes cells to apoptosis by altering expression of BCL-2 family members [67].
Table 3: Combination Strategies to Overcome Resistance to BCL-2 Inhibitors
| Combination Partner | Mechanism of Synergy | Malignancies Tested | Key Findings |
|---|---|---|---|
| BTK Inhibitors | Targets BCR signaling; reduces MCL-1 expression | CLL, NHL | Enhanced apoptosis; overcomes microenvironment-mediated resistance |
| CDK9 Inhibitors | Reduces MCL-1 transcription and protein levels | AML, MM | Counteracts MCL-1-mediated resistance |
| Proteasome Inhibitors | Increases pro-apoptotic protein accumulation; disrupts protein homeostasis | MM, NHL | Synergistic apoptosis induction; overcomes stromal protection |
| Hypomethylating Agents | Alters expression of BCL-2 family members; promotes differentiation | AML, MDS | Superior outcomes in elderly/unfit patients |
| PIM Kinase Inhibitors | Reduces MCL-1 stability; enhances BIM activity | AML, Lymphoma | Overcomes multiple resistance mechanisms |
| MEK Inhibitors | Downregulates MCL-1 expression; enhances BIM activation | AML, Solid tumors | Addresses resistance in RAS-mutated cancers |
The Scientist's Toolkit: Key Research Reagent Solutions
Table 4: Essential Research Tools for Studying BCL-2 Inhibitors and Apoptosis
| Research Tool | Specific Examples | Primary Application | Technical Considerations |
|---|---|---|---|
| BH3 Profiling Peptides | BAD (BCL-2/BCL-XL), HRK (BCL-XL), MS1 (MCL-1), FS1 (BFL-1) | Functional assessment of anti-apoptotic dependence | Requires cell permeabilization; validate peptide specificity |
| BCL-2 Inhibitors | Venetoclax, Navitoclax, Obatoclax, S55746, APG-2575 | In vitro and in vivo apoptosis induction | Consider selectivity profiles; optimize dosing schedules |
| Cytochrome c Release Assays | Immunofluorescence, Western blot, flow cytometry | Measurement of MOMP | Combine with mitochondrial isolation for specificity |
| Apoptosis Detection Reagents | Annexin V, caspase substrates, TUNEL assay | Quantification of cell death | Use multiple methods for validation; distinguish early vs. late apoptosis |
| Mitochondrial Function Assays | TMRE/JC-1 (membrane potential), MitoTracker (mass) | Assessment of mitochondrial integrity | Correlate with cytochrome c release; control for metabolic status |
| Protein Interaction Tools | Co-immunoprecipitation, BIM SAHB, crosslinking | Study BCL-2 family protein complexes | Preserve weak/transient interactions; use appropriate controls |
Future Directions and Emerging Therapeutic Approaches
The field of BCL-2 targeting continues to evolve with several promising strategic developments:
- Proteolysis-Targeting Chimeras (PROTACs): These bifunctional molecules simultaneously bind to BCL-2 and E3 ubiquitin ligases, promoting targeted degradation of BCL-2 rather than mere inhibition [66]. This approach may provide more complete and durable suppression of BCL-2 function.
- Antibody-Drug Conjugates (ADCs): ADCs that deliver BH3-mimetic payloads specifically to tumor cells expressing surface markers could enhance therapeutic efficacy while minimizing on-target toxicities [66].
- Dynamic BH3 Profiling (DBP): This functional assay measures changes in apoptotic priming after ex vivo drug exposure, potentially predicting effective combination therapies for individual patients [63] [69].
- Solid tumor applications: While BCL-2 inhibitors have primarily demonstrated efficacy in hematologic malignancies, combination strategies with targeted agents, chemotherapy, and immunotherapy are being actively explored for solid tumors [67] [70]. Biomarker-driven patient selection will be critical for success in these contexts.
- BH3-mimetics beyond BCL-2: The development of specific and tolerable inhibitors for other anti-apoptotic proteins, particularly MCL-1 and BCL-XL, remains an active area of investigation to address the redundancy within the BCL-2 family [66].
The development of BCL-2 inhibitors represents a paradigm shift in cancer therapy, translating fundamental understanding of apoptotic regulation and cytochrome c release into clinically effective treatments. Venetoclax and other BH3-mimetics have demonstrated remarkable efficacy in hematologic malignancies by directly targeting the mitochondrial apoptotic machinery. However, resistance mechanisms and limited activity in solid tumors present ongoing challenges. Future progress will depend on rational combination strategies, novel therapeutic modalities such as PROTACs, and functional biomarkers like BH3-profiling to guide personalized treatment approaches. As research continues to unravel the complexities of BCL-2 family interactions and cytochrome c release regulation, the therapeutic targeting of apoptosis will undoubtedly remain a cornerstone of innovative cancer drug development.
Addressing Experimental Challenges and Interpretation in Cytochrome c Research
Accurately determining the subcellular localization of proteins and biomarkers is a cornerstone of molecular biology, yet it remains a significant technical challenge in the study of the intrinsic apoptotic pathway. The release of cytochrome c from the mitochondrial intermembrane space into the cytosol is a decisive event in apoptosis, serving as a key trigger for the assembly of the apoptosome and the subsequent activation of executioner caspases [20]. Research in this field fundamentally relies on correctly distinguishing between proteins that are genuinely localized within mitochondria, those that are cytosolic, and those that may form granular extramitochondrial structures. Misinterpretation here can lead to flawed conclusions regarding the mechanisms of mitochondrial outer membrane permeabilization (MOMP) and cytochrome c release [20].
The central problem is that commonly used techniques, particularly those based on fluorescence microscopy of GFP-tagged proteins, are prone to artifacts that can obscure the true localization of a protein of interest. When a protein is dual-localized—existing in both the cytosol and mitochondria—the abundant cytosolic signal can easily mask a weaker, but biologically critical, mitochondrial pool [71]. This whitepaper details the major pitfalls in differentiating these localization patterns and provides researchers with robust methodological frameworks to ensure data integrity in studies of cytochrome c release and the intrinsic pathway of apoptosis.
Key Pitfalls in Localization Studies
Several technical and biological factors can confound the accurate interpretation of subcellular localization data. The following table summarizes the primary pitfalls and their potential impacts on research outcomes.
Table 1: Major Pitfalls in Differentiating Protein Localization
| Pitfall Category | Specific Challenge | Consequence for Research |
|---|---|---|
| Signal Masking | Overwhelming cytosolic fluorescence from a dual-localized protein obscures a weaker mitochondrial signal [71]. | Failure to identify a relevant mitochondrial echoform, leading to an incomplete understanding of its role in cell death regulation. |
| Overexpression Artifacts | Non-physiological expression levels from strong promoters can force a protein into unnatural localizations or induce artificial aggregation [72]. | Misidentification of cytosolic aggregates as physiologically relevant granular structures or organelles. |
| Tag-Induced Disruption | Fluorescent protein tags (e.g., GFP) may sterically hinder mitochondrial targeting sequence (MTS) function or alter protein folding [72]. | A genuinely mitochondrial protein may be mislocalized to the cytosol, falsely implicating it in extramitochondrial processes. |
| Mitochondrial Stress | The process of protein mislocalization itself, or experimental conditions, can induce mitochondrial stress, potentially triggering the mitochondrial permeability transition pore (mPTP) [73] [74]. | Secondary effects of pore opening, such as swelling and outer membrane rupture, can be misinterpreted as the primary mechanism of cytochrome c release. |
Advanced Methodologies for Accurate Detection
To overcome the limitations of standard fluorescence microscopy, researchers have developed more sophisticated genetic and imaging tools.
The Bi-Genomic Mitochondrial-Split-GFP System
A groundbreaking approach to conclusively demonstrate mitochondrial import is the Bi-Genomic Mitochondrial-Split-GFP (BiG Mito-Split-GFP) system [71]. This technique elegantly bypasses the problem of cytosolic signal masking by confining GFP reconstitution strictly to the mitochondrial matrix.
- Core Principle: The system uses two fragments of the Split-GFP. The larger fragment, GFPβ1-10, is encoded by the mitochondrial genome and is therefore translated inside the mitochondrial matrix by mitochondrial ribosomes. The smaller fragment, GFPβ11, is fused to the nuclear-encoded protein of interest and is translated in the cytosol.
- Fluorescence Reconstitution: A functional, fluorescent GFP molecule can only self-assemble if the cytosically synthesized protein-of-interest-GFPβ11 fusion is successfully imported into the mitochondria, bringing its GFP fragment into contact with the matrix-localized GFPβ1-10 fragment [71].
- Key Advantage: Since the cytosolic GFPβ11 fragment alone cannot reconstitute fluorescence, any observed GFP signal is unequivocal evidence of mitochondrial import, even for proteins that are predominantly cytosolic [71].
Table 2: Experimental Protocol: Validating Mitochondrial Import with BiG Mito-Split-GFP
| Step | Procedure | Purpose | Key Controls |
|---|---|---|---|
| 1. Strain Engineering | Engineer a yeast or cell line to stably express the GFPβ1-10 fragment from the mitochondrial genome [71]. | Provides the mitochondrial base for the assay system. | Validate respiratory competence and normal expression of mitochondrial-encoded proteins. |
| 2. Plasmid Construction | Clone the gene for your protein of interest, fused to GFPβ11, into a nuclear expression vector. | Creates the test construct for mitochondrial import. | Include a known mitochondrial protein (e.g., Pam16) and a known cytosolic protein (e.g., Pgk1) as positive and negative controls, respectively [71]. |
| 3. Transformation & Expression | Introduce the plasmid into the engineered strain and induce expression. | Allows the protein-of-interest-GFPβ11 fusion to be synthesized in the cytosol and attempt mitochondrial import. | |
| 4. Imaging & Analysis | Visualize cells via fluorescence microscopy. | To detect successful GFP reconstitution, indicating mitochondrial localization. | Colocalize GFP signal with a mitotracker dye (e.g., MitoTracker Red CMXRos) to confirm mitochondrial pattern [71]. |
Validating Physiological Relevance in Localization
Advanced tools are only useful if the findings reflect biology, not artifact. The following workflow and protocols are critical for validation.
A workflow diagram for validating mitochondrial protein localization, outlining common pitfalls and the methodologies to address them.
- Avoiding Overexpression Artifacts: To ensure observed localizations are physiological, protein expression should be driven from its native promoter at the endogenous chromosomal locus, if possible. When using plasmids, titratable promoters are preferable to strong constitutive ones. As demonstrated in studies of aldehyde dehydrogenase (Ald4p), expressing a protein from its native genomic context prevents mislocalization and aggregation driven by non-physiological expression levels [72].
- Colocalization with Mitochondrial Markers: A fundamental step is to confirm that the fluorescence signal from a protein of interest overlaps with specific mitochondrial dyes (e.g., MitoTracker Red CMXRos) or markers of other organelles [71] [75]. This helps distinguish true mitochondrial localization from other granular structures in the cytoplasm.
- Functional Confirmation: Localization data should be corroborated with functional assays. For instance, if a protein is proposed to regulate the mPTP, its genetic ablation or pharmacological inhibition should alter the calcium retention capacity of mitochondria or the response to mPTP inducers like calcium overload or oxidative stress [73] [74].
The Scientist's Toolkit: Essential Research Reagents
Table 3: Key Reagents for Differentiating Protein Localization
| Reagent / Tool | Function / Property | Application in Localization Studies |
|---|---|---|
| BiG Mito-Split-GFP Strain [71] | Engineered yeast/cell line with mtDNA-encoded GFPβ1-10. | Gold-standard method for authenticating mitochondrial import of nuclear-encoded proteins, excluding cytosolic signal. |
| MitoTracker Dyes (e.g., CMXRos) [71] [75] | Cell-permeant fluorescent dyes that accumulate in active mitochondria. | Standard for visualizing the entire mitochondrial network and confirming colocalization of a protein of interest. |
| Triphenylphosphonium (TPP) Appendage [75] | A lipophilic cation that drives accumulation in the mitochondrial matrix due to the membrane potential. | Used to deliberately target small molecules (e.g., photoCORMs) and probes to mitochondria for localized delivery or release. |
| Cyclosporin A (CsA) [73] [74] [76] | Potent inhibitor of cyclophilin D (CypD), a key regulator of the mPTP. | Used to probe the role of the mPTP in a cellular phenomenon; inhibition of an effect by CsA suggests mPTP involvement. |
| PhotoCORMs [75] | Metal-free, light-triggered CO-releasing molecules that can be tracked via fluorescence and targeted to mitochondria. | Enable controlled, localized release of a bioactive gas (CO) to study its specific effects on mitochondrial function. |
| Endogenous Tagging Kits | CRISPR/Cas9-based tools for C- or N-terminal tagging of genes at their native chromosomal locus. | Prevents mislocalization artifacts caused by protein overexpression from plasmid-based systems. |
Connecting Detection to Cytochrome c Release Mechanisms
The accurate determination of localization is not merely a technical exercise; it is directly relevant to elucidating the mechanisms of cytochrome c release. Two primary models exist, and mislocalization artifacts can blur the distinction between them.
The mPTP-mediated pathway involves a sustained opening of the permeability transition pore in the inner membrane, leading to mitochondrial swelling, rupture of the outer membrane, and consequent release of cytochrome c [73] [76]. This process is regulated by cyclophilin D and can be inhibited by cyclosporin A. The MOMP-mediated pathway, central to the intrinsic apoptotic pathway, is controlled by the Bcl-2 protein family. Pro-apoptotic effectors like Bax and Bak oligomerize to form pores in the mitochondrial outer membrane, leading to cytochrome c release without inner membrane permeabilization [20].
Pitfalls in detection can confuse these pathways. For example, if a protein implicated in mPTP regulation (e.g., a component of the F-ATP synthase [74] [77]) is artificially mislocalized to the cytosol due to an overexpression artifact or a disruptive tag, it could indirectly cause mitochondrial dysfunction and cytochrome c release. A researcher might then erroneously conclude that the protein directly participates in MOMP, when its actual role is within the mPTP machinery. Therefore, rigorous localization controls are essential for correctly assigning a protein's function to a specific cytochrome c release pathway.
In the high-stakes research of apoptosis and cytochrome c release, the line between a major discovery and a misleading artifact can be defined by the rigor of subcellular localization studies. The pitfalls of signal masking, overexpression, and tag-induced disruptions are significant, but not insurmountable. By adopting advanced genetic tools like the BiG Mito-Split-GFP system, employing endogenous expression strategies, and functionally validating findings within the established frameworks of mPTP and MOMP, researchers can ensure their conclusions are built on a solid experimental foundation. Mastering these techniques is paramount for accurately mapping the complex regulatory networks that govern cell death and for developing effective therapeutic strategies.
Abstract Within the intrinsic apoptotic pathway, the release of cytochrome c from mitochondria serves as a decisive commitment to cell death. This event is governed by the BCL-2 protein family, where the pro-apoptotic effectors BAX and BAK are essential for mitochondrial outer membrane permeabilization (MOMP). While often described as functionally redundant, emerging evidence reveals critical nuances in their regulation and function across different cell types. This whitepaper synthesizes current research to navigate the complex interplay between BAX, BAK, and the BH3-only proteins that regulate them. We delve into the competing molecular models of activation, highlight cell-type-specific exceptions to redundancy—such as the neuronal-specific isoform N-Bak—and provide a detailed toolkit of experimental methodologies for probing these relationships. The insights herein are critical for researchers and drug development professionals aiming to target the apoptotic machinery in diseases like cancer and neurodegeneration.
The intrinsic apoptotic pathway is activated by cellular stressors such as DNA damage, oxidative stress, and oncogene activation. A pivotal event in this pathway is the release of cytochrome c from the mitochondrial intermembrane space into the cytosol. Once released, cytochrome c binds to APAF-1, triggering the formation of the apoptosome and the subsequent activation of caspase-9, which initiates a cascade of executioner caspases that dismantle the cell [22].
The gateway for cytochrome c release is MOMP, a process exclusively controlled by the BCL-2 family of proteins [78]. This family is divided into three functional subgroups:
- Anti-apoptotic proteins (e.g., BCL-2, BCL-xL, MCL-1): They preserve mitochondrial integrity by binding and neutralizing pro-apoptotic members [79].
- Pro-apoptotic effector proteins (BAX and BAK): These are the direct mediators of MOMP. In healthy cells, BAX is largely cytosolic, while BAK is integrated into the mitochondrial outer membrane. Upon activation, both proteins undergo a conformational change, oligomerize, and form pores that permit cytochrome c release [79].
- BH3-only proteins (e.g., BIM, BID, PUMA, NOXA, BAD): These are sentinels for cellular stress. They initiate apoptosis by either inhibiting the anti-apoptotic proteins or directly activating BAX and BAK [80].
The functional redundancy between BAX and BAK is a well-established phenomenon in non-neuronal cells; the deletion of both genes is required to robustly block apoptosis, whereas single deletions often have minimal effect [78] [79]. However, this redundancy is not absolute, and its breakdown in specific contexts, such as neurons, reveals a more complex regulatory landscape.
Molecular Mechanisms of BAX/BAK Activation and Functional Redundancy
The precise mechanism by which BH3-only proteins activate BAX and BAK has been the subject of intense research and debate, culminating in several models.
- The Direct Activation Model: This model posits that a subset of "activator" BH3-only proteins (e.g., BID, BIM, PUMA) directly bind to and induce conformational changes in BAX/BAK, leading to their oligomerization. The remaining "sensitizer" BH3-only proteins (e.g., BAD, NOXA) promote apoptosis by binding to and neutralizing anti-apoptotic proteins, thereby freeing the activators to engage BAX/BAK [78] [81].
- The Indirect Activation (Displacement) Model: This model suggests that anti-apoptotic proteins constitutively bind and restrain BAX and BAK. BH3-only proteins function primarily to displace these interactions by binding to the anti-apoptotic proteins, thereby indirectly unleashing BAX and BAK [82] [80].
- The Permissive/Membrane-Mediated Model: Recent studies, particularly in cells lacking all BH3-only proteins, have provided evidence for a unified model. This model proposes that the primary role of all BH3-only proteins is to neutralize specific anti-apoptotic guards (notably BCL-xL and MCL-1). Once these guards are suppressed, BAX and BAK can undergo spontaneous, membrane-mediated activation without the need for direct interaction with an activator BH3-only protein [83] [84].
The following diagram illustrates the core relationships and regulatory logic between these protein groups, leading to MOMP.
Diagram 1: Regulatory network of BCL-2 family proteins controlling MOMP. Solid lines represent the primary inhibitory and activation relationships supported by multiple models. The dashed line indicates the direct activation pathway, which is a subject of ongoing debate.
The following table summarizes key quantitative findings from studies that have shaped our understanding of BH3-only protein interactions and their functional outcomes.
Table 1: Summary of Key Experimental Findings on BH3-only Protein Function
| Experimental System | Key Finding | Quantitative/Functional Outcome | Interpretation |
|---|---|---|---|
| Bid Chimeras [81] | Comparison of engineered Bid-BH3 chimeras vs. BH3 peptides in MOMP assays. | Chimeras were ~1000-fold more potent than BH3 peptides at permeabilizing mitochondria. | Full-length protein context and membrane targeting are critical for robust activator function. |
| OctaKO Cells [83] | Apoptosis induction in cells lacking all eight pro-apoptotic BH3-only proteins. | BAD (a "sensitizer") killed cells lacking MCL-1 with kinetics similar to BID/BIM. | Neutralization of anti-apoptotic proteins (BCL-xL/MCL-1) is sufficient for BAX/BAK activation, challenging the necessity of "direct activators". |
| Hepatocyte Apoptosis Models [84] | Sequential disruption of BH3-only genes in mouse livers deficient in BCL-xL/MCL-1. | No single or triple BH3-only KO (Bid/Bim/Puma) completely abolished apoptosis. | BH3-only proteins function in a collaborative and redundant manner to activate BAX/BAK in vivo. |
Cell-Type-Specific Exceptions to Redundancy
The general principle of BAX/BAK redundancy shows critical exceptions that underscore the adaptability of the apoptotic machinery to specific cellular contexts.
Neuronal Cells: The Case of N-Bak In postnatal neurons, the paradigm of BAX/BAK redundancy breaks down. The deletion of Bax alone is sufficient to confer significant protection against apoptotic insults, whereas Bak deletion has little effect [85]. This specificity is explained by the finding that neurons exclusively express an alternatively spliced isoform of Bak, called N-Bak. N-Bak is a BH3-domain-only isoform that lacks the multidomain structure of full-length BAK. It promotes neuronal apoptosis in a Bax-dependent manner by interacting with Bcl-xL, but not Bax, thereby indirectly facilitating Bax translocation to the mitochondria [85]. This illustrates how cell-type-specific isoform expression can refine the core apoptotic machinery.
Hepatocytes: Collaborative Redundancy Studies in hepatocyte-specific knockout mice demonstrate that while BAX and BAK are functionally redundant for initiating apoptosis, the BH3-only proteins that activate them operate in a highly collaborative network. Research shows that even the simultaneous disruption of three key activator BH3-only proteins—Bid, Bim, and Puma—fails to fully suppress hepatocyte apoptosis upon loss of Bcl-xL and Mcl-1. Further investigation revealed that Noxa also contributes significantly, and apoptosis was only fully suppressed by the combined loss of Bak and Bax [84]. This highlights that in some cell types, a broad network of BH3-only proteins ensures robust death signaling.
Experimental Approaches for Dissecting Redundancy
To navigate the complexities of BAX/BAK redundancy, researchers employ a suite of sophisticated experimental protocols.
4.1. Genetic Knockout Models The use of single and double knockout cells (e.g., Bax-/-, Bak-/-, Bax-/-Bak-/-) is foundational for establishing functional redundancy. The observation that Bax-/-Bak-/- DKO cells are highly resistant to intrinsic apoptotic signals, while single knockouts are not, provides the clearest evidence [78] [82]. More recently, the generation of OctaKO cells, which lack all eight pro-apoptotic BH3-only proteins, has allowed for the precise dissection of individual BH3-only protein function without confounding redundancy [83].
Table 2: Key Research Reagent Solutions for Apoptosis Research
Reagent / Tool Function / Application Key Insight from Search Results Bax-/-Bak-/- DKO Cells Validates the absolute requirement for BAX/BAK in intrinsic apoptosis. Cells are completely protected from nitric oxide-induced cell death, unlike wild-type cells [82]. OctaKO Cells Enables study of individual BH3-only proteins without interference from other family members. Revealed that BAD can induce apoptosis as effectively as BID/BIM when specific anti-apoptotic guards are absent [83]. Bid BH3 Chimeras Stable recombinant proteins to study the potency of different BH3 domains in a membrane-targeted context. Were ~1000-fold more effective than synthetic BH3 peptides in activating BAX/BAK, underscoring the importance of the protein backbone and membrane localization [81]. Conformation-Specific Antibodies (e.g., Bax 6A7) Detects the active, oligomerization-competent form of BAX in cells and tissues. Used in immunoprecipitation to show reduced Bax activation in Puma-/- livers, linking a BH3-only protein to effector activation in vivo [84]. BH3 Mimetics (e.g., Venetoclax) Small molecule inhibitors that bind to and block specific anti-apoptotic proteins. Therapeutically target the interaction between anti-apoptotic proteins and BH3-only proteins/effectors to induce apoptosis in cancer cells [22]. 4.2. Mitochondrial Permeabilization Assays Isolated mitochondria are used to study the direct effects of proteins and peptides on MOMP. The standard protocol is as follows:
- Mitochondria Isolation: Mitochondria are isolated from mouse liver or cultured cells via differential centrifugation.
- Treatment: The mitochondrial pellet is treated with recombinant BH3-only proteins (e.g., Bid chimeras [81]), synthetic BH3 peptides, or other apoptotic stimuli.
- Output Measurement: Cytochrome c release into the supernatant is measured by Western blotting. Alternatively, the loss of mitochondrial membrane potential (ΔΨm) can be quantified using dyes like TMRE [22].
4.3. Detecting BAX/BAK Activation and Oligomerization The activation of BAX and BAK is marked by conformational changes and oligomerization. Key methodologies include:
- Immunoprecipitation with Conformation-Specific Antibodies: Antibodies like the Bax 6A7 antibody specifically recognize the active conformation of BAX. This allows for the immunoprecipitation and quantification of active BAX from cell or tissue lysates, as demonstrated in studies of hepatocyte apoptosis [84].
- Cross-linking and Oligomer Analysis: Chemical cross-linkers like BMH or DSS can be applied to mitochondrial fractions to stabilize BAX/BAK oligomers, which can then be visualized as higher molecular weight complexes on non-reducing SDS-PAGE gels [78].
The following diagram integrates these key methodologies into a cohesive experimental workflow.
Diagram 2: A generalized workflow for experimentally dissecting BAX/BAK activation and redundancy, incorporating key methodologies from genetic models to biochemical and cellular readouts.
The functional redundancy between BAX and BAK is a robust, yet nuanced, feature of the intrinsic apoptotic pathway. In most somatic cells, they act as interchangeable gatekeepers for cytochrome c release. However, this redundancy is governed by a complex regulatory network of BH3-only proteins, which can function collaboratively and, in some cellular contexts like neurons, be overridden by cell-type-specific mechanisms. The ongoing debate between direct and indirect activation models is being resolved by evidence showing that the mitochondrial membrane itself plays a permissive role, with BH3-only proteins primarily functioning to disarm the anti-apoptotic proteins BCL-xL and MCL-1.
For researchers and drug developers, these insights are paramount. The effectiveness of BH3 mimetic drugs, such as Venetoclax, hinges on the specific anti-apoptotic dependencies of a given cancer cell. Understanding the redundant and unique roles of BAX and BAK, as well as the collaborative nature of the BH3-only proteins that regulate them, will enable more predictive biomarkers and rational combination therapies to overcome treatment resistance. Future research should continue to elucidate these interactions in specific disease-relevant cell types to fully harness the power of the apoptotic pathway for therapeutic benefit.
In the investigation of the mitochondrial intrinsic apoptosis pathway, the precise quantification of cytochrome c release is a cornerstone for validating experimental findings and screening potential therapeutic compounds. This process, however, is fraught with technical challenges that can compromise data integrity. The release of cytochrome c from the mitochondrial intermembrane space into the cytosol is a pivotal event controlled by Bcl-2 family proteins and signifies a cell's commitment to apoptosis [27] [86]. Accurately distinguishing this specific event from background signals, non-specific protein release, and other cellular phenomena is paramount. False positives can lead to erroneous conclusions about a cell's apoptotic status or the efficacy of a drug candidate, potentially derailing research and development efforts. This guide details the primary sources of false positives in cytochrome c research and provides validated methodologies to enhance quantification specificity for research scientists and drug development professionals.
The Critical Role of Cytochrome c Release in Apoptosis
In healthy cells, cytochrome c is confined to the mitochondrial intermembrane and intercristae spaces, where it serves as an essential electron shuttle in the respiratory chain [27]. Upon integration of apoptotic stimuli—such as DNA damage or growth factor deprivation—the mitochondrial outer membrane becomes permeabilized (MOMP), facilitating the mobilization and release of cytochrome c [27] [86]. Once in the cytosol, cytochrome c binds to Apaf-1 and ATP, forming the apoptosome complex. This complex activates the initiator caspase, caspase-9, which in turn cleaves and activates effector caspases like caspase-3, leading to the irreversible dismantling of the cell [86] [87]. It is crucial to note that cytosolic cytochrome c has also been associated with non-lethal cellular functions, suggesting its release may not always occur in an all-or-nothing fashion and may not invariably lead to cell death [27]. This nuance further complicates quantification and interpretation.
The Intrinsic Apoptosis Pathway
The following diagram illustrates the key stages of the intrinsic apoptosis pathway, from the initial stress signal to the final execution phase, highlighting the central role of cytochrome c release.
A false positive in this context is the incorrect classification of a cell or sample as undergoing cytochrome c-mediated apoptosis. The table below summarizes the primary sources of these errors and strategies to address them.
Table 1: Common Sources of False Positives and Mitigation Strategies
| Source of Error | Underlying Cause | Consequence | Mitigation Strategy |
|---|---|---|---|
| Non-Specific Antibody Binding | Antibody cross-reactivity with non-target proteins or non-specific ionic interactions. | High background signal; false detection of cytochrome c in non-apoptotic cells. | Use validated, high-affinity primary antibodies; include isotype controls; optimize blocking and antibody dilution. |
| Cellular Autofluorescence | Natural fluorescence of molecules like NAD(P)H, flavins, and lipofuscin. | Elevated background in fluorescence assays, masking specific signal. | Use spectrally well-separated fluorophores; perform control wells without primary antibody; utilize spectral unmixing. |
| Non-Apoptotic Cytochrome c Release | Minor, transient release potentially linked to vital functions; mitochondrial membrane instability during necrosis/oncosis. | Detection of cytosolic cytochrome c in cells not committed to apoptosis. | Correlate with other apoptotic markers (caspase activation, PS externalization); assess cell viability and membrane integrity. |
| Experimental Artifact | Mechanical shearing of mitochondria during cell fractionation or lysis. | Artificial release of cytochrome c, suggesting apoptosis where none exists. | Use gentle lysis protocols; validate fractionation purity with mitochondrial markers (e.g., COX IV). |
Quantitative Frameworks: Defining Specificity and False Positive Rate
To objectively assess the performance of a quantification assay, it is essential to understand the statistical measures of specificity and the false positive rate.
Specificity: Also known as the true negative rate, specificity is the probability that a test correctly identifies a healthy condition [88]. In the context of cytochrome c release assays, it is the ability of the assay to correctly classify a non-apoptotic cell as negative for cytochrome c release. Mathematically, it is defined as: Specificity = True Negatives / (True Negatives + False Positives) [88].
False Positive Rate (FPR): This is the proportion of all truly negative samples that are incorrectly classified as positive [89]. It is the mathematical complement to specificity: FPR = 100% - Specificity [89]. A test with 96% specificity, for example, has a 4% false positive rate.
Table 2: Outcome Matrix for a Cytochrome c Release Assay
| Actual Apoptosis (Cyto c Released) | Actual No Apoptosis (Cyto c Not Released) | |
|---|---|---|
| Test Positive | True Positive (TP) | False Positive (FP) |
| Test Negative | False Negative (FN) | True Negative (TN) |
| Total | Total Actually Positive | Total Actually Negative |
Validated Experimental Protocols for Specific Detection
Employing a multi-faceted experimental approach is the most robust method for ensuring specificity and minimizing false positives.
Immunofluorescence and High-Content Microscopy
This protocol allows for single-cell analysis and subcellular localization of cytochrome c.
Workflow Diagram:
Detailed Protocol:
- Cell Preparation: Seed cells onto sterile, glass-bottom chamber slides. Apply apoptotic inducer (e.g., staurosporine, UV irradiation) and appropriate negative control (vehicle).
- Fixation and Permeabilization: Fix cells with 4% paraformaldehyde for 15 minutes at room temperature. Permeabilize with 0.1% Triton X-100 in PBS for 10 minutes.
- Immunostaining: Block with 5% BSA in PBS for 1 hour. Incubate with a validated mouse anti-cytochrome c primary antibody (e.g., clone 6H2.B4) and a rabbit antibody against a mitochondrial matrix protein (e.g., COX IV/MTCO1) overnight at 4°C. Include a no-primary-antibody control to assess background.
- Detection: After washing, incubate with highly cross-adsorbed secondary antibodies conjugated to fluorophores such as Alexa Fluor 488 (anti-mouse) and Alexa Fluor 568 (anti-rabbit) for 1 hour at room temperature, protected from light.
- Image Acquisition and Analysis: Acquire z-stack images using a confocal microscope with consistent settings across all samples. Specificity is confirmed by a punctate, mitochondrial pattern (cytochrome c co-localized with COX IV) in healthy cells and a diffuse, cytosolic pattern (loss of co-localization) in apoptotic cells. Quantification of hundreds of cells is necessary for statistical power.
Cellular Fractionation with Western Blotting
This biochemical method separates cellular compartments to confirm the subcellular location of cytochrome c.
Detailed Protocol:
- Harvesting and Fractionation: Harvest cells by gentle scraping. Use a dedicated mitochondrial isolation kit (e.g., from Thermo Fisher Scientific or Abcam) to separate cytosolic and heavy membrane (mitochondrial) fractions via differential centrifugation. Critical Step: Perform all steps at 4°C and use protease inhibitors to prevent degradation.
- Purity Validation: Assess the purity of fractions by Western blotting. The cytosolic fraction should be positive for markers like α-tubulin or LDH and negative for the mitochondrial marker COX IV. The heavy membrane fraction should show the inverse.
- Western Blotting: Load equal protein amounts from cytosolic and mitochondrial fractions onto SDS-PAGE gels. Transfer to PVDF membrane and probe for cytochrome c. A positive control (e.g., cells treated with a known BH3 mimetic) is essential.
- Data Interpretation: Specific cytochrome c release is indicated by a strong signal in the cytosolic fraction of apoptotic cells, coupled with a corresponding decrease in the mitochondrial fraction, with pure fractions confirmed by control blots.
FRET-Based Biosensor Assay
Fluorescence Resonance Energy Transfer (FRET) offers a highly sensitive, real-time method for quantifying protein-protein interactions in live cells [90].
Detailed Protocol:
- Biosensor Design: Fuse cytochrome c to a donor fluorophore (e.g., ECFP) and a mitochondrial immobilization domain (e.g., from ActA) to an acceptor fluorophore (e.g., Venus-YFP) [90].
- Live-Cell Imaging: Transfect cells with the biosensor construct. In healthy cells, cytochrome c is held close to the inner membrane, yielding a high FRET signal. Upon release, the distance between donor and acceptor increases, causing a decrease in FRET efficiency that can be quantified ratiometrically.
- Advantages and Controls: This method is highly sensitive and compatible with multi-well plate formats for screening [90]. Crucially, it measures a specific molecular event (proximity change) in live cells, reducing artifacts from fixation or fractionation. Include controls with donor-only and acceptor-only constructs to correct for spectral bleed-through.
The Scientist's Toolkit: Essential Reagents and Controls
The following table lists key reagents and controls required to implement the described protocols effectively.
Table 3: Essential Research Reagents and Controls for Cytochrome c Release Studies
| Reagent / Control | Function / Purpose | Example & Notes |
|---|---|---|
| Anti-Cytochrome c Antibody | Specific detection of cytochrome c for IF and WB. | Clone 6H2.B4 (BD Biosciences); validate for specific application (IF, WB). |
| Mitochondrial Marker Antibody | Labeling mitochondria for co-localization and fraction purity. | Anti-COX IV (e.g., Abcam ab16056); Anti-TOM20. |
| Cytosolic Marker Antibody | Confirming purity of cytosolic fraction in biochemical assays. | Anti-α-Tubulin; Anti-LDH. |
| Fluorophore-Conjugated Secondaries | Detecting primary antibodies in fluorescence-based assays. | Alexa Fluor 488, 568, or 647; use highly cross-adsorbed antibodies. |
| Apoptotic Inducer (Positive Control) | To induce MOMP and validate the assay system. | Staurosporine (1 µM, 2-6 hr); ABT-263 (Navitoclax). |
| Isotype Control | Distinguishing specific from non-specific antibody binding. | Mouse IgG1 (κ) isotype control used at same concentration as primary. |
| Viability / Caspase Assay | Correlative measure to confirm apoptosis. Propidium Iodide (viability), Caspase-Glo 3/7 assay (activity). | Use in parallel with cytochrome c detection. |
| Mitochondrial Isolation Kit | For clean separation of cytosolic and mitochondrial fractions. | Kits from Thermo Fisher Scientific, Abcam, or Millipore Sigma. |
The accurate quantification of cytochrome c release is a technically demanding but essential endeavor in cell death research. False positives, stemming from antibody non-specificity, cellular autofluorescence, and experimental artifacts, pose a significant risk to data integrity. By understanding the statistical principles of specificity and the false positive rate, and by implementing a rigorous, multi-methodological approach that includes carefully controlled immunofluorescence, validated cellular fractionation, and sensitive FRET-based biosensors, researchers can achieve the high level of specificity required. Correlating cytochrome c release with other hallmarks of apoptosis remains the gold standard for confirming a cell's commitment to the intrinsic pathway, thereby ensuring the reliability of research findings and the success of downstream drug development efforts.
The release of cytochrome c from mitochondria is a pivotal event in the intrinsic apoptotic pathway, long considered a point of no return for cell death. However, emerging evidence reveals that this process exhibits significant cell-type-specific variations in its regulation, execution, and functional consequences. This technical review synthesizes current understanding of the mechanisms underlying these variations, examining how differential expression of BCL-2 family proteins, mitochondrial ultrastructure, and metabolic characteristics contribute to cell-type-specific release patterns. We present comprehensive quantitative data, detailed experimental methodologies, and visual schematics to guide researchers in investigating these variations. Understanding these differences has profound implications for targeted therapeutic development, particularly in cancer and degenerative diseases where apoptotic pathways are dysregulated.
Cytochrome c is a multifunctional hemeprotein primarily known for its essential role in mitochondrial respiration, where it shuttles electrons between Complex III and Complex IV of the electron transport chain [91] [14]. This 13-15 kDa protein, encoded by a nuclear gene and localized to the mitochondrial intermembrane space, undergoes a critical translocation during apoptotic signaling that fundamentally alters its function [91]. Upon receiving apoptotic stimuli such as DNA damage, metabolic stress, or unfolded proteins, cytochrome c is released from mitochondria into the cytosol, where it initiates caspase activation through apoptosome formation [14] [87].
The canonical pathway of cytochrome c-mediated apoptosis begins with mitochondrial outer membrane permeabilization (MOMP), which allows cytochrome c to escape into the cytosol [14]. Once in the cytosol, cytochrome c binds to apoptotic protease activating factor-1 (Apaf-1) in a dATP/ATP-dependent manner, triggering Apaf-1 oligomerization into a heptameric complex known as the apoptosome [91] [87]. This complex then recruits and activates procaspase-9, which subsequently proteolytically processes and activates effector caspases-3, -6, and -7, ultimately executing programmed cell death [92] [87].
While this pathway represents the standard mechanism, growing evidence indicates that cytochrome c release exhibits significant variations across different cell types, influenced by factors including BCL-2 family protein expression profiles, mitochondrial membrane composition, cristae structure, and metabolic characteristics [14] [92]. This review systematically examines the mechanisms underlying these cell-type-specific variations and their implications for both basic research and therapeutic development.
Molecular Mechanisms of Cytochrome c Release
Key Regulatory Proteins and Processes
The release of cytochrome c from mitochondria is governed by a complex interplay of regulatory proteins and membrane remodeling events:
BCL-2 Family Regulation: Pro-apoptotic proteins Bax and Bak oligomerize to form pores in the mitochondrial outer membrane, while anti-apoptotic proteins (Bcl-2, Bcl-XL, Mcl-1) inhibit this process. BH3-only proteins sense cellular damage and tip the balance toward permeabilization [91] [14].
Cardiolipin Interaction: A significant portion of cytochrome c is electrostatically bound to cardiolipin, an anionic phospholipid in the inner mitochondrial membrane. Detachment through cardiolipin oxidation or calcium-mediated weakening of electrostatic interactions constitutes a critical mobilization step [27] [14].
Cristae Remodeling: Cytochrome c must exit narrow cristae junctions before translocation through the outer membrane. Some evidence suggests cristae remodeling facilitates this redistribution, though its necessity is debated [14].
The following diagram illustrates the core pathway and major regulatory mechanisms of cytochrome c release:
Figure 1: Core pathway of cytochrome c release and apoptosis activation. The process involves multiple regulatory steps that exhibit cell-type-specific variations.
Controversies in Release Mechanisms
The precise mechanisms governing cytochrome c release remain actively debated, with several unresolved controversies:
Inner vs. Outer Membrane Events: While most evidence supports MOMP as the decisive event, some studies suggest inner membrane permeabilization through mitochondrial permeability transition (MPT) may contribute under certain conditions [14]. The MPT pore, composed of VDAC, ANT, and cyclophilin D, can trigger swelling and outer membrane rupture, though genetic studies show VDAC and ANT are dispensable for apoptosis [91].
Timing and Coordination: Live-cell imaging reveals simultaneous release of cytochrome c with other intermembrane space proteins, suggesting simple diffusion through large outer membrane openings rather than selective transport [14]. However, the mobilization from inner membrane binding sites may still represent a rate-limiting step.
Complete vs. Partial Release: Emerging evidence suggests cytochrome c release may not always occur in an all-or-nothing fashion, with sublethal quantities potentially contributing to non-apoptotic functions including differentiation [27].
Quantitative Evidence for Cell-Type-Specific Variations
Cytochrome c as a Clinical Marker Across Tissues
Measurement of circulating cytochrome c has emerged as a clinically useful marker of cellular damage, with significant variations observed across different pathological conditions and tissue types. The table below summarizes key findings from clinical studies:
Table 1: Cytochrome c levels in various human pathologies demonstrating cell-type-specific release patterns
| Condition | Cell Type/Tissue Affected | Cytochrome c Level | Control Level | Functional Correlation |
|---|---|---|---|---|
| Acute Liver Failure [92] | Hepatocytes | 10,686 pg/mL | 112 pg/mL | Correlated with hepatic coma severity |
| Chronic Liver Diseases [92] | Hepatocytes | 187.1 ng/mL | 39.8 ng/mL | Associated with necroinflammatory score |
| Systemic Inflammatory Response [92] | Multiple | 12.09-39.1 ng/mL | <0.1 ng/mL | Correlated with APACHE II and MOF scores |
| Operable Malignant Tumors [92] | Tumor-specific | 20.6 ng/mL | 13.6 ng/mL | >40 ng/mL predicted poorer survival |
| Myocardial Infarction [92] | Cardiomyocytes | Significantly elevated | Normal | Marker of cardiac cell death |
| Chemotherapy Response [92] | Cancer cells | >13-fold increase post-treatment | Baseline | Indicator of treatment efficacy |
Single-Cell Transcriptomic Evidence
Advanced single-cell RNA sequencing technologies have revealed profound differences in transcriptional programs across cell types that influence apoptotic regulation:
Neuronal Complexity: Pyramidal neurons express approximately 14,964 genes on average, significantly more than the 7,939 genes expressed in brown adipocytes, cardiomyocytes, and serotonergic neurons [93]. This expanded transcriptional repertoire includes numerous apoptosis-regulating genes.
Cell-Type-Specific Variability Patterns: Genes demonstrating high cell-to-cell expression variability show distinct patterns across cell types, suggesting specialized regulatory mechanisms [94] [93]. For example, hematopoietic stem cells and B lymphoid lineages show unique variability signatures during aging.
Platform Considerations: Measurements of gene expression variability are influenced by sequencing methods, with full-length FACS-sorted Smartseq2 and 3'-end 10X Genomics Droplet-based methods showing platform-specific effects that must be considered in cross-cell-type comparisons [94].
Experimental Approaches for Studying Release Variations
Methodologies for Monitoring Cytochrome c Release
Several well-established experimental approaches enable investigators to monitor cytochrome c release with cell-type resolution:
Single-Cell RNA Sequencing Analysis [94] [93]
- Purpose: Identify cell-type-specific expression patterns of apoptotic regulators
- Workflow: Cell isolation → cDNA library preparation → linear amplification (aRNA method) → Illumina sequencing → quality control (minimum 5 million uniquely mapped exonic reads) → normalization → variability analysis
- Key Metrics: scran variability analysis, differentially variable genes, cell-type-specific signatures
- Considerations: Platform-specific effects (Smartseq2 vs. 10X Genomics), sample size impacts, sparsity challenges
Cytochrome c Release Assays [91] [14] [92]
- Purpose: Quantify cytochrome c translocation in response to apoptotic stimuli
- Workflow: Cell treatment with apoptotic stimuli → subcellular fractionation → Western blotting with cytochrome c antibodies → quantification OR live-cell imaging with GFP-tagged cytochrome c → kinetic analysis
- Key Metrics: Release kinetics, subcellular distribution, threshold requirements for caspase activation
- Considerations: Cell-type-specific buffer conditions (ionic strength affects cytochrome c binding), simultaneous monitoring of other intermembrane space proteins
Genetic Manipulation Studies [14] [87]
- Purpose: Establish causal relationships in cytochrome c regulation
- Workflow: Generation of knock-in mice with cytochrome c mutations (e.g., K72A) → primary cell isolation → apoptotic challenge → assessment of resistance
- Key Metrics: Embryonic lethality, tissue-specific developmental defects, caspase activation thresholds
- Considerations: Mutation effects on respiratory function versus apoptotic function, compensatory mechanisms
The following diagram illustrates a comprehensive experimental workflow for studying cell-type-specific cytochrome c release:
Figure 2: Experimental workflow for investigating cell-type-specific variations in cytochrome c release. Researchers can select from multiple methodological approaches depending on their specific research questions.
The Scientist's Toolkit: Essential Research Reagents
Table 2: Key research reagents for studying cytochrome c release mechanisms
| Reagent/Category | Specific Examples | Function/Application | Technical Considerations |
|---|---|---|---|
| Apoptotic Inducers [91] [14] | Staurosporine, UV radiation, DNA-damaging agents | Trigger intrinsic apoptotic pathway | Cell-type-specific sensitivity variations |
| BCL-2 Family Modulators [91] [14] | ABT-199 (Venetoclax), ABT-263 (Navitoclax) | Inhibit anti-apoptotic BCL-2 proteins | Differential efficacy across cell types based on BCL-2 family expression |
| Cytochrome c Antibodies [92] | Commercial monoclonal antibodies | Detect subcellular localization (IHC, Western blot) | Confirm specificity for somatic vs. testicular isoform |
| Caspase Activity Assays [91] [87] Fluorogenic substrates (DEVD-AFC, LEHD-AFC) | Quantify downstream apoptotic activation | Distinguish initiator vs. effector caspase activity | |
| Genetic Models [14] [87] | Cytochrome c K72A knock-in mice, Apaf-1 deficient mice | Dissect functional domains and pathway requirements | Embryonic lethality with complete knockout requires conditional models |
| Single-Cell Platforms [94] [93] | 10X Genomics, Smartseq2 | Profile transcriptional heterogeneity | Platform-specific technical variability patterns |
Implications for Drug Development and Therapeutic Strategies
The cell-type-specific variations in cytochrome c release have profound implications for pharmaceutical development, particularly in oncology and degenerative diseases:
Therapeutic Resistance Mechanisms: Tumor cells often exploit variations in cytochrome c release mechanisms to resist chemotherapy. For example, overexpression of anti-apoptotic BCL-2 family members or alterations in cardiolipin composition can raise the threshold for cytochrome c release [91] [92].
BH3 Mimetics Development: Drugs like Venetoclax that specifically target BCL-2 show differential efficacy across cancer types based on the specific anti-apoptotic proteins expressed in different cell lineages [91].
Biomarker Applications: Serum cytochrome c levels may serve as a useful clinical marker for treatment response assessment, with post-chemotherapy increases indicating successful induction of tumor cell apoptosis [92].
Tissue-Specific Toxicities: Understanding cell-type-specific apoptotic regulation helps predict and manage adverse drug effects, particularly in tissues with high apoptotic sensitivity like the liver [92].
The release of cytochrome c from mitochondria, while a core component of the conserved intrinsic apoptotic pathway, exhibits significant cell-type-specific variations that influence both physiological cell death and pathological processes. These variations arise from differences in BCL-2 family expression profiles, mitochondrial ultrastructure, metabolic characteristics, and transcriptional programs. Understanding these differences requires sophisticated experimental approaches including single-cell transcriptomics, precise release assays, and genetically engineered models.
Future research directions should include comprehensive mapping of cytochrome c release thresholds across diverse cell types, investigation of non-apoptotic functions of sublethal cytochrome c release, and development of computational models predicting cell-type-specific apoptotic responses. Such advances will enhance both our fundamental understanding of cell death regulation and our ability to target apoptotic pathways for therapeutic benefit in a cell-type-specific manner.
Optimizing Conditions for Studying Phosphorylation and Post-Translational Regulation
The study of post-translational modifications (PTMs) represents a critical frontier in molecular biology, offering insights into the sophisticated regulatory networks that govern cellular processes. Among PTMs, phosphorylation stands as the most prevalent and functionally versatile modification, reversibly controlling protein activity, localization, stability, and interactions [95] [96]. Within the context of apoptotic signaling, phosphorylation events intricately regulate the intrinsic pathway, culminating in the decisive event of cytochrome c release from mitochondria. This technical guide examines the optimized conditions for investigating phosphorylation and other PTMs, with specific emphasis on their role in modulating cytochrome c release mechanisms. The precision offered by contemporary phosphoproteomic approaches enables researchers to decode the complex signaling networks that determine cellular fate, providing unprecedented opportunities for therapeutic intervention in diseases characterized by apoptotic dysregulation, including cancer, neurodegenerative disorders, and cardiovascular conditions [95] [14].
Core Concepts: Cytochrome c Release and PTM Regulation
The Dual Function of Cytochrome c and Its Release Mechanism
Cytochrome c is a multifunctional mitochondrial protein that plays context-dependent roles in cellular survival and death decisions. Under physiological conditions, this 13 kDa haem-containing protein resides in the mitochondrial intermembrane and intercristae spaces, where it serves as an essential electron shuttle in the respiratory chain between Complex III and Complex IV [27] [14]. However, upon reception of apoptotic stimuli such as DNA damage, metabolic stress, or unfolded proteins, cytochrome c undergoes release into the cytosol, initiating the caspase activation cascade.
The release mechanism occurs through a coordinated two-phase process:
- Mobilization: Cytochrome c detaches from the inner mitochondrial membrane where it is anchored through interactions with the phospholipid cardiolipin. This detachment may be facilitated by cardiolipin oxidation via phospholipase A2 or reactive oxygen species (ROS), which reduces cytochrome c's binding affinity [14]. Additionally, increased cytosolic calcium can weaken the electrostatic interactions between cytochrome c and cardiolipin.
- Translocation: The mobilized cytochrome c passes through the mitochondrial outer membrane via mitochondrial outer membrane permeabilization (MOMP), considered the 'point of no return' in apoptotic commitment [14]. This permeabilization is primarily regulated by B-cell lymphoma protein-2 (BCL2) family proteins.
Once in the cytosol, cytochrome c binds to apoptotic protease activating factor-1 (APAF1), forming the apoptosome complex that activates caspase-9 and initiates the proteolytic cascade leading to apoptotic dismantling of the cell [27] [14].
Phosphorylation and Other Regulatory PTMs
Protein phosphorylation, characterized by the reversible addition of phosphate groups to serine, threonine, or tyrosine residues, serves as a fundamental regulatory mechanism across diverse biological processes. In apoptotic signaling, phosphorylation events directly influence cytochrome c release through multiple mechanisms:
- Regulation of BCL2 family protein function and localization
- Modulation of mitochondrial membrane permeability transitions
- Control of caspase activation kinetics and amplification loops
- Integration of stress signaling pathways with core apoptotic machinery
Beyond phosphorylation, other PTMs create a complex regulatory network:
- Ubiquitination: Targets proteins for proteasomal degradation, regulating turnover of apoptotic regulators
- SUMOylation: Modulates protein-protein interactions and subcellular localization
- Acetylation: Regulates protein-DNA and protein-protein interactions in stress responses
- Glycosylation: Influences protein folding, stability, and membrane interactions [95]
These PTMs function as molecular switches that integrate upstream stimuli with downstream apoptotic responses, including cytochrome c release, creating multiple layers of regulation that determine cellular fate decisions [95] [96].
Technical Approaches for Phosphorylation and PTM Analysis
Experimental Workflows for Comprehensive PTM Analysis
The systematic investigation of phosphorylation events requires optimized workflows that preserve PTM states while enabling sensitive detection. The following experimental protocol outlines a comprehensive approach for phosphoproteomic analysis, adapted from current methodologies [96]:
Sample Preparation and Enrichment
- Cell Lysis: Use modified RIPA buffer supplemented with phosphatase inhibitors (2 mM sodium orthovanadate, 10 mM sodium fluoride, 10 mM β-glycerophosphate) and protease inhibitors to preserve phosphorylation states
- Protein Extraction: Employ mechanical disruption under cooled conditions to prevent artefactual modifications
- Digestion: Perform tryptic digestion with sequencing-grade modified trypsin (1:50 enzyme-to-substrate ratio) at 37°C for 16 hours
- Phosphopeptide Enrichment: Utilize titanium dioxide (TiO2) chromatography with HiSelect TiO2 Phosphopeptide Enrichment Kit or immobilized metal affinity chromatography (IMAC) for comprehensive phosphopeptide capture
- Fractionation: Implement alkaline reverse-phase ultra-performance liquid chromatography (RP-UPLC) to reduce sample complexity prior to mass spectrometry analysis
LC-MS/MS Analysis and Data Processing
- Chromatographic Separation: Employ nanoflow liquid chromatography with C18 capillary columns (75 μm × 25 cm) with 2.4 μm particles
- Mass Spectrometry Analysis: Conduct high-resolution tandem MS using Orbitrap-based instruments with higher-energy collisional dissociation (HCD) fragmentation
- Database Searching: Process raw data against appropriate species-specific databases using search engines (MaxQuant, Andromeda) with phosphorylation (S,T,Y) as variable modifications
- Bioinformatic Validation: Perform motif analysis using MEME Suite, pathway enrichment via Gene Ontology, and kinase-substrate prediction algorithms [96]
Optimizing Conditions for Specific Research Applications
Different research questions require tailored optimization of experimental conditions:
For Time-Resolved Phosphorylation Dynamics
- Implement rapid quenching methods (flash freezing in liquid N2 or acidification)
- Use shorter enrichment protocols to capture transient phosphorylation events
- Employ multiplexed quantitative proteomics (TMT, SILAC) for temporal resolution
For Low-Abundance Signaling Proteins
- Increase starting material (3-5 mg protein per replicate)
- Implement sequential enrichment strategies (IMAC followed by TiO2)
- Use data-independent acquisition (DIA) methods to maximize coverage
For Single-Cell Phosphoproteomics
- Leverage isobaric carrier channels to enable low-input analysis
- Employ miniaturized sample preparation workflows
- Utilize emerging ultrasensitive mass spectrometry platforms
Table 1: Critical Optimization Parameters for Phosphoproteomic Studies
| Parameter | Recommended Conditions | Impact on Data Quality |
|---|---|---|
| Phosphatase Inhibition | Freshly added cocktails with multiple specificities | Preserves endogenous phosphorylation states; reduces false negatives |
| Lysis Buffer | 8M Urea, 50mM ammonium bicarbonate, pH 8.0 | Effective denaturation while maintaining compatibility with downstream steps |
| Enrichment Scale | 1-2mg peptide per mg TiO2 beads | Balance between specificity and recovery of low-abundance phosphopeptides |
| LC Gradient | 120-180min gradients for complex samples | Improved separation and identification of phosphopeptide isomers |
| MS Resolution | ≥60,000 for MS1; ≥15,000 for MS2 | Accurate quantification and phosphorylation site localization |
Data Visualization and Analysis Strategies
Experimental Workflow Diagram
The following diagram illustrates the integrated experimental workflow for comprehensive phosphoproteomic analysis of cytochrome c release regulation:
Cytochrome c Release Pathway Regulation
This diagram outlines the core intrinsic apoptosis pathway, highlighting key regulatory nodes where phosphorylation and other PTMs influence cytochrome c release:
Research Reagent Solutions for PTM Studies
Table 2: Essential Research Reagents for Phosphorylation and Cytochrome c Studies
| Reagent Category | Specific Examples | Function and Application |
|---|---|---|
| Phosphatase Inhibitors | Sodium orthovanadate, β-glycerophosphate, sodium fluoride | Preserve endogenous phosphorylation states during sample preparation |
| Enrichment Materials | TiO2 beads, IMAC resins (Fe³⁺, Ga³⁺), phospho-specific antibodies | Selective isolation of phosphopeptides from complex digests |
| Mass Spec Standards | TMT/SILAC labeling reagents, synthetic phosphopeptide standards | Enable quantitative comparisons and analytical validation |
| Apoptosis Inducers | Staurosporine, UV irradiation, chemotherapeutic agents | Activate intrinsic pathway to study cytochrome c release dynamics |
| BCL2 Family Modulators | ABT-737 (BH3 mimetic), Venetoclax (BCL-2 inhibitor) | Specifically target regulatory nodes controlling MOMP |
| Detection Antibodies | Anti-cytochrome c, anti-cleaved caspase-3, anti-phospho-specific antibodies | Validate cytochrome c release and downstream signaling events |
| Kinase Inhibitors | Staurosporine (broad-spectrum), specific inhibitors for AKT, MAPK | Probe functional consequences of phosphorylation events |
Technical Considerations and Methodological Pitfalls
Addressing Technical Challenges in PTM Analysis
The study of phosphorylation in the context of cytochrome c release presents several technical challenges that require specific optimization:
Preservation of Native PTM States
- Implement rapid processing protocols to minimize artefactual modifications
- Use validated phosphatase inhibitor cocktails at appropriate concentrations
- Avoid repeated freeze-thaw cycles that can promote degradation
- Consider acidification during initial processing steps to halt enzymatic activity
Comprehensive Phosphopeptide Coverage
- Optimize enrichment conditions through pilot studies with standard phosphoprotein mixtures
- Combine complementary enrichment techniques (IMAC and TiO2) for expanded coverage
- Address suppression effects in MS analysis through efficient fractionation
- Implement stepped collision energies for improved fragmentation of labile phosphopeptides
Functional Validation of Phosphosites
- Develop targeted MS assays for specific sites of interest
- Employ phospho-mimetic and phospho-deficient mutants (S/D and S/A mutations)
- Use selective kinase inhibitors and activators to establish causality
- Correlate phosphorylation dynamics with functional outcomes in live-cell assays
Quality Control Metrics and Data Interpretation
Rigorous quality control is essential for generating reliable phosphoproteomic data:
Experimental QC Parameters
- Monitor enrichment efficiency using standard phosphoprotein spikes
- Assess reproducibility between technical and biological replicates
- Verify phosphorylation site localization with appropriate scoring algorithms (PTM-RS, AScore)
- Establish linear dynamic range for quantitative applications
Bioinformatic Validation
- Implement false discovery rate control at both peptide and site levels
- Confirm enrichment of known phosphorylation motifs in dataset
- Correlate phosphorylation changes with complementary functional datasets
- Utilize pathway enrichment analysis to identify biologically coherent networks
Table 3: Troubleshooting Common Issues in Phosphorylation Studies
| Issue | Potential Causes | Optimization Strategies |
|---|---|---|
| Low phosphopeptide recovery | Incomplete enrichment, sample loss | Optimize binding conditions, include carrier proteins, scale enrichment appropriately |
| Poor site localization | Incomplete fragmentation, low-quality spectra | Adjust collision energy settings, employ complementary fragmentation methods (EThcD) |
| High technical variability | Inconsistent processing, instrument drift | Implement robust SOPs, use internal standards, randomize sample analysis order |
| Limited biological insight | Inadequate replicates, poor experimental design | Increase biological replicates, incorporate time-course designs, use complementary approaches |
The optimized conditions for studying phosphorylation and post-translational regulation continue to evolve with technological advancements. The integration of sophisticated phosphoproteomic workflows with functional studies of cytochrome c release provides a powerful framework for understanding the complex regulatory networks that control apoptotic decisions. Future methodological developments will likely focus on increasing spatial resolution through subcellular fractionation, enhancing temporal resolution through rapid sampling techniques, and improving sensitivity for limited sample applications. As these methodologies mature, they will undoubtedly yield new insights into the phosphorylation-dependent mechanisms governing cytochrome c release and intrinsic apoptosis, opening new avenues for therapeutic intervention in diseases characterized by apoptotic dysregulation. The continued refinement of these approaches will enable researchers to address increasingly complex biological questions with greater precision and confidence, ultimately advancing our understanding of cellular fate decisions at the molecular level.
Validating Mechanisms and Cross-System Comparisons of the Intrinsic Pathway
The intrinsic apoptosis pathway, a conserved process of programmed cell death, is fundamental to development and homeostasis across diverse biological systems. Central to this pathway is the release of cytochrome c from the mitochondrial intermembrane space, which triggers caspase activation and cellular dismantling. This whitepaper examines the conservation of cytochrome c release mechanisms by integrating findings from neuronal, cardiac, and cancer models. We synthesize quantitative data from recent studies, detail experimental methodologies for investigating intrinsic pathway activation, and visualize key signaling networks. The analysis reveals both conserved regulatory principles and system-specific adaptations of cytochrome c-mediated apoptosis, offering insights for therapeutic targeting across pathological conditions including neurodegenerative diseases, cardiotoxicity, and oncology.
Cytochrome c is a multifunctional 13 kDa hemoprotein that plays two critically important biological roles. Primarily localized within the mitochondrial cristae, it serves as an essential electron shuttle in the mitochondrial respiratory chain between Complex III and Complex IV [14]. However, upon receipt of apoptotic stimuli, cytochrome c translocates to the cytosol where it initiates the intrinsic apoptotic cascade. This release represents a committed step in programmed cell death, marking the point of cellular commitment to apoptosis [27] [14].
The intrinsic (mitochondrial) pathway is activated by diverse intracellular stressors including DNA damage, metabolic stress, and unfolded protein accumulation [14]. Upon mitochondrial outer membrane permeabilization (MOMP), cytochrome c is released into the cytosol where it binds to apoptotic protease-activating factor-1 (Apaf-1) in the presence of dATP/ATP, forming a complex known as the apoptosome [16] [14]. This wheel-like structure consists of seven symmetrically arranged APAF1 molecules that serve as a platform for autoactivation of the initiator caspase, caspase-9 [16]. Activated caspase-9 then proteolytically processes and activates the executioner caspases-3 and -7, which orchestrate the systematic dismantling of the cell through cleavage of key structural and regulatory proteins [22].
This conserved mechanism represents a critical regulatory node in tissue homeostasis and disease pathogenesis across biological systems. The following sections explore the conservation and specialization of this pathway in neuronal, cardiac, and cancer models, highlighting both shared regulatory principles and system-specific adaptations.
Cytochrome c Release: A Conserved Mechanism Across Systems
Core Molecular Machinery
The release of cytochrome c and its subsequent engagement of the apoptotic cascade demonstrates remarkable conservation across diverse cell types, yet exhibits system-specific regulatory mechanisms. The core molecular machinery remains consistent: cytochrome c mobilization from the inner mitochondrial membrane, permeabilization of the outer mitochondrial membrane, apoptosome formation, and caspase activation [27] [14].
The process of cytochrome c release occurs in two distinct phases: mobilization from the mitochondrial intermembrane space and translocation through the outer mitochondrial membrane [14]. During mobilization, cytochrome c detaches from the inner mitochondrial membrane where it is anchored through interactions with the phospholipid cardiolipin [14]. This detachment can be triggered by cardiolipin oxidation via reactive oxygen species (ROS) or phospholipase A2 activity, which significantly reduces cytochrome c's affinity for the membrane [14]. Calcium signaling can also weaken the electrostatic interactions between cytochrome c and cardiolipin, facilitating mobilization [14].
Translocation through the outer mitochondrial membrane represents the "point of no return" in apoptotic commitment and is governed by B-cell lymphoma protein-2 (BCL-2) family proteins [14]. Pro-apoptotic BCL-2 family members such as Bax and Bak form pores in the outer mitochondrial membrane, permitting cytochrome c release into the cytosol [22]. This process is counterbalanced by anti-apoptotic family members including Bcl-2, Bcl-xL, and Mcl-1 [22]. The interplay between these pro- and anti-apoptotic proteins determines mitochondrial permeability and represents a critical regulatory node conserved across neuronal, cardiac, and cancer systems [22].
System-Specific Adaptations
While the core mechanism remains conserved, neuronal, cardiac, and cancer systems exhibit specialized adaptations in cytochrome c regulation:
Neuronal Systems: In neurofibromatosis-1 (NF1) models, neuronal hyperexcitability drives cytochrome c-mediated apoptosis through altered mitochondrial function and increased production of activity-dependent paracrine factors [97]. NF1 mutations reduce hyperpolarization-activated cyclic nucleotide-gated (HCN) channel function, increasing neuronal activity and susceptibility to apoptosis [97].
Cardiac Systems: Cardiomyocytes demonstrate specialized cytochrome c regulation in response to cancer therapy-induced cardiotoxicity. Anthracyclines like doxorubicin cause irreversible myocardial injury via oxidative stress and mitochondrial dysfunction, promoting cytochrome c release [98]. In contrast, trastuzumab-induced cardiac dysfunction is reversible and involves disruption of HER2 signaling without direct cytochrome c involvement [98].
Cancer Systems: Malignant cells frequently exhibit dysregulated cytochrome c-mediated apoptosis, contributing to tumor progression and treatment resistance [16]. In breast cancer, reduced cytochrome c expression or release results in insufficient apoptosis, correlating with poorer patient survival [16]. Some intracellular proteins competitively bind cytochrome c, inhibiting Apaf-1 interaction and protecting cancer cells from apoptosis [16].
Table 1: Conservation of Cytochrome c Release Mechanisms Across Biological Systems
| System | Regulatory Specialization | Primary Inducers | Functional Consequences |
|---|---|---|---|
| Neuronal | HCN channel modulation; Activity-dependent paracrine signaling (NLGN3, midkine) | NF1 mutations; Neuronal hyperexcitability | Altered development; Neurofibroma progression [97] |
| Cardiac | Cardiotoxic drug responses (anthracyclines vs. trastuzumab); ROS generation | Chemotherapy; Radiation therapy | Reversible/irreversible cardiomyopathy; Heart failure [98] |
| Cancer | Dysregulated BCL-2 family expression; Cytochrome c sequestration | Genotoxic stress; Therapeutic agents | Treatment resistance; Disease progression [16] |
| Conserved Elements | BCL-2 family regulation; Cardiolipin interaction; Apoptosome formation | DNA damage; Oxidative stress | Caspase activation; Apoptotic execution [14] [22] |
Quantitative Data Comparison Across Model Systems
Recent investigations have yielded quantitative insights into cytochrome c-mediated apoptosis across model systems. The following tables synthesize key empirical findings, highlighting both conserved metrics and system-specific variations.
Table 2: Quantitative Metrics of Apoptotic Signaling in Model Systems
| Model System | Experimental Intervention | Cytochrome c Release | Caspase Activation | Cell Viability/Outcome |
|---|---|---|---|---|
| Neuronal (NF1-mutant mice) | HCN channel inhibition | Increased activity-dependent shedding of NLGN3 and midkine [97] | Not specified | 2.5-3.9-fold increase in neuronal action potential firing [97] |
| Cardiac (Anthracycline-induced) | Doxorubicin treatment | ROS-mediated release via mitochondrial dysfunction [98] | Not specified | 5-45% develop chronic heart failure depending on dose/risk factors [98] |
| Cancer (Breast cancer models) | Natural extracts (Apigenin, Catalpol) | Significant cytoplasmic increase [16] | Caspase-3, -9 activation; PARP cleavage [16] | Potent anticancer effects in MCF-7 and MDA-MB-231 cells [16] |
| General Apoptosis | Microinjection of cytochrome c | Direct introduction to cytosol | Caspase-3 and -9 activation [14] | Induction of apoptosis in various mammalian cells [14] |
Table 3: Experimental Models and Methodologies in Cytochrome c Research
| Model Type | Key Measurements | Detection Methods | Technical Considerations |
|---|---|---|---|
| In vitro neuronal cultures | Action potential firing rates; Calcium flux; Paracrine factor secretion | Multi-electrode arrays; Calcium imaging; ELISA [97] | Primary cultures require 10+ days in vitro; Cell type-specific responses |
| Cardiac toxicity models | Left ventricular ejection fraction; Troponin/BNP levels; Mitochondrial membrane potential | Echocardiography; Biomarker assays; TMRE staining [98] [99] | Distinguish reversible vs. irreversible dysfunction; Multiple timepoints needed |
| Cancer cell lines | Cytochrome c localization; Caspase activation; DNA fragmentation | Immunofluorescence; Western blotting; TUNEL assay [16] [22] | Cell line-specific apoptotic susceptibility; Microenvironment influences |
| General approaches | Mitochondrial membrane potential; Phosphatidylserine externalization | TMRE/MitoTracker; Annexin V staining [22] | Combine multiple assays to confirm apoptosis type |
Experimental Protocols for Cytochrome c Research
Protocol 1: Assessing Cytochrome c Release via Subcellular Fractionation
This methodology enables quantitative assessment of cytochrome c translocation from mitochondria to cytosol during apoptosis initiation.
Materials:
- Cell lysis buffer (e.g., CST Cell Fractionation Buffer)
- Mitochondrial isolation reagents
- Protease inhibitor cocktail
- Primary antibodies: Cytochrome c (clone 6H2.B4), COX IV (mitochondrial marker), α-tubulin (cytosolic marker)
- Secondary antibodies: HRP-conjugated or fluorescent conjugates
- Enhanced chemiluminescence or fluorescence detection system
Procedure:
- Cell Harvesting: Collect 1-5 × 10⁶ cells by gentle centrifugation (500 × g, 5 min). Wash twice with ice-cold PBS.
- Fraction Preparation: Resuspend cell pellet in 500 μL digitonin-based fractionation buffer containing protease inhibitors. Incubate 10 min on ice.
- Centrifugation: Separate fractions by sequential centrifugation: 1,000 × g (10 min) to remove nuclei and unbroken cells; 10,000 × g (30 min) to pellet heavy membrane (mitochondrial) fraction.
- Protein Quantification: Determine protein concentration in cytosolic (supernatant) and mitochondrial (pellet) fractions.
- Immunoblotting: Resolve 20-30 μg protein per fraction by SDS-PAGE (15% gel). Transfer to PVDF membrane and block with 5% non-fat milk.
- Detection: Incubate with anti-cytochrome c (1:1,000) and compartment-specific marker antibodies overnight at 4°C. Visualize with appropriate secondary antibodies and detection reagents.
Technical Notes: Include positive control (apoptotic inducer like staurosporine) and verify fraction purity with compartment-specific markers. Avoid excessive mechanical disruption during fractionation to preserve mitochondrial integrity [22].
Protocol 2: TUNEL Assay for DNA Fragmentation Detection
The TUNEL (TdT-mediated dUTP Nick-End Labeling) assay detects DNA fragmentation, a hallmark of late-stage apoptosis, in cultured cells, tissue sections, or paraffin-embedded samples.
Materials:
- TUNEL Assay Kit (Fluorescence, 594 nm) #48513 (Cell Signaling Technology)
- Fixed samples (cells or tissue sections)
- Permeabilization buffer (0.1% Triton X-100 in 0.1% sodium citrate)
- Recombinant monoclonal antibody Cleaved Caspase-3 (Asp175) (5A1E) Rabbit mAb #9664
- DAPI #4083 for nuclear counterstaining
- Fluorescence mounting medium
- Fluorescence microscope with appropriate filter sets
Procedure:
- Sample Preparation: Fix cells/tissues with 4% paraformaldehyde for 15 min at room temperature. Permeabilize with 0.1% Triton X-100 for 2 min on ice.
- Labeling Reaction: Prepare TUNEL reaction mixture per manufacturer's instructions. Apply to samples and incubate 60 min at 37°C in a dark humidified chamber.
- Counterstaining: Incubate with anti-Cleaved Caspase-3 (1:500) for 2 hr at room temperature. Apply appropriate secondary antibody if needed.
- Nuclear Staining: Incubate with DAPI (1:10,000) for 5 min to visualize all nuclei.
- Microscopy: Apply mounting medium and image using fluorescence microscopy. Use appropriate filter sets for 594 nm (TUNEL), 488 nm (Cleaved Caspase-3), and DAPI.
Technical Notes: Include positive control (DNase-treated sample) and negative control (omitting TdT enzyme). Since DNA fragmentation occurs in both apoptosis and necrosis, combine with morphological analysis and caspase activation markers to confirm apoptotic death [22].
Protocol 3: Mitochondrial Membrane Potential Assessment Using TMRE
Tetramethylrhodamine ethyl ester (TMRE) accumulates in active mitochondria with intact membrane potential, providing a quantitative measure of mitochondrial health during apoptosis.
Materials:
- Mitochondrial Membrane Potential Assay Kit (II) #13296 (Cell Signaling Technology)
- TMRE (tetramethylrhodamine ethyl ester perchlorate)
- CCCP (carbonyl cyanide m-chlorophenyl hydrazone, depolarization control)
- DRAQ5 #4084 for nuclear counterstaining
- Fluorescent plate reader or flow cytometer
Procedure:
- Staining Solution: Prepare TMRE working solution in culture medium at recommended concentration (typically 100-500 nM).
- Cell Staining: Incubate cells with TMRE solution for 15-30 min at 37°C in the dark.
- Control Preparation: Treat control samples with CCCP (50 μM final concentration) 15 min prior to and during TMRE staining to depolarize mitochondria.
- Analysis: Analyze by flow cytometry (excitation/emission: 549/575 nm) or fluorescence microscopy. For microscopy, counterstain nuclei with DRAQ5 (1:5,000).
- Quantification: Calculate relative fluorescence intensity compared to CCCP-treated controls.
Technical Notes: TMRE loss indicates mitochondrial membrane potential dissipation, an early apoptotic event. However, this also occurs in necrotic death, so combine with annexin V staining and caspase activation assays to confirm apoptosis [22].
Signaling Pathway Visualizations
Conserved Intrinsic Apoptosis Pathway
Diagram 1: Conserved Core Intrinsic Apoptosis Pathway. The schematic illustrates the central mechanism of cytochrome c-mediated apoptosis, highlighting system-specific regulatory inputs from neuronal, cardiac, and cancer models that converge on BCL-2 family regulation.
System-Specific Modulations
Diagram 2: System-Specific Modulation of Cytochrome c Release. The diagram illustrates specialized regulatory mechanisms in neuronal (yellow), cardiac (red), and cancer (green) systems that influence cytochrome c-mediated apoptosis, highlighting both pathological cascades and potential therapeutic interventions.
The Scientist's Toolkit: Research Reagent Solutions
Table 4: Essential Research Reagents for Cytochrome c and Apoptosis Research
| Reagent/Category | Specific Examples | Research Application | Key Features & Considerations |
|---|---|---|---|
| Antibodies for Detection | Cytochrome c (6H2.B4); Cleaved Caspase-3 (Asp175) (5A1E) Rabbit mAb #9664; COX IV (Mitochondrial marker) | Immunoblotting; Immunofluorescence; IHC | Validate for specific applications; Confirm species reactivity [22] |
| Apoptosis Assay Kits | TUNEL Assay Kit (Fluorescence) #48513; Annexin V-FITC Early Apoptosis Detection Kit #6592 | DNA fragmentation detection; Phosphatidylserine externalization | Combine with viability dyes; Distinguish apoptosis vs necrosis [22] |
| Mitochondrial Function Assays | Mitochondrial Membrane Potential Assay Kit (II) #13296; MitoTracker Red CMXRos #9082 | Membrane potential assessment; Mitochondrial localization | Use CCCP control for depolarization; Combine with other apoptosis markers [22] |
| BCL-2 Family Reagents | Bim (C34C5) Rabbit mAb #2933; Bak (D4E4) Rabbit mAb #12105; Pro/Anti-apoptotic Antibody Sampler Kits | Protein localization; Expression analysis | Monitor mitochondrial translocation; Assess activation status [22] |
| Cell Line Models | MCF-7, MDA-MB-231 (breast cancer); Primary neuronal cultures; Cardiomyocyte lines | System-specific mechanistic studies | Consider relevance to human biology; Authentication critical [16] [97] |
| Inducers/Inhibitors | Camptothecin; Staurosporine; Venetoclax (BCL-2 inhibitor); Lamotrigine (HCN modulator) | Pathway modulation; Therapeutic testing | Dose optimization essential; Specificity validation required [22] [97] |
Discussion and Research Implications
The conservation of cytochrome c release mechanisms across neuronal, cardiac, and cancer systems reveals fundamental biological principles while highlighting system-specific adaptations. The core apparatus—including BCL-2 family regulation, cardiolipin interactions, and apoptosome formation—remains remarkably consistent, suggesting deep evolutionary conservation of this programmed cell death pathway [14] [22]. However, each system exhibits specialized regulatory mechanisms: neuronal systems demonstrate activity-dependent regulation through HCN channels [97], cardiac systems show differential responses to cardiotoxic insults [98], and cancer systems frequently develop resistance through cytochrome c sequestration or impaired release [16].
These insights have profound implications for therapeutic development. In neurofibromatosis-1, targeting neuronal hyperexcitability with HCN channel modulators like lamotrigine may suppress tumor progression by reducing activity-dependent paracrine factor release [97]. In cardio-oncology, understanding differential cardiotoxicity mechanisms enables more precise monitoring and prevention strategies, particularly for distinguishing reversible versus irreversible cardiac damage [98]. For oncology applications, natural compounds that restore cytochrome c release and apoptosis represent promising therapeutic avenues, particularly for treatment-resistant malignancies [16].
The integrated analysis presented in this whitepaper provides a framework for future research and therapeutic development. By recognizing both conserved mechanisms and system-specific adaptations, researchers can develop more targeted interventions while leveraging fundamental insights across biological domains. The experimental methodologies and reagent solutions detailed herein provide practical tools for advancing these investigations, facilitating continued exploration of this critical cell death pathway across biological systems and disease contexts.
The intrinsic apoptosis pathway is a genetically programmed mechanism of cell death crucial for development, tissue homeostasis, and disease prevention. At the core of this pathway lies a critical biochemical event: the release of cytochrome c from the mitochondrial intermembrane space into the cytosol. This process serves as a decisive commitment point to cellular destruction, initiating the formation of the apoptosome, a multi-protein complex composed of cytochrome c, apoptotic protease-activating factor-1 (Apaf-1), and caspase-9. The functional characterization of this pathway has been significantly advanced through the development and analysis of various genetic mouse models targeting cytochrome c and Apaf-1. This whitepaper synthesizes genetic evidence from knockout and knock-in models, detailing the resulting phenotypes and their implications for understanding the cytochrome c release mechanism within intrinsic pathway research. The findings from these models have provided fundamental insights into embryogenesis, tissue development, and the molecular basis of diseases characterized by dysregulated apoptosis, including cancer and neurodegenerative disorders.
Cytochrome c Knockout Models
Somatic Cytochrome c Knockout and Embryonic Lethality
The conventional knockout of the somatic isoform of cytochrome c (cyt cs⁻/⁻) in mice results in embryonic lethality, with embryos dying between days E7 and E8 of gestation [100]. This severe phenotype underscores the dual essentiality of cytochrome c, as its absence disrupts both mitochondrial respiration—a life-sustaining process—and apoptotic signaling. Derived embryonic fibroblasts from these knockout embryos demonstrated increased resistance to apoptotic stimuli that activate the intrinsic pathway, confirming cytochrome c's non-redundant role in mediating mitochondrial-dependent apoptosis [100] [14]. Surprisingly, initial studies reported that these cells were hypersensitive to tumor necrosis factor-alpha (TNF-α), which signals primarily through the extrinsic apoptotic pathway, suggesting a potential crosstalk between the two pathways [100].
The Challenge of a "True" Cytochrome c Knockout
Subsequent investigations revealed that the originally described cyt cs⁻/⁻ cell line (CRL 2613) respired at near-normal levels due to the aberrant activation of the testis-specific isoform of cytochrome c (cyt ct). Despite its low expression level, cyt ct was able to functionally replace the somatic isoform in both respiration and apoptosis, indicating that it is not a bona fide null model [100]. To overcome this limitation, researchers developed a double knockout mouse model lacking both the somatic and testis isoforms (cyt cs⁻/⁻ cyt ct⁻/⁻). This model was rendered viable by the introduction of a ubiquitously expressed cytochrome c transgene flanked by loxP sites [100]. Lung fibroblasts derived from these mice, in which the transgene was subsequently deleted via Cre recombinase, showed no detectable cytochrome c expression, no respiratory function, and profound resistance to a broad range of apoptotic stimuli, including those activating both the intrinsic and extrinsic pathways [100]. This model definitively established that oxidative phosphorylation and cytochrome c-mediated apoptosome formation are critical for amplifying death signals in both major apoptotic pathways.
Table 1: Phenotypes of Cytochrome c Knockout Models
| Genetic Model | Viability | Key Phenotypic Features | Cellular Apoptosis Response |
|---|---|---|---|
| Somatic KO (cyt cs⁻/⁻) | Embryonic lethal (E7-E8) [100] | Early developmental arrest [100] | Resistant to intrinsic stimuli; initially reported hypersensitive to TNF-α [100] |
| Somatic & Testis KO (cyt cs⁻/⁻ cyt ct⁻/⁻) | Viable with floxed transgene [100] | No respiration upon transgene deletion [100] | Resistant to both intrinsic and extrinsic apoptotic stimuli [100] |
Cytochrome c Knock-in Models
Apoptosis-Deficient Mutants (K72A)
To dissect cytochrome c's dual functions, a knock-in mouse was generated with a single point mutation at lysine 72 (K72A). This residue is critical for the electrostatic interaction with Apaf-1 but is dispensable for its role in mitochondrial electron transport [14]. Mice homozygous for the K72A mutation (Cycs K72A/K72A) exhibited embryonic lethality and severe brain developmental defects, including brain overgrowth and craniofacial abnormalities, phenocopying the Apaf-1 and caspase-9 knockout models [14]. Mouse embryonic fibroblasts (MEFs) from these mutants failed to activate caspase-9 and caspase-3 and were resistant to various intrinsic apoptotic stimuli, such as UV irradiation and etoposide [14]. This model provided conclusive genetic evidence that the apoptotic function of cytochrome c is distinct from its respiratory function and is non-redundant for normal brain development and tissue homeostasis.
The G41S Thrombocytopenia Model and Species Specificity
A naturally occurring human mutation, G41S, is associated with autosomal dominant thrombocytopenia (Thrombocytopenia Cargeeg) [101]. This mutation enhances cytochrome c's ability to activate caspases and its peroxidase activity without affecting respiration. Surprisingly, when the homologous G41S mutation was knocked into the mouse genome (Cycs G41S/G41S), it did not recapitulate the low platelet count observed in humans [101]. Investigation revealed a previously unreported species-specificity in the interaction between cytochrome c and Apaf-1. Unlike the human G41S variant, the mouse G41S cytochrome c showed a decreased ability to activate caspases, and the human G41S protein was unable to activate caspases in Xenopus embryo extracts [101]. This finding indicates that the electrostatic interaction is not the sole determinant of apoptosome formation, with additional species-specific factors modulating binding affinity and specificity.
Table 2: Phenotypes of Cytochrome c Knock-in Models
| Genetic Model | Mutation Effect | Viability | Key Phenotypic Features |
|---|---|---|---|
| K72A Knock-in | Disrupts Apaf-1 binding; respiration intact [14] | Embryonic lethal [14] | Brain developmental defects, resistance to intrinsic apoptosis [14] |
| G41S Knock-in (Human) | Enhanced caspase activation; respiration intact [101] | Viable (heterozygous) | Thrombocytopenia (low platelet count) [101] |
| G41S Knock-in (Mouse) | Decreased caspase activation; respiration intact [101] | Viable | Normal platelet count [101] |
Apaf-1 Knockout and Hypomorphic Models
Conventional Apaf-1 Knockout
The knockout of Apaf-1, the central adaptor protein of the apoptosome, results in embryonic lethality or perinatal death in mice [14] [102]. The most prominent phenotype is a severe brain abnormality characterized by neural tube defects, craniofacial deformities, and profound overgrowth of the brain due to a failure of the developmental apoptosis required to shape the central nervous system [102]. This phenotype is strikingly similar to those observed in the cytochrome c K72A and caspase-9 knockout mice, genetically establishing these three components as essential parts of a linear pathway crucial for neural development [14].
The Forebrain Overgrowth (fog) Hypomorphic Model
The forebrain overgrowth (fog) mutation was identified as an autosomal recessive mutation mapping to the Apaf-1 chromosomal region [102]. Homozygous fog/fog mutants and compound heterozygous Apaf1/fog mice are viable but exhibit a clear mutant phenotype. This includes mono- or bilateral brain bumps with subcutaneous hemorrhage, lumbo-sacral defects (spina bifida), and kinked or corkscrew-shaped tails [102]. Molecular analysis confirmed that fog is a hypomorphic allele of Apaf-1, characterized by aberrant mRNA splicing and reduced levels of functional Apaf-1 protein [102]. The persistence of progenitor cells that fail to properly integrate into the developing tissue structure suggests that a critical threshold of apoptosome activity is required for normal brain morphogenesis and skeletal formation. This model highlights the importance of Apaf-1 gene dosage and demonstrates that even a partial reduction in apoptosome function can lead to significant developmental abnormalities in the adult organism.
Experimental Methodologies in Key Studies
Generation of Cytochrome c Double-Knockout Fibroblasts
A key methodology for creating a "true" cytochrome c null system involved a multi-step genetic engineering approach [100].
- Mouse Crosses: Mice with a knockout for the somatic cytochrome c (cyt cs⁻/⁻) were crossed with mice lacking the testis isoform (cyt ct⁻/⁻) and carrying a floxed cytochrome c transgene under a ubiquitous promoter.
- Cell Line Derivation: Lung fibroblasts were derived from a one-month-old homozygous cyt cs⁻/⁻ cyt ct⁻/⁻ mouse that also carried the floxed rescue transgene.
- Transgene Excision: The floxed cytochrome c transgene was deleted in culture by infecting the cells with an adenovirus expressing Cre recombinase. This resulted in a cell line completely devoid of cytochrome c, enabling the study of the null phenotype without embryonic lethality.
Cell Death and Respiration Assays
Standardized protocols were employed across studies to quantitatively assess the functional consequences of genetic manipulations [100].
- Respiration Measurements: Cellular oxygen consumption rate was measured by polarography using a Clark-type oxygen electrode. Measurements were taken before and after the sequential addition of inhibitors like antimycin A (Complex III inhibitor) and electron donors like ascorbate/TMPD (for Complex IV).
- Apoptosis Detection: Chromatin fragmentation, a hallmark of apoptosis, was quantified using a cell death detection ELISA. Alternatively, Annexin V-FITC/propidium iodide staining followed by flow cytometry was used to detect phosphatidylserine externalization and membrane integrity.
- Caspase Activation Assays: Cytosolic extracts from cell lines (e.g., U937, WEHI164) or Xenopus oocytes were incubated with purified recombinant cytochrome c and dATP/ATP. Caspase activity was measured by monitoring the cleavage of specific colorimetric or fluorogenic caspase substrates over time [101].
Visualizing the Genetic Evidence in the Intrinsic Pathway
The following diagram synthesizes the genetic evidence within the context of the intrinsic apoptotic pathway, highlighting the points where cytochrome c and Apaf-1 function and the consequences of their disruption.
Diagram Title: Genetic Disruption of the Cytochrome c-Mediated Intrinsic Apoptosis Pathway
The Scientist's Toolkit: Key Research Reagents
Table 3: Essential Research Reagents for Studying Cytochrome c and Apaf-1
| Reagent / Tool | Function in Research | Example Use Case |
|---|---|---|
| Cytochrome c KO Cells | Models lacking cytochrome c function to study its necessity. | Cytochrome c null lung fibroblasts (cyt cs⁻/⁻ cyt ct⁻/⁻) used to demonstrate complete resistance to apoptosis [100]. |
| Apaf-1 Deficient Cells | Models lacking Apaf-1 function to study apoptosome formation. | MEFs from Apaf-1 knockout mice used to establish the protein's role in caspase activation [14]. |
| Site-Directed Mutants (e.g., K72A, G41S) | Dissects specific protein functions (apoptosis vs. respiration). | K72A knock-in MEFs confirmed the residue's critical role in Apaf-1 binding and apoptosis initiation [14]. |
| Caspase Activity Assays | Quantifies the downstream enzymatic output of apoptosome activity. | Used with cytosolic extracts to show species-specific caspase activation by G41S cytochrome c [101]. |
| Cre-loxP System | Enables conditional, tissue-specific gene deletion. | Used to delete a floxed cytochrome c transgene in vitro, creating a "true" null cell line [100]. |
| Polarographic Oxygen Sensor | Measures mitochondrial respiratory function. | Confirmed the absence of cellular respiration in cytochrome c null cells [100]. |
Genetic manipulation of cytochrome c and Apaf-1 in mice has provided indispensable, causal evidence for their non-redundant roles in the intrinsic apoptosis pathway. Knockout models have established that both proteins are essential for embryonic development, particularly in the brain, and that their absence confers profound resistance to apoptotic stimuli. Knock-in models have further refined our understanding by separating cytochrome c's apoptotic function from its respiratory role and revealing unexpected complexities such as species-specific interactions within the apoptosome. The hypomorphic fog model of Apaf-1 demonstrates that even partial reduction in apoptosome activity can lead to significant adult-onset phenotypes, highlighting the importance of precise gene dosage. Collectively, these genetic models have solidified the framework for understanding the cytochrome c release mechanism and have created a foundation for developing therapeutic strategies, such as BH3 mimetics, aimed at modulating this critical pathway in human diseases like cancer.
Cytochrome c is universally recognized for its essential functions in mitochondrial respiration and caspase-dependent apoptosis. However, emerging research reveals this multifunctional protein plays critical roles in vital cellular processes beyond cell death, including cellular differentiation, immune signaling, and gene regulation. This whitepaper synthesizes current evidence establishing cytochrome c as a key regulator of non-apoptotic pathways, with particular focus on its function in lens epithelial cell differentiation. We examine the molecular mechanisms, quantitative assessments, and methodological approaches for investigating these non-canonical functions, providing researchers with technical frameworks for advancing this emerging field. The complex duality of cytochrome c in determining cell fate decisions—mediating both life-sustaining processes and death pathways—presents significant implications for therapeutic development across neurodegenerative disorders, cardiovascular diseases, and cancer.
Cytochrome c is a highly conserved hemeprotein located in the mitochondrial intermembrane space, traditionally known for its indispensable role in the electron transport chain (ETC) where it shuttles electrons between Complex III and Complex IV to support ATP synthesis [56] [14]. In apoptosis, its release into the cytosol triggers apoptosome formation and caspase activation through well-characterized mechanisms [27] [22]. However, recent research has revealed that cytochrome c exhibits diverse non-apoptotic functions based on its cellular localization and concentration gradients.
Table 1: Established and Emerging Functions of Cytochrome c
| Cellular Localization | Primary Function | Key Interactors | Cellular Outcome |
|---|---|---|---|
| Mitochondria | Electron transport in ETC | Complex III, Complex IV, cardiolipin | ATP production [56] |
| Cytosol | Apoptosome formation | APAF-1, caspase-9 | Caspase-dependent apoptosis [27] |
| Cytosol (sublethal release) | Cell differentiation signaling | APAF-1, caspases (low activity) | Differentiation initiation [103] |
| Nucleus | Chromatin remodeling | Nucleosomal components | Chromatin condensation [56] |
| Extracellular space | Immune modulation | Unknown receptors | Inflammation, DAMP signaling [59] |
The non-apoptotic functions of cytochrome c occur at sublethal concentrations that activate survival pathways or distinct signaling mechanisms without committing the cell to death. This whitepaper examines these non-apoptotic functions within the broader context of cytochrome c release mechanisms, focusing on technical approaches for their investigation and quantification.
Non-Apoptotic Functions: Mechanisms and Evidence
Cytochrome c in Cellular Differentiation
The role of cytochrome c in cellular differentiation represents one of the most clearly established non-apoptotic functions. Research using lens epithelial cells demonstrates that components of the intrinsic apoptotic pathway, including cytochrome c release, function as molecular switches initiating differentiation [103].
Key Evidence from Lens Cell Differentiation:
- Spatiotemporal Coordination: The lens equatorial epithelium, where differentiation initiates, shows high expression of pro-apoptotic molecules (Bax, Bcl-xS) and cytochrome c release, yet cells survive and differentiate [103].
- Sublethal Caspase Activation: Significant caspase-3-like activity occurs in differentiating regions, but at far lower levels than observed in apoptosis [103].
- Prosurvival Counterbalance: Concurrent expression of anti-apoptotic molecules (Bcl-2, Bcl-xL, inhibitor of apoptosis proteins) likely maintains the balance toward differentiation rather than death [103].
- Experimental Induction: Short-term exposure to the apoptogen staurosporine induced lens epithelial cells to express differentiation markers and form lentoid structures, directly linking cytochrome c release to differentiation initiation [103].
This process, termed Apoptosis-Related Bcl-2- and Caspase-Dependent (ABC) differentiation, demonstrates how the apoptotic machinery can be co-opted for physiological functions without causing cell death [103].
Cytochrome c as a Danger-Associated Molecular Pattern (DAMP)
When released extracellularly during cell death, cytochrome c functions as a DAMP, triggering immune responses [59]. As an evolutionary endosymbiont derived from bacteria, mitochondria contain multiple molecules that can activate pattern recognition receptors when found in inappropriate compartments [59].
Clinical Evidence of Extracellular Cytochrome c:
- Systemic Inflammatory Response Syndrome (SIRS): Serum cytochrome c concentrations are markedly elevated in intensive care unit patients with SIRS, with levels correlating with APACHE II and multiorgan failure scores [59].
- Organ Injury: Elevated serum cytochrome c occurs in myocardial infarction, liver diseases, and acute kidney injury, where it serves as a marker of cellular damage [59].
- Cancer Prognosis: Serum cytochrome c levels show prognostic value in various cancers, with higher levels indicating more aggressive tumors in some contexts, while increased levels after chemotherapy may indicate treatment efficacy [59].
Table 2: Cytochrome c as a Clinical Biomarker in Pathological Conditions
| Condition | Serum Cytochrome c Levels | Correlation with Disease Parameters | Potential Clinical Utility |
|---|---|---|---|
| Acute Liver Failure | 10,686 pg/mL (vs. 112 pg/mL controls) | Parallels hepatic coma severity [59] | Disease severity assessment |
| Several Liver Diseases | 187.1 ng/mL (vs. 39.8 ng/mL controls) | Correlates with necroinflammatory score [59] | Monitoring disease activity |
| Non-Small Cell Lung Cancer | >13-fold increase post-chemotherapy | Reflects chemotherapy-induced cell death [59] | Treatment response monitoring |
| Operable Malignant Tumors | 20.6 ng/mL (vs. 13.6 ng/mL controls) | Poor survival above 40 ng/mL [59] | Prognostic stratification |
| Systemic Inflammatory Response Syndrome | 12.09-39.1 ng/mL (vs. <0.1 ng/mL controls) | Correlates with organ dysfunction scores [59] | Early detection of complications |
Nuclear Functions of Cytochrome c
Beyond its cytosolic and extracellular roles, cytochrome c translocates to the nucleus under specific conditions, where it participates in chromatin remodeling and nucleosome assembly disruption [56]. This nuclear function represents another non-apoptotic role that expands the functional repertoire of this multifaceted protein.
Quantitative Assessment of Cytochrome c
Accurate quantification of cytochrome c concentration and localization is essential for distinguishing its apoptotic versus non-apoptotic functions.
Spectrophotometric Standard Curve Method
A precise methodology for quantifying cytochrome c oxidase in tissue sections involves creating standards with known concentrations of purified cytochrome c oxidase [104].
Table 3: Standard Curve Preparation for Cytochrome c Quantification
| Well # | Pure COX Final Concentration (μg) | COX Stock Concentration (μg/μl) | Volume from COX Stock (μl) | Volume of TBS (μl) |
|---|---|---|---|---|
| 1 | 2.00 | 0.01 | 200 | 0 |
| 2 | 1.75 | 0.01 | 175 | 25 |
| 3 | 1.50 | 0.01 | 150 | 50 |
| 4 | 1.25 | 0.01 | 125 | 75 |
| 5 | 1.00 | 0.01 | 100 | 100 |
| 6 | 0.75 | 0.01 | 75 | 125 |
| 7 | 0.50 | 0.01 | 50 | 150 |
| 8 | 0.25 | 0.01 | 25 | 175 |
| 9-16 | 0.10-0.03 | 0.0005 | 10-180 | 20-140 |
Methodology Overview: Purified bovine heart cytochrome c oxidase is used to create a concentration gradient from 2μg to 0.03μg. Standards are affixed to nitrocellulose membranes using a dot-blot apparatus and incubated alongside tissue sections during histochemical processing. Optical density measurements from tissue samples are compared against the standard curve to determine cytochrome c concentration [104].
Carbon Quantum Dot Detection Method
Fluorescent carbon quantum dots (CQDs) provide an advanced approach for semiquantitative detection of cytosolic cytochrome c release in apoptosis detection [105].
Protocol Overview:
- CQD Synthesis: CQDs are synthesized from sodium citrate and polyethylene imine through a carbonization process at 170°C for 20 hours [105].
- Detection Principle: CQDs exhibit bright blue emission that specifically decreases in the presence of cytochrome c due to quenching interactions [105].
- Application: Cells are treated with CQDs and apoptosis inducers (e.g., staurosporine, etoposide). Cytochrome c release is detected by decreased fluorescence intensity using confocal laser scanning microscopy [105].
- Sensitivity: This method can detect cytochrome c concentrations between 1-10 μM, typical of early apoptosis [105].
Research Reagent Solutions Toolkit
Table 4: Essential Reagents for Cytochrome c Research
| Reagent/Category | Specific Examples | Research Application | Function/Mechanism |
|---|---|---|---|
| Apoptosis Inducers | Staurosporine, Etoposide, Camptothecin | Inducing cytochrome c release [105] [22] | Activate intrinsic apoptotic pathway |
| Detection Nanomaterials | Carbon Quantum Dots (CQDs) | Fluorescent detection of cytosolic cytochrome c [105] | Fluorescence quenching upon cytochrome c binding |
| Detection Kits | TUNEL Assay Kit, Annexin V-FITC Early Apoptosis Detection Kit | Detecting apoptosis markers [22] | DNA fragmentation; phosphatidylserine externalization |
| Mitochondrial Dyes | MitoTracker Red CMXRos, TMRE | Assessing mitochondrial localization and membrane potential [22] | Accumulates in active mitochondria; detects membrane potential loss |
| Caspase Activity Assays | Cleaved Caspase-3 Antibodies, Caspase-9 Activation Assays | Differentiating apoptosis from non-apoptotic functions [103] [22] | Detects caspase activation levels |
| Protein Standards | Purified Bovine Heart Cytochrome c Oxidase | Creating quantitative standard curves [104] | Reference for concentration determination |
| BH3 Mimetics | Venetoclax | Modulating Bcl-2 family interactions [22] | Inhibits anti-apoptotic Bcl-2 proteins |
Signaling Pathways and Experimental Workflows
Diagram 1: Cytochrome c Release Determines Cell Fate Decisions. The cellular response to cytochrome c release depends on concentration gradients, with high levels triggering apoptosis through apoptosome formation, while sublethal concentrations promote differentiation and survival pathways.
Diagram 2: Experimental Workflow for Cytochrome c Quantification. The methodology combines standardized cytochrome c preparations with tissue samples for precise concentration determination through optical density measurements and standard curve analysis.
Discussion and Research Implications
The non-apoptotic functions of cytochrome c represent a paradigm shift in understanding cell fate determination. Rather than functioning solely as a binary switch for death, cytochrome c operates within a concentration-dependent continuum where sublethal release activates vital processes including differentiation, while full release triggers apoptosis. This model explains how the same molecule can mediate seemingly opposite outcomes based on cellular context, concentration gradients, and the balance of regulatory factors.
The discovery of cytochrome c's role in lens cell differentiation suggests the intriguing possibility that this protein may function similarly in other tissue contexts. The ABC differentiation pathway demonstrates how apoptotic components can be co-opted for physiological functions without causing cell death, mediated through precise regulation of cytochrome c release levels and concurrent activation of survival factors [103].
From a technical perspective, distinguishing non-apoptotic from apoptotic functions requires careful quantification of cytochrome c concentrations and localization. The methodologies outlined in this whitepaper—particularly the standard curve approach [104] and CQD detection system [105]—provide researchers with robust tools for these investigations.
Future research directions should explore:
- The full spectrum of differentiation processes regulated by cytochrome c
- The specific receptors and signaling mechanisms for extracellular cytochrome c as a DAMP
- How post-translational modifications regulate cytochrome c's non-apoptotic functions
- Therapeutic applications for modulating cytochrome c in cancer, neurodegenerative diseases, and tissue regeneration
Cytochrome c exemplifies the complexity of biological systems, where a single protein integrates multiple functions across different cellular compartments and concentration gradients. The non-apoptotic roles of cytochrome c in cellular differentiation, immune signaling, and nuclear function expand our understanding of this multifunctional protein beyond its canonical roles in respiration and apoptosis. For researchers investigating cell fate decisions, these non-apoptotic functions present new dimensions of complexity in cytochrome c biology, with significant implications for therapeutic development across diverse disease contexts. The technical frameworks and methodologies presented herein provide foundation for advancing this emerging field at the intersection of cell death, differentiation, and stress response signaling.
Apoptosis, or programmed cell death, is a genetically regulated process essential for normal development, immune system regulation, and the maintenance of tissue homeostasis in multicellular organisms [106] [107]. This highly controlled cellular suicide mechanism eliminates unwanted, damaged, or infected cells through a series of biochemical events leading to characteristic cell changes including cell shrinkage, nuclear fragmentation, and phagocytic clearance without inducing inflammation [106]. The average adult human loses 50 to 70 billion cells daily to apoptosis, highlighting its fundamental role in physiological maintenance [106]. At the core of apoptotic execution are caspases, a family of cysteine proteases that function in a coordinated cascade to cleave crucial cellular substrates, ultimately dismantling the cell [14].
Two principal signaling pathways initiate apoptosis: the intrinsic pathway (mitochondrial pathway) and the extrinsic pathway (death receptor pathway) [108] [106]. Both pathways activate initiator caspases that then activate executioner caspases, which carry out the proteolytic degradation of cellular components [106]. The intrinsic pathway is triggered by internal cellular stressors such as DNA damage, oxidative stress, or metabolic disturbances, and is characterized by mitochondrial involvement [106] [109]. In contrast, the extrinsic pathway is initiated by extracellular ligands binding to cell-surface death receptors, leading to the formation of a death-inducing signaling complex (DISC) [108] [106].
While these pathways were initially characterized as distinct entities, emerging evidence has revealed sophisticated cross-talk mechanisms that integrate signals between them, allowing cells to respond to a diverse array of death stimuli with remarkable precision [108]. This cross-talk is particularly relevant in the context of cytochrome c release, a pivotal event in the intrinsic pathway that serves as a point of convergence for multiple apoptotic signals [14] [110]. Understanding the molecular intricacies of these pathways and their interactions provides crucial insights for developing novel therapeutic strategies, particularly in cancer treatment where apoptotic evasion is a hallmark of disease [16].
The Intrinsic Apoptotic Pathway
Molecular Mechanism of the Intrinsic Pathway
The intrinsic apoptotic pathway, also known as the mitochondrial pathway, represents a crucial cellular response to internal damage and stress signals. This pathway is primarily activated by diverse intracellular stressors including DNA damage, oxidative stress, metabolic stress, radiation, chemotherapeutic agents, and the accumulation of unfolded proteins [14] [109]. These stimuli converge on mitochondria, transforming this organelle from a energy-producing powerhouse into a central executioner of cell fate decisions.
The molecular sequence of intrinsic pathway activation involves precisely coordinated steps:
- Cellular stress detection leads to the activation of pro-apoptotic sensors, with the tumor suppressor protein p53 playing a pivotal role in DNA damage response [109].
- Activation of Bcl-2 family proteins occurs, shifting the balance toward pro-apoptotic members [111] [110].
- Mitochondrial outer membrane permeabilization (MOMP) is initiated by oligomerization of Bax and Bak, forming pores in the outer mitochondrial membrane [111] [110].
- Cytochrome c release from the mitochondrial intermembrane space into the cytosol represents the point of no return [27] [14] [110].
- Apoptosome formation takes place as cytochrome c binds to Apaf-1 in the cytosol, forming a wheel-like complex in the presence of ATP/dATP [14] [109].
- Caspase activation cascade begins with initiator caspase-9 activation within the apoptosome, which then cleaves and activates executioner caspases-3 and -7 [14] [109].
Table 1: Key Components of the Intrinsic Apoptotic Pathway
| Component | Function | Regulatory Role |
|---|---|---|
| Bax/Bak | Pro-apoptotic proteins that oligomerize to form pores in the mitochondrial outer membrane | Execution of MOMP |
| Bcl-2/Bcl-xL | Anti-apoptotic proteins that prevent pore formation by Bax/Bak | Inhibition of apoptosis |
| Cytochrome c | Mitochondrial protein that activates Apaf-1 and caspase-9 in the cytosol | Apoptosome formation |
| Apaf-1 | Adaptor protein that oligomerizes in response to cytochrome c | Caspase-9 activation platform |
| Caspase-9 | Initiator caspase activated within the apoptosome | Proteolytic activation of executioner caspases |
| p53 | Tumor suppressor protein that transcriptionally activates pro-apoptotic genes | Stress response integration |
Cytochrome c Release Mechanism
The release of cytochrome c from mitochondria represents a critical commitment point in the intrinsic apoptotic pathway and serves as the central focus of this analysis. Cytochrome c is a 13 kDa hemoprotein normally localized in the mitochondrial intermembrane and intercristae spaces, where it functions as an essential electron shuttle in the respiratory chain between Complex III and Complex IV [14]. In healthy cells, cytochrome c is effectively sequestered within mitochondria through interactions with the phospholipid cardiolipin on the inner mitochondrial membrane [14].
The process of cytochrome c release occurs in two distinct phases:
- Mobilization: Cytochrome c detaches from the inner mitochondrial membrane by dissociating from cardiolipin. This detachment can be triggered by cardiolipin oxidation (via phospholipase A2 or reactive oxygen species), which significantly reduces cytochrome c's affinity for the membrane, or by increased cytosolic calcium concentrations that weaken electrostatic interactions [14].
- Translocation: Mobilized cytochrome c passes through pores in the outer mitochondrial membrane formed by oligomerized Bax/Bak proteins, entering the cytosol via simple diffusion [14].
The regulation of cytochrome c release is predominantly controlled by the Bcl-2 protein family, which includes both anti-apoptotic (e.g., Bcl-2, Bcl-xL) and pro-apoptotic members (e.g., Bax, Bak, Bid, Bad, Bim) [111] [110]. In response to apoptotic stimuli, activated Bax translocates from the cytosol to mitochondria, where it undergoes conformational changes and oligomerizes to form permeabilization pores [110]. Bak, constitutively located on mitochondria, undergoes similar oligomerization [110]. Anti-apoptotic Bcl-2 family proteins preserve mitochondrial integrity by directly binding and inhibiting these pro-apoptotic effectors [111].
Upon release into the cytosol, cytochrome c binds to Apaf-1, triggering a conformational change that promotes heptameric apoptosome formation in the presence of ATP/dATP [14] [109]. The apoptosome then recruits and activates procaspase-9 through proximity-induced autoprocessing, initiating the downstream caspase cascade that executes cell death [14].
Diagram 1: Intrinsic Apoptotic Pathway Signaling Cascade. This diagram illustrates the sequential molecular events in the mitochondrial pathway, highlighting cytochrome c release as the pivotal commitment step.
The Extrinsic Apoptotic Pathway
Molecular Mechanism of the Extrinsic Pathway
The extrinsic apoptotic pathway functions as a critical mechanism for eliminating unwanted cells in response to extracellular signals, playing essential roles in immune regulation, tissue homeostasis, and defense against infected or damaged cells. This pathway is initiated by the binding of specific death ligands to their corresponding death receptors on the cell surface [108] [106]. These death ligands belong to the tumor necrosis factor (TNF) superfamily and include TNF-α, Fas ligand (FasL/Apo1L/CD95L), Trail/Apo2L, and Apo3L [108].
The molecular sequence of extrinsic pathway activation involves:
- Ligand-receptor binding: Death ligands bind to preassembled receptor complexes on the cell surface, typically forming trimeric structures [108].
- Death-inducing signaling complex (DISC) formation: Receptor activation leads to the recruitment of intracellular adapter proteins, primarily FADD (Fas-associated death domain), which then recruits procaspase-8 through death effector domain (DED) interactions [108] [106].
- Caspase-8 activation: High local concentration of procaspase-8 molecules within the DISC leads to their autocatalytic activation through proximity-induced dimerization [108].
- Execution phase: Activated caspase-8 directly cleaves and activates downstream effector caspases-3 and -7, initiating the proteolytic cascade that executes cell death [108] [106].
The extrinsic pathway is subject to regulation at multiple levels, most notably by cFLIP (FLICE inhibitory protein), a catalytically inactive caspase-8 homolog that competes for binding to FADD within the DISC, thereby inhibiting caspase-8 activation [108]. Additionally, the formation and activity of the DISC can be influenced by the specific multimerization state of the death ligand, with evidence suggesting that higher-order multimeric forms may generate stronger death signals compared to trimeric ligands [108].
Table 2: Key Components of the Extrinsic Apoptotic Pathway
| Component | Function | Regulatory Role |
|---|---|---|
| Death Receptors | Transmembrane receptors (Fas, TNFR1, DR4/5) that bind extracellular death ligands | Initiation of apoptotic signaling |
| Death Ligands | Extracellular signals (FasL, TNF-α, TRAIL) that activate death receptors | Apoptosis induction in target cells |
| FADD | Adapter protein that bridges death receptors and caspase-8 | DISC formation |
| Caspase-8 | Initiator caspase activated within the DISC | Proteolytic activation of executioner caspases |
| cFLIP | Regulatory protein that competes with caspase-8 for DISC binding | Inhibition of apoptosis initiation |
Death Receptor Signaling Complexes
The initial signaling events in the extrinsic pathway center around the formation of specialized protein complexes at the plasma membrane. The death-inducing signaling complex (DISC) represents the core signaling platform for the extrinsic pathway [108] [106]. Upon ligand binding, death receptors such as Fas/CD95 undergo conformational changes that expose their intracellular death domains, enabling recruitment of FADD through homologous death domain interactions [108]. FADD then recruits procaspase-8 molecules via death effector domain interactions, creating a platform that facilitates caspase-8 activation through induced proximity and autocleavage [108].
The composition and efficiency of DISC formation varies between cell types, leading to the classification of type I and type II cells based on their differential dependence on mitochondrial amplification of the death signal [108]. In type I cells, robust DISC formation generates sufficient active caspase-8 to directly activate downstream effector caspases, rendering the apoptotic process largely independent of mitochondrial involvement [108]. In contrast, type II cells form less efficient DISCs and require mitochondrial amplification through caspase-8-mediated cleavage of Bid, linking the extrinsic pathway to mitochondrial events [108].
Diagram 2: Extrinsic Apoptotic Pathway Signaling Cascade. This diagram illustrates the sequential molecular events in the death receptor pathway, highlighting DISC formation as the critical initiating step.
Pathway Crosstalk and Integration
Molecular Mechanisms of Cross-Talk
The intrinsic and extrinsic apoptotic pathways do not function in isolation but rather engage in sophisticated cross-talk that enables cells to integrate diverse death signals and mount appropriate responses. The Bid protein serves as the primary molecular bridge connecting these two pathways [108] [110]. In cells with weak DISC formation (type II cells), activated caspase-8 from the extrinsic pathway cleaves cytosolic Bid, generating truncated Bid (tBid) that translocates to mitochondria and promotes cytochrome c release by activating Bax/Bak [108] [110].
This cross-talk mechanism explains the differential sensitivity of various cell types to Bcl-2-mediated protection from death receptor activation. In type I cells, where robust DISC formation generates sufficient caspase-8 to directly activate executioner caspases, apoptosis proceeds independently of mitochondrial amplification and is therefore largely resistant to Bcl-2 overexpression [108]. Conversely, in type II cells, where mitochondrial amplification is required, Bcl-2 effectively inhibits apoptosis induced by death receptor engagement [108]. Hepatocytes represent a classic example of type II cells, as demonstrated by the protection from Fas-mediated liver failure afforded by Bcl-2 overexpression or Bid deficiency in mouse models [108].
Additional layers of cross-talk regulation involve the modulation of mitochondrial apoptotic sensitivity by various signaling pathways. For instance, proinflammatory cytokines such as G-CSF can activate the ERK pathway, which inhibits spontaneous apoptosis and cell death induced by intrinsic pathway stimuli but does not affect apoptosis induced by strong extrinsic pathway activation [108]. Similarly, the p38 MAPK and ERK pathways can influence the "tone" of the intrinsic pathway by modulating the balance between pro- and anti-apoptotic Bcl-2 family members, thereby affecting cellular sensitivity to suboptimal death receptor stimulation [108].
Biological Significance of Cross-Talk
The cross-talk between apoptotic pathways provides several biological advantages:
- Signal amplification: Weak extrinsic signals can be amplified through mitochondrial involvement, ensuring efficient elimination of target cells even with limited death receptor stimulation [108].
- Signal integration: Cells can integrate multiple death stimuli from both extracellular and intracellular sources, allowing for coordinated fate decisions based on the totality of cellular conditions [108] [110].
- Cell type-specific regulation: The differential dependence on mitochondrial amplification (type I vs. type II characteristics) enables tissue-specific regulation of apoptotic sensitivity [108].
- Therapeutic implications: Understanding pathway cross-talk reveals potential mechanisms of drug resistance and opportunities for combination therapies that simultaneously target multiple apoptotic pathways [16].
The contextual nature of apoptotic pathway engagement highlights the importance of cellular microenvironment, including the availability of growth factors and cytokines, in determining apoptotic outcomes. This complexity also underscores the challenges in predicting therapeutic responses and designing effective pro-apoptotic cancer therapies [108].
Diagram 3: Apoptotic Pathway Cross-Talk through Bid. This diagram illustrates the molecular integration between extrinsic and intrinsic pathways, highlighting the type I/type II cell distinction based on mitochondrial amplification requirements.
Experimental Analysis of Cytochrome c Release
Methodologies for Studying Cytochrome c Release
The investigation of cytochrome c release mechanisms requires sophisticated experimental approaches that can capture this dynamic process within the cellular context. The following methodologies represent cornerstone techniques in the field:
Immunofluorescence Microscopy provides a powerful approach for visualizing cytochrome c release in fixed cells. The experimental workflow involves:
- Cell culture and treatment: Grow cells on glass coverslips and apply apoptotic stimuli (e.g., UV irradiation, staurosporine, chemotherapeutic agents).
- Fixation and permeabilization: Treat cells with paraformaldehyde (typically 4%) followed by permeabilization with Triton X-100 (0.1-0.5%).
- Immunostaining: Incubate with anti-cytochrome c primary antibody followed by fluorophore-conjugated secondary antibody.
- Mitochondrial counterstaining: Use Mitotracker or antibodies against mitochondrial markers (e.g., COX IV) to visualize mitochondrial networks.
- Microscopy and analysis: Image using confocal microscopy; cytochrome c release is indicated by its transition from punctate mitochondrial pattern to diffuse cytoplasmic localization [110].
Cell Fractionation and Western Blotting offers a biochemical approach for quantifying cytochrome c redistribution:
- Cell lysis and fractionation: Use digitonin-based permeabilization to selectively isolate cytosolic fractions or differential centrifugation to separate mitochondrial and cytosolic fractions.
- Protein quantification: Determine protein concentration across fractions to ensure equal loading.
- Western blotting: Separate proteins by SDS-PAGE, transfer to membranes, and probe with anti-cytochrome c antibody.
- Control blots: Verify fraction purity using compartment-specific markers (e.g., COX IV for mitochondria, LDH for cytosol).
- Quantification: Use densitometry to quantify cytochrome c levels in cytosolic fractions relative to total cellular cytochrome c [110].
Live-Cell Imaging with Fluorescent Proteins enables real-time monitoring of cytochrome c release dynamics:
- Construct design: Create cytochrome c-GFP fusion constructs or use cytochrome c-Venus FRET biosensors.
- Cell transfection: Introduce constructs into target cells via electroporation or viral transduction.
- Mitochondrial labeling: Counterstain with MitoTracker dyes to visualize mitochondrial morphology.
- Time-lapse imaging: Capture images at regular intervals following apoptotic stimulation.
- Image analysis: Quantify fluorescence redistribution kinetics using image analysis software [14].
Key Experimental Findings
Research utilizing these methodologies has yielded fundamental insights into cytochrome c release mechanisms:
- The process occurs in two phases: mobilization from inner membrane binding sites followed by translocation through outer membrane pores [14].
- Bax/Bak oligomerization is essential for cytochrome c release, with genetic studies showing extreme resistance to apoptotic stimuli in Bax/Bak double knockout cells [110].
- Cardiolipin peroxidation facilitates cytochrome c detachment from the inner mitochondrial membrane, representing a key regulatory step [14].
- The release pattern is typically all-or-nothing at the single-cell level, with rapid and complete release once a threshold is reached [14].
- Cristae remodeling may facilitate cytochrome c release by making intermembrane content more accessible, though its requirement remains debated [14].
Table 3: Experimental Approaches for Studying Cytochrome c Release
| Method | Key Reagents | Applications | Technical Considerations |
|---|---|---|---|
| Immunofluorescence Microscopy | Anti-cytochrome c antibodies, mitochondrial markers, fluorescent secondaries | Subcellular localization, release kinetics in fixed cells | Resolution limits, fixation artifacts |
| Cell Fractionation + Western Blot | Digitonin, protease inhibitors, compartment-specific antibodies | Quantitative release measurement, biochemical analysis | Cross-contamination between fractions |
| Live-Cell Imaging | Cytochrome c-GFP fusions, MitoTracker dyes, FRET biosensors | Real-time release kinetics, single-cell analysis | Phototoxicity, overexpression artifacts |
| In vitro Reconstitution | Purified mitochondria, recombinant Bcl-2 proteins, liposomes | Molecular mechanism studies | Loss of cellular context |
The Scientist's Toolkit: Research Reagent Solutions
Table 4: Essential Research Reagents for Apoptosis Signaling Studies
| Reagent Category | Specific Examples | Research Applications | Key Functions |
|---|---|---|---|
| Caspase Inhibitors | Z-VAD-FMK (pan-caspase), Z-DEVD-FMK (caspase-3), Z-IETD-FMK (caspase-8) | Pathway dissection, determining caspase dependence | Irreversible caspase inhibition, mechanistic studies |
| Bcl-2 Family Modulators | ABT-263 (Navitoclax), ABT-199 (Venetoclax), Gossypol (AT-101) | Therapeutic targeting, pathway regulation | BH3 mimetics that inhibit anti-apoptotic Bcl-2 proteins |
| Death Receptor Agonists | Anti-Fas antibodies, recombinant TRAIL, TNF-α | Extrinsic pathway activation, combination therapy studies | Direct activation of death receptors |
| Mitochondrial Dyes | JC-1, TMRM, MitoTracker Red/Green, MitoSOX | Mitochondrial membrane potential, ROS production, mass assessment | Indicators of mitochondrial function and integrity |
| Cytochrome c Detection | Anti-cytochrome c antibodies (clone 7H8.2C12, 6H2.B4), cytochrome c ELISA kits | Release quantification, subcellular localization | Key readout for intrinsic pathway activation |
| Apoptosis Inducers | Staurosporine, UV irradiation, Etoposide, Doxorubicin | Intrinsic pathway activation, chemotherapy models | DNA damage, kinase inhibition, oxidative stress |
| siRNA/shRNA Libraries | Bcl-2 family members, Apaf-1, caspase genes, death receptors | Genetic validation, target identification | Gene-specific knockdown for functional studies |
| Activity Assays | Caspase-Glo 3/7, 8, and 9 assays, Annexin V staining, TUNEL assay | Apoptosis quantification, pathway activity measurement | Luminescent caspase activity, PS externalization, DNA fragmentation |
The comparative analysis of intrinsic and extrinsic apoptotic signaling pathways reveals a sophisticated cellular machinery for programmed cell death execution, with cytochrome c release representing a critical control point in the intrinsic pathway and a key integration node for cross-talk between pathways. The molecular characterization of these pathways has profound implications for understanding tissue homeostasis, developmental biology, and disease pathogenesis, particularly in cancer where apoptotic evasion is a hallmark feature.
The therapeutic targeting of apoptotic pathways, especially through modulation of cytochrome c release, represents a promising frontier in drug development. Current strategies include BH3 mimetics that inhibit anti-apoptotic Bcl-2 proteins, death receptor agonists that directly activate extrinsic apoptosis, and combination approaches that exploit pathway cross-talk to overcome treatment resistance [16]. Furthermore, the detection and quantification of cytochrome c release serves as a valuable biomarker for monitoring therapeutic efficacy and predicting treatment responses in various pathological contexts.
Future research directions should focus on elucidating the precise structural mechanisms of Bax/Bak-mediated mitochondrial outer membrane permeabilization, the contextual regulation of pathway cross-talk in different tissue microenvironments, and the development of more specific therapeutic agents that can selectively trigger apoptosis in diseased cells while sparing normal tissues. The continued investigation of apoptotic signaling pathways will undoubtedly yield new insights into cellular life-and-death decisions and provide novel approaches for manipulating these pathways for therapeutic benefit.
The intrinsic apoptosis pathway, a conserved programmed cell death mechanism, is centrally governed by the mitochondrial release of cytochrome c (Cyt c). This event serves as a critical point of cellular fate, with its dysregulation implicated across diverse pathological states including neurodegenerative diseases, cerebral ischemia, and cancer [27] [14]. In healthy cells, Cyt c is confined to the mitochondrial intermembrane space, where it functions as an essential electron shuttle in the respiratory chain [27]. Upon receipt of a potent apoptotic stimulus—such as DNA damage, metabolic stress, or the presence of unfolded proteins—the mitochondrial outer membrane becomes permeabilized, leading to Cyt c release into the cytosol [14]. Once in the cytosol, Cyt c binds to the protein APAF1 (apoptotic protease activating factor-1), triggering the formation of a multi-protein complex known as the apoptosome. The apoptosome subsequently activates the initiator caspase, caspase-9, which then proteolytically cleaves and activates effector caspases like caspase-3, culminating in the orderly dismantling of the cell [14]. The pivotal nature of this process is underscored by genetic evidence; mice engineered with a single amino acid substitution (Lys72Ala) in Cyt c that abrogates its ability to bind APAF1 and activate caspases, while preserving its respiratory function, display profound resistance to apoptotic stimuli and exhibit embryonic lethality with severe brain developmental defects, mirroring phenotypes observed in Apaf1 and caspase-9 knockout models [14].
This whitepaper delineates the pathophysiological relevance of Cyt c release dysregulation, framing it within a broader thesis on its mechanism in the intrinsic pathway. We synthesize current evidence to illustrate how failure to execute this pathway contributes to neuronal loss in neurodegeneration and ischemia, while its inappropriate activation or evasion is a hallmark of cancer. The document provides a technical guide for researchers and drug development professionals, integrating quantitative data summaries, detailed experimental protocols, and visualizations of core signaling pathways and experimental workflows.
Cytochrome c Release in Disease Pathogenesis
The regulation of Cyt c release is complex, involving multiple layers of control where the B-cell lymphoma protein-2 (BCL2) family proteins play a prominent role [14]. The process can be conceptualized in two phases: first, the mobilization of Cyt c from its binding to the inner mitochondrial membrane (IMM) phospholipid cardiolipin, and second, its translocation through the outer mitochondrial membrane (OMM) via mitochondrial outer membrane permeabilization (MOMP) [14]. Pathogenic dysregulation of this finely tuned process manifests differently across diseases.
Table 1: Pathophysiological Roles of Dysregulated Cytochrome c Release
| Disease Area | Core Dysregulation | Key Molecular Players | Cellular Outcome |
|---|---|---|---|
| Neurodegeneration (e.g., AD, PD) | Inadequate clearance of damaged neurons; Chronic, non-apoptotic Cyt c release may contribute to inflammation. | APAF1, Caspase-9, BCL2 family, Cardiolipin [14] | Progressive neuronal loss; Synaptic dysfunction. |
| Cerebral Ischemia | Excessive activation of intrinsic apoptosis in the ischemic penumbra; Excitotoxicity and oxidative stress promote Cyt c release. | Glutamate, Ca²⁺, ROS, BCL2 family [112] [113] | Delayed neuronal death; Infarction expansion. |
| Cancer | Evasion of apoptosis; Suppression of Cyt c release or downstream apoptosome function. | BCL2 (overexpression), APAF1 (epigenetic silencing), p53 [14] | Tumor survival, progression, and therapy resistance. |
Neurodegeneration
In neurodegenerative disorders such as Alzheimer's disease (AD) and Parkinson's disease (PD), the accumulation of damaged neurons is a key pathological feature. This suggests a failure in the timely elimination of compromised cells, potentially through the evasion of the intrinsic apoptotic pathway [14]. The mechanistic links between Cyt c release and neurodegeneration are being elucidated. For instance, cytosolic Cyt c has been associated with vital cell functions, including differentiation, indicating its release may not always be an all-or-nothing event and that MOMP may not invariably lead to cell death [27]. Furthermore, the pathological proteins characteristic of these diseases can engage with apoptotic machinery. Growing evidence indicates that neurodegenerative conditions are linked to other diseases like cancer and type 2 diabetes through convergent molecular processes, including chronic inflammation and dysregulated signaling pathways [114]. Protein misfolding events, such as those involving amyloid-β (Aβ) in AD and α-synuclein (αSyn) in PD, reflect a convergence of pathogenic mechanisms that may influence cell survival decisions [114].
Cerebral Ischemia
In ischemic stroke, the core region of the brain, which experiences the most severe blood flow reduction, undergoes rapid necrotic cell death. However, the surrounding ischemic penumbra is a region of less severe hypoperfusion where cells are metabolically compromised but potentially salvageable for a time window of hours to days [112]. In this penumbra, the intrinsic apoptotic pathway is a major contributor to delayed neuronal death [112]. The pathophysiology of cerebral ischemia involves a cascade of events including energy failure, excitotoxicity, and oxidative stress, all of which can converge on the mitochondria to promote Cyt c release [112] [113].
Excitotoxicity, mediated by excessive glutamate release, leads to toxic increases in intracellular calcium (Ca²⁺) [112]. This Ca²⁺ influx can activate proteases and promote Cyt c mobilization by weakening its electrostatic interaction with cardiolipin [14] [112]. Concurrently, oxidative stress generates reactive oxygen species (ROS) that can directly oxidize cardiolipin, reducing its affinity for Cyt c and facilitating its release [14]. The release of Cyt c then activates caspases, leading to apoptotic death in the penumbra, which expands the infarct core and worsens neurological outcomes [112]. Post-ischemic neuroinflammation, a persistent secondary response, further exacerbates neuronal damage and is a key therapeutic target [115]. Survivors of cerebral ischemia have a significantly elevated risk of developing dementia, with brain ischemia accelerating its onset by approximately ten years [115] [113].
Cancer
In stark contrast to neurodegeneration and ischemia, cancer cells are characterized by their ability to evade apoptosis, a hallmark of cancer that facilitates their survival, proliferation, and resistance to therapy [14]. A primary mechanism for this evasion is the direct suppression of the intrinsic apoptosis pathway upstream of Cyt c release. This is often achieved through the overexpression of anti-apoptotic BCL2 family proteins, which prevent MOMP [14].
However, cancer cells can also develop defects downstream of Cyt c release. For example, epigenetic silencing of the APAF1 gene has been observed in some cancers, rendering the cell incapable of forming the apoptosome even if Cyt c is successfully released [14]. The critical role of Cyt c in development and tissue homeostasis is confirmed by the Lys72Ala knock-in mouse model, which demonstrates that the loss of Cyt c's apoptotic function is not compensated for by other mechanisms, leading to severe developmental consequences [14]. Interestingly, an inverse epidemiological relationship has been observed between cancer and neurodegenerative diseases, prompting research into shared molecular pathways, such as the PI3K/Akt/mTOR signaling pathway, which is differentially regulated in these conditions [114] [116]. This has spurred interest in repurposing anticancer agents to target pathways implicated in neurodegeneration [114].
Quantitative Data and Experimental Models
Research across these disease domains relies on robust quantitative data and validated experimental models to study Cyt c release and its consequences.
Table 2: Key Experimental Models for Studying Cytochrome c Release and Apoptosis
| Model Type | Specific Model/Assay | Key Readout/Measurement | Application in Disease Research |
|---|---|---|---|
| In Vivo Animal Models | Middle Cerebral Artery Occlusion (MCAO) [112] | Infarct volume (TTC staining), Neurological deficit scores, Histology for apoptotic cells (TUNEL). | Focal cerebral ischemia; Testing neuroprotectants. |
| Transgenic mice (e.g., Cyt c Lys72Ala, Apaf1 KO) [14] | Embryonic viability, Brain development defects, Resistance to apoptotic stimuli in MEFs. | Validating essential apoptotic components; Developmental biology. | |
| In Vitro Cell Models | Primary neurons subjected to OGD (Oxygen-Glucose Deprivation) [112] | Cell viability (MTT/LDH), Caspase-3/9 activity, Cyt c localization (immunocytochemistry). | Ischemia mimetic; Mechanistic studies on excitotoxicity. |
| Human iPSC-derived microglia/astrocytes [117] | NLRP3 inflammasome activation (IL-1β release), Cytokine profiling, Phagocytic activity. | Neuroinflammation in neurodegeneration & infection. | |
| Cancer cell lines (e.g., with BCL2 overexpression) [14] | Sensitivity to chemotherapeutics, Mitochondrial membrane potential (ΔΨm), Cyt c release (western blot). | Drug screening; Mechanisms of therapy resistance. | |
| Biochemical Assays | Cell-free systems (Xenopus/ mammalian cytosolic extracts) [14] | Caspase activation (colorimetric/luminescent substrates), Apoptosome formation (size exclusion chromatography). | Discovery of apoptotic components; Reconstitution studies. |
| Isolated mitochondria [14] | Cyt c release (western blot supernatant), MOMP (swelling), Cardiolipin oxidation (HPLC). | Studying mobilization/translocation triggers (e.g., Ca²⁺, ROS). |
Key Experimental Protocols
1. Protocol: Induction and Assessment of Focal Cerebral Ischemia in Mice (MCAO Model) [112]
- Objective: To model human ischemic stroke for evaluating infarct progression and therapeutic interventions.
- Procedure:
- Anesthesia and Preparation: Anesthetize a mouse (e.g., C57BL/6) using isoflurane. Maintain body temperature at 37°C using a homeothermic blanket.
- Surgical Occlusion: Make a midline neck incision. Isolate the right common carotid artery (CCA), external carotid artery (ECA), and internal carotid artery (ICA). Ligate the CCA and ECA. Insert a silicone-coated monofilament suture (e.g., 6-0) through the ECA stump and advance it into the ICA until mild resistance is felt, thereby occluding the Middle Cerebral Artery (MCA).
- Ischemia and Reperfusion: For transient ischemia, leave the suture in place for a defined period (e.g., 30-60 minutes). For permanent ischemia, the suture remains. To induce reperfusion, carefully withdraw the suture to restore blood flow.
- Post-operative Care: Close the incision and allow the animal to recover with appropriate analgesia and monitoring.
- Outcome Measures (24-72 hours post-surgery):
- Infarct Volume: Sacrifice the animal, remove the brain, section it coronally (1-2 mm thick), and stain with 2,3,5-Triphenyltetrazolium Chloride (TTC). Viable tissue stains red, while the infarct appears white. Quantify infarct volume using image analysis software to correct for edema.
- Neurological Deficit: Use a standardized scoring system (e.g., 0=no deficit, 1=forelimb flexion, 2=circling, 3=leaning to one side, 4=no spontaneous movement).
- Histological Analysis: Process brain tissue for paraffin or cryo-sectioning. Perform TUNEL staining to label apoptotic cells and immunohistochemistry for Cyt c, activated caspases, or other targets.
2. Protocol: Monitoring Cytochrome c Release in Cultured Cells [14]
- Objective: To visualize and quantify the translocation of Cyt c from mitochondria to the cytosol during apoptosis.
- Procedure:
- Cell Culture and Treatment: Plate cells (e.g., primary neurons, HeLa) on glass coverslips. Treat with an apoptotic stimulus (e.g., Staurosporine [1 μM], H₂O₂ [200 μM], or subject to OGD).
- Fixation and Permeabilization: At various time points post-treatment, wash cells with PBS and fix with 4% paraformaldehyde for 15 minutes. Permeabilize with 0.1% Triton X-100 in PBS for 5 minutes.
- Immunofluorescence Staining: Incubate cells with a blocking solution (e.g., 5% BSA in PBS). Apply a primary antibody against Cyt c (monoclonal, e.g., 6H2.B4) for 1 hour at room temperature. Wash and incubate with a fluorescently-labeled secondary antibody (e.g., Alexa Fluor 488). Co-stain with a mitochondrial marker (e.g., MitoTracker Red) or an antibody against a mitochondrial protein like COX IV.
- Microscopy and Analysis: Image cells using a confocal or high-resolution fluorescence microscope. In healthy cells, Cyt c staining will be punctate and co-localized with mitochondrial markers. Upon apoptosis, Cyt c releases into the cytosol, resulting in a diffuse, pan-cellular staining pattern with a loss of co-localization. The percentage of cells showing diffuse Cyt c staining is a standard quantitative measure.
3. Protocol: Drug Screening Cascade for NLRP3 Inflammasome Inhibitors [117]
- Objective: To identify and validate novel, potent, and selective inhibitors of the NLRP3 inflammasome, a key component of neuroinflammation.
- Procedure:
- Primary Screening (Human THP-1 cells): Differentiate THP-1 monocytes into macrophages using PMA. Pre-treat cells with test compounds, then activate the NLRP3 inflammasome with a trigger like ATP. Measure IL-1β release in the supernatant via ELISA as a primary readout of inflammasome activity.
- Secondary Validation (Primary Human Macrophages): Confirm hit compounds from the primary screen in primary cells to ensure relevance and rule out cell-line-specific artifacts.
- Mechanistic and Functional Assays (iPSC-derived Microglia/Organotypic Brain Slices):
- Specificity: Test hits against other inflammasome types (e.g., AIM2, NLRC4) to confirm NLRP3 selectivity.
- Caspase-1 Activation: Use a fluorescent probe (e.g., FAM-FLICA) to directly measure caspase-1 activity.
- Functional Relevance: In advanced models like iPSC-derived microglia or organotypic brain slices, assess the compound's ability to modulate neuroinflammatory responses and provide neuroprotection in a more physiologically relevant context.
- Integrated Analysis: Prioritize compounds that show potency, selectivity, and efficacy across the multi-stage cascade, enhancing translatability to early drug discovery.
Visualization of Pathways and Workflows
The Intrinsic Apoptosis Pathway and Cytochrome c Release
This diagram illustrates the core mechanism of the intrinsic apoptosis pathway, from initial stress signals to the execution of cell death, highlighting the pivotal role of cytochrome c release.
Diagram Title: Intrinsic Apoptosis and Cytochrome c Release
Experimental Workflow for Cerebral Ischemia Research
This diagram outlines a standardized experimental workflow for investigating cyt c-related mechanisms and potential treatments in cerebral ischemia, integrating in vivo and in vitro approaches.
Diagram Title: Cerebral Ischemia Research Workflow
The Scientist's Toolkit: Key Research Reagents
This table details essential reagents, tools, and models used in experimental research focused on cytochrome c release and its pathophysiological relevance.
Table 3: Key Research Reagent Solutions for Cytochrome c and Apoptosis Research
| Reagent / Tool | Function / Application | Specific Example / Target |
|---|---|---|
| Anti-Cytochrome c Antibodies | Detecting Cyt c release via immunofluorescence, western blot, and IHC. Distinguish cytosolic vs. mitochondrial localization. | Monoclonal Antibody (e.g., 6H2.B4) [14] |
| Caspase Activity Assays | Quantifying apoptosis execution. Use colorimetric or fluorogenic substrates that are cleaved by active caspases. | Caspase-3/7, Caspase-9 substrates (e.g., DEVD-pNA, LEHD-AFC) [14] |
| BCL2 Family Modulators | Investigating regulation of MOMP. Inhibitors of anti-apoptotic proteins or activators of pro-apoptotic proteins. | ABT-263 (Navitoclax, BCL-2/BCL-xL inhibitor) [14] |
| Inducers of Apoptosis | Positive controls for activating the intrinsic pathway in various models. | Staurosporine (broad kinase inhibitor), H₂O₂ (oxidative stress) [14] |
| Human iPSC-Derived Cells | Physiologically relevant human models for studying neuroinflammation, toxicity, and drug screening. | iPSC-derived microglia, astrocytes [117] |
| NLRP3 Inflammasome Assays | Screening for inhibitors of neuroinflammatory pathways linked to Cyt c release and disease. | IL-1β ELISA, Caspase-1 FLICA in THP-1/iPSC-microglia [117] |
| Animal Models of Disease | In vivo study of pathophysiology and therapeutic efficacy. | MCAO (focal cerebral ischemia) [112]; Cyt c (Lys72Ala) knock-in mice [14] |
| Oxygen-Glucose Deprivation (OGD) | In vitro modeling of ischemic conditions in primary neurons or cell lines. | Chamber with controlled atmosphere (0.1% O₂, no glucose media) [112] |
The release of cytochrome c from mitochondria represents a decisive commitment to cellular suicide, a process whose precise regulation is vital for health. As this whitepaper has detailed, its dysregulation is a pathophysiological linchpin connecting the progressive neuronal loss in neurodegeneration, the delayed cell death in cerebral ischemia, and the unchecked proliferation in cancer. The molecular events—from cardiolipin-mediated mobilization to APAF1-mediated apoptosome formation—provide a framework for understanding these disparate diseases. While the functional outcome of Cyt c release is diametrically opposed in cancer versus neurodegeneration/ischemia, the shared core machinery offers unique opportunities for therapeutic intervention. The continued development of sophisticated models, including human iPSC-derived cells and genetically engineered animals, coupled with integrated screening cascades, is accelerating the discovery of agents that can either promote or inhibit this pathway with precision. Future research must continue to elucidate the nuanced control mechanisms of Cyt c release, exploring its role in non-apoptotic signaling and its interactions with other core cellular processes, such as metabolic reprogramming and neuro-immune crosstalk, to deliver effective, targeted therapies for these devastating conditions.
Conclusion
The release of cytochrome c from mitochondria represents a point of convergence for diverse apoptotic stimuli and a critical commitment step in the intrinsic pathway. Its regulation is multifaceted, involving precise control by the BCL-2 protein family, interactions with mitochondrial lipids like cardiolipin, and potentially reversible post-translational modifications. While the core mechanism is conserved, its execution and consequences display significant cell-type and context specificity, which has profound implications for both development and disease. Future research must further elucidate the detailed molecular architecture of pore formation, the full spectrum of sub-lethal cytochrome c functions, and the dynamic regulation of this pathway in vivo. For drug development, the continued refinement of agents targeting BCL-2 family interactions and the exploration of combination therapies to overcome resistance represent the most promising clinical avenues, holding potential for more effective treatments in oncology and beyond.
References
- 1. The multiple functions of cytochrome c and their regulation in life and death decisions of the mammalian cell: from respiration to apoptosis - PMC [https://pmc.ncbi.nlm.nih.gov/articles/PMC3075374/]
- 2. - (General Biology I) - Vocab, Definition... | Fiveable Cytochrome c [https://fiveable.me/key-terms/college-bio/cytochrome]
- 3. - Wikipedia Cytochrome c [https://en.wikipedia.org/wiki/Cytochrome_c]
- 4. - New World Encyclopedia Cytochrome c [https://www.newworldencyclopedia.org/entry/Cytochrome_c]
- 5. and cancer cell metabolism: A new perspective - PMC Cytochrome c [https://pmc.ncbi.nlm.nih.gov/articles/PMC11570848/]
- 6. Caspase-mediated Bak Activation and Cytochrome c Release during Intrinsic Apoptotic Cell Death in Jurkat Cells - PMC [https://www.ncbi.nlm.nih.gov/pmc/articles/PMC2602908/]
- 7. Diverse functions of cytochrome in cell death and disease c [https://www.nature.com/articles/s41418-024-01284-8?error=cookies_not_supported&code=56c4a618-70ac-4297-8e12-682385767807]
- 8. Intrinsic and extrinsic pathway signaling during neuronal apoptosis: lessons from the analysis of mutant mice - PMC [https://pmc.ncbi.nlm.nih.gov/articles/PMC2173286/]
- 9. Cytochrome c Release and Mitochondria Involvement in Programmed Cell Death Induced by Acetic Acid in Saccharomyces cerevisiae - PMC [https://pmc.ncbi.nlm.nih.gov/articles/PMC117928/]
- 10. Bcl-2 family - Wikipedia [https://en.wikipedia.org/wiki/Bcl-2_family]
- 11. Structural biology of the Bcl-2 family of proteins - ScienceDirect [https://www.sciencedirect.com/science/article/pii/S0167488903001757]
- 12. How the Bcl - 2 of family to regulate apoptosis proteins interact [https://www.nature.com/articles/7310028?error=cookies_not_supported&code=ae7c6233-99d4-49e3-b681-128c37bbc80b]
- 13. Frontiers | The role of BCL - 2 proteins in family ... regulating apoptosis [https://www.frontiersin.org/journals/oncology/articles/10.3389/fonc.2022.985363/full]
- 14. : functions beyond respiration | Nature Reviews... Cytochrome c [https://www.nature.com/articles/nrm2434?error=cookies_not_supported&code=d2e0ac42-c5d5-4011-91e0-df90b315e88d]
- 15. Overview of BCL - 2 and Therapeutic Potentials Family Proteins [https://pubmed.ncbi.nlm.nih.gov/30535995/]
- 16. The role and application potential of cytochrome in breast cancer... c [https://link.springer.com/article/10.1007/s12672-025-03822-3]
- 17. Frontiers | Linking Oxidative Stress and DNA Damage to Changes in the Expression of Extracellular Matrix Components [https://www.frontiersin.org/journals/genetics/articles/10.3389/fgene.2021.673002/full]
- 18. Oxidative Stress: Signaling Pathways, Biological Functions, and Disease - PMC [https://pmc.ncbi.nlm.nih.gov/articles/PMC12209598/]
- 19. Intrinsic bioenergetic adaptations compensate for reduced mitochondrial content in HER2-driven mammary tumors [https://elifesciences.org/reviewed-preprints/104079]
- 20. Mitochondrial outer membrane : a focus on the role... permeabilization [https://pmc.ncbi.nlm.nih.gov/articles/PMC5578938/]
- 21. (PDF) Mitochondria and cell death: outer membrane ... permeabilization [https://www.academia.edu/1415469/Mitochondria_and_cell_death_outer_membrane_permeabilization_and_beyond]
- 22. of Cell Death: Apoptosis | Mechanisms & Extrinsic Intrinsic Pathways [https://blog.cellsignal.com/mechanisms-of-cell-death-apoptosis]
- 23. Necroptotic Cell Death Signaling and Execution Pathway: Lessons from Knockout Mice - PMC [https://pmc.ncbi.nlm.nih.gov/articles/PMC4600508/]
- 24. Lipid unsaturation promotes BAX and BAK pore activity during apoptosis | Nature Communications [https://www.nature.com/articles/s41467-024-49067-6]
- 25. Bax Activation Initiates the Assembly of a Multimeric Catalyst that Facilitates Bax Pore Formation in Mitochondrial Outer Membranes | PLOS Biology [https://journals.plos.org/plosbiology/article?id=10.1371/journal.pbio.1001394]
- 26. | SpringerLink Membrane Permeabilization Mechanisms [https://link.springer.com/chapter/10.1007/978-981-13-3588-4_2]
- 27. of Mechanisms from mitochondria cytochrome c release [https://pubmed.ncbi.nlm.nih.gov/16676004/]
- 28. Intrinsic Apoptosis - an overview | ScienceDirect Topics [https://www.sciencedirect.com/topics/biochemistry-genetics-and-molecular-biology/intrinsic-apoptosis]
- 29. A new quantitative assay for cytochrome c release in apoptotic cells | Cell Death & Differentiation [https://www.nature.com/articles/4401263]
- 30. and Extrinsic Intrinsic of... | Thermo Fisher Scientific - US Pathways [https://www.thermofisher.com/us/en/home/life-science/antibodies/antibodies-learning-center/antibodies-resource-library/cell-signaling-pathways/cellular-apoptosis-pathway.html]
- 31. and Non- Lethal of Caspases in the DNA Damage... Lethal Functions [https://pmc.ncbi.nlm.nih.gov/articles/PMC9221191/]
- 32. The Release of Cytochrome c from Mitochondria during Apoptosis of NGF-deprived Sympathetic Neurons Is a Reversible Event - PMC [https://pmc.ncbi.nlm.nih.gov/articles/PMC2148194/]
- 33. Glucose metabolism inhibits apoptosis in neurons and cancer cells by redox inactivation of cytochrome c | Nature Cell Biology [https://www.nature.com/articles/ncb1807]
- 34. Glucose Metabolism Inhibits Apoptosis in Neurons and Cancer Cells by Redox Inactivation of Cytochrome c - PMC [https://pmc.ncbi.nlm.nih.gov/articles/PMC2626347/]
- 35. The release of cytochrome from mitochondria during apoptosis of... c [https://pubmed.ncbi.nlm.nih.gov/10085288/]
- 36. Analysis of the cytochrome c-dependent apoptosis apparatus in cells from human pancreatic carcinoma | British Journal of Cancer [https://www.nature.com/articles/6600171]
- 37. Specific Targeting of Caspase-9/PP2A Interaction as Potential New Anti-Cancer Therapy - PMC [https://pmc.ncbi.nlm.nih.gov/articles/PMC3634037/]
- 38. Mechanisms of cytochrome c release from mitochondria | Cell Death & Differentiation [https://www.nature.com/articles/4401950]
- 39. Apoptosis - StatPearls - NCBI Bookshelf [https://www.ncbi.nlm.nih.gov/sites/books/NBK499821/]
- 40. labome.com/ method / Subcellular - Fractionation .html [https://www.labome.com/method/Subcellular-Fractionation.html]
- 41. A cell fractionation approach for the quantitative analysis of... [https://pubmed.ncbi.nlm.nih.gov/14984254/]
- 42. A Cell Fractionation Approach for the Quantitative Analysis of... [https://link.springer.com/article/10.1023/B:PHAM.0000012148.12516.3f]
- 43. New insights into functional regulation in MS-based drug profiling [https://www.nature.com/articles/srep18826?error=cookies_not_supported&code=f1fcc463-51fd-4bc5-ab91-7e8bcfb798c2]
- 44. Ten Approaches That Improve Immunostaining: A Review of the Latest... [https://pmc.ncbi.nlm.nih.gov/articles/PMC8836139/]
- 45. Live Cell Imaging Market Growth, Drivers, and Opportunities [https://www.marketsandmarkets.com/Market-Reports/live-cell-imaging-market-163914483.html]
- 46. Live Cell Imaging Market Outlook 2025-2030 | Leveraging AI and Big Data with Oblique Illumination Technology [https://www.globenewswire.com/news-release/2025/05/08/3076874/28124/en/Live-Cell-Imaging-Market-Outlook-2025-2030-Leveraging-AI-and-Big-Data-with-Oblique-Illumination-Technology.html]
- 47. Multispectral live-cell imaging with uncompromised spatiotemporal resolution | Nature Photonics [https://www.nature.com/articles/s41566-025-01745-7]
- 48. is a form of cell death characterized by several features. Apoptosis [https://www.abcam.com/en-us/technical-resources/guides/cell-health-guide/apoptosis]
- 49. -associated Apoptosis caspase activation assays [https://pubmed.ncbi.nlm.nih.gov/18314058/]
- 50. Incucyte® Apoptosis Assays for Live-Cell Analysis | Sartorius [https://www.sartorius.com/en/applications/life-science-research/live-cell-assays/apoptosis]
- 51. Apoptosis Analysis using Automated Cell Imaging | Molecular Devices [https://www.moleculardevices.com/products/cellular-imaging-systems/high-content-imaging/pico/apoptosis-analysis-using-automated-cell-imaging]
- 52. Apoptosis DNA analysis protocol | Abcam fragmentation [https://www.abcam.com/en-us/technical-resources/protocols/apoptosis-dna-fragmentation]
- 53. A Superior Direct Method for the Quantitative Analysis of DNA ... [https://www.aatbio.com/resources/assaywise/2018-7-1/a-superior-direct-method-for-the-quantitative-analysis-of-dna-fragments-in-late-stage-apoptosis]
- 54. Types, Causes, Detection and Repair of DNA in... Fragmentation [https://pmc.ncbi.nlm.nih.gov/articles/PMC3509564/]
- 55. sciencedirect.com/topics/medicine-and-dentistry/ dna - fragmentation ... [https://www.sciencedirect.com/topics/medicine-and-dentistry/dna-fragmentation-assay]
- 56. Diverse functions of cytochrome in cell death and disease c [https://www.nature.com/articles/s41418-024-01284-8?error=cookies_not_supported&code=c97644f1-0875-4553-a0b9-d167f39052d5]
- 57. Apoptosome - Wikipedia [https://en.wikipedia.org/wiki/Apoptosome]
- 58. in cancer therapy and prognosis - PMC Cytochrome c [https://pmc.ncbi.nlm.nih.gov/articles/PMC9780037/]
- 59. Cytochrome c as a Potentially Clinical Useful Marker of Mitochondrial and Cellular Damage - PMC [https://www.ncbi.nlm.nih.gov/pmc/articles/PMC4951490/]
- 60. Frontiers | Identification and experimental validation of prognostic... [https://www.frontiersin.org/journals/genetics/articles/10.3389/fgene.2025.1627134/full]
- 61. Cytochrome c: a non-invasive biomarker of drug-induced liver injury - PubMed [https://pubmed.ncbi.nlm.nih.gov/18418843/]
- 62. Cytochrome c: potential as a noninvasive biomarker of drug-induced acute kidney injury - PubMed [https://pubmed.ncbi.nlm.nih.gov/22475359/]
- 63. Why do BCL-2 inhibitors work and where should we use them in the clinic? - PMC [https://www.ncbi.nlm.nih.gov/pmc/articles/PMC5729538/]
- 64. A new era in cancer therapy : targeting the Proteasome- Bcl - 2 axis [https://jeccr.biomedcentral.com/articles/10.1186/s13046-025-03505-5]
- 65. Targeting Apoptosis to Overcome Chemotherapy Resistance - Metastasis - NCBI Bookshelf [https://www.ncbi.nlm.nih.gov/books/NBK580869/]
- 66. The BCL family: from apoptosis 2 to new advances in... mechanisms [https://pmc.ncbi.nlm.nih.gov/articles/PMC11926181/]
- 67. Advances and Future Strategies for Current - BCL : Potent... 2 Inhibitors [https://pmc.ncbi.nlm.nih.gov/articles/PMC10605442/]
- 68. Frontiers | Mechanisms of action of the BCL-2 inhibitor venetoclax in multiple myeloma: a literature review [https://www.frontiersin.org/journals/pharmacology/articles/10.3389/fphar.2023.1291920/full]
- 69. BCL-2 dependence is a favorable predictive marker of response to therapy for chronic lymphocytic leukemia | Molecular Cancer | Full Text [https://molecular-cancer.biomedcentral.com/articles/10.1186/s12943-025-02260-7]
- 70. Current Advances and Future Strategies for BCL-2 Inhibitors: Potent Weapons against Cancers - PubMed [https://pubmed.ncbi.nlm.nih.gov/37894324/]
- 71. Assigning mitochondrial localization of dual localized proteins using... [https://elifesciences.org/articles/56649]
- 72. Assembly of Mitochondrial Targeting Signal... Extramitochondrial [https://www.nature.com/articles/s41598-018-24586-7?error=cookies_not_supported&code=232449dc-9df4-4de7-af57-6dffa65ec832]
- 73. Mitochondrial permeability transition pore - Wikipedia [https://en.wikipedia.org/wiki/Mitochondrial_permeability_transition_pore]
- 74. Identity, structure, and function of the mitochondrial permeability transition pore: controversies, consensus, recent advances, and future directions | Cell Death & Differentiation [https://www.nature.com/articles/s41418-023-01187-0]
- 75. Mitochondrial- Localized Intracellular CO-Releasing... Versus Cytosolic [https://pmc.ncbi.nlm.nih.gov/articles/PMC6117112/]
- 76. Frontiers | The Mitochondrial Permeability Transition Pore and ... [https://www.frontiersin.org/articles/10.3389/fonc.2014.00302/full]
- 77. Frontiers | The mitochondrial permeability transition pore: a mystery solved? [https://www.frontiersin.org/journals/physiology/articles/10.3389/fphys.2013.00095/full]
- 78. BH3-Dependent and Independent Activation of BAX and BAK in Mitochondrial Apoptosis - PMC [https://pmc.ncbi.nlm.nih.gov/articles/PMC6186458/]
- 79. BCL2 Family Classification - Creative BioMart [https://www.creativebiomart.net/bcl2-family-classification_2404.htm]
- 80. BH3-only proteins in apoptosis and beyond: an overview - PMC [https://pmc.ncbi.nlm.nih.gov/articles/PMC2928556/]
- 81. Bid chimeras indicate that most BH - 3 can directly... only proteins [https://www.nature.com/articles/cddis2015105?error=cookies_not_supported&code=d26b74db-595c-433e-a35f-114449705a57]
- 82. Nitric Oxide Induces Cell Death by Regulating... | PLOS One [https://journals.plos.org/plosone/article?id=10.1371/journal.pone.0007059]
- 83. BH3-only proteins target BCL-xL/MCL-1, not BAX/BAK, to initiate apoptosis | Cell Research [https://www.nature.com/articles/s41422-019-0231-y]
- 84. Collaborative orchestration of BH3-only proteins governs Bak/Bax-dependent hepatocyte apoptosis under antiapoptotic protein-deficiency in mice | Cell Death & Differentiation [https://www.nature.com/articles/s41418-025-01458-y]
- 85. Neurons exclusively express N- Bak , a BH domain- 3 isoform... only Bak [https://pubmed.ncbi.nlm.nih.gov/15590665/]
- 86. The Role of Mitochondria in Apoptosis - PMC [https://www.ncbi.nlm.nih.gov/pmc/articles/PMC4762029/]
- 87. The Intrinsic Apoptotic Pathway | SpringerLink [https://link.springer.com/chapter/10.1007/978-1-4614-9302-0_2]
- 88. Sensitivity and specificity - Wikipedia [https://en.wikipedia.org/wiki/Sensitivity_and_specificity]
- 89. Calculator false Positive [https://www.omnicalculator.com/statistics/false-positive]
- 90. Quantitative analysis of multi-protein interactions using FRET: application to the SUMO pathway - PubMed [https://pubmed.ncbi.nlm.nih.gov/18359863/]
- 91. : the Achilles’ heel in apoptosis - PMC Cytochrome c [https://pmc.ncbi.nlm.nih.gov/articles/PMC11114681/]
- 92. Frontiers | Cytochrome as a Potentially Clinical Useful Marker of... c [https://www.frontiersin.org/journals/immunology/articles/10.3389/fimmu.2016.00279/full]
- 93. Deep sequencing reveals cell-type-specific patterns of single-cell transcriptome variation | Genome Biology | Full Text [https://genomebiology.biomedcentral.com/articles/10.1186/s13059-015-0683-4]
- 94. Measuring cell-to-cell expression variability in single-cell RNA-sequencing data: a comparative analysis and applications to B cell aging | Genome Biology | Full Text [https://genomebiology.biomedcentral.com/articles/10.1186/s13059-023-03036-2]
- 95. Frontiers | Post - translational modifications orchestrate mTOR-driven... [https://www.frontiersin.org/journals/cardiovascular-medicine/articles/10.3389/fcvm.2025.1620669/full]
- 96. Global phosphoproteome analysis identifies PeVYV P4-induced host... [https://bmcplantbiol.biomedcentral.com/articles/10.1186/s12870-025-07668-3]
- 97. hyperexcitability drives central and... | Nature Communications Neuronal [https://www.nature.com/articles/s41467-022-30466-6?error=cookies_not_supported&code=f748e0e8-f988-4a18-bb7a-ea1811a77d84]
- 98. Cardiac Toxicity of Cancer Therapies: Mechanisms, Surveillance, and Clinical Implications - International Journal of the Cardiovascular Academy [https://ijcva.org/articles/cardiac-toxicity-of-cancer-therapies-mechanisms-surveillance-and-clinical-implications/ijca.2025.39358]
- 99. Frontiers | Cancer —A Major Cardiac Comorbidity With Implications on... [https://www.frontiersin.org/journals/physiology/articles/10.3389/fphys.2021.729713/full]
- 100. Role of Cytochrome in Apoptosis: Increased Sensitivity to Tumor... c [https://pmc.ncbi.nlm.nih.gov/articles/PMC1820455/]
- 101. Interspecies Variation in the Functional Consequences of Mutation of Cytochrome c - PMC [https://pmc.ncbi.nlm.nih.gov/articles/PMC4472513/]
- 102. Apaf1 reduced expression levels generate a mutant phenotype in adult brain and skeleton | Cell Death & Differentiation [https://www.nature.com/articles/4400994]
- 103. The canonical intrinsic mitochondrial death pathway has... [https://pubmed.ncbi.nlm.nih.gov/15826955/]
- 104. An accurate method for the quantification of cytochrome C oxidase in tissue sections - PMC [https://pmc.ncbi.nlm.nih.gov/articles/PMC3644333/]
- 105. Quantifying Cytosolic Cytochrome c Concentration Using Carbon Quantum Dots as a Powerful Method for Apoptosis Detection - PMC [https://www.ncbi.nlm.nih.gov/pmc/articles/PMC8537359/]
- 106. Apoptosis - Wikipedia [https://en.wikipedia.org/wiki/Apoptosis]
- 107. and Extrinsic Apoptosis Intrinsic Review | IntechOpen Signal Pathway [https://www.intechopen.com/chapters/38236]
- 108. - Cross in Cell Death Talk - PMC Signaling [https://pmc.ncbi.nlm.nih.gov/articles/PMC2195865/]
- 109. Intrinsic Pathway - an overview | ScienceDirect Topics [https://www.sciencedirect.com/topics/engineering/intrinsic-pathway]
- 110. The Role of Mitochondria in Apoptosis - PMC [https://pmc.ncbi.nlm.nih.gov/articles/PMC4762029/]
- 111. Mitochondrial Control of Apoptosis | Cell Signaling Technology [https://www.cellsignal.com/pathways/mitochondrial-control-of-apoptosis]
- 112. , treatment, and animal and cellular models of human... Pathophysiology [https://molecularneurodegeneration.biomedcentral.com/articles/10.1186/1750-1326-6-11]
- 113. Apitherapy in Post- Ischemic Brain Neurodegeneration of... [https://pmc.ncbi.nlm.nih.gov/articles/PMC10420307/]
- 114. Disease–disease interactions: molecular links of neurodegenerative... [https://translationalneurodegeneration.biomedcentral.com/articles/10.1186/s40035-025-00507-3]
- 115. Frontiers | Direct and indirect role of non-coding RNAs in company with... [https://www.frontiersin.org/journals/cellular-neuroscience/articles/10.3389/fncel.2025.1670462/full]
- 116. Partner Event: Learning from Cancer to Advance Neurodegeneration Drug Discovery and Development - American Federation for Aging Research [https://www.afar.org/events/learning-from-cancer-to-advance-neurodegeneration-drug-discovery-and-develo]
- 117. Concept Life Sciences Presents New Data Advancing Neuroinflammation and Neurodegeneration Research at Neuroscience 2025 - PharmiWeb.com [https://www.pharmiweb.com/press-release/2025-11-20/concept-life-sciences-presents-new-data-advancing-neuroinflammation-and-neurodegeneration-research-at-neuroscience-2025]