Decoding Apoptotic Morphology: A Comprehensive Guide to Phase IIa and IIb Distinctions for Research and Drug Development
This article provides a detailed analysis of the morphological and biochemical distinctions between the middle (IIa) and late (IIb) phases of apoptosis, critical stages where the cell commits to and...
Decoding Apoptotic Morphology: A Comprehensive Guide to Phase IIa and IIb Distinctions for Research and Drug Development
Abstract
This article provides a detailed analysis of the morphological and biochemical distinctions between the middle (IIa) and late (IIb) phases of apoptosis, critical stages where the cell commits to and executes its dismantling. Tailored for researchers and drug development professionals, it covers foundational concepts of apoptotic morphology, practical methodologies for phase-specific detection, common challenges in phase differentiation, and comparative validation against other cell death mechanisms. The content synthesizes current research to offer a reliable framework for accurately identifying these phases, enhancing the precision of experimental and therapeutic outcomes in areas such as cancer research and neurodegenerative diseases.
The Cellular Blueprint of Apoptosis: Defining Morphological Hallmarks of Phase IIa and IIb
The Morphological Stages of Apoptosis
Apoptosis, or programmed cell death, is a tightly regulated process essential for development, tissue homeostasis, and disease prevention [1] [2]. Its execution follows a sequential, stage-dependent pattern characterized by distinct morphological and biochemical changes. Apoptosis is commonly divided into three main phases: Phase I (early), Phase IIa (middle), and Phase IIb (late), each defined by specific cellular alterations [3] [4].
Phase I (Early Apoptosis) marks the initial commitment to cell death. The cell begins to shrink due to disruption of the cytoskeleton and loss of water content, resulting in a denser cytoplasm. The cell surface smooths as microvilli disappear, and the cell starts to detach from its neighbors and the extracellular matrix. Critically, the plasma membrane remains intact during this phase [3] [1].
Phase IIa (Middle Apoptosis) is defined by dramatic nuclear changes. Chromatin condenses (pyknosis) and aggregates into dense masses, often marginated along the inner nuclear membrane. The nucleus then fragments (karyorrhexis) [3] [1]. This stage represents a point of no return in the apoptotic process.
Phase IIb (Late Apoptosis) culminates in the formation of apoptotic bodies. The cell membrane undergoes blebbing and invagination, packaging the condensed cytoplasm, nuclear fragments, and intact organelles into small, membrane-bound vesicles [3] [1] [4]. These apoptotic bodies are swiftly cleared by phagocytes in a process called efferocytosis, preventing inflammatory responses and maintaining tissue integrity [1].
Table 1: Morphological Characteristics of Apoptotic Phases
| Apoptotic Phase | Key Morphological Events | Cellular Compartment Affected | Detectable by Microscopy |
|---|---|---|---|
| Phase I (Early) | Cell shrinkage, cytoplasm condensation, loss of microvilli, cell detachment | Cytoplasm, Cell Membrane | Electron Microscopy [3] |
| Phase IIa (Middle) | Chromatin condensation (pyknosis), nuclear margination, nuclear fragmentation (karyorrhexis) | Nucleus | Fluorescence/Confocal Microscopy [3] [5] |
| Phase IIb (Late) | Membrane blebbing, formation of apoptotic bodies | Cell Membrane, Cytoskeleton | Light Microscopy [3] [1] |
Key Methodologies for Staging Apoptosis
Morphological Analysis and Quantitative Imaging
Direct observation of morphological changes remains a cornerstone for apoptosis staging. Different microscopy techniques are suited for visualizing specific phases.
- Light Microscopy with stains like Hematoxylin and Eosin (H&E) or Giemsa is primarily suitable for observing late-stage (Phase IIb) apoptosis, where apoptotic bodies and cell shedding are evident [3].
- Electron Microscopy provides the highest resolution, revealing ultrastructural changes across all phases, including early cell shrinkage (Phase I), chromatin condensation (Phase IIa), and apoptotic body formation (Phase IIb) [3].
- Fluorescence/Confocal Microscopy is ideal for detecting nuclear changes characteristic of Phase IIa. DNA-binding dyes like Hoechst 33342, DAPI, and SYTO-61 exhibit brighter fluorescence in condensed chromatin, allowing for clear identification of pyknosis and karyorrhexis [3] [1] [5].
Advanced quantitative phase imaging (QPI) enables label-free tracking of dynamic morphological changes, such as cell mass distribution and density, which are useful for distinguishing apoptosis from other death mechanisms like necrosis [6].
Biochemical and Molecular Detection Techniques
Several assays target the biochemical hallmarks of apoptosis, providing complementary data to morphological observations.
- DNA Fragmentation Analysis: A hallmark of late-stage apoptosis is the cleavage of DNA into 180-200 base pair fragments by endonucleases. This can be detected by DNA Gel Electrophoresis, which produces a characteristic "ladder" pattern, or by the TUNEL Assay, which labels the 3'-OH ends of DNA breaks for microscopy or flow cytometry [3] [1]. The TUNEL assay is highly sensitive for late apoptosis but can yield false positives and requires careful control setup [3].
- Caspase Activity Assays: Caspases are cysteine proteases that act as central executioners of apoptosis. Activation of initiator caspases (e.g., caspase-8, -9) and effector caspases (e.g., caspase-3, -7) can be measured using fluorogenic substrates or western blot analysis of their cleaved, active forms [1] [4] [7].
- Western Blot Analysis: This technique is powerful for detecting specific protein markers and their cleavage products during apoptosis. Key targets include:
- Cleaved Caspase-3: A key executioner caspase, whose activation signifies committed apoptosis.
- Cleaved PARP: Poly (ADP-ribose) polymerase cleavage is a classic downstream event of caspase-3 activation.
- Bcl-2 Family Proteins: Shifts in the balance of pro-apoptotic (e.g., Bax, Bak) and anti-apoptotic (e.g., Bcl-2, Bcl-xL) proteins indicate regulatory changes [4].
- Mitochondrial Assays: The intrinsic apoptotic pathway involves a decrease in mitochondrial membrane potential. Fluorescent dyes like JC-1 can detect this loss; a shift from red (aggregate) to green (monomer) fluorescence is a marker of early apoptosis [3] [1].
- Phosphatidylserine (PS) Exposure: In early apoptosis, PS is translocated from the inner to the outer leaflet of the plasma membrane. This can be detected by Annexin V staining. When combined with a viability dye like propidium iodide (PI), it can distinguish early apoptotic (Annexin V+/PI-) from late apoptotic or necrotic cells (Annexin V+/PI+) [1].
Table 2: Key Biochemical Assays for Apoptosis Detection
| Assay | Primary Target / Principle | Optimal Apoptotic Stage | Key Advantages | Key Limitations |
|---|---|---|---|---|
| Annexin V/PI Staining | Externalized PS / Membrane Integrity | Early & Late Stage Distinction | Can distinguish apoptosis from necrosis | Not specific; late apoptotic cells lose binding [1] |
| Caspase Activity/ Cleavage | Caspase protease activity (e.g., Casp-3, -8, -9) | Mid-Stage | High specificity for apoptosis | May miss caspase-independent pathways [4] [7] |
| DNA Gel Electrophoresis | Internucleosomal DNA fragmentation | Late Stage | Simple, qualitatively accurate | Poor sensitivity, cannot localize cells [3] |
| TUNEL Assay | 3'-OH DNA ends | Late Stage | Sensitive, allows cell counting | Can produce false positives [3] [1] |
| Mitochondrial Potential (JC-1) | Loss of ΔΨm | Early Stage (Intrinsic Pathway) | Good early indicator | Affected by changes in pH [3] [1] |
Experimental Protocol: Discriminating Apoptosis Phases IIa and IIb
This integrated protocol outlines a methodology for discriminating between the nuclear disintegration of Phase IIa and the physical disassembly of Phase IIb, using a combination of fluorescence microscopy and biochemical analysis.
Cell Culture and Apoptosis Induction
- Cell Line: Human breast carcinoma MCF-7 cells are a suitable model [5].
- Culture Conditions: Maintain cells in DMEM medium supplemented with 10% FBS at 37°C in a humidified atmosphere with 5% CO2 [5].
- Apoptosis Induction: Treat cells at ~90% confluence with 1-30 µM doxorubicin hydrochloride for 24 hours. A vehicle control (deionized water) should be included [5].
Multiparameter Fluorescence Staining and Confocal Imaging
This procedure allows for simultaneous assessment of nuclear morphology and membrane integrity.
- Harvesting: Harvest control and treated cells using trypsin/EDTA, followed by washing with growth medium.
- Staining for Nuclear Morphology (Phase IIa Marker): Resuspend the cell pellet and stain with 1 µM Syto-61, a cell-permeant nucleic acid dye. Incubate for 30 minutes at 37°C. Syto-61 fluorescence increases upon binding to nucleic acids, and its signal allows for the visualization of chromatin condensation and nuclear fragmentation [5].
- Staining for Membrane Integrity & PS Exposure (Phase IIb Marker): Wash the cells and resuspend in Annexin V binding buffer. Add Annexin V conjugated to a fluorophore (e.g., FITC) and incubate for 15 minutes at room temperature in the dark. Annexin V binds to phosphatidylserine exposed on the outer membrane, a feature of mid-to-late apoptosis [5].
- Confocal Imaging: Transfer ~140 µl of the cell suspension to a depression slide. Acquire confocal image stacks using a 63x oil immersion objective. Collect fluorescence signals from Syto-61 and Annexin V in separate channels. Acquire Z-stacks with a step size of 0.5-0.6 µm [5].
Data Analysis and Phase Discrimination
- 3D Reconstruction: Reconstruct the 3D morphology of imaged cells from the confocal Z-stacks.
- Phase IIa Identification (Nuclear Fragmentation): Cells exhibiting bright, punctate, or fragmented Syto-61 staining within the nucleus, indicating chromatin condensation and karyorrhexis, but with low Annexin V signal, are classified as being in Phase IIa [5].
- Phase IIb Identification (Membrane Blebbing & Apoptotic Bodies): Cells displaying both intense Syto-61 nuclear fragmentation and positive Annexin V staining, accompanied by a visibly blebbed membrane and/or the presence of small, membrane-bound apoptotic bodies, are classified as being in Phase IIb [3] [5].
- Quantitative Analysis: Morphometric parameters such as nuclear fragmentation index, cell volume, and surface texture can be extracted from the 3D reconstructions to provide quantitative distinction between the phases [5].
The Scientist's Toolkit: Essential Reagents for Apoptosis Research
Table 3: Key Research Reagent Solutions for Apoptosis Detection
| Reagent / Assay | Function / Target | Application in Staging |
|---|---|---|
| Annexin V (FITC, etc.) | Binds externalized phosphatidylserine (PS) | Detection of mid-stage apoptosis; distinguishes early (PS exposure) from late (membrane rupture) when used with PI [1] [5] |
| Propidium Iodide (PI) | DNA intercalator, membrane-impermeant | Viability dye; identifies late apoptotic/necrotic cells with compromised membranes [1] |
| Hoechst 33342 / DAPI | Cell-permeant DNA dyes | Fluorescence microscopy to visualize nuclear condensation (pyknosis) and fragmentation of Phase IIa [3] [1] |
| Syto-61 | Cell-permeant nucleic acid stain | Confocal imaging of 3D nuclear morphology changes during Phase IIa [5] |
| Caspase Substrates (e.g., DEVD-ase) | Fluorogenic peptides cleaved by active caspases | Measurement of executioner caspase (e.g., Casp-3/7) activity, a key mid-stage biochemical event [1] [7] |
| JC-1 Dye | Potential-sensitive mitochondrial dye | Detection of early apoptosis via loss of mitochondrial membrane potential (ΔΨm) in the intrinsic pathway [3] [1] |
| TUNEL Assay Kit | Labels 3'-OH ends of fragmented DNA | Specific detection of late-stage apoptosis characterized by DNA cleavage [3] [1] |
| Apoptosis Antibody Cocktails | Pre-mixed antibodies (e.g., vs Cleaved Casp-3, PARP) | Western blot analysis for simultaneous detection of multiple apoptotic markers, streamlining workflow [4] |
Molecular Signaling in Apoptotic Staging
The morphological stages are driven by precise molecular pathways. The two primary signaling routes are the extrinsic (death receptor) and intrinsic (mitochondrial) pathways, which converge on the activation of effector caspases.
- The Extrinsic Pathway is initiated by the binding of extracellular death ligands (e.g., FasL, TNF-α) to their cognate cell surface receptors. This leads to the formation of the Death-Inducing Signaling Complex (DISC), which activates initiator caspase-8 [1] [2] [7].
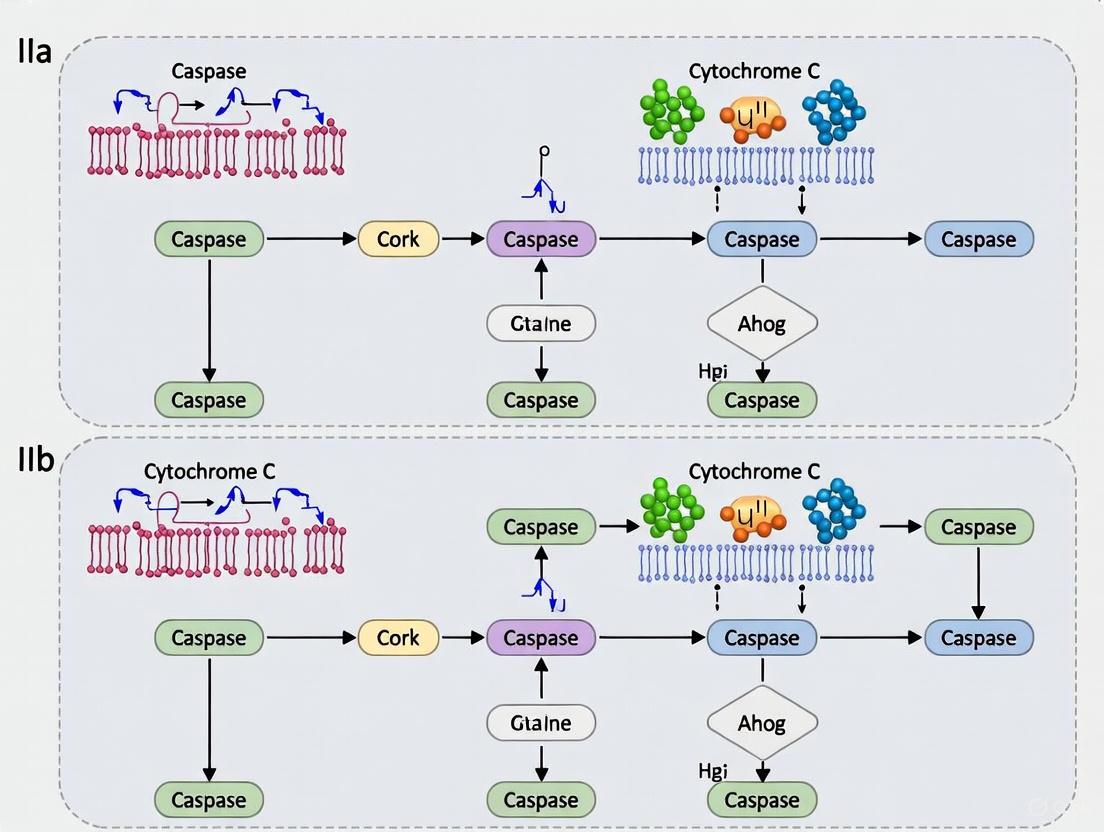
- The Intrinsic Pathway is triggered by internal cellular stress (e.g., DNA damage, oxidative stress). This leads to an increase in mitochondrial outer membrane permeabilization (MOMP), controlled by the balance of pro-apoptotic (e.g., Bax, Bak) and anti-apoptotic (e.g., Bcl-2) proteins. MOMP causes the release of cytochrome c into the cytosol, where it binds to Apaf-1 and forms the "apoptosome," activating initiator caspase-9 [1] [2] [7].
Both pathways converge to activate executioner caspases-3 and -7, which orchestrate the systematic dismantling of the cell by cleaving hundreds of cellular substrates, including structural proteins and DNA repair enzymes like PARP, leading to the characteristic morphological changes of Phases IIa and IIb [1] [7].
The meticulous dissection of apoptosis into defined morphological and biochemical stages—from early commitment to final dismantling—provides a critical framework for biomedical research. The distinct characteristics of Phase IIa, centered on nuclear disintegration, and Phase IIb, defined by cellular fragmentation into apoptotic bodies, are particularly crucial for accurate detection and interpretation. A multi-parametric approach, combining quantitative morphological imaging with specific biochemical assays like caspase activation and PARP cleavage, is essential for precise staging. This foundational knowledge is vital for advancing our understanding of disease mechanisms, from cancer to neurodegeneration, and for developing therapeutic strategies that aim to modulate cell death pathways.
Phase IIa apoptosis represents a critical commitment point in programmed cell death, characterized by definitive and irreversible morphological alterations. This stage serves as the executional bridge between initial signaling events and the final cellular dismantling of Phase IIb. The transition into Phase IIa is marked by two hallmark processes: chromatin condensation and nuclear fragmentation, which collectively dismantle the nuclear architecture and ensure the cell's passage beyond recovery [3] [2]. Understanding Phase IIa is paramount for researchers and drug development professionals, as it represents a key therapeutic window for modulating cell death in diseases like cancer and neurodegeneration. This technical guide details the specific morphological features, underlying molecular mechanisms, and robust detection methodologies that define this "point of no return" within the broader context of apoptosis research, particularly in contrast to the subsequent events of Phase IIb.
Morphological Hallmarks of Phase IIa
The progression into Phase IIa is defined by a sequence of distinct and observable structural changes within the nucleus.
Nuclear and Chromatin Dynamics
During Phase IIa, the cell nucleus undergoes a dramatic reorganization. The cell acquires a dense cytoplasm with increased eosinophilia, and the chromatin undergoes profound compaction [3]. This is not a uniform process but can be classified into specific, sequential stages based on high-resolution imaging studies, which reveal a programmed pathway of nuclear disassembly [8].
Table 1: Characteristic Features of Apoptosis Phase IIa vs. Phase IIb
| Feature | Phase IIa (Middle Apoptosis) | Phase IIb (Late Apoptosis) |
|---|---|---|
| Primary Event | Chromatin condensation & nuclear fragmentation [3] | Formation of apoptotic bodies [3] |
| Nuclear Morphology | Chromatin margination, pyknosis, and nuclear fragmentation [3] | Nuclear collapse and disintegration into membrane-bound vesicles [3] [8] |
| Chromatin State | Highly condensed chromatin forming a continuous ring or a beaded "necklace" at the nuclear periphery [8] | Fully fragmented chromatin packaged into apoptotic bodies [3] |
| DNA Fragmentation | Activation of endonucleases; generation of oligonucleosomal fragments (180-200 bp) [3] | Extensive DNA cleavage yielding a classic "ladder" on gel electrophoresis [3] |
| Key Biochemical Dependencies | DNase activity required for progression; Actin involvement [8] [9] | ATP hydrolysis required for nuclear collapse/disassembly [8] |
Research using cell-free systems and time-lapse imaging has further refined our understanding of chromatin condensation, defining it as a multi-stage process that includes Stage 1 (ring condensation), where a continuous ring of condensed chromatin forms at the nuclear periphery, and Stage 2 (necklace condensation), where this ring becomes discontinuous and beaded [8]. A critical finding is that initial chromatin compaction can precede the activation of executioner caspases, suggesting an early, regulated commitment to the apoptotic pathway [10].
Quantitative Morphological Profiling
Advanced imaging techniques allow for the quantification of these morphological changes. For instance, the Chromatin Compaction Parameter (CCP), derived from Sobel edge detection algorithms applied to fluorescently labeled histone signals, provides a quantitative measure of chromatin condensation [10]. Studies applying this method in cortical neurons showed a significant increase in CCP during the early stages of apoptosis, confirming that chromatin compaction is a defining and quantifiable feature of Phase IIa [10].
Molecular Mechanisms and Signaling Pathways
The morphological changes of Phase IIa are driven by a precise biochemical cascade.
The Caspase Activation Cascade
The pivotal event initiating Phase IIa is the proteolytic activation of caspase-3. Caspase-3 exists as an inactive pro-enzyme (p32) that is cleaved by initiator caspases (e.g., caspase-9 in the intrinsic pathway) to generate large (p17) and small (p12) subunits, which assemble into the active heterotetramer [11] [12]. This active caspase-3 is responsible for cleaving a multitude of cellular substrates, including PARP (Poly (ADP-ribose) polymerase). Cleavage of PARP inactivates its DNA repair function, preventing cellular recovery and facilitating DNA degradation [4]. Once activated, caspase-3 is rapidly degraded, making its detection a transient but definitive marker of Phase IIa execution [12].
Execution via Endonucleases and Structural Proteins
A key downstream effect of caspase-3 activation is the stimulation of endonucleases, such as CAD (Caspase-Activated DNase). These enzymes are responsible for digesting nuclear DNA at the linker regions between nucleosomes, producing the characteristic DNA fragments of 180-200 base pairs and their multiples [3]. This DNA fragmentation is a biochemical hallmark of Phase IIa.
Furthermore, the structural remodeling of the nucleus involves proteins beyond the core apoptotic machinery. Evidence suggests that nuclear actin and myosin play a role in chromatin dynamics during apoptosis. The release of nuclear actin and the depolymerization of nuclear F-actin have been shown to be necessary for efficient chromatin condensation, indicating that the actomyosin system provides a structural framework that must be disassembled for apoptosis to proceed [9] [10].
Diagram 1: Molecular signaling pathway driving Phase IIa apoptosis.
Experimental Detection and Analysis Protocols
Accurate identification of Phase IIa requires a multi-faceted approach combining morphological, biochemical, and molecular techniques.
Core Methodologies for Phase IIa Identification
Table 2: Key Methodologies for Detecting Phase IIa Hallmarks
| Method | Target / Principle | Application in Phase IIa Detection | Key Advantages & Limitations |
|---|---|---|---|
| Fluorescence/Confocal Microscopy [3] | Nuclear morphology using dyes (Hoechst, DAPI) or fluorescent protein tags (H2B::mCherry). | Visualizes chromatin condensation and margination. | Advantage: Intuitive, allows live-cell imaging. Limitation: May miss early/small-scale changes [3] [10]. |
| Electron Microscopy [3] [8] | High-resolution ultrastructural imaging. | Reveals chromatin highly condensed and marginalized; loss of subnuclear structures. | Advantage: Gold standard for detailed morphology. Limitation: Fixed samples only; technically demanding [3]. |
| Western Blot [4] | Detection of cleaved/activated proteins (e.g., Caspase-3, PARP). | Confirms activation of executioner caspases and key substrates. | Advantage: Specific, quantitative, uses standard lab equipment. Limitation: Bulk analysis, no single-cell resolution [4]. |
| DNA Gel Electrophoresis [3] | Separation of DNA fragments by size. | Detects internucleosomal DNA cleavage (180-200 bp ladder). | Advantage: Classic biochemical proof of apoptosis. Limitation: Low sensitivity; requires many apoptotic cells; late-stage marker [3]. |
| TUNEL Assay [3] [11] | Labels 3'-OH ends of fragmented DNA. | Identifies cells with ongoing DNA fragmentation. | Advantage: Sensitive, can be used on tissue sections. Limitation: Can yield false positives from non-apoptotic DNA damage [3]. |
Detailed Protocol: Western Blot for Caspase-3 Activation
Western blotting is a cornerstone technique for biochemically confirming entry into Phase IIa by detecting the cleavage of caspase-3 [4].
- Sample Preparation: Lyse control and treated cells in RIPA buffer supplemented with protease inhibitors. The inclusion of caspase inhibitors (e.g., z-DEVD-fmk) in a parallel sample set can stabilize the active caspase-3 complex and enhance detection [12]. Determine protein concentration to ensure equal loading.
- Gel Electrophoresis & Transfer: Separate 20-30 µg of total protein per lane on a 12-15% SDS-PAGE gel to resolve the small cleaved fragments (p17/p12). Transfer proteins to a PVDF or nitrocellulose membrane.
- Immunoblotting:
- Blocking: Incubate membrane with 5% non-fat milk in TBST for 1 hour.
- Primary Antibody Incubation: Probe membrane overnight at 4°C with specific antibodies. Critical targets include:
- Cleaved Caspase-3 (Asp175): Specifically detects the large fragment (p17) of activated caspase-3.
- Caspase-3 (8G10): Detects both full-length (p32) and cleaved large fragment (p17).
- Cleaved PARP (Asp214): Detects the 89 kDa apoptotic fragment.
- Loading Control (e.g., β-Actin or GAPDH).
- Detection & Analysis: Incubate with an appropriate HRP-conjugated secondary antibody and develop using chemiluminescent substrate. Use densitometry software (e.g., ImageJ) to quantify band intensities. The activation of apoptosis is indicated by the appearance of the cleaved caspase-3 (p17) and cleaved PARP (p89) bands, and an increasing ratio of cleaved-to-full-length protein [4].
Diagram 2: Experimental workflow for detecting caspase-3 activation by western blot.
The Scientist's Toolkit: Essential Reagents for Phase IIa Research
| Research Reagent / Assay | Primary Function in Phase IIa Research |
|---|---|
| Anti-Cleaved Caspase-3 Antibody [4] | Specific immunohistochemical or western blot detection of activated caspase-3 (p17 fragment), a definitive marker of execution phase commitment. |
| Caspase-3 Fluorogenic Substrate (e.g., DEVD-afc) [11] | Quantitative measurement of caspase-3 enzyme activity in cell lysates; increased activity confirms functional activation. |
| Caspase-3 Selective Inhibitor (e.g., z-DEVD-fmk) [11] [12] | Tool for mechanistic studies; inhibits caspase-3 activity and stabilizes the active enzyme complex for easier detection. |
| Anti-Cleaved PARP Antibody [4] | Western blot detection of PARP cleavage (89 kDa fragment), serving as a downstream verification of caspase-3 activation. |
| Histone H2B Fusion Protein (e.g., H2B::mCherry) [10] | Live-cell imaging of nuclear chromatin dynamics; allows real-time visualization and quantification of condensation. |
| Cell Permeant DNA Stains (Hoechst 33342, DAPI) [3] | Fluorescent staining of nuclear DNA for fixed or live-cell microscopy to assess chromatin condensation and nuclear morphology. |
| TUNEL Assay Kit [3] [11] | Labels nicked DNA in situ to detect cells undergoing DNA fragmentation, a key biochemical event of Phase IIa. |
| Apoptosis Western Blot Cocktail [4] | Pre-mixed antibody solution for simultaneous detection of multiple apoptotic markers (e.g., pro/p17-caspase-3, cleaved PARP), streamlining workflow. |
Phase IIa apoptosis is a critically defined stage where the cell commits irrevocably to death through the orchestrated processes of chromatin condensation and nuclear fragmentation. Its clear distinction from Phase IIb lies in the specific nuclear morphology and the fact that the cell is still intact but biochemically beyond recovery. A robust understanding of the molecular drivers—caspase-3 activation, endonuclease-mediated DNA cleavage, and structural protein dynamics—is essential. By leveraging the detailed protocols and reagent toolkit provided, researchers can accurately identify and study this "point of no return," facilitating advances in therapeutic interventions aimed at modulating cell death in human disease.
Apoptosis, or programmed cell death, is a fundamental biological process crucial for development, tissue homeostasis, and disease prevention. Morphologically, apoptosis progresses through distinct phases, culminating in the dramatic cellular transformations characteristic of Phase IIb, or late apoptosis. This phase is defined by two hallmark events: extensive plasma membrane blebbing and the formation of membrane-enclosed apoptotic bodies [3]. These processes represent the cell's final execution stage, where it is systematically dismantled into manageable fragments for efficient clearance by phagocytes, thereby preventing inflammatory responses [13] [14].
Understanding the differences between Phase IIa (mid-apoptosis) and Phase IIb is critical for researchers dissecting cell death mechanisms. While Phase IIa is characterized by events like chromatin condensation and nuclear fragmentation, Phase IIb is where the cell undergoes physical disintegration [3] [4]. The transition to Phase IIb is marked by the irreversible commitment to cell death, driven by the executioner caspases that cleave hundreds of cellular substrates, leading to the collapse of the cytoskeleton and the packaging of cellular contents [15]. This whitepaper provides an in-depth technical analysis of the molecular mechanisms, detection methodologies, and quantitative characteristics of Phase IIb apoptosis, framed within the context of distinguishing its unique morphological features from those of Phase IIa.
Molecular Mechanisms Driving Membrane Blebbing and Apoptotic Body Formation
The Central Role of Actomyosin Contractility
The defining morphological features of late apoptosis are driven by a forceful, caspase-activated actomyosin contraction. The key molecular initiator of this process is the caspase-3-mediated cleavage and constitutive activation of ROCK1 (Rho-associated protein kinase 1) [16] [17]. In healthy cells, ROCK1 activity is tightly regulated. During apoptosis, caspase-3 cleaves ROCK1, removing its inhibitory C-terminal domain and leading to its Rho-independent, persistent activation [16].
Activated ROCK1 phosphorylates several downstream targets to enhance actomyosin-based contractility:
- Phosphorylation of the myosin light chain (MLC), which directly stimulates actin-activated myosin ATPase activity, leading to powerful contraction of the actin cortex [16].
- Phosphorylation of Ezrin, a member of the ERM (Ezrin, Radixin, Moesin) family, which promotes the reassembly of the actin cortex beneath the plasma membrane by recruiting proteins like Eps8 [16].
This hyperactivation of the actomyosin cortex significantly increases intracellular hydrostatic pressure. The plasma membrane, no longer firmly anchored to the contracting cortex, detaches and bulges outward, forming characteristic membrane blebs [17]. The cycle of bleb expansion and retraction facilitates the packaging of cellular debris, ultimately pinching off these blebs to form apoptotic bodies [16].
Disruption of Membrane Asymmetry and Permeability
A critical biochemical event in late apoptosis is the loss of phospholipid asymmetry in the plasma membrane. In viable cells, phosphatidylserine (PS) is restricted to the inner leaflet of the membrane. During apoptosis, PS is externalized to the outer leaflet, creating an "eat-me" signal for phagocytes [16] [14]. While this process begins earlier in apoptosis, it becomes pervasive in Phase IIb, coating the surface of apoptotic bodies and ensuring their recognition and clearance [16].
Interestingly, research indicates that the membranes of apoptotic bodies and blebs formed during Phase IIb are not perfectly sealed. A significant proportion develop limited permeability, allowing the passage of molecules as large as 31 kDa (e.g., DNAse1 and Proteinase K) [17]. This controlled permeabilization enables the release of damage-associated molecular patterns (DAMPs), such as nucleosomal histones and High Mobility Group Box 1 (HMGB1), from the apoptotic bodies before the catastrophic membrane rupture of secondary necrosis [16] [17]. This represents a graded transition between apoptosis and necrosis, rather than a simple binary switch.
Table 1: Key Molecular Regulators of Phase IIb Apoptosis
| Molecule/Protein | Function in Phase IIb | Regulatory Action |
|---|---|---|
| ROCK1 | Master regulator of actomyosin contractility | Activated by caspase-3 cleavage; phosphorylates MLC and Ezrin [16] [17] |
| Actomyosin Cortex | Generates contractile force | Contraction increases hydrostatic pressure, driving bleb formation [17] |
| Phosphatidylserine (PS) | "Eat-me" signal | Externalized to outer membrane leaflet; promotes phagocytic clearance [16] [14] |
| Caspase-3 | Key executioner protease | Cleaves ROCK1 and other substrates like ICAD/CAD [16] [15] |
| Ezrin | Cytoskeleton-membrane linker | When phosphorylated by ROCK, recruits Eps8 for actin cortex reassembly [16] |
Signaling Pathway Diagram
The following diagram illustrates the core signaling cascade that drives membrane blebbing and apoptotic body formation during Phase IIb apoptosis.
Diagram Title: Core Signaling Cascade in Phase IIb Apoptosis
Quantitative Analysis of Apoptotic Bodies and Bleb Dynamics
A critical aspect of distinguishing Phase IIb apoptosis is the quantitative analysis of its physical manifestations. The following table consolidates key quantitative findings from experimental studies on apoptotic bodies and bleb dynamics.
Table 2: Quantitative Characteristics of Apoptotic Bodies and Bleb Dynamics
| Parameter | Quantitative Finding | Experimental Context | Citation |
|---|---|---|---|
| Apoptotic Body Diameter | 680 - 1345 nm (Homogeneous main population) | Isolation from human blood plasma (Neurological disease patients & healthy controls) [18] | |
| DNA Fragment Size | ~150-200 bp (Nucleosomal-sized fragments) | DNA analysis from circulating apoptotic bodies [18] | |
| Proportion of Permeable Apoptotic Bodies | ~33% (PI and/or Proteinase K positive) | In vitro apoptosis in NIH3T3, MCF10a, MEFs, and primary keratinocytes [17] | |
| Bleb Formation Suppression | Significant reduction with ROCK inhibitor (Y-27632) or myosin ATPase inhibitor (Blebbistatin) | Treatment during in vitro apoptosis induction (TNFα/CHX, anti-CD95/CHX, UV) [16] [17] | |
| Key Released DAMP (by SILAC-MS) | Nucleosomal histones (most highly enriched) | Proteomic analysis of proteins released from actomyosin-dependent blebs/apoptotic bodies [17] |
The data highlights the consistent and measurable physical nature of apoptotic bodies. Their size distribution, confirmed by techniques like dynamic light scattering and electron microscopy, falls within a predictable range, allowing for standardization in isolation protocols [18]. The pervasive fragmentation of nuclear DNA into nucleosomal units is a biochemical hallmark that further confirms the apoptotic nature of these vesicles [3] [18]. Furthermore, the significant suppression of bleb and apoptotic body formation by ROCK and myosin inhibitors quantitatively underscores the critical dependence of this process on actomyosin contractility [16] [17].
Experimental Protocols for Detection and Analysis
Isolation and Quantification of Circulating Apoptotic Bodies
The following workflow details a reproducible centrifugation-based method for isolating apoptotic bodies from blood plasma, suitable for clinical and research applications [18].
Diagram Title: Workflow for Isolating Apoptotic Bodies from Blood
Detailed Protocol [18]:
- Sample Collection: Collect blood into anticoagulant-containing tubes (e.g., citrate).
- Plasma Separation: Centrifuge at 1,500 × g for 20 minutes at room temperature to obtain platelet-poor plasma (PPP).
- Pellet Apoptotic Bodies: Centrifuge the PPP at a higher speed of 15,000 × g for 30 minutes to pellet apoptotic bodies and other large microvesicles.
- Resuspension: Carefully resuspend the vesicle pellet in a suitable buffer like phosphate-buffered saline (PBS).
- Analysis:
- Flow Cytometry: The gold standard for quantification. The resuspended vesicles are stained with Annexin V-FITC (binds externalized phosphatidylserine) and Propidium Iodide (PI) (enters vesicles with permeable membranes). Apoptotic bodies are identified as double-positive events (Annexin V+/PI+) and gated based on size using calibrated beads [18].
- Transmission Electron Microscopy (TEM): Used for morphological validation, showing round membrane structures containing electron-dense chromatin [18].
- Dynamic Light Scattering (DLS): Provides a rapid size distribution profile of the isolated vesicles [18].
Functional Inhibition of Blebbing
To experimentally confirm the role of actomyosin contractility in Phase IIb morphology, researchers can use specific pharmacological inhibitors [16] [17].
- ROCK Inhibition: Treat cells with Y-27632 (e.g., 10-30 µM), a potent and selective ROCK inhibitor, added to the culture medium concurrently with or shortly after the apoptotic stimulus.
- Myosin ATPase Inhibition: Treat cells with Blebbistatin (e.g., 50 µM), a selective inhibitor of myosin II ATPase activity.
Expected Outcome: Inhibition of ROCK or myosin ATPase does not prevent the initiation of apoptosis (caspase activation proceeds normally) but significantly reduces membrane blebbing and apoptotic body formation. This results in larger, singularly condensed cells and impedes the release of DAMPs like HMGB1 and the physical disruption of the nuclear envelope, providing functional evidence for the mechanism [16] [17].
The Scientist's Toolkit: Essential Reagents for Phase IIb Research
Table 3: Key Research Reagents for Studying Late Apoptosis
| Reagent / Assay | Function / Target | Application in Phase IIb Analysis |
|---|---|---|
| Y-27632 | ROCK inhibitor | Functionally inhibits actomyosin contractility, suppressing bleb and apoptotic body formation [16] [17] |
| Blebbistatin | Myosin II ATPase inhibitor | Confirms myosin's essential role in contractility driving membrane blebbing [17] |
| Annexin V (FITC) | Binds externalized Phosphatidylserine | Labels "eat-me" signal on apoptotic cells and bodies; used in flow cytometry and microscopy [18] [14] |
| Propidium Iodide (PI) | DNA intercalating dye (membrane impermeant) | Stains nucleic acids in permeable apoptotic bodies; distinguishes late apoptosis [17] [14] |
| Anti-Cleaved Caspase-3 Antibody | Detects activated executioner caspase | Confirms apoptosis execution via immunohistochemistry or western blot [14] [4] |
| TUNEL Assay | Labels 3'-OH ends of fragmented DNA | Detects DNA fragmentation, a hallmark of mid-late apoptosis [3] [14] |
| Anti-HMGB1 / Anti-Histone H3 Antibody | Detects specific DAMPs | Used to monitor DAMP release and localization via western blot or IF [16] [17] |
Distinguishing Phase IIa and Phase IIb Apoptosis: A Morphological and Biochemical Comparison
For researchers focused on the morphological differences in apoptotic phases, the following table provides a clear, side-by-side comparison of key characteristics.
Table 4: Comparative Analysis of Phase IIa and Phase IIb Apoptosis
| Feature | Phase IIa (Mid Apoptosis) | Phase IIb (Late Apoptosis) |
|---|---|---|
| Nuclear Morphology | Chromatin condensation (pyknosis), nuclear fragmentation (karyorrhexis) [3] | Completion of nuclear breakdown; nuclear debris packaged into apoptotic bodies [3] |
| Cell Membrane & Cytoskeleton | Cell shrinkage, breakdown of cytoskeleton, membrane invaginations [3] | Extensive membrane blebbing, formation of apoptotic bodies [3] [14] |
| Biochemical Markers | Caspase-3 activation, PARP cleavage, DNA fragmentation begins [15] [4] | PS externalization becomes pervasive, release of DAMPs (HMGB1, histones) [16] [17] |
| Membrane Integrity | Largely intact, excludes dyes like PI [14] | Limited permeability in blebs/bodies; allows passage of molecules ≤31 kDa [17] |
| Primary Molecular Driver | Executioner caspase activation (Casp-3/7) and substrate cleavage [15] | Caspase-3-mediated ROCK1 cleavage, leading to actomyosin hyper-contraction [16] |
| Functional Consequence | Commitment to irreversible cell dismantling | Packaging of cellular material for immunologically silent phagocytic clearance |
Phase IIb apoptosis represents the terminal and morphologically distinct stage of programmed cell death, characterized by the ROCK1-dependent forces of actomyosin contractility that drive membrane blebbing and apoptotic body formation. The experimental frameworks and quantitative data outlined in this whitepaper provide researchers with the tools to accurately identify and study this phase. A clear understanding of the mechanisms distinguishing Phase IIb from Phase IIa—particularly the shift from nuclear degradation to coordinated cellular fragmentation—is paramount for research in fields ranging from cancer therapy, where inducing apoptosis is a goal, to neurodegenerative diseases, where preventing excessive cell death is the objective. The controlled permeability of apoptotic bodies and the subsequent release of immunomodulatory DAMPs add a layer of complexity to the biological impact of late apoptosis, offering new avenues for therapeutic intervention.
Within the broader investigation of apoptotic morphology, the differentiation between Phase IIa and Phase IIb represents a critical juncture in understanding the sequence and implications of programmed cell death. Apoptosis, a form of programmed cell death, is characterized by a sequence of distinct morphological stages [3] [19]. Phase II, the execution phase, is subdivided into Phase IIa (cellular condensation) and Phase IIb (cellular fragmentation) [3] [4]. This in-depth technical guide provides a detailed, side-by-side analysis of these two subphases, focusing on their unique morphological hallmarks, molecular triggers, and detection methodologies. A precise understanding of this morphological progression is essential for researchers and drug development professionals studying cellular responses in disease models, toxicology, and therapeutic agent development [3] [2].
Core Morphological Differences: A Comparative Table
The progression from Phase IIa to Phase IIb marks the transition from initial, potentially reversible, condensation to irreversible cellular fragmentation. The table below summarizes the key morphological, temporal, and detection-related characteristics of each phase.
Table 1: Comparative Analysis of Apoptotic Phase IIa and Phase IIb Features
| Feature | Phase IIa (Cellular Condensation) | Phase IIb (Cellular Fragmentation) |
|---|---|---|
| Core Process | Concentration and compaction of cellular contents [3] | Dismantling of the cell into discrete, membrane-bound bodies [3] [19] |
| Nuclear Morphology | - Chromatin margination (aggregation at the nuclear periphery) [3] [20]- Pyknosis (nuclear condensation) [3]- Nuclear envelope remains largely intact [3] | - Nuclear fragmentation (karyorrhexis) [3] [19]- Breakdown of the nuclear envelope [3] |
| Cytoplasmic & Membrane Morphology | - Cell shrinkage and dehydration [3] [4]- Increased eosinophilia (cytoplasmic staining) [3] [4]- Loss of specialized surface structures (e.g., microvilli) [3] [21]- Dilatation of the endoplasmic reticulum [19] | - Membrane blebbing and protrusion [3] [22]- Formation of apoptotic bodies via budding [3] [19]- Cytoskeleton degradation [3] [4] |
| Key Molecular Triggers & Markers | - Activation of initiator caspases (e.g., caspase-8, -9) [23] [2]- Caspase-mediated cleavage of structural proteins [23] | - Activation of executioner caspases (e.g., caspase-3, -7) [23] [4] [2]- Cleavage of specific substrates like PARP and ROCK1 [23] [4]- Activation of DNAse (CAD) leading to DNA fragmentation [23] [19] |
| DNA Fragmentation Pattern | Initial activation of endonucleases; DNA cleavage begins but may not yet form a distinct ladder [3] | Internucleosomal DNA cleavage producing a characteristic "ladder" on gel electrophoresis (180-200 bp repeats) [20] [19] [24] |
| Primary Detection Methods | - Transmission Electron Microscopy (ultrastructural details) [3]- Fluorescence microscopy (chromatin condensation with Hoechst/DAPI) [3] [21] | - Light microscopy (apoptotic bodies with HE/Giemsa stain) [3]- DNA gel electrophoresis (DNA ladder) [3] [19]- TUNEL assay (labeling DNA strand breaks) [3] [20] |
| Typical Duration | A relatively brief stage, transitioning to Phase IIb [20] | The final morphological stage before phagocytosis; apoptotic bodies are rapidly cleared [20] [19] |
Experimental Protocols for Phase Differentiation
Accurately distinguishing between Phase IIa and IIb requires a combination of techniques that assess morphological, biochemical, and molecular changes.
Morphological Analysis via Fluorescence Microscopy
This protocol is optimal for identifying nuclear changes characteristic of Phase IIa and the formation of apoptotic bodies in Phase IIb [3] [21].
- Cell Preparation and Fixation: Culture cells on glass coverslips. For apoptosis induction, treat with a relevant agent (e.g., 5 μmol/L doxorubicin) [22]. At designated time points, fix cells with 3.7% paraformaldehyde in PBS for 15-20 minutes at room temperature [21].
- Permeabilization and Staining: Permeabilize fixed cells with 0.1-0.5% Triton X-100 in PBS for 5 minutes. Rinse with PBS and incubate with a DNA-binding fluorochrome such as Hoechst 33258 (1 μg/mL) for 30 minutes at 37°C [21].
- Visualization and Analysis: Mount coverslips and observe under a UV-light fluorescence microscope. Phase IIa cells will show intensely stained, condensed, and marginalized chromatin. Phase IIb cells will exhibit nuclear fragmentation into multiple, smaller, bright bodies [3] [19].
Biochemical Confirmation via DNA Gel Electrophoresis
This method confirms the biochemical hallmark of late Phase IIa/Phase IIb: internucleosomal DNA cleavage [3] [19].
- DNA Extraction: Harvest both adherent and detached cells. Lyse cells using a suitable buffer (e.g., containing SDS and Proteinase K) to digest proteins. Extract DNA using phenol-chloroform and precipitate with ethanol [19].
- Gel Electrophoresis: Re-suspend the DNA pellet and load onto a standard 1.5-2% agarose gel. Include a DNA molecular weight marker. Run the gel at a constant voltage (e.g., 5 V/cm) until sufficient separation is achieved.
- Visualization and Interpretation: Stain the gel with DNA-binding dye (e.g., ethidium bromide) and visualize under UV light. A "smear" of DNA suggests nonspecific degradation (necrosis). A characteristic "ladder" pattern of DNA fragments at multiples of 180-200 base pairs is a key indicator of the systematic DNA cleavage occurring in Phase IIb [3] [19].
Ultrastructural Analysis via Transmission Electron Microscopy (TEM)
TEM remains the gold standard for definitive morphological identification of all apoptotic phases, providing unmatched ultrastructural detail [3] [20].
- Sample Preparation: Pellet cells and fix with a primary fixative (e.g., 2.5% glutaraldehyde in cacodylate buffer), followed by a secondary fixative (e.g., 1% osmium tetroxide). Dehydrate samples through a graded series of ethanol or acetone.
- Embedding and Sectioning: Infiltrate and embed cells in a resin (e.g., Epon or Spurr's). Polymerize the resin and cut ultra-thin sections (60-90 nm) using an ultramicrotome.
- Staining and Imaging: Stain sections with heavy metals (e.g., uranyl acetate and lead citrate) to enhance contrast. Examine under TEM. Phase IIa is identified by condensed cytoplasm, dilated organelles, and chromatin margination. Phase IIb is confirmed by the presence of membrane-bound apoptotic bodies containing nuclear debris and intact organelles [3].
Signaling Pathways and Morphological Execution
The distinct morphological outcomes of Phase IIa and IIb are directly executed by the caspase protease cascade, which is activated by upstream intrinsic or extrinsic apoptotic pathways.
Diagram 1: Caspase Cascade Driving Morphological Phases.
The Scientist's Toolkit: Essential Research Reagents
Selecting appropriate reagents is fundamental for accurately detecting and characterizing the specific phases of apoptosis.
Table 2: Key Reagent Solutions for Apoptosis Phase Analysis
| Reagent | Function & Application | Phase Specificity |
|---|---|---|
| Hoechst 33342 / DAPI | Cell-permeable DNA dyes for fluorescence microscopy. Visualize chromatin condensation and nuclear fragmentation [3] [21]. | IIa & IIb |
| Anti-Cleaved Caspase-3 Antibody | Detects the activated form of the key executioner caspase via Western blot or immunofluorescence, confirming commitment to apoptosis [4]. | IIa/IIb Transition |
| Anti-Cleaved PARP Antibody | Western blot marker for caspase-3 activity. PARP cleavage is a hallmark event in apoptotic execution [4]. | IIb |
| TUNEL Assay Kit | Labels DNA strand breaks (3'-OH ends) in situ. Useful for detecting cells in late Phase IIa/Phase IIb, but requires careful optimization to avoid false positives [3] [20]. | Late IIa & IIb |
| Annexin V-FITC | Binds to phosphatidylserine (PS) exposed on the outer leaflet of the plasma membrane, an early event often preceding major morphological changes [4]. | Precedes IIa |
| Propidium Iodide (PI) | DNA dye impermeant to live cells. Used with Annexin V to exclude necrotic cells or late-stage apoptotic bodies with compromised membranes [21]. | Late IIb / Necrosis |
Discussion and Research Implications
The precise demarcation between Phase IIa and IIb is more than a morphological exercise; it has profound implications for experimental interpretation and therapeutic development. Phase IIa represents a critical window where the cell is committed to death but remains structurally intact, whereas Phase IIb involves the packaging of cellular contents for immunologically silent clearance [19]. Misidentification of these phases, for example, by relying solely on the TUNEL assay without morphological validation, can lead to false positives and misinterpretation of the primary cell death mechanism, particularly in tissues with mixed pathologies [20] [24].
From a therapeutic standpoint, molecules that modulate the transition into or through these phases are key targets. For instance, pro-apoptotic cancer therapies aim to robustly initiate this cascade and drive cells through Phase IIa into Phase IIb [2]. Conversely, in neurodegenerative diseases, inhibiting the initiation of Phase IIa could be a valid strategy to preserve vulnerable cells [4] [2]. Therefore, a rigorous, multi-method approach to phase identification, as outlined in this guide, is indispensable for advancing both fundamental research and drug development.
The meticulous orchestration of apoptosis ensures the controlled elimination of cells without provoking an inflammatory response. This process is characterized by a precise biochemical cascade, primarily driven by caspases, which directly manifests as distinct morphological stages. This technical guide delineates the mechanistic link between caspase activation and the defining ultrastructural changes observed during the mid (Phase IIa) and late (Phase IIb) stages of apoptosis. Framed within research on the morphological differences between Phases IIa and IIb, we detail the experimental methodologies and reagent tools essential for quantifying and visualizing this biochemical-morphological coupling, providing a foundational resource for researchers and drug development professionals.
Apoptosis is functionally divided into several phases based on key morphological characteristics. In Phase IIa, cells undergo nuclear changes, including chromatin condensation and margination. In Phase IIb, the cell dismantles into apoptotic bodies [3]. The execution of this orderly dismantling is managed by a family of aspartic acid-specific proteases known as caspases. These enzymes are synthesized as inactive zymogens and become activated in cascades that amplify the initial death signal [25]. Once active, they oversee the controlled demolition of the cell via the restricted proteolysis of hundreds of cellular substrates [25]. Understanding the link between specific caspase activation events and the resultant morphological changes in Phases IIa and IIb is critical for fundamental cell biology research and for developing therapies that modulate cell death.
The Caspase Activation Cascades
Caspase activation proceeds through several well-characterized pathways, culminating in a convergent execution phase. The major pathways include the extrinsic (death receptor) pathway, the intrinsic (mitochondrial) pathway, and the granzyme B pathway [26]. The order of caspase activation within the intrinsic pathway, for instance, has been rigorously refined. Upon mitochondrial outer membrane permeabilization, cytochrome c release leads to the formation of the Apaf-1/caspase-9 apoptosome. Caspase-9, activated within this complex, directly cleaves and activates the effector caspases-3 and -7 [26]. Caspase-3 then propagates the cascade by processing other caspases, such as caspase-2 and -6, which in turn can activate caspase-8 [26]. Recent studies have highlighted a degree of redundancy between caspases-3 and -7 in propagating this cascade, though they are not fully redundant in their substrate profiles [26].
The following diagram illustrates the core caspase activation cascade initiated by the intrinsic apoptotic pathway:
Linking Biochemistry to Morphology: From Caspase-3/7 to Cellular Demolition
The activation of effector caspases-3 and -7 is the pivotal biochemical event that bridges the initial signaling pathways to the tangible morphological changes of the mid and late stages. These executioners achieve cellular demolition by cleaving a specific repertoire of structural and functional proteins.
Key Substrate Cleavage and Morphological Consequences:
- Nuclear Membrane and Chromatin Structure: Caspase-mediated cleavage of proteins like Lamin A/C leads to the disintegration of the nuclear lamina, facilitating nuclear fragmentation.
- DNA Fragmentation: Caspase-3 cleaves the inhibitor of caspase-activated DNase (ICAD), releasing active CAD. CAD then translocates to the nucleus and cleaves DNA at internucleosomal sites, producing the characteristic DNA ladder and contributing to chromatin condensation [3].
- Cytoskeletal Disassembly: Cleavage of cytoskeletal components such as actin, fodrin, and gelsolin disrupts the cellular architecture, leading to loss of adhesion, cell shrinkage, and membrane blebbing [3].
- Cell Detachment and Apoptotic Body Formation: The breakdown of cell-matrix and cell-cell adhesion proteins facilitates the separation of the apoptotic cell from its neighbors. Coupled with membrane blebbing, this leads to the formation of apoptotic bodies during Phase IIb.
The table below summarizes the quantitative and morphological markers that differentiate Phase IIa from Phase IIb.
Table 1: Morphological and Biochemical Hallmarks of Phase IIa vs. Phase IIb Apoptosis
| Feature | Phase IIa (Mid-Stage) | Phase IIb (Late-Stage) |
|---|---|---|
| Nuclear Morphology | Chromatin condensation (pyknosis) and margination to the nuclear periphery [3]. | Nuclear fragmentation (karyorrhexis) [3]. |
| Cellular Morphology | Cell shrinkage, cytoplasm condensation, loss of specialized surface structures (e.g., microvilli) [3]. | Formation of membrane-bound apoptotic bodies containing nuclear debris and organelles [3]. |
| Biochemical Markers | Activation of initiator and effector caspases (e.g., caspase-9, -3, -7); DNA cleavage begins [25] [26]. | Massive DNA fragmentation into oligonucleosomal fragments (180-200 bp); widespread substrate cleavage [3]. |
| Primary Detection Methods | Electron microscopy (ultrastructural details); caspase activity assays; mitochondrial membrane potential dyes [3]. | Light microscopy (apoptotic bodies); DNA gel electrophoresis (DNA ladder); TUNEL assay [3]. |
Experimental Protocols for Detection and Quantification
Selecting the appropriate detection method is purpose-dependent. The following protocols are critical for investigating the caspase-morphology relationship.
Protocol: Caspase Activity Measurement Using FRET-Based Probes
This protocol allows for real-time, live-cell quantification of caspase-3/7 activity, enabling direct correlation with morphological changes.
- Principle: Cells express a genetically encoded FRET probe consisting of ECFP (donor) and EYFP (acceptor) linked by a DEVD sequence, a caspase-3/7 cleavage site. Upon caspase activation, cleavage of the linker separates the fluorophores, resulting in a loss of FRET, which is measured as an increase in the donor-to-acceptor emission ratio [27].
- Workflow:
- Cell Line Preparation: Generate stable cell lines expressing the FRET-based caspase sensor (e.g., pSCAT1 or similar). Select clones with homogeneous expression [27].
- Treatment & Imaging: Plate cells and treat with apoptogenic agents. Perform time-lapse imaging using a fluorescence microscope equipped with filters for ECFP and EYFP and an environmental chamber (37°C, 5% CO₂) [27].
- Image Analysis: For each cell and time point, calculate the ratio of ECFP to EYFP fluorescence intensity. An increase in this ratio indicates caspase-3/7 activation. This can be quantified at the single-cell level to track the kinetics of activation [27].
- Data Interpretation: The time point of caspase activation can be precisely determined and correlated with concurrent morphological changes, such as cell shrinkage or membrane blebbing, observed in the phase-contrast channel.
Protocol: Discriminating Apoptosis from Necrosis in Real-Time
This advanced protocol combines a caspase FRET sensor with a mitochondrial marker to unambiguously distinguish apoptosis from primary necrosis.
- Principle: Cells stably express both the soluble FRET-based caspase sensor and a non-soluble fluorescent protein targeted to mitochondria (e.g., Mito-DsRed). Apoptotic cells show a FRET ratio change while retaining mitochondrial fluorescence. Necrotic cells lose the soluble FRET probe due to membrane rupture without a preceding FRET ratio change, but retain the mitochondrial marker [27].
- Workflow:
- Cell Line Development: Create a stable cell line expressing both the caspase FRET probe (ECFP-DEVD-EYFP) and Mito-DsRed [27].
- Real-Time Imaging: Treat cells and perform time-lapse imaging using wide-field or confocal microscopy, capturing ECFP, EYFP, and DsRed channels [27].
- Cell Fate Classification: Cells are classified as:
- Live: Intact FRET probe (no ratio change) and retained Mito-DsRed.
- Apoptotic: FRET ratio change with retained Mito-DsRed.
- Necrotic: Loss of ECFP/EYFP fluorescence without ratio change, with retained Mito-DsRed [27].
The workflow for this multi-parametric assay is outlined below:
Protocol: Quantitative Phase Imaging (QPI) for Label-Free Morphological Analysis
QPI is a powerful label-free method to detect subtle changes in cell mass and morphology, which can be correlated with biochemical assays.
- Principle: QPI measures the optical path length delay through a cell, which is proportional to its dry mass and density. This allows for the continuous monitoring of morphological parameters like cell volume, density, and membrane dynamics without labels [6].
- Workflow:
- Cell Culture & Treatment: Plate cells in a suitable chamber and treat with death inducers.
- Time-Lapse QPI: Acquire time-lapse images using a QPI microscope (e.g., holographic microscope) under controlled conditions.
- Parameter Extraction: Extract quantitative features such as:
- Correlation: Use machine learning to classify cell death subroutines based on these dynamical features and correlate with endpoint biochemical validation (e.g., caspase-3/7 staining) [6].
The Scientist's Toolkit: Essential Reagents and Materials
Table 2: Key Research Reagent Solutions for Apoptosis Detection
| Reagent / Assay | Function / Principle | Primary Application |
|---|---|---|
| FRET Caspase Probe (e.g., ECFP-DEVD-EYFP) | Real-time detection of caspase-3/7 activity via fluorescence resonance energy transfer (FRET) loss upon cleavage [27]. | Live-cell imaging of caspase activation kinetics. |
| Mito-DsRed / MitoTracker | Fluorescent labeling of mitochondria; serves as a marker for cellular integrity and organelle retention [27]. | Discriminating apoptosis from necrosis; assessing mitochondrial integrity. |
| Caspase Inhibitors (e.g., z-VAD-FMK, M-791) | Pan-caspase or specific caspase inhibitors (e.g., M-791 for caspase-3) to block apoptotic signaling [27] [26]. | Mechanistic studies to confirm caspase-dependent death. |
| CellEvent Caspase-3/7 Green | Non-fluescent substrate that becomes fluorescent upon cleavage by activated caspase-3/7. | Fluorescent endpoint or time-lapse detection of caspase activity. |
| Annexin V / Propidium Iodide (PI) | Annexin V binds phosphatidylserine (externalized in early apoptosis); PI stains DNA in cells with compromised membranes (necrosis/late apoptosis) [6]. | Flow cytometry to distinguish early apoptotic (Annexin V+/PI-) from late apoptotic/necrotic (Annexin V+/PI+) cells. |
| TUNEL Assay Kit | Labels 3'-OH ends of fragmented DNA using terminal deoxynucleotidyl transferase (TdT) [3]. | Histochemical or cytochemical detection of late-stage apoptotic cells. |
| Quantitative Phase Microscope | Measures optical path length differences to calculate cell mass, density, and morphology without labels [6]. | Label-free, dynamic tracking of morphological changes during cell death. |
The journey from a viable cell to a neatly packaged apoptotic body is a direct consequence of a meticulously executed biochemical script written by caspases. The activation of caspase-3 and -7 serves as the critical point of no return, triggering a series of substrate cleavage events that systematically deconstruct the cell. The distinct morphological signatures of Phase IIa (nuclear condensation) and Phase IIb (cellular fragmentation) are the visible outcomes of this underlying protease activity. The experimental approaches detailed herein—from real-time caspase sensing to label-free morphological analysis—provide the modern researcher with a powerful toolkit to dissect this relationship with high precision. As research progresses, particularly in the context of differentiating between various cell death subroutines, understanding the core caspase-morphology axis remains fundamental for advancing therapeutic strategies in cancer, neurodegeneration, and beyond.
Practical Techniques for Discriminating Apoptotic Phases IIa and IIb in the Lab
Programmed cell death, or apoptosis, is a genetically regulated process essential for maintaining tissue homeostasis, organ development, and eliminating damaged or harmful cells [28] [29]. This physiological process occurs in a controlled and organized manner, allowing cells to die without triggering inflammation or causing harm to surrounding tissues [4]. Apoptosis proceeds through distinct morphological phases characterized by specific cellular and subcellular changes, with Phases IIa and IIb representing critical transitional stages in the apoptotic cascade [3]. Accurate identification and differentiation of these phases are crucial for understanding fundamental biological processes and disease mechanisms, particularly in cancer research and therapeutic development [28] [4].
The visualization and precise characterization of morphological transitions between apoptosis Phase IIa (middle phase) and Phase IIb (late phase) represent a critical competency in cell biology research. Phase IIa is primarily marked by nuclear alterations, including chromatin condensation and margination, while Phase IIb involves cytoplasmic changes and the formation of apoptotic bodies [3] [4]. Distinguishing between these phases requires expertise in multiple microscopy techniques, each offering unique advantages for observing specific morphological features. This technical guide provides researchers with comprehensive methodologies for using light and electron microscopy to identify and document these transitions, supported by optimized protocols, reagent specifications, and analytical frameworks tailored for apoptosis research in the context of broader morphological studies.
Morphological Characteristics of Apoptosis Phase IIa versus Phase IIb
Apoptotic progression involves highly conserved morphological alterations that manifest differently across phases. The transitions between Phase IIa and IIb represent a shift from nuclear-specific changes to comprehensive cellular disintegration.
Phase IIa: Nuclear Condensation and Fragmentation
During Phase IIa (middle phase), the most prominent morphological changes occur within the nucleus. Chromatin undergoes progressive condensation and aggregates into dense masses adjacent to the nuclear envelope, a process known as pyknosis [3] [28]. The chromatin subsequently becomes marginalized, assembling on the inner nuclear membrane before the nucleus fragments into discrete pieces [3]. At this stage, the cytoplasmic architecture remains largely intact, though initial signs of cytoskeletal reorganization may begin to appear.
Phase IIb: Cytoplasmic Disassembly and Apoptotic Body Formation
Phase IIb (late phase) is characterized by the degradation of the cytoskeleton, which causes invaginations in the cell membrane and the formation of membrane-bound vesicles containing nuclear debris, cytoplasmic components, and organelle fragments [3] [4]. These vesicles, known as apoptotic bodies, are typically 1-5 μm in diameter and represent the final morphological hallmark of apoptosis before phagocytosis by neighboring cells [30]. The formation of apoptotic bodies ensures the safe packaging of cellular contents for efficient clearance without inducing inflammatory responses [3] [28].
Table 1: Comparative Morphological Features in Apoptosis Phase IIa versus Phase IIb
| Cellular Component | Phase IIa Features | Phase IIb Features |
|---|---|---|
| Nucleus | Chromatin condensation (pyknosis); chromatin margination; nuclear fragmentation [3] [4] | Nuclear fragments packaged into apoptotic bodies [3] |
| Cytoplasm/Cytoskeleton | Generally intact structure; initial signs of cytoskeletal reorganization [3] | Cytoskeleton degradation; cytoplasmic contraction; dilation of endoplasmic reticulum [3] [28] |
| Cell Membrane | Intact with decreased microvilli; membrane blebbing begins [3] [4] | Extensive blebbing; sprouting and displacement; formation of apoptotic bodies [3] [30] |
| Key Distinguishing Marker | Nuclear changes dominate [3] | Apoptotic body formation [3] [28] |
Recent research has revealed additional complexity in apoptotic body formation. A novel mechanism termed "FOotprint Of Death" (FOOD) describes how apoptotic cells can generate actin-rich membranous footprints during cell retraction that subsequently vesicularize into large apoptotic cell-derived extracellular vesicles (F-ApoEVs) approximately 2 μm in diameter [30]. This process, regulated by the protein kinase ROCK1, represents an alternative pathway for generating apoptotic bodies that mark the site of cell death and facilitate communication with phagocytic cells.
Light Microscopy Techniques for Apoptosis Visualization
Light microscopy offers versatile, accessible approaches for identifying apoptotic cells and distinguishing between morphological phases. Both transmitted light and fluorescence modalities provide valuable insights into apoptotic progression.
Transmitted Light Modalities
Transmitted light techniques such as Differential Interference Contrast (DIC) and Phase Contrast (PC) microscopy enable label-free, real-time observation of apoptotic morphological changes [31] [32]. These methods are particularly valuable for long-term live-cell imaging as they minimize phototoxicity and avoid potential artifacts introduced by fluorescent stains [32]. In Phase IIa, DIC and PC can reveal cell shrinkage, nuclear condensation, and early membrane blebbing. During Phase IIb, these techniques clearly show the formation of apoptotic bodies and the continued contraction of the cellular structure [31].
The major advantage of transmitted light microscopy is its ability to monitor apoptotic progression in living cells without fixation or staining, allowing researchers to capture dynamic transitions between phases [32]. However, these techniques have limitations in specifically identifying the biochemical events underlying the morphological changes and may miss early apoptotic events before obvious structural alterations occur.
Fluorescence Microscopy Approaches
Fluorescence microscopy provides greater specificity for detecting biochemical and molecular events associated with apoptosis through targeted fluorescent probes and labels [3] [32]. Several fluorescence-based assays are particularly valuable for distinguishing apoptotic phases:
- Nuclear stains (Hoechst 33342, DAPI, propidium iodide): These DNA-binding dyes reveal chromatin condensation and nuclear fragmentation characteristics of Phase IIa. Hoechst 33342 is cell-permeable and can be used in live cells, while propidium iodide is membrane-impermeable and typically marks late-stage apoptotic or necrotic cells [3] [32].
- Caspase activity reporters: Fluorescently tagged caspase-3/7 substrates (e.g., NucView 488) become activated during early apoptosis and remain active through Phase IIa and IIb, serving as consistent markers of apoptotic progression [32].
- Membrane asymmetry detection: Annexin V conjugates bind to phosphatidylserine (PS), which translocates from the inner to outer leaflet of the plasma membrane during apoptosis. This exposure typically becomes detectable in Phase IIa and continues through Phase IIb [4] [32].
- Mitochondrial membrane potential sensors: Fluorescent lipophilic cationic dyes (e.g., JC-1, TMRM) detect the decrease in mitochondrial membrane potential that occurs early in apoptosis, preceding most morphological changes [3].
Table 2: Advanced Light Microscopy Techniques for Apoptosis Imaging
| Technique | Principle | Application in Apoptosis Detection | Advantages | Limitations |
|---|---|---|---|---|
| Full-Field Optical Coherence Tomography (FF-OCT) | Interferometric imaging using broadband light source; detects scattered light signals [22] | Label-free visualization of 3D morphological changes: cell shrinkage, membrane blebbing, filopodia reorganization [22] | Non-invasive; no staining required; sub-micrometer resolution; real-time monitoring [22] | Limited molecular specificity; requires specialized equipment [22] |
| Quantitative Phase Microscopy (QPM) | Measures phase shifts in transmitted light; maps density and refractive index variations [22] | Distinguishes subtle structural differences between apoptotic stages by quantitative phase analysis [22] | Label-free; quantitative data on biomass and density changes [22] | Complex processing; may miss fine details with low RI contrast [22] |
| Confocal Laser Scanning Microscopy | Point-by-point illumination with spatial pinhole to reject out-of-focus light [30] | High-resolution 3D imaging of apoptotic morphology and protein localization [30] | Optical sectioning; improved resolution; 3D reconstruction [30] | Photobleaching; phototoxicity; slower imaging [22] |
| Lattice Light Sheet Microscopy (LLSM) | Thin sheet illumination only of the focal plane; minimal phot exposure [30] | Ultra-high-resolution 4D imaging of dynamic apoptotic processes like FOOD formation [30] | Minimal phototoxicity; fast volumetric imaging; high resolution [30] | Complex setup; limited availability [30] |
Electron Microscopy for Ultrastructural Analysis
Electron microscopy provides unparalleled resolution for observing the ultrastructural details of apoptotic cells, making it an indispensable tool for definitive phase identification.
Transmission Electron Microscopy (TEM) Protocols
Transmission electron microscopy reveals the intricate subcellular changes that occur during apoptosis with nanometer-scale resolution [3]. Sample preparation for TEM analysis of apoptotic cells follows a standardized protocol:
- Fixation: Primary fixation with 2.5% glutaraldehyde in 0.1M cacodylate buffer (pH 7.4) for 2 hours at 4°C, followed by secondary fixation with 1% osmium tetroxide for 1 hour [3].
- Dehydration: Sequential dehydration through graded ethanol series (30%, 50%, 70%, 90%, 100%) with 15-minute incubations at each concentration.
- Embedding: Infiltration with epoxy resin (e.g., Epon, Araldite) and polymerization at 60°C for 48 hours.
- Sectioning: Ultra-thin sectioning (60-90 nm thickness) using an ultramicrotome and collection on copper grids.
- Staining: Post-staining with uranyl acetate and lead citrate to enhance contrast [3].
When analyzing apoptotic cells, TEM reveals distinctive ultrastructural features at different phases. In Phase IIa, cells show highly condensed chromatin masses marginalized against the nuclear envelope, with relatively preserved cytoplasmic organelles [3]. The nuclear envelope may appear convoluted or fragmented. During Phase IIb, TEM clearly shows the formation of apoptotic bodies containing nuclear fragments and intact organelles surrounded by plasma membrane [3]. The cytoplasm often appears more electron-dense due to compaction of cellular contents.
Scanning Electron Microscopy (SEM) for Surface Topography
Scanning electron microscopy provides detailed three-dimensional information about surface morphological changes during apoptosis [30]. Sample preparation for SEM includes:
- Fixation: Primary fixation with 2.5% glutaraldehyde in 0.1M cacodylate buffer (pH 7.4) for 2 hours at 4°C.
- Post-fixation: Secondary fixation with 1% osmium tetroxide for 1 hour.
- Dehydration: Sequential ethanol dehydration as described for TEM.
- Critical Point Drying: To preserve delicate surface structures.
- Sputter Coating: Application of thin conductive metal (gold or platinum) layer.
SEM imaging captures dramatic surface changes during apoptosis, including membrane blebbing, cell shrinkage, and the formation of apoptotic bodies [30]. In Phase IIa, small surface blebs become apparent, while Phase IIb shows extensive blebbing and the pinching off of apoptotic bodies. Recent SEM studies have revealed the intricate architecture of the "FOotprint Of Death" (FOOD) structures left behind by retracting apoptotic cells, showing thin membrane sheets that subsequently round into large extracellular vesicles [30].
Integrated Experimental Workflows
Combining multiple microscopy techniques in complementary workflows provides the most comprehensive analysis of apoptotic morphological transitions. The following diagram illustrates an integrated experimental approach for distinguishing between apoptosis Phase IIa and IIb:
Correlative Light and Electron Microscopy (CLEM)
For maximum information yield, correlative light and electron microscopy (CLEM) approaches can be implemented. This involves:
- Live-cell imaging to document dynamic apoptotic processes and identify regions of interest [32].
- Targeted fixation at specific timepoints corresponding to Phase IIa or IIb transitions based on morphological criteria.
- Processing for EM with careful tracking of the regions previously imaged by light microscopy.
- High-resolution EM imaging of the exact same cells previously analyzed by light microscopy.
CLEM provides the unique advantage of linking dynamic, temporal information from live-cell imaging with high-resolution structural data from electron microscopy, enabling definitive phase identification and revealing novel ultrastructural features associated with specific apoptotic stages [30].
The Scientist's Toolkit: Essential Research Reagents and Materials
Table 3: Research Reagent Solutions for Apoptosis Microscopy
| Reagent/Category | Specific Examples | Function/Application | Phase Relevance |
|---|---|---|---|
| Apoptosis Inducers | Staurosporine, Doxorubicin, ABT-737, Etoposide, UV irradiation [22] [32] | Experimentally induce apoptosis through intrinsic/extrinsic pathways | Both IIa and IIb |
| Nuclear Stains | Hoechst 33342, DAPI, Propidium Iodide [3] [32] | Visualize chromatin condensation and nuclear fragmentation | Primarily Phase IIa |
| Caspase Reporters | NucView 488, Fluorogenic caspase-3/7 substrates [33] [32] | Detect caspase activation; early apoptosis marker | Both IIa and IIb |
| Membrane Asymmetry Probes | Annexin V conjugates, BioTracker Apo-15 [4] [32] | Detect phosphatidylserine externalization | Late Phase IIa through IIb |
| Mitochondrial Dyes | JC-1, TMRM, MitoTracker [3] | Monitor mitochondrial membrane potential loss | Early apoptosis before IIa |
| EM Fixatives | Glutaraldehyde, Osmium tetroxide, Uranyl acetate [3] | Preserve ultrastructure for electron microscopy | Both IIa and IIb |
| Antibody Cocktails | Pro/p17-caspase-3, Cleaved PARP1, Actin [4] | Multiplex detection of apoptosis markers in Western blot | Both IIa and IIb |
Recent innovations in research reagents include novel fluorescent reporters such as the caspase-3-sensitive GFP variant developed by Kim et al., which incorporates the DEVDG cleavage motif into GFP structure, creating a fluorescence switch-off mechanism at apoptosis initiation [33]. This reporter enables highly sensitive real-time monitoring of apoptosis in living cells without requiring additional staining steps.
Mastering the application of light and electron microscopy techniques provides researchers with powerful capabilities for distinguishing between the subtle morphological transitions that characterize apoptosis Phase IIa and IIb. Light microscopy offers dynamic, accessible approaches for initial identification and temporal tracking of apoptotic progression, while electron microscopy delivers definitive ultrastructural analysis for conclusive phase determination. The integrated workflows and specialized reagents detailed in this guide enable precise characterization of apoptotic morphological transitions, supporting advanced research in cell death mechanisms, disease pathology, and therapeutic development. As microscopy technologies continue to evolve, particularly in label-free imaging and correlative approaches, researchers will gain increasingly sophisticated tools for unraveling the complex morphological landscape of programmed cell death.
Programmed cell death, or apoptosis, is a fundamental biological process essential for maintaining cellular homeostasis, development, and eliminating damaged cells. This controlled cell death pathway occurs in distinct morphological phases: early phase (I), middle phase (IIa), and late phase (IIb) [4]. During phase IIa, cells undergo significant changes including chromatin condensation and nuclear fragmentation, while phase IIb is characterized by cytoskeleton degradation, membrane blebbing, and the formation of apoptotic bodies [4]. Understanding the transition between these phases, particularly between IIa and IIb, is critical for research in cancer biology, neurodegenerative diseases, and drug development.
Western blotting serves as a powerful technique for detecting specific protein markers that define these apoptotic phases, providing molecular insights that complement morphological observations. This technical guide outlines comprehensive strategies for using western blotting to detect key apoptotic markers, specifically focusing on phase identification through cleaved caspases, PARP, and related proteins, enabling researchers to precisely map molecular events to morphological changes in apoptotic progression.
Key Apoptotic Markers and Their Detection
Caspases: Executors of Apoptosis
Caspases are cysteine proteases that play central roles in executing apoptosis through proteolytic cleavage of cellular substrates. Detection of their cleaved, activated forms provides critical information about the specific apoptotic pathway activated and the progression of cell death.
- Caspase-8: Functions as an initiator caspase in the extrinsic pathway activated by death receptors. Detection of cleaved caspase-8 indicates activation of the death receptor-mediated apoptotic pathway [4].
- Caspase-9: Serves as an initiator in the intrinsic (mitochondrial) pathway. Cleaved caspase-9 signifies mitochondrial involvement in apoptosis, often in response to cellular stress [4] [34].
- Caspase-3: The key executioner caspase that cleaves numerous cellular targets, resulting in the characteristic morphological changes of apoptosis. Detection of cleaved caspase-3 represents a definitive marker of active apoptotic execution and is a hallmark feature observed in both phase IIa and IIb [4] [35].
PARP: A Signature Substrate
Poly (ADP-ribose) polymerase-1 (PARP-1) is a DNA repair enzyme that becomes cleaved by activated caspases, particularly caspase-3, during apoptosis. The appearance of the cleaved PARP fragment (typically 89 kDa) serves as a reliable biochemical marker of apoptosis [4] [35]. The cleavage inactivates PARP's DNA repair function, facilitating cellular disassembly. Monitoring the ratio of cleaved to full-length PARP provides valuable information about the commitment to apoptosis, with increasing cleaved PARP levels indicating progression through the later apoptotic phases.
Bcl-2 Family Proteins: Regulators of Cell Fate
The Bcl-2 family proteins comprise both pro-apoptotic (e.g., Bax, Bak, Bid) and anti-apoptotic (e.g., Bcl-2, Bcl-xL, Mcl-1) members that regulate mitochondrial outer membrane permeabilization (MOMP), a critical event in the intrinsic pathway [4] [36]. Western blot analysis of these regulators can reveal the balance between pro- and anti-apoptotic signals within cells. For example, a decreased Bcl-2/Bax ratio often indicates cellular commitment to apoptosis through the mitochondrial pathway [34] [36]. Additionally, caspase-mediated cleavage of Bid to truncated Bid (tBid) can amplify the apoptotic signal by promoting MOMP [37].
Table 1: Key Apoptotic Markers for Western Blot Analysis
| Marker | Molecular Weight (Full-length/Cleaved) | Significance in Apoptosis | Primary Phase Association |
|---|---|---|---|
| Caspase-3 | 35 kDa / 17, 19 kDa (cleaved forms) | Executioner caspase; definitive apoptosis marker | Phase IIa-IIb transition |
| Caspase-8 | 55 kDa / 43 kDa (cleaved forms) | Extrinsic pathway initiator | Early Phase IIa |
| Caspase-9 | 45-50 kDa / 35 kDa (cleaved forms) | Intrinsic pathway initiator | Phase IIa |
| PARP | 116 kDa / 89 kDa (cleaved) | Caspase substrate; DNA repair enzyme | Phase IIa-IIb |
| Bcl-2 | 26 kDa | Anti-apoptotic regulator | Early Phase |
| Bax | 21 kDa | Pro-apoptotic regulator | Phase IIa |
| Bid | 22 kDa / 15 kDa (tBid) | Pro-apoptotic connector | Phase IIa |
Apoptotic Signaling Pathways
The diagram below illustrates the core apoptotic signaling pathways, highlighting key markers detectable by western blotting and their relationships, which can help researchers contextualize their findings within the broader apoptotic network.
Diagram 1: Apoptotic Signaling Pathways (Width: 760px)
Western Blot Protocol for Apoptosis Detection
Sample Preparation and Protein Extraction
Proper sample preparation is critical for reliable apoptosis detection. Cells should be harvested at appropriate time points after apoptosis induction to capture different phases of cell death. For adherent cells undergoing apoptosis, both attached and detached cells should be collected, as detached cells often represent later apoptotic stages [38]. Cell lysates should be prepared using RIPA buffer or similar lysis buffers supplemented with protease and phosphatase inhibitors to preserve protein integrity and post-translational modifications [4] [35]. Protein concentration should be quantified using Bradford, BCA, or similar assays to ensure equal loading across gels, typically 20-50 μg per lane [4] [35].
Gel Electrophoresis and Protein Transfer
Proteins are separated by SDS-PAGE using gels appropriate for the molecular weights of target proteins (e.g., 10-15% acrylamide). For optimal resolution of cleaved caspase fragments, higher percentage gels (12-15%) are recommended. Following electrophoresis, proteins are transferred to PVDF or nitrocellulose membranes using standard wet or semi-dry transfer systems. PVDF membranes are preferred for low-abundance proteins due to higher binding capacity. Transfer efficiency should be verified using reversible stains like Ponceau S before blocking.
Antibody Incubation and Detection
Membranes are blocked with 5% non-fat milk or BSA in TBST for 1 hour at room temperature to prevent non-specific antibody binding. Incubation with primary antibodies against apoptotic markers (e.g., cleaved caspase-3, cleaved PARP, Bax, Bcl-2) is performed overnight at 4°C with gentle agitation [4] [35]. Antibody dilutions should be optimized according to manufacturer recommendations but typically range from 1:500 to 1:2000. After thorough washing, membranes are incubated with appropriate HRP-conjugated secondary antibodies (1:2000-1:5000 dilution) for 1 hour at room temperature. Signal detection is performed using enhanced chemiluminescent (ECL) substrates followed by imaging with CCD-based systems [4] [35].
Using Apoptosis Antibody Cocktails
Apoptosis western blot cocktails are pre-mixed solutions containing multiple antibodies designed to detect various apoptosis-related markers simultaneously. These cocktails typically target key proteins such as caspases, Bcl-2 family members, and PARP [4]. They offer several advantages including increased efficiency by reducing multiple separate antibody incubations, enhanced detection capability across various apoptotic markers, improved reproducibility through consistent antibody concentrations, and cost-effectiveness by minimizing the number of individual antibodies required [4]. These cocktails are particularly valuable when studying complex apoptosis pathways, comparing apoptotic activity across different conditions, or working with limited sample quantities.
Experimental Workflow for Phase Identification
The following diagram outlines a comprehensive experimental workflow for identifying apoptotic phases through western blot analysis, from sample preparation to data interpretation.
Diagram 2: Experimental Workflow (Width: 760px)
Data Interpretation and Phase Correlation
Quantification and Normalization Strategies
Accurate quantification of western blot signals is essential for apoptotic phase identification. Band intensity should be measured using densitometry software such as ImageJ or instrument-specific analysis tools [4]. Signals must be normalized to housekeeping proteins (e.g., β-actin, GAPDH) or total protein staining to account for variations in sample loading and transfer efficiency [4]. For caspase activation, calculating the ratio of cleaved to total protein (e.g., cleaved caspase-3 to total caspase-3) provides information about the proportion of activated protein relative to the overall pool [4]. Similarly, the ratio of cleaved to full-length PARP indicates the extent of apoptotic execution.
Phase Identification Through Marker Correlation
Correlating multiple apoptotic markers allows researchers to distinguish between phase IIa and IIb apoptosis:
- Phase IIa Indicators: Activation of initiator caspases (caspase-8, -9), early changes in Bcl-2 family protein ratios (decreased Bcl-2/Bax), initial caspase-3 activation, and beginning PARP cleavage [4].
- Phase IIb Indicators: Prominent cleavage of executioner caspases (caspase-3, -7), extensive PARP cleavage, degradation of structural proteins, and evidence of substrate cleavage such as CAD processing [4] [38].
Table 2: Apoptotic Phase Identification Through Western Blot Markers
| Molecular Marker | Phase IIa (Middle Phase) | Phase IIb (Late Phase) | Quantitative Interpretation |
|---|---|---|---|
| Caspase-8 Activation | Present | Variable | Decreasing in late phase |
| Caspase-9 Activation | Present | Variable | Decreasing in late phase |
| Caspase-3 Cleavage | Initial detection | Strongly increased | >5-fold increase in IIb vs IIa |
| PARP Cleavage | Initial cleavage (≤30%) | Extensive cleavage (≥70%) | Cleaved/Full-length ratio >2.0 |
| Bcl-2/Bax Ratio | Decreasing (≥0.5) | Significantly decreased (≤0.3) | Progressive decrease |
| Mitochondrial Markers | Cytochrome c release begins | Complete cytochrome c release | Cytosolic fraction increases |
Research Reagent Solutions
Table 3: Essential Reagents for Apoptosis Western Blotting
| Reagent Category | Specific Examples | Function/Application |
|---|---|---|
| Apoptosis Inducers | Hydrogen peroxide, Staurosporine, Trail, Bruceine D [34] [39] | Positive controls for apoptosis induction |
| Lysis Buffers | RIPA buffer, NP-40 alternative | Protein extraction with protease/phosphatase inhibitors [35] |
| Primary Antibodies | Anti-cleaved caspase-3, Anti-PARP, Anti-Bcl-2, Anti-Bax [4] [35] | Detection of specific apoptotic markers |
| Antibody Cocktails | Pro/p17-caspase-3, cleaved PARP1, muscle actin cocktails [4] | Simultaneous detection of multiple markers |
| Detection Systems | HRP-conjugated secondary antibodies, ECL substrates [4] [35] | Signal generation and visualization |
| Loading Controls | β-actin, GAPDH, tubulin antibodies [4] | Normalization for protein loading |
| Caspase Inhibitors | z-VAD-fmk (pan-caspase), z-DEVD-fmk (caspase-3) [34] [39] | Specific pathway inhibition controls |
Advanced Applications and Integration
Cancer Research Applications
Western blot analysis of apoptotic markers plays a crucial role in cancer research, particularly in evaluating chemotherapeutic efficacy and understanding drug resistance mechanisms. For example, studies on Bruceine D have demonstrated its ability to induce mitochondrial-dependent apoptosis in lung cancer cells, characterized by decreased Bcl-2/Bax ratio, cytochrome c release, and activation of caspases-9 and -3 [34]. Similarly, research on gastric and colorectal cancers has revealed that chemotherapeutic agents promote CAD degradation through caspase-3-mediated cleavage, linking pyrimidine synthesis pathway disruption to apoptosis execution [38].
Challenges and Troubleshooting
Detecting apoptotic proteins presents several technical challenges. Sample preparation requires careful handling to preserve fragile protein epitopes and prevent degradation [4]. Antibody selection is critical, with preferences for antibodies specifically recognizing cleaved forms (e.g., cleaved caspase-3) rather than total proteins for definitive apoptosis detection [4] [35]. Optimization of protein transfer conditions is essential for efficient transfer of both high and low molecular weight proteins. Researchers should include appropriate controls in every experiment: untreated cells, apoptosis-induced positive controls, and loading controls for normalization [4].
Correlation with Morphological Assessment
While western blotting provides molecular evidence of apoptosis, correlation with morphological assessment remains essential for comprehensive phase identification. Techniques such as fluorescence microscopy (for membrane blebbing and chromatin condensation) and flow cytometry (for annexin V staining and DNA fragmentation) should complement western blot data [4] [40]. This integrated approach ensures accurate classification of apoptotic phases and validates molecular findings against the "gold standard" of morphological changes [40].
Within the broader context of research on the morphological differences between apoptosis phase IIa and IIb, the precise resolution of distinct apoptotic populations is a critical technical challenge. Apoptosis, or programmed cell death, is a tightly regulated process characterized by a series of well-defined morphological and biochemical changes. A pivotal early event is the loss of phospholipid asymmetry in the plasma membrane, resulting in the translocation of phosphatidylserine (PS) from the inner to the outer leaflet [41]. This externalized PS serves as a specific "eat-me" signal for phagocytosis by neighboring cells and represents a key marker for identifying cells in the early stages of apoptosis [41].
The integration of Annexin V and propidium iodide (PI) staining with flow cytometry has become the gold-standard methodology for detecting this event and discriminating between different stages of cell death [42] [43]. This technical guide provides an in-depth examination of this technique, detailing its principles, protocols, and data interpretation, with a specific focus on its application in dissecting the subtle transitions during mid-stage apoptosis (Phases IIa and IIb).
Technical Principles of Annexin V/Propidium Iodide Staining
The Biochemical Basis of Annexin V Binding
Annexin V is a 35-36 kDa human vascular anticoagulant protein that binds with high affinity to PS in a calcium-dependent manner [41]. In a healthy, viable cell, the membrane is intact and PS is sequestered on the cytoplasmic surface. During the initial phase of apoptosis (often correlated with Phase IIa), the cell membrane undergoes restructuring, exposing PS on the extracellular surface while remaining mechanically intact. This allows Annexin V conjugates to bind from the outside, providing a specific stain for early apoptotic cells [41] [43]. The fluorescence intensity difference between apoptotic and non-apoptotic cells stained with fluorescent Annexin V conjugates is typically about 100-fold, making it a highly sensitive detection method [41].
The Role of Propidium Iodide in Viability Assessment
Propidium iodide (PI) is a live cell-impermeant fluorescent dye that binds to double-stranded DNA by intercalating between base pairs [41]. It is excluded from viable and early apoptotic cells due to their intact plasma membranes. However, as apoptosis progresses to a later stage (into Phase IIb and beyond), the integrity of the plasma membrane is lost. This allows PI to enter the cell, stain the nuclear material, and mark the cell as being in a late stage of apoptosis or already dead [42] [43]. The combination of these two dyes creates a powerful tool for resolving multiple cell populations based on their death status.
The following diagram illustrates the core staining logic of the Annexin V/PI assay and how it distinguishes between different cell states based on membrane integrity and PS exposure:
Detailed Experimental Methodology
Sample Preparation and Staining Protocol
A robust protocol is essential for obtaining accurate and reproducible data. The following steps outline a standard procedure for adherent or suspension cells.
- Step 1: Cell Harvest and Washing. Gently harvest cells to avoid inducing mechanical damage that can cause false-positive Annexin V staining. For adherent cells, use mild enzymatic dissociation (e.g., low-concentration trypsin without EDTA) or gentle scrapping. Wash cells once with cold Phosphate-Buffered Saline (PBS).
- Step 2: Resuspension in Binding Buffer. Resuspend the cell pellet at a density of 1 x 10^6 cells/mL in ice-cold 1X Annexin Binding Buffer. This specialized buffer provides the optimal calcium concentration (typically 1.5-2.0 mM CaCl₂) required for Annexin V binding to PS [41]. Note that using suboptimal buffers like Annexin Binding Buffer for extended periods can synergize with apoptotic stimuli and lead to artificially elevated apoptosis rates [44].
- Step 3: Fluorochrome Incubation. Transfer 100 µL of the cell suspension (approximately 1 x 10^5 cells) to a flow cytometry tube. Add the recommended volume of fluorochrome-conjugated Annexin V (e.g., Annexin V, Alexa Fluor 488) and Propidium Iodide (PI) working solution. A typical final concentration for PI is 1-2 µg/mL. Gently vortex the tubes to mix.
- Step 4: Incubation and Analysis. Incubate the cells in the dark for 15-20 minutes at room temperature (or on ice). After incubation, add 400 µL of ice-cold 1X Annexin Binding Buffer to each tube to stop the reaction and keep the cells cold. Analyze the samples by flow cytometry within 60 minutes to prevent deterioration.
Critical Considerations for Accurate Results
- Inclusion of Controls: Essential controls are non-negotiable for correct data interpretation.
- Unstained Cells: To assess cellular autofluorescence.
- Single-Color Stained Cells: Cells stained with Annexin V only and PI only are mandatory for compensating spectral overlap between fluorescence channels on the flow cytometer.
- Viability Control: Treat a sample of cells with a known apoptosis inducer (e.g., 10 µM camptothecin for 4 hours) as a positive control, and include an untreated sample as a negative control [41].
- Avoiding Fixation: This assay is designed for live-cell analysis. Fixing cells after staining can lead to a loss of signal and is generally not recommended unless specific, validated fixation protocols (alcohol-free, aldehyde-based) are followed [41].
- Preventing False Positives: Cells with compromised membranes (necrotic or late-stage apoptotic) allow Annexin V to access PS on the inner leaflet, causing a false-positive signal for early apoptosis. The simultaneous use of PI is critical to identify and gate out these populations [41].
Data Analysis and Population Resolution
Gating Strategy and Quadrant Analysis
Flow cytometry data from an Annexin V/PI assay is typically displayed on a two-dimensional dot plot. The X-axis represents Annexin V fluorescence, and the Y-axis represents PI fluorescence. The population is divided into four distinct quadrants, each corresponding to a specific cellular state, as summarized in the table below.
Table 1: Interpretation of Cell Populations in Annexin V/PI Flow Cytometry
| Quadrant | Annexin V Signal | PI Signal | Cell Status | Biological Interpretation |
|---|---|---|---|---|
| Lower Left | Negative | Negative | Viable/Normal | Healthy cells with intact membranes and no externalized PS. |
| Lower Right | Positive | Negative | Early Apoptotic (Phase IIa) | Cells undergoing early apoptosis; PS is externalized, but the plasma membrane is intact. |
| Upper Right | Positive | Positive | Late Apoptotic (Phase IIb) | Cells in late apoptosis; PS is externalized and the membrane has lost integrity. |
| Upper Left | Negative | Positive | Necrotic/Debris | Often represents dead cells, cellular debris, or necrotic cells that lost membrane integrity before PS exposure. |
This quadrant analysis allows for the precise resolution needed to investigate the transition from Phase IIa (Annexin V+/PI-) to Phase IIb (Annexin V+/PI+). Research comparing this method to the neutral comet assay confirms that the Annexin V assay detects higher levels of apoptosis because it can identify cells in this earlier, pivotal stage of the pathway [42].
Quantitative Data and Comparative Sensitivity
The Annexin V/PI assay provides robust quantitative data on the percentage of cells in each population. This is crucial for kinetic studies of apoptosis progression and for evaluating the effects of therapeutic agents. The table below provides an example of quantitative data, comparing untreated control cells to cells treated with an apoptosis-inducing drug.
Table 2: Example Quantitative Analysis of Apoptosis Induction in Jurkat T-Cells
| Cell Population | Untreated Control (%) | Camptothecin (10 µM, 4h) (%) | Fold Change |
|---|---|---|---|
| Viable (Annexin V-/PI-) | 92.5 | 45.2 | 0.5x |
| Early Apoptotic (Annexin V+/PI-) | 4.1 | 32.7 | 8.0x |
| Late Apoptotic (Annexin V+/PI+) | 2.3 | 18.5 | 8.0x |
| Necrotic/Debris (Annexin V-/PI+) | 1.1 | 3.6 | 3.3x |
Note: Data is simulated based on patterns described in [41].
Advanced methodologies, such as real-time high-content imaging with Annexin V labelling, have demonstrated a 10-fold greater sensitivity compared to traditional flow cytometry-based endpoints, highlighting the potential for even more refined kinetic analysis of these transitions [44].
Advanced Applications and Emerging Technologies
The Scientist's Toolkit: Key Reagents and Kits
A wide array of commercial reagents and kits are available to facilitate Annexin V/PI apoptosis assays. The selection depends on the specific experimental setup, including the available laser lines on the flow cytometer and the need for multiplexing with other probes.
Table 3: Research Reagent Solutions for Apoptosis Detection
| Reagent / Kit Name | Core Components | Function & Application |
|---|---|---|
| Annexin V, Alexa Fluor 488 Conjugate | Recombinant Annexin V conjugated to bright, photostable Alexa Fluor 488 dye. | Stand-alone reagent for detecting PS exposure; ideal for FITC channel on flow cytometers [41]. |
| Annexin V Apoptosis Detection Kits | Annexin V conjugate (e.g., FITC, PE, APC) + Propidium Iodide (or 7-AAD) + Binding Buffer. | Complete, optimized kit for a standard Annexin V/PI assay; ensures proper buffer conditions and dye compatibility [41]. |
| Viability Dyes (Alternatives to PI) | 7-AAD, SYTOX Green, SYTOX AADvanced, DRAQ7, YOYO3. | Cell-impermeant nucleic acid stains used to identify dead cells; some (e.g., YOYO3) offer lower toxicity for long-term kinetic imaging [41] [44]. |
| Annexin Binding Buffer (5X or 10X) | Concentrated buffer containing calcium and salts. | Diluted to 1X to provide the optimal calcium-dependent binding conditions for Annexin V [41]. |
| Multiplex Apoptosis Kits | Annexin V + Viability Dye + additional probe (e.g., C12-resazurin for metabolic activity, MitoTracker for mitochondrial potential). | Allows for the simultaneous assessment of apoptosis, cell death, and other cellular parameters in a single assay [41]. |
Integration with Imaging Flow Cytometry
A significant innovation in the field is the development of Imaging Flow Cytometry (IFC), which combines the high-throughput, multi-parametric capabilities of conventional flow cytometry with high-resolution morphological imaging [45]. This technology is uniquely positioned to advance research into the morphological differences between apoptosis Phase IIa and IIb.
While conventional flow cytometry can resolve these populations based on fluorescence signals alone, IFC can simultaneously capture detailed images of each cell. This allows researchers to visually confirm the classic morphological hallmarks of apoptosis—such as cell shrinkage, membrane blebbing, and nuclear fragmentation—directly within the Annexin V+/PI- and Annexin V+/PI+ populations [45] [43]. This provides an unprecedented level of confidence in correlating biochemical markers with cytomorphological changes, bridging a critical gap in the mechanistic study of apoptotic progression.
The Annexin V/PI staining protocol remains a cornerstone technique for the quantitative resolution of early, mid, and late apoptotic populations. Its reliability, sensitivity, and compatibility with standard flow cytometers make it an indispensable tool for basic research, drug discovery, and toxicology studies. Within the specific context of differentiating apoptosis Phase IIa from IIb, this method provides the definitive biochemical framework—distinguishing cells based on the presence of surface PS and the integrity of the plasma membrane. The ongoing integration of this classic assay with cutting-edge technologies like imaging flow cytometry and artificial intelligence-powered image analysis promises to unlock even deeper insights into the intricate temporal and morphological landscape of programmed cell death, further solidifying its role as the gold standard in apoptosis detection.
Apoptosis, or programmed cell death, is a fundamental process for maintaining tissue homeostasis, occurring during normal development, aging, and the elimination of damaged or harmful cells [3] [4]. A critical biochemical event in apoptosis is the systematic degradation of chromosomal DNA, a hallmark that differentiates it from other forms of cell death. The TUNEL assay has emerged as a quintessential method for the specific in situ detection of this DNA fragmentation, directly correlating with the distinct morphological changes that characterize the mid to late stages of apoptosis [46] [3].
Morphologically, apoptosis progresses through several phases. In Phase I, cells shrink and detach from their neighbors. The pivotal nuclear changes occur in Phase IIa, where chromatin condenses and marginalizes against the nuclear envelope, and Phase IIb, where the nucleus fragments into discrete apoptotic bodies [3] [4]. It is during these mid to late phases that activation of endogenous endonucleases, such as CAD, creates a multitude of double-strand DNA breaks with exposed 3'-hydroxyl (3'-OH) termini [3] [47]. The TUNEL assay is uniquely designed to label these DNA breaks, providing a precise tool to visualize and quantify cells undergoing these critical stages of apoptotic progression [46] [48].
The Core Principle of the TUNEL Assay
The TUNEL (Terminal deoxynucleotidyl transferase dUTP Nick End Labeling) assay is a method that enzymatically labels the 3'-hydroxyl termini of DNA breaks generated during apoptosis [46] [48]. The core of the technology relies on the enzyme Terminal Deoxynucleotidyl Transferase (TdT), which catalyzes the template-independent addition of deoxynucleotides to the 3'-OH ends of DNA fragments [46] [49].
In a typical TUNEL reaction, TdT attaches modified nucleotides to these 3'-OH ends. These nucleotides can be tagged with a variety of labels, including:
- Fluorophores for direct detection.
- Biotin or digoxigenin for indirect detection.
- EdUTP, an alkyne-modified nucleotide detected via click chemistry [46] [49].
This incorporation allows for the sensitive and specific detection of individual apoptotic cells within a population or tissue section, making it a powerful tool for both microscopy and flow cytometry [46] [50].
Methodologies and Technical Approaches
The basic workflow of a TUNEL assay involves sample preparation, fixation, permeabilization, the TdT-mediated labeling reaction, and finally, detection. However, several distinct methodological approaches have been developed, each with its own advantages and specific applications.
Direct vs. Indirect Labeling Methods
- Direct Labeling: This method uses nucleotides that are directly conjugated to a fluorophore. The protocol is faster, requiring fewer steps, as no secondary detection system is needed [49]. A survey of recent literature found that 50% of published TUNEL assays used dUTP directly conjugated to FITC [49].
- Indirect Labeling: This method utilizes hapten-labeled nucleotides, such as biotin-dUTP or BrdUTP, which are incorporated by TdT and subsequently detected using a streptavidin-enzyme complex or an antibody conjugated to a reporter enzyme [46] [49]. While requiring more steps, indirect methods can benefit from signal amplification, potentially increasing assay sensitivity [49].
Advanced TUNEL Assay Platforms
Commercial platforms have refined these principles to enhance performance and compatibility.
- Click-iT TUNEL Assays: This innovative approach uses EdUTP, a dUTP modified with a small alkyne moiety. After TdT-mediated incorporation, the EdUTP is detected using a fluorescent or colorimetric azide tag via a copper-catalyzed cycloaddition reaction ("click" chemistry) [46]. This two-step method has been shown to detect a higher percentage of apoptotic cells under identical conditions compared to one-step incorporation methods [46].
- Click-iT Plus TUNEL Assays: A significant advancement in the Click-iT platform, these assays feature optimized copper concentrations to preserve the fluorescence of fluorescent proteins and maintain compatibility with phalloidin staining for cytoskeletal analysis, enabling more robust multiplexing experiments [46].
- APO-BrdU TUNEL Assay: This assay utilizes BrdUTP incorporation, which is then detected with an Alexa Fluor 488-labeled anti-BrdU antibody. This method often includes propidium iodide for simultaneous determination of total cellular DNA content, making it particularly suitable for flow cytometry analysis to assess apoptosis and cell cycle stage [46].
Table 1: Comparison of Major TUNEL Assay Methodologies
| Method | Key Feature | Detection Mode | Best Suited For | Multiplexing Compatibility |
|---|---|---|---|---|
| Direct FITC-dUTP | Fast, one-step protocol | Fluorescence | General apoptosis detection, flow cytometry | Good with standard fluorescent dyes [46] |
| Biotin-dUTP/Streptavidin-HRP | Signal amplification | Colorimetric (DAB) | Brightfield microscopy, tissue analysis | Good with hematoxylin, methyl green [46] [49] |
| Click-iT TUNEL | Flexible, bioorthogonal chemistry | Fluorescence or Colorimetric | High-content screening, cultured cells | Standard fluorescent dyes; not recommended for fluorescent proteins [46] |
| Click-iT Plus TUNEL | Copper-optimized reaction | Fluorescence | Multiplexed imaging with fluorescent proteins/phalloidin | Excellent with fluorescent proteins and phalloidin [46] |
| APO-BrdU TUNEL | Includes DNA content stain | Fluorescence | Flow cytometry, cell cycle analysis | Good with other fluorescent cell cycle markers [46] |
The Scientist's Toolkit: Essential Reagents and Materials
Successful execution of a TUNEL assay requires a set of key reagents, each playing a critical role in the process.
Table 2: Key Research Reagent Solutions for TUNEL Assay
| Reagent/Material | Function/Description | Critical Considerations |
|---|---|---|
| Terminal Deoxynucleotidyl Transferase (TdT) | Core enzyme that catalyzes the addition of modified nucleotides to 3'-OH DNA ends. | Enzyme activity and purity are paramount for efficient labeling and low background [46] [48]. |
| Modified Nucleotides (dUTP) | The label incorporated into fragmented DNA. Examples: Fluorescein-dUTP, Biotin-dUTP, EdUTP, BrdUTP. | Choice dictates detection method (direct/indirect/click) and signal strength [46] [49]. |
| Detection Reagent | Agent that binds the incorporated nucleotide for visualization. Examples: Anti-BrdU antibodies, Streptavidin-HRP, Azide dyes. | Must be matched to the modified nucleotide used; specificity determines signal-to-noise ratio [46] [49]. |
| Antigen Retrieval Reagent | Unmasks hidden DNA breaks in fixed tissues. Examples: Proteinase K, or heat-mediated retrieval (pressure cooking). | Proteinase K can degrade protein antigens, hindering multiplexing. Pressure cooking is superior for compatibility with protein co-staining [51]. |
| Positive Control (DNase I) | Treats samples to introduce DNA breaks in all cells, confirming assay functionality. | An essential control to validate the entire assay workflow and reagent performance [46] [49]. |
| Blocking Solution | Reduces non-specific binding of detection reagents (especially critical for indirect methods). | Typically contains proteins (e.g., BSA) to block non-specific sites and, for biotin-based methods, neutralizes endogenous biotin [49]. |
TUNEL Assay in Apoptosis Research and Drug Development
The TUNEL assay serves as a critical tool in both basic research and applied pharmaceutical development, particularly in the context of understanding cell death mechanisms and evaluating therapeutic efficacy.
- Cancer Research and Therapy: In cancer biology, the TUNEL assay is extensively used to evaluate the effectiveness of chemotherapeutic agents and targeted therapies designed to induce apoptosis in tumor cells [47] [52]. Monitoring DNA fragmentation helps determine the mechanism of action of pro-apoptotic compounds and assess a tumor's sensitivity or resistance to treatment.
- Neurodegenerative Disease Research: In conditions like Alzheimer's and Parkinson's disease, excessive apoptosis contributes to neuronal loss. The TUNEL assay allows researchers to pinpoint and quantify dying neurons in tissue sections, providing insights into disease progression and the neuroprotective potential of experimental drugs [4].
- Male Infertility Assessment: The TUNEL assay has been standardized for flow cytometric measurement of sperm DNA fragmentation (SDF), a key factor in male infertility. It directly measures both single- and double-strand DNA breaks in spermatozoa, providing crucial diagnostic and prognostic information [50].
- Toxicology and Safety Assessment: The assay is employed to identify off-target apoptotic effects of drug candidates in healthy tissues, such as liver toxicity, which is a major cause of drug failure in development [51] [52].
Advanced Applications and Protocol Integration
Modern research demands the simultaneous analysis of multiple parameters. The TUNEL assay has evolved to meet this need through advanced multiplexing and integration with spatial proteomics.
A key technical consideration is antigen retrieval. Traditional TUNEL protocols use proteinase K to digest proteins and expose DNA breaks. However, this treatment severely compromises protein antigenicity, preventing high-plex co-detection of protein biomarkers [51]. Replacing proteinase K with heat-mediated antigen retrieval (e.g., pressure cooking) preserves the TUNEL signal while maintaining the integrity of protein epitopes [51]. This adaptation enables the harmonization of TUNEL with cutting-edge spatial proteomic methods like MILAN and Cyclic Immunofluorescence, allowing for the rich spatial contextualization of cell death within complex tissues [51].
Furthermore, the TUNEL assay can be effectively combined with other techniques to provide a more comprehensive view of apoptosis:
- Western Blotting: While TUNEL identifies individual apoptotic cells, western blotting for markers like cleaved caspase-3, cleaved PARP, and members of the Bcl-2 family provides biochemical confirmation of apoptosis activation across a whole sample [4].
- Flow Cytometry: TUNEL combined with flow cytometry allows for the quantitative analysis of apoptotic cells within a heterogeneous population and can be coupled with cell surface or intracellular staining for phenotyping [46] [50].
Experimental Workflow and Signaling Pathways
The following diagram illustrates the procedural workflow of a typical TUNEL assay, from sample preparation to final imaging and analysis, highlighting key decision points for different methodological choices.
To fully appreciate the biological context of the TUNEL assay, it is essential to understand the apoptotic signaling pathways that culminate in DNA fragmentation. The intrinsic pathway is triggered by internal cellular stress, leading to mitochondrial outer membrane permeabilization and caspase activation. The extrinsic pathway is initiated by external death ligands binding to cell surface receptors. Both pathways converge on the activation of executioner caspases, which in turn activate endonucleases that cleave nuclear DNA, creating the 3'-OH ends detected by the TUNEL assay.
The TUNEL assay remains a gold-standard technique for the specific detection of apoptotic DNA fragmentation, a definitive hallmark of the mid to late stages of programmed cell death. Its continued evolution—from simple indirect labeling to sophisticated click chemistry and integration with spatial proteomics—ensures its enduring relevance in modern biological research. By enabling precise spatial localization and quantification of apoptotic cells within their morphological and tissue context, the TUNEL assay provides an indispensable window into the dynamics of cell death, fueling advancements in our understanding of disease mechanisms and the development of novel therapeutics.
Apoptosis, or programmed cell death, is a fundamental physiological process crucial for maintaining tissue homeostasis, eliminating damaged cells, and shaping organs during embryonic development [29] [4]. Its dysregulation is a hallmark of numerous diseases, including cancer, neurodegenerative disorders, and ischemic conditions, making it a critical target for therapeutic intervention [53] [4]. The process unfolds in a controlled, organized manner, characterized by distinct morphological stages [3]. Phase IIa (middle phase) is marked by chromatin condensation and margination, while Phase IIb (late phase) involves nuclear fragmentation and apoptotic body formation [3] [4]. Accurately distinguishing between these phases is not merely an academic exercise; it provides vital insights into the stage, mechanism, and irreversibility of cell death, which are essential for evaluating the efficacy and safety of potential therapies in drug development [3] [4]. This guide outlines integrated assay workflows designed to provide a confident and multifaceted characterization of apoptosis, specifically focusing on the critical transitions between Phase IIa and IIb.
Core Morphological and Biochemical Hallmarks of Phase IIa and IIb
A precise understanding of the defining features of each apoptotic phase is the foundation for selecting appropriate detection assays.
Phase IIa (Middle Phase): In this stage, cells exhibit chromatin agglutination, where the chromatin becomes highly condensed and assembles along the inner nuclear membrane (a phenomenon known as pyknosis and chromatin margination) [3]. The cell continues to shrink, and the cytoplasm becomes more dense.
Phase IIb (Late Phase): This phase is defined by the degradation of the nuclear envelope and cytoskeleton, leading to the sprouting and displacement of the cell membrane. This results in the cell breaking up into small, membrane-bound vesicles known as apoptotic bodies, which contain nuclear debris and organelle components [3] [4]. The formation of apoptotic bodies is a key morphological marker for late-stage apoptosis.
Table 1: Key Characteristics of Apoptotic Phases IIa and IIb
| Feature | Phase IIa (Middle Phase) | Phase IIb (Late Phase) |
|---|---|---|
| Nuclear Morphology | Chromatin condensation and margination; nuclear pyknosis [3] | Nuclear fragmentation (karyorrhexis) [3] |
| Cellular Morphology | Continued cell shrinkage, dense cytoplasm [3] [4] | Membrane blebbing, formation of apoptotic bodies [3] [4] |
| Key Biochemical Markers | Caspase activation, PARP cleavage initiation, Bax/Bak activation [3] [4] | Full PARP cleavage, DNA fragmentation into oligonucleosomes, phosphatidylserine externalization [3] [4] |
| Primary Detection Assays | Western Blot (caspases, PARP), Fluorometric caspase assays, Mitochondrial membrane potential dyes [3] [4] | TUNEL assay, DNA gel electrophoresis, Annexin V staining, Microscopy (apoptotic bodies) [3] |
Integrated Multi-Assay Workflow for Phase Characterization
Confidently differentiating Phase IIa from IIb requires a synergistic approach that combines morphological, biochemical, and molecular techniques. The following workflow provides a robust framework for comprehensive characterization.
Experimental Workflow Diagram
The following diagram illustrates the integrated, multi-modal workflow for characterizing apoptosis phases IIa and IIb:
Detailed Experimental Protocols
1. Morphological Assessment via Fluorescence Microscopy
This protocol is designed to identify key nuclear changes characteristic of Phase IIa and IIb.
- Sample Preparation: Plate cells on glass coverslips and apply the apoptotic stimulus. Terminate the experiment at various time points to capture dynamic progression.
- Staining: Fix cells with 4% paraformaldehyde for 15 minutes at room temperature. Permeabilize with 0.1% Triton X-100 for 10 minutes. Stain with Hoechst 33342 (1 µg/mL) or DAPI for 10 minutes in the dark [3].
- Imaging & Analysis: Visualize using a fluorescence or confocal microscope with a DAPI/UV filter set [3]. Phase IIa cells will show bright, condensed, and marginated chromatin. Phase IIb cells will exhibit fragmented nuclei and apoptotic bodies.
2. Biochemical Profiling via Western Blot
Western blotting provides specific information on the activation of key apoptotic proteins, offering high specificity and the ability to quantify protein levels [4].
- Cell Lysis & Protein Quantification: Lyse cells in RIPA buffer supplemented with protease and phosphatase inhibitors. Clarify lysates by centrifugation and quantify protein concentration using a Bradford or BCA assay [4].
- Gel Electrophoresis & Transfer: Separate equal amounts of protein (20-30 µg) by SDS-PAGE. Transfer proteins to a PVDF or nitrocellulose membrane.
- Antibody Probing: Block the membrane with 5% non-fat milk. Incubate with primary antibodies against key apoptotic markers (see Table 3) overnight at 4°C. After washing, incubate with an HRP-conjugated secondary antibody.
- Detection & Analysis: Develop blots using enhanced chemiluminescence (ECL) reagents. Use densitometry software (e.g., ImageJ) to quantify band intensities. Key indicators include:
- Phase IIa: Appearance of cleaved caspase-3, cleaved caspase-9, and initial cleaved PARP.
- Phase IIb: Strong signal for cleaved PARP and a decrease in full-length PARP [4]. Normalize all signals to a housekeeping protein like GAPDH or β-actin.
3. DNA Fragmentation Analysis via TUNEL Assay
The TUNEL (TdT dUTP Nick-End Labeling) assay is a relatively sensitive and specific method for detecting late-stage apoptosis by labeling the 3'-OH ends of fragmented DNA [3].
- Principle: The enzyme Terminal Deoxynucleotidyl Transferase (TdT) catalyzes the addition of fluorescein-labeled dUTP to the 3'-hydroxyl termini of DNA fragments, which are abundant in apoptotic cells [3].
- Procedure: Fix and permeabilize cells as described for fluorescence microscopy. Follow the manufacturer's protocol for the commercial TUNEL assay kit. Incubate cells with the TdT reaction mixture, then counterstain with DAPI or Hoechst.
- Analysis: Visualize under a fluorescence microscope. TUNEL-positive nuclei (green fluorescence) indicate late apoptosis (Phase IIb). The ratio of TUNEL-positive cells to total cells (from DAPI count) provides a quantitative measure [3]. Note that false positives can occur, so including controls is essential.
Quantitative Data and Biomarker Profiles
The integration of quantitative data from multiple assays solidifies phase characterization. The table below summarizes expected results for key biomarkers across the apoptotic phases.
Table 2: Quantitative Biomarker Profile Across Apoptotic Phases
| Biomarker / Assay | Healthy Cells | Phase IIa (Early Execution) | Phase IIb (Late Execution) |
|---|---|---|---|
| Cleaved Caspase-3 (Western Blot) | Not detectable | Low to moderate levels | High levels [4] |
| Cleaved PARP (Western Blot) | Not detectable | Initial appearance, low ratio to full-length | High ratio of cleaved to full-length [4] |
| Bax/Bcl-2 Ratio | Low | Increased [54] | Significantly increased [54] |
| Mitochondrial Potential (ΔΨm) | High (Red fluorescence) | Decreasing | Low (Green fluorescence) [3] |
| TUNEL Positivity | < 5% | 5% - 20% | > 20% (can exceed 70%) [3] |
| DNA Laddering (Gel Electrophoresis) | No ladder | Faint or no ladder | Distinct 180-200 bp ladder pattern [3] |
The Scientist's Toolkit: Key Research Reagents
A successful integrated workflow relies on high-quality, specific reagents. The following table details essential tools for apoptosis research.
Table 3: Essential Reagents for Apoptosis Detection
| Reagent / Assay | Function / Target | Key Application in Phase Characterization |
|---|---|---|
| Hoechst 33342 / DAPI | DNA-binding fluorescent dyes | Visualizing nuclear condensation (IIa) and fragmentation (IIb) via microscopy [3]. |
| Annexin V-FITC | Binds to phosphatidylserine (PS) | Detecting PS externalization, an early event in apoptosis. |
| Propidium Iodide (PI) | DNA dye, impermeant to live cells | Distinguishing late apoptotic/necrotic cells (PI-positive) from early apoptotic (Annexin V+/PI-). |
| JC-1 Dye | Mitochondrial membrane potential sensor | Differentiates high potential (red J-aggregates) from low potential (green monomers), indicating early apoptosis [3]. |
| Anti-Cleaved Caspase-3 Antibody | Detects activated executioner caspase | Key biomarker for Western Blot confirmation of apoptotic commitment in IIa/IIb [4]. |
| Anti-Cleaved PARP Antibody | Detects specific 89 kDa fragment | Gold-standard marker for late-stage apoptosis in Western Blot [4]. |
| TUNEL Assay Kit | Labels DNA strand breaks | Specific detection of late-stage apoptosis (Phase IIb) [3]. |
| Apoptosis Antibody Cocktails | Pre-mixed antibodies against multiple markers (e.g., caspases, PARP, actin) | Streamlines Western Blot workflow, improves reproducibility, and provides comprehensive screening in a single assay [4]. |
Advanced Concepts: Signaling Pathways and Crosstalk
Apoptosis Signaling Pathways
A deeper understanding of the signaling pathways that initiate and execute apoptosis provides context for the morphological changes observed in Phases IIa and IIb. The core pathways are summarized below.
PANoptosis: The Interplay of Cell Death Pathways
It is crucial to recognize that apoptosis does not occur in isolation. Recent research has unveiled significant crosstalk between different programmed cell death (PCD) pathways, such as apoptosis, necroptosis, and pyroptosis [29] [53]. The concept of PANoptosis has emerged to describe a unique, inflammatory cell death pathway that is regulated by integrated signaling from multiple PCD pathways through a complex called the PANoptosome [53]. In disease states like myocardial infarction or stroke, this crosstalk can complicate the cell death landscape. Therefore, while characterizing apoptosis phases, researchers should be aware that observed morphological features might be influenced by the simultaneous activation of other death mechanisms. Assays that can differentiate between these pathways (e.g., measuring GSDMD cleavage for pyroptosis alongside caspase-3 for apoptosis) are becoming increasingly important for a complete understanding of the cellular response to injury or therapy [53].
Resolving Ambiguity: Troubleshooting Common Pitfalls in Differentiating IIa from IIb Apoptosis
Within the broader context of morphological differences between apoptosis phase IIa and IIb research, distinguishing late apoptotic cells from those undergoing secondary necrosis represents a significant technical challenge for researchers and drug development professionals. Apoptosis, a genetically programmed form of cell death, progresses through distinct morphological phases [3]. Phase IIa is characterized by chromatin condensation and margination, while Phase IIb involves nuclear fragmentation and apoptotic body formation [3]. However, when apoptotic cells are not cleared by phagocytes—a process known as efferocytosis—they can progress to secondary necrosis, a terminal stage characterized by loss of membrane integrity and release of intracellular contents [55].
This transition poses critical diagnostic challenges because secondary necrosis shares morphological features with both late apoptosis and primary necrosis, yet differs fundamentally in its underlying mechanism and immunological consequences. For research focused on cancer therapeutics, where inducing tumor cell death is a primary goal, accurately distinguishing these stages is crucial for evaluating treatment efficacy and understanding potential inflammatory side effects. This technical guide provides comprehensive methodologies and analytical frameworks for precise differentiation between these cell death stages.
Morphological and Biochemical Hallmarks
Comparative Morphological Transitions
Table 1: Morphological and Biochemical Characteristics Across Cell Death Stages
| Parameter | Late Apoptosis (Phase IIb) | Secondary Necrosis | Primary Necrosis |
|---|---|---|---|
| Plasma Membrane Integrity | Intact with blebbing and apoptotic body formation | Loss of integrity after apoptotic program completion | Early rupture without apoptotic programming |
| Membrane Phosphatidylserine | Externalized (Annexin V+) | Externalized but becoming accessible to impermeable stains | Internal (Annexin V+ only with membrane permeabilization) |
| Nuclear Morphology | Chromatin condensation and fragmentation (pyknosis and karyorrhexis) | Retention of condensed/fragmented chromatin | Random DNA degradation without specific fragmentation pattern |
| Cellular Volume | Cell shrinkage and formation of membrane-bound apoptotic bodies | Swelling following initial shrinkage | Marked swelling (oncosis) |
| Caspase Activation | Active executioner caspases (caspase-3/7) | Caspase activity may be detectable but diminishing | Caspase-independent |
| DNA Fragmentation | Ordered nucleosomal cleavage (DNA laddering) | Retention of apoptotic fragmentation pattern | Random digestion |
| Inflammatory Potential | Non-inflammatory (anti-inflammatory) | Pro-inflammatory due to release of intracellular contents | Strongly pro-inflammatory |
| Physiological Context | Physiological clearance | Pathological when clearance fails | Pathological response to severe injury |
Temporal Progression and Key Transition Events
The transition from late apoptosis to secondary necrosis follows a defined temporal sequence. Research indicates that this progression occurs when apoptotic cells complete their intrinsic death program without intervention from phagocytic cells [55]. The process begins with the characteristic apoptotic events—cell shrinkage, chromatin condensation, and phosphatidylserine externalization—followed by a critical transition point where membrane integrity becomes compromised, allowing entry of vital dyes such as propidium iodide [55]. This terminal phase is characterized by swelling of cytoplasmic organelles and complete cellular disintegration, with release of damage-associated molecular patterns (DAMPs) that can trigger inflammatory responses [28].
Experimental Approaches for Distinction
Multiparameter Flow Cytometry Assays
The annexin V/propidium iodide (PI) dual staining method represents the gold standard for distinguishing early apoptosis, late apoptosis, and secondary necrosis by flow cytometry:
Experimental Protocol:
- Cell Preparation: Harvest and wash cells in cold phosphate-buffered saline (PBS).
- Staining Solution: Resuspend 1×10⁵ to 1×10⁶ cells in 100 μL of binding buffer containing annexin V-FITC (e.g., 1:100 dilution) and incubate for 15 minutes at room temperature in the dark.
- Propidium Iodide Addition: Add 400 μL of binding buffer containing PI (final concentration 1 μg/mL) immediately before analysis.
- Flow Cytometry Analysis: Analyze samples within 1 hour using flow cytometry with FITC (excitation 488 nm, emission 530 nm) and PI (excitation 488 nm, emission >575 nm) channels.
- Population Gating:
- Viable cells: Annexin V⁻/PI⁻
- Early apoptotic: Annexin V⁺/PI⁻
- Late apoptotic: Annexin V⁺/PI⁻ (with morphological changes)
- Secondary necrotic: Annexin V⁺/PI⁺
Technical Considerations:
- Avoid EDTA in washing buffers as it can affect annexin V binding.
- Include a caspase inhibitor control (e.g., Z-VAD-FMK) to confirm apoptosis-specific processes.
- Analyze samples promptly as secondary necrosis can progress during extended storage.
Diagram 1: Flow Cytometric Differentiation Pathway for Cell Death Stages
Advanced Microscopy Techniques
High-resolution time-lapse microscopy provides dynamic visualization of the transition from late apoptosis to secondary necrosis. This approach reveals the sequence of subcellular events with precise temporal resolution [56].
Protocol for Live-Cell Imaging of Cell Death Transition:
- Cell Culture Preparation: Plate cells in glass-bottom culture dishes or microplates suitable for microscopy.
- Staining Cocktail:
- Hoechst 33342 (1 μg/mL) for nuclear morphology
- Annexin V-Alexa Fluor 488 for phosphatidylserine exposure
- Propidium iodide (1 μg/mL) for membrane integrity
- TMRM (50 nM) for mitochondrial membrane potential (optional)
- Image Acquisition:
- Use an environmental chamber maintaining 37°C and 5% CO₂
- Acquire images every 15-30 minutes for 24-48 hours
- Include phase contrast to monitor morphological changes
- Image Analysis:
- Quantify changes in nuclear morphology (condensation, fragmentation)
- Monitor annexin V and PI fluorescence intensity over time
- Document the temporal sequence of membrane blebbing versus rupture
Morphological Criteria for Distinction:
- Late Apoptosis: Cell shrinkage, nuclear condensation and fragmentation, membrane blebbing, intact plasma membrane excluding viability dyes.
- Secondary Necrosis: Loss of membrane integrity following apoptotic morphology, uptake of membrane-impermeant dyes, organelle swelling after initial condensation.
Molecular and Biochemical Markers
Specific molecular signatures differentiate late apoptosis from secondary necrosis:
Caspase Activity Assays:
- Fluorometric Caspase-3/7 Assay:
- Use Ac-DEVD-AMC substrate (50 μM) in cell lysates
- Measure AMC fluorescence (excitation 380 nm, emission 460 nm)
- Compare activity relative to protein concentration
- Late apoptosis shows high caspase activity; secondary necrosis shows declining activity
Biomarker Analysis:
- Caspase-Cleaved Cytokeratin-18 (M30 antigen): Specific for epithelial cell apoptosis [57]
- Full-Length Cytokeratin-18 (M65 antigen): Released during necrosis [57]
- HMGB1 Localization: Nuclear in viable cells, released during secondary necrosis [57]
- Cytochrome c Release: Mitochondrial during viability, cytoplasmic in apoptosis, extracellular in secondary necrosis
Western Blot Protocol for Death Stage Markers:
- Fractionation: Separate cytoplasmic, membrane, and nuclear fractions.
- Antibody Panel:
- Cleaved caspase-3 (Cell Signaling #9661)
- PARP cleavage (89 kDa fragment)
- HMGB1 (cytosolic vs. extracellular)
- Cytochrome c (mitochondrial vs. cytosolic)
- Detection: Use chemiluminescence with quantitative imaging.
The Researcher's Toolkit: Essential Reagents and Methods
Table 2: Research Reagent Solutions for Distinguishing Cell Death Stages
| Reagent/Method | Specific Target/Principle | Application | Key Interpretive Consideration |
|---|---|---|---|
| Annexin V-FITC/PI | Phosphatidylserine exposure / Membrane integrity | Flow cytometry, microscopy | Annexin V+/PI- (late apoptosis) vs. Annexin V+/PI+ (secondary necrosis) |
| TUNEL Assay | DNA strand breaks with 3'-OH ends | Histology, flow cytometry | Labels both apoptotic and necrotic cells; requires morphological correlation [57] |
| Active Caspase-3 Staining | Activated executioner caspase | IHC, IF, flow cytometry | Specific for apoptotic phase; diminishes in secondary necrosis |
| M30 Antibody | Caspase-cleaved cytokeratin-18 | IHC (epithelial cells) | Specific for epithelial apoptosis; lost in secondary necrosis [58] |
| HMGB1 Detection | Nuclear protein release | ELISA, Western blot | Cytosolic redistribution in late apoptosis; extracellular release in secondary necrosis [57] |
| Electron Microscopy | Ultrastructural morphology | Gold standard validation | Distinguishes apoptotic morphology from necrotic rupture [3] |
| Lactate Dehydrogenase (LDH) Release | Cytoplasmic enzyme release | Spectrophotometric assay | Minimal in apoptosis; maximal in secondary necrosis |
| Mitochondrial Membrane Potential Probes | ΔΨm collapse (JC-1, TMRM) | Fluorescence assays | Early event in apoptosis; maintained in primary necrosis until late |
Integrated Experimental Workflow
A systematic approach combining multiple techniques provides the most accurate distinction between late apoptosis and secondary necrosis:
Diagram 2: Integrated Experimental Workflow for Cell Death Stage Determination
Implementation Guidelines:
- Temporal Analysis: Include multiple time points to capture the progression from late apoptosis to secondary necrosis.
- Dose-Response Relationships: Test different concentrations of death-inducing agents to establish threshold effects.
- Inhibitor Controls: Use caspase inhibitors (Z-VAD-FMK) to confirm apoptotic mechanisms and necroptosis inhibitors (Nec-1) to rule out programmed necrosis.
- Phagocytosis Blockade: Inhibit efferocytosis to accelerate secondary necrosis development for positive controls.
Implications for Drug Development and Therapeutic Assessment
Accurate discrimination between late apoptosis and secondary necrosis has significant implications for therapeutic development:
Oncology Drug Screening:
- Compounds inducing pure apoptosis may have limited efficacy if tumor clearance is inefficient.
- Agents causing secondary necrosis may enhance immunogenic cell death but risk inflammatory side effects.
- Assessment should include phagocytosis efficiency in tumor microenvironment models.
Safety Pharmacology:
- Off-target cytotoxicity often manifests as primary necrosis rather than apoptosis.
- Secondary necrosis indicates prior apoptotic signaling, suggesting target engagement.
- Inflammatory potential of cell death modalities should be evaluated for immunotoxicity.
Therapeutic Optimization:
- Combination therapies can be designed to enhance apoptotic clearance and prevent progression to secondary necrosis.
- Biomarker development should focus on serum indicators of specific death modalities (e.g., M30:M65 ratio) [57].
Distinguishing late apoptosis from secondary necrosis requires a multi-parametric approach that integrates morphological, biochemical, and temporal parameters. While late apoptosis represents the execution phase of programmed cell death with intact membranes, secondary necrosis is the natural outcome of completed apoptosis when cellular clearance fails [55]. For researchers in drug development, recognizing this distinction is crucial for accurate interpretation of therapeutic efficacy and safety profiles. The experimental frameworks presented in this guide provide robust methodologies for precise differentiation, enabling more sophisticated analysis of cell death mechanisms in both basic research and translational applications.
The morphological analysis of apoptosis remains a cornerstone of cellular biology, particularly in distinguishing between its various execution phases, often categorized as IIa and IIb. A significant challenge in this analysis is the inherent variability in the kinetics of these phases. The duration and visibility of apoptotic hallmarks are not constant; they are profoundly influenced by the cell type under investigation and the nature of the apoptotic stimulus. This variability can lead to misinterpretation of results and poses a substantial challenge for standardized assay development and high-throughput drug screening. Understanding the molecular and cellular underpinnings of this kinetic variability is therefore critical for accurate research within a thesis focused on the morphological nuances of apoptosis. This guide delves into the core factors driving these differences and provides a structured, technical resource for researchers and drug development professionals.
Core Mechanisms Governing Kinetic Variability
The journey of a cell through apoptosis is governed by a complex interplay of signaling pathways. The specific route taken—intrinsic (mitochondrial) or extrinsic (death receptor)—and the cell's inherent protein expression profile create a unique kinetic signature for each apoptosis event [2] [28].
The Apoptotic Signaling Pathways
The two primary pathways converge on a common execution phase but initiate cell death with distinct kinetics.
- The Extrinsic Pathway: This pathway is activated by the binding of extracellular death ligands (e.g., FasL, TRAIL) to their cognate death receptors on the cell membrane [29] [59]. This binding leads to the formation of the Death-Inducing Signaling Complex (DISC), which rapidly activates initiator caspase-8 [2] [28]. In so-called "type I" cells, this results in the direct cleavage and activation of executioner caspase-3, leading to a relatively fast and synchronous apoptotic response [59].
- The Intrinsic Pathway: This pathway is initiated in response to internal cellular stressors, including DNA damage, oxidative stress, or growth factor withdrawal [29] [59]. These stresses trigger mitochondrial outer membrane permeabilization (MOMP), a pivotal event controlled by the balance of pro- and anti-apoptotic Bcl-2 family proteins [2] [59]. MOMP leads to the release of cytochrome c, which forms the apoptosome with Apaf-1, activating caspase-9 and subsequently caspase-3 [28]. This pathway often involves a slower, more variable delay as cellular stress signals integrate and reach the threshold for MOMP.
The following diagram illustrates the key components and crosstalk between these pathways, highlighting points where variability is introduced.
Key Determinants of Kinetic Variability
The diagram above shows key nodes where kinetic variability is introduced. The table below summarizes the primary factors contributing to this variability.
Table 1: Factors Influencing Apoptotic Kinetics and Morphology
| Factor | Impact on Kinetics & Morphology | Underlying Mechanism |
|---|---|---|
| Cell Type | Determines speed of execution phase and susceptibility to intrinsic vs. extrinsic pathways. | Variable expression levels of Bcl-2 family proteins [59], IAPs [2] [59], and procaspases [28] set different thresholds for apoptosis. |
| Stressory Type | Dictates which pathway is initiated, leading to fast (extrinsic) or slow (intrinsic) kinetics. | Death ligands directly activate caspase-8, while intrinsic stressors require signal integration and MOMP [2] [28]. |
| Stressory Intensity | Influences the synchronicity of the response and the rate of progression. | Higher stress levels push more cells past the apoptotic threshold simultaneously, leading to more uniform and faster population-level kinetics [60]. |
| Cellular Cross-talk | Can accelerate or delay apoptotic commitment. | In "type II" cells, weak caspase-8 activation requires amplification via the intrinsic pathway (via Bid cleavage), slowing the process [59]. Non-apoptotic pathways can also inhibit or promote apoptosis [29]. |
Quantitative Data on Kinetic Variability
Empirical data from single-cell studies provides clear evidence of the kinetic variability predicted by the molecular models.
Table 2: Experimentally Observed Kinetic Variations
| Experimental Model | Stressor | Observed Kinetic Outcome | Key Measurement |
|---|---|---|---|
| Neonatal Rat Cardiomyocytes [60] | Isoproterenol (β-adrenergic agonist) | Biphasic response: lower concentrations induced hypertrophy; higher concentrations induced apoptosis. | Single-cell tracking revealed an early, exclusive decision between hypertrophy and apoptosis ("grow-or-die" model). |
| L929 Murine Fibrosarcoma [2] [61] | TNF-α + pan-caspase inhibitor (zVAD-fmk) | Shift from apoptosis to necroptosis. | Inhibition of caspases changed the dominant cell death modality, altering morphology and kinetics entirely. |
| H4 Neuroglioma Cells [62] | Various ISR inducers (e.g., Thapsigargin, Oligomycin) | DR5-mediated apoptosis with varying latency and efficacy. | Different stressors induced DR5 mRNA and protein to different levels (2- to 4-fold), correlating with the timing and extent of caspase activation. |
| B-ALL Cell Lines [61] | Volasertib (PLK inhibitor) | Induction of ferroptosis instead of apoptosis. | Deep transfer learning of brightfield images identified a novel, non-apoptotic cell death mechanism with distinct kinetics and morphology. |
Detailed Experimental Protocols for Kinetic Analysis
To investigate variable kinetics, robust and high-resolution methodologies are required. The following protocols are cited from recent literature.
This protocol is designed to capture the early commitment of individual cells to fates like hypertrophy or apoptosis.
- Primary Cells: Neonatal rat ventricular cardiomyocytes isolated from 1-2 day old Sprague-Dawley rats.
- Culture Conditions: Cells are plated on gelatin-coated glass-bottom dishes or plates suitable for high-content microscopy.
- Stress Induction: Treatment with isoproterenol (a β-adrenergic receptor agonist) at varying concentrations (e.g., 1 µM to 10 µM) or phenylephrine.
- Live-Cell Imaging:
- Microscope: High-content microscopy system with environmental control (37°C, 5% CO₂).
- Image Acquisition: Brightfield and/or fluorescence images are captured every 30-60 minutes for 24-72 hours.
- Caspase Activity Monitoring: Use of fluorescent caspase-3/7 substrates (e.g., CellEvent Caspase-3/7 Green Detection Reagent) to precisely time apoptotic commitment.
- Data Analysis:
- Single-Cell Tracking: Automated software tracks individual cells over time, quantifying changes in cell area (hypertrophy) and caspase activation (apoptosis).
- Machine Learning: Initial cell morphological features (size, nuclear condensation) are used to train models that predict a cell's eventual fate.
This protocol uses artificial intelligence to classify cell death modes based on subtle morphological changes in brightfield images.
- Cell Line: L929 murine fibrosarcoma cells.
- Cell Death Induction:
- Apoptosis: Staurosporine (e.g., 1 µM).
- Ferroptosis: RSL3 (GPX4 inhibitor, e.g., 1 µM).
- Necroptosis: TNF-α + zVAD (pan-caspase inhibitor).
- Autophagy: Torin 1 (mTORC1/2 inhibitor).
- Image Acquisition:
- System: Incucyte Live-Cell Analysis System or equivalent.
- Parameters: Brightfield images of each well of a 384-well plate are taken every hour for 24-48 hours.
- Neural Network Training & Validation:
- Model: A pre-trained ResNet50 convolutional neural network is retrained (transfer learning) using images from the first 8 hours of induction.
- Input: Images are dissected into 224 x 224 pixel patches.
- Validation: The trained network is independently validated against a separate set of images to confirm accuracy (>99% achieved in the cited study).
- Screening Application: The validated network is then used to classify cell death in novel pharmacological screens.
The workflow for this AI-based classification is outlined below.
The Scientist's Toolkit: Essential Research Reagents
A selection of key reagents for studying apoptotic kinetics and morphology is provided in the table below.
Table 3: Key Research Reagent Solutions
| Reagent / Tool | Function in Apoptosis Research | Example Use Case |
|---|---|---|
| Fluorochrome-Labeled Inhibitors of Caspases (FLICA) [63] | Irreversibly binds to active caspases, allowing flow cytometric or microscopic detection of caspase activity in real time. | Distinguishing early apoptotic cells (caspase+) from late apoptotic/necrotic cells. Quantifying the rate of caspase activation. |
| Annexin V Conjugates [2] [61] | Binds to phosphatidylserine (PS) exposed on the outer leaflet of the plasma membrane in early apoptosis. | Used in conjunction with viability dyes (e.g., PI, 7-AAD) to stage apoptosis by flow cytometry. |
| Caspase-3/7 Fluorescent Substrates [60] | Cell-permeable reagents that become fluorescent upon cleavage by active executioner caspases. | Live-cell imaging of apoptotic commitment, as used in the cardiomyocyte fate decision protocol. |
| BH3 Mimetics (e.g., Venetoclax) [59] | Small molecules that inhibit anti-apoptotic Bcl-2 proteins, promoting MOMP and intrinsic apoptosis. | Studying the priming and threshold for intrinsic apoptosis; a therapeutic agent for blood cancers. |
| Pan-Caspase Inhibitor (zVAD-fmk) [2] [61] | Broad-spectrum, cell-permeable caspase inhibitor. | Confirming caspase-dependent apoptosis; shifting cell fate to necroptosis when combined with TNF-α. |
| Ferroptosis Inhibitor (Ferrostatin-1) [61] | Potent inhibitor of ferroptosis by reducing lipid peroxidation. | Discriminating ferroptosis from other forms of cell death, such as apoptosis. |
| Deep Transfer Learning Models [61] | AI-based classification of cell death modes from standard brightfield images. | High-throughput, label-free screening for novel death-inducing compounds and kinetic studies. |
The kinetic variability of apoptosis, influenced by cell type and stressor, is not merely a technical nuisance but a fundamental biological phenomenon rooted in the molecular architecture of the cell death machinery. Successfully navigating this challenge in the context of phase IIa and IIb research requires a multifaceted approach: leveraging single-cell analysis techniques to deconvolute population averages, understanding the specific apoptotic pathways engaged, and employing advanced tools like AI-driven morphology classification. By integrating the quantitative data, experimental protocols, and reagent knowledge outlined in this guide, researchers can design more robust experiments, accurately interpret morphological findings, and advance therapeutic strategies that target the cell death apparatus.
This technical guide provides a detailed framework for optimizing the detection of caspase-3 and PARP cleavage, key biochemical hallmarks of apoptosis. Within the context of distinguishing morphological Phase IIa (chromatin condensation) from Phase IIb (nuclear fragmentation), robust detection of these molecular markers is essential for precise apoptosis staging. This whitepaper consolidates current methodologies to guide researchers in antibody validation, sample preparation, and experimental design, enabling the generation of reliable, publication-quality data for both basic research and drug development applications.
Apoptosis, or programmed cell death, is a tightly regulated process crucial for development, tissue homeostasis, and disease pathogenesis. Morphologically, apoptosis progresses through distinct phases: Phase I (cell shrinkage), Phase IIa (chromatin condensation and margination), and Phase IIb (nuclear fragmentation and apoptotic body formation) [3]. The biochemical execution of these morphological changes is primarily mediated by a cascade of caspases.
The intrinsic (mitochondrial) and extrinsic (death receptor) apoptotic pathways converge on the activation of executioner caspase-3 and caspase-7 [29]. One of the key substrates of these caspases is Poly (ADP-ribose) Polymerase (PARP), a 116 kDa nuclear enzyme involved in DNA repair. During apoptosis, caspase-3 cleaves PARP at the Asp214-Gly215 bond, separating its DNA-binding domain (24 kDa) from its catalytic domain (89 kDa) [64] [65] [66]. This cleavage event inactivates PARP's DNA repair function, facilitating cellular disassembly and serving as a definitive biochemical marker of apoptosis commitment [66]. The detection of cleaved caspase-3 and the 89 kDa fragment of PARP provides a critical molecular readout that correlates with the morphological transitions, particularly the shift from Phase IIa to IIb, where nuclear disintegration becomes evident [3].
Figure 1: Apoptosis Signaling and Key Detection Markers. The intrinsic and extrinsic pathways converge on caspase-3/7 activation, which cleaves PARP. This molecular event is a hallmark of commitment to apoptotic cell death and correlates with the progression from morphological Phase IIa to Phase IIb [3] [29].
Antibody Validation for Specific Detection
The specificity of antibodies used in detecting caspase-3 and PARP cleavage is paramount for accurate data interpretation. Non-specific or poorly validated antibodies are a leading cause of unreliable results.
Critical Validation Parameters
- Specificity for the Cleaved Form: The ideal antibody should recognize the caspase-generated neo-epitope on the cleaved protein fragment, not the full-length protein. For PARP, this means specific reactivity to the 89 kDa C-terminal fragment generated by cleavage at Asp214, without cross-reacting with the full-length 116 kDa PARP or other PARP isoforms [64] [65].
- Species Reactivity: Confirm that the antibody has been validated for the species of your experimental model (e.g., human, mouse, rat) [64] [65].
- Application-Specific Validation: An antibody that works perfectly for western blotting may not be suitable for flow cytometry or immunohistochemistry. Always check the manufacturer's data for your intended application [66] [4].
- Lot-to-Lot Consistency: Request validation data for the specific antibody lot number you are using, as performance can vary between production lots.
Experimental Validation Strategies
- Use Controls: Include both positive and negative controls in every experiment.
- Positive Control: Lysates from cells treated with a known apoptosis inducer (e.g., 1 µM Staurosporine for 4 hours or 4-6 µM Camptothecin for 4 hours) [66] [67]. These treatments should yield a strong signal for cleaved caspase-3 and the 89 kDa cleaved PARP fragment.
- Negative Control: Lysates from healthy, untreated cells. Here, the antibody should show little to no signal for the cleaved fragments, while a separate antibody for total protein (e.g., total PARP) confirms protein integrity.
- Genetic Knockdown/Knockout: The most definitive test for antibody specificity is using cells where the target protein (e.g., PARP1) has been genetically silenced or knocked out. The cleaved-specific antibody signal should be absent in these cells even upon apoptosis induction [68].
- Blocking Peptides: Pre-incubating the antibody with the antigenic peptide used for its generation should competitively inhibit the signal. This confirms the antibody is binding its intended target.
Table 1: Key Antibody Characterization and Controls
| Target | Specific Cleavage Site | Full-Length (kDa) | Cleaved Fragment (kDa) | Recommended Positive Control Treatment |
|---|---|---|---|---|
| PARP | Asp214 [64] [65] [66] | 116 | 89 (Catalytic Domain) [64] | Staurosporine (0.1-1 µM, 4h) [67] or Camptothecin (4-6 µM, 4h) [66] |
| Caspase-3 | Multiple sites (e.g., Asp175) | 32-35 (Pro-form) | 17/19 (Active subunits) [4] | Staurosporine (0.1-1 µM, 4h) or other DNA-damaging agents |
Optimized Sample Preparation Protocols
The lability of protein epitopes, especially cleavage events, requires meticulous sample preparation to preserve the native biochemical state of the cell.
Cell Lysis and Protein Extraction
- Lysis Buffer Composition: Use a RIPA-based or similar lysis buffer supplemented with critical components to preserve protein integrity and inhibit post-lysis degradation.
- Protease Inhibitors: Essential to prevent degradation of caspases and cleaved PARP fragments by other cellular proteases. Use broad-spectrum cocktails.
- Phosphatase Inhibitors: If studying phosphorylation events (e.g., γH2AX, a DNA damage marker often co-analyzed) [38].
- Caspase Inhibitors: Generally AVOID in the lysis buffer, as they will prevent the in-vitro cleavage that you aim to detect as a readout of in-vivo apoptosis.
- Handling Conditions: Perform all steps on ice or at 4°C to slow enzymatic activity. Keep lysis time consistent (typically 20-30 minutes on ice with gentle vortexing) [67].
Protein Quantification and Loading
- Accurate Quantification: Use a reliable protein assay (e.g., BCA assay) to ensure equal loading across gels. Inaccurate loading is a common source of misinterpretation.
- Optimal Protein Load:
- 20-30 µg per lane is a standard starting point for western blots [4].
- Overloading can cause smearing, non-specific bands, and mask true cleavage events.
- Pilot Experiment: Perform a loading curve (e.g., 10, 20, 30, 40 µg) to determine the ideal amount for your specific cell system and detection system.
The Scientist's Toolkit: Essential Research Reagents
A selection of key reagents for the detection of caspase-3 and PARP cleavage is provided below.
Table 2: Essential Research Reagents for Apoptosis Detection
| Reagent / Kit Name | Specific Target | Application | Key Feature / Function |
|---|---|---|---|
| Cleaved PARP (Asp214) Antibody [64] [65] | 89 kDa PARP fragment | Western Blot (WB) | Monoclonal; specific for caspase-cleaved neo-epitope; does not recognize full-length PARP. |
| PE Mouse Anti-Cleaved PARP [66] | 89 kDa PARP fragment | Flow Cytometry | Enables quantification and sorting of apoptotic cell populations based on cleaved PARP. |
| HTRF PARP cleaved-Asp214 Kit [67] | 89 kDa PARP fragment | Homogeneous Assay (HTRF) | No-wash, high-throughput sandwich immunoassay; more sensitive than Western Blot. |
| Pro/p17-caspase-3, cleaved PARP1 Antibody Cocktail [4] | Multiple targets | Western Blot (WB) | Pre-mixed antibodies for efficient detection of key apoptosis markers in a single assay. |
| Staurosporine [67] | Broad kinase inhibitor | Positive Control | Reliable and potent apoptosis inducer for generating positive control lysates. |
| Camptothecin [66] | Topoisomerase I inhibitor | Positive Control | DNA-damaging agent used to induce apoptosis via the intrinsic pathway. |
Advanced Detection Methodologies and Workflow
While western blotting is a cornerstone technique, several other methods offer unique advantages for detecting these apoptotic markers.
Western Blotting Workflow
A standardized western blot protocol ensures consistency and reliability [4].
- Sample Preparation: Lyse cells as described in Section 3.1.
- Gel Electrophoresis: Use 4-20% gradient or 12-15% SDS-PAGE gels for optimal resolution of the 89 kDa cleaved PARP fragment and the ~17 kDa active caspase-3 subunit.
- Transfer: Standard wet or semi-dry transfer to PVDF membrane.
- Blocking: Block with 5% non-fat milk or BSA in TBST for 1 hour.
- Antibody Incubation:
- Detection: Use enhanced chemiluminescence (ECL) or fluorescent detection systems.
Alternative and Complementary Techniques
- Flow Cytometry: Allows for single-cell analysis and quantification of the percentage of apoptotic cells within a heterogeneous population using antibodies against cleaved PARP or activated caspase-3 [66]. This can be combined with other dyes (e.g., Annexin V, PI) for staging apoptosis.
- HTRF (Homogeneous Time-Resolved Fluorescence): A no-wash, high-throughput alternative to Western Blotting. HTRF assays for cleaved PARP have been demonstrated to be more sensitive, requiring fewer cells (3,125 vs. 12,500 for Western Blot) for detection [67].
- Fluorescent Reporters: Genetically encoded reporters, such as GFP mutants containing a caspase-3 cleavage motif (DEVD), can enable real-time monitoring of caspase-3 activity in live cells [69].
Figure 2: Optimized Western Blot Workflow for Apoptosis Detection. A step-by-step guide from cell harvest to data analysis, highlighting critical steps (yellow) and key reagent specifications (blue) to ensure reliable detection of cleavage events.
Data Interpretation and Troubleshooting
Quantification and Normalization
- Normalization: Always normalize the signal intensity of the cleaved fragments (e.g., 89 kDa PARP) to a housekeeping protein (e.g., β-Actin, GAPDH) to account for loading variations [4].
- Cleavage Ratio: For a more dynamic assessment, calculate the ratio of the cleaved fragment to the total protein (cleaved + full-length). This ratio indicates the extent of apoptotic progression within the cell population [4].
- Densitometry: Use software like ImageJ for band intensity analysis.
Common Pitfalls and Solutions
- No Cleavage Signal:
- Cause: Insufficient apoptosis induction; poor antibody specificity or sensitivity; over-fixed cells (for ICC).
- Solution: Titrate apoptosis inducer concentration and time; verify antibody with a solid positive control; optimize fixation.
- High Background:
- Cause: Non-specific antibody binding; insufficient blocking or washing; membrane over-dried.
- Solution: Titrate antibody concentration; ensure fresh blocking buffer and adequate wash volumes; keep membrane moist.
- Smearing or Multiple Bands:
- Cause: Protein degradation; overloading; non-specific antibody binding.
- Solution: Always work on ice with fresh protease inhibitors; run a loading curve to optimize protein amount; check antibody specificity via knockout validation.
The precise detection of caspase-3 and PARP cleavage is a powerful tool for delineating the molecular events underpinning the morphological stages of apoptosis, particularly the critical transition from Phase IIa to IIb. Success hinges on a rigorous approach encompassing stringent antibody validation, optimized and consistent sample preparation, and appropriate data interpretation. By adhering to the protocols and guidelines outlined in this whitepaper, researchers can significantly enhance the reliability and reproducibility of their apoptosis data, thereby accelerating discoveries in cell biology and the development of novel therapeutics.
In the investigation of complex cellular processes like apoptosis, relying on a single assay is a fundamentally flawed approach that can lead to misinterpretation of the cellular death modality. The limitations of the single-cell gel electrophoresis (comet) assay to accurately distinguish between apoptosis and necrosis in U937 and HepG2 cells exposed to 7β-hydroxycholesterol exemplifies this critical point. While the comet assay detected significant DNA damage in both cell lines, more specific techniques—morphological examination, flow cytometry, and DNA laddering—revealed that 7β-hydroxycholesterol induced apoptosis in U937 cells but cell lysis in HepG2 cells [70]. This demonstrates that DNA strand breaks alone cannot discriminate between different death mechanisms, as these breaks were only detectable when cell death was advanced and cells had lost membrane integrity [70].
The Nomenclature Committee on Cell Death (NCCD) has emphasized that a cell should be considered dead only when it has lost plasma membrane integrity, undergone complete disintegration, or been engulfed by neighboring cells in vivo [71]. However, determining the exact "point-of-no-return" in cell death signaling cascades remains challenging, necessitating multiple methodologically unrelated assays to accurately quantify dying and dead cells [71]. This comprehensive review examines why a multi-parametric approach is essential for distinguishing between apoptotic phases and other cell death modalities, with particular focus on morphological differences and their underlying molecular mechanisms.
Key Morphological Features Differentiating Apoptosis and Necrosis
The distinction between apoptosis and necrosis relies on recognizing characteristic morphological features that manifest through different execution mechanisms. Apoptosis represents a genetically regulated process characterized by cell shrinkage, chromatin condensation, nuclear fragmentation, and formation of apoptotic bodies that are phagocytosed without triggering inflammation [71] [29]. In contrast, necrosis typically involves cellular swelling, organellar swelling, plasma membrane rupture, and release of intracellular contents that provoke an inflammatory response [71] [29].
Advanced imaging technologies like full-field optical coherence tomography (FF-OCT) have enabled high-resolution, label-free visualization of these distinct morphological patterns. In HeLa cells undergoing doxorubicin-induced apoptosis, FF-OCT captured characteristic echinoid spine formation, cell contraction, membrane blebbing, and filopodia reorganization [22]. Conversely, ethanol-induced necrosis manifested as rapid membrane rupture, intracellular content leakage, and abrupt loss of adhesion structures [22]. These morphological differences provide the foundation for distinguishing cell death modalities, but require correlation with biochemical assays for definitive classification.
Morphological and Molecular Characteristics of Apoptosis Phase IIa and IIb
Table 1: Comparative Analysis of Apoptosis Phase IIa and IIb Features
| Characteristic | Apoptosis Phase IIa (Extrinsic/Death Receptor Pathway) | Apoptosis Phase IIb (Intrinsic/Mitochondrial Pathway) |
|---|---|---|
| Primary Initiator | External ligands (TNF-α, FasL) binding death receptors | Internal disturbances (DNA damage, oxidative stress) |
| Key Molecular Complex | Death-Inducing Signaling Complex (DISC) | Apoptosome |
| Initiator Caspases | Caspase-8, Caspase-10 | Caspase-9 |
| Effector Caspases | Caspase-3, -6, -7 | Caspase-3, -6, -7 |
| Mitochondrial Involvement | Indirect (via Bid cleavage) | Direct (MPTP opening) |
| Regulatory Proteins | FADD, TRADD | Bcl-2 family, cytochrome c, APAF1 |
| Nuclear Morphology | Chromatin condensation, nuclear fragmentation | Chromatin condensation, nuclear fragmentation |
| Cellular Morphology | Membrane blebbing, cell shrinkage | Membrane blebbing, cell shrinkage |
| Key Molecular Switch | Caspase-8 activation level | Bax/Bak activation balance with Bcl-2 |
The Molecular Architecture of Cell Death Signaling Pathways
The intricate signaling networks governing apoptotic and necrotic cell death pathways involve sophisticated molecular cascades with significant crosstalk. Understanding these pathways is essential for accurate interpretation of morphological findings and assay results.
Necroptosis Signaling Pathway
Necroptosis represents a programmed form of necrosis with distinct molecular regulation. This pathway often serves as a backup cell death mechanism when apoptosis is inhibited.
Essential Research Reagent Solutions for Cell Death Analysis
Table 2: Key Research Reagents for Cell Death Analysis
| Reagent/Category | Specific Examples | Primary Function | Application Context |
|---|---|---|---|
| Death Inducers | 7β-hydroxycholesterol [70], Doxorubicin [22], TNF-α [72] [29], Ethanol [22] | Induce specific cell death modalities | Apoptosis vs. necrosis studies; pathway-specific activation |
| Caspase Inhibitors | Z-VAD-FMK (pan-caspase inhibitor) | Suppress apoptotic caspase activity | Distinguishing apoptosis from caspase-independent death |
| Necroptosis Inducers | TNF-α + SMAC mimetic + Z-VAD-FMK [72] | Activate RIPK1/RIPK3/MLKL pathway | Necroptosis studies; apoptosis inhibition scenarios |
| Fluorescent Stains | Propidium iodide, Annexin V-FITC, Hoechst stains | Differentiate live, apoptotic, and necrotic cells | Flow cytometry and fluorescence microscopy |
| Antibodies | Anti-phospho-MLKL, Anti-cleaved caspase-3, Anti-PARP | Detect specific pathway activation markers | Immunofluorescence, Western blotting |
| Cell Lines | U937 (human monocytic) [70], HepG2 (human hepatocarcinoma) [70], HeLa (human cervical cancer) [22] | Model systems for cell death studies | Pathway characterization; drug screening |
| Advanced Imaging Systems | Full-field OCT [22], Electron microscopy [71] | Label-free morphological analysis | High-resolution structural assessment |
Experimental Protocols for Comprehensive Cell Death Assessment
Multi-Parametric Assessment of Cell Death Modalities
A robust experimental approach for distinguishing apoptosis phases and other cell death mechanisms should incorporate complementary methodologies that assess different cellular parameters:
Morphological Analysis Protocol
- Light Microscopy: Perform time-lapse imaging of unstained cells to monitor gross morphological changes including cell shrinkage, membrane blebbing, and swelling [71].
- FF-OCT Imaging: Utilize full-field optical coherence tomography for label-free, high-resolution visualization of subcellular morphological features. Protocol: Image cells at 20-minute intervals following treatment using a custom-built time-domain FF-OCT system with broadband halogen light source (650 nm center wavelength) and 40× water-immersion objectives (NA: 0.8) [22].
- Electron Microscopy: Fix cells with glutaraldehyde, post-fix in osmium tetroxide, and embed in resin for ultrastructural analysis of organellar changes [71].
Membrane Integrity Assessment
- Flow Cytometry with Vital Dyes: Stain cells with propidium iodide (5 μg/mL) and Annexin V-FITC (according to manufacturer's instructions) in binding buffer. Analyze by flow cytometry within 1 hour of staining to distinguish live (Annexin V-/PI-), early apoptotic (Annexin V+/PI-), late apoptotic (Annexin V+/PI+), and necrotic (Annexin V-/PI+) populations [71].
- Trypan Blue Exclusion: Mix cell suspension with 0.4% trypan blue solution (1:1 dilution) and count unstained (viable) versus stained (non-viable) cells using a hemocytometer [71].
Biochemical Assays
- DNA Fragmentation Analysis: Extract genomic DNA and separate by agarose gel electrophoresis (1.5-2% agarose) to detect internucleosomal cleavage (DNA laddering) characteristic of apoptosis [70] [71].
- Comet Assay: Suspend cells in low-melting-point agarose (0.7%), layer onto slides, lyse overnight (2.5M NaCl, 100mM EDTA, 10mM Tris, 1% Triton X-100, pH 10), and perform electrophoresis under alkaline conditions (pH >13). Score DNA damage by tail moment and percentage of heavily damaged nuclei [70].
- Caspase Activity Assays: Lyse cells and incubate with fluorogenic caspase substrates (e.g., Ac-DEVD-AFC for caspase-3) at 37°C for 1-2 hours. Measure fluorescence release (excitation 400 nm, emission 505 nm) [71].
Molecular Pathway Analysis
- Western Blotting: Separate proteins by SDS-PAGE, transfer to membranes, and probe with antibodies against cleaved caspases, PARP, phospho-MLKL, and other pathway-specific markers [72] [29].
- Immunofluorescence Staining: Fix cells with 4% paraformaldehyde, permeabilize with 0.1% Triton X-100, block with 5% BSA, and incubate with primary antibodies followed by fluorophore-conjugated secondary antibodies. Counterstain with DAPI and image by confocal microscopy [71].
Integrated Data Interpretation: Building a Compelling Morphological Argument
The critical integration of multiple data streams enables accurate discrimination between apoptosis phases IIa and IIb and other cell death modalities. When DNA fragmentation is detected via comet assay but occurs without characteristic caspase activation and with simultaneous loss of membrane integrity, the cell death is likely necrotic rather than apoptotic [70]. Similarly, when morphological analysis reveals cell swelling and rapid membrane rupture instead of controlled shrinkage and blebbing, necrosis should be suspected even if some DNA fragmentation is present [22].
The complex crosstalk between cell death pathways necessitates this multi-parametric approach. For instance, caspase-8 inhibition can divert cells from apoptosis to necroptosis, engaging RIPK1/RIPK3/MLKL signaling instead of the classical apoptotic cascade [72] [29]. In such scenarios, only the combined assessment of caspase activity, MLKL phosphorylation, and cellular morphology can accurately identify the dominant death mechanism.
Building a compelling morphological argument requires correlating structural changes with specific molecular events. The appearance of echinoid spines and membrane blebbing observed via FF-OCT correlates with caspase activation and represents definitive apoptotic morphology [22]. Conversely, abrupt adhesion loss and cytoplasmic leakage indicate necrotic death, typically associated with MLKL oligomerization or catastrophic metabolic failure [22]. By systematically integrating data from complementary assays, researchers can construct robust conclusions about cell death mechanisms that withstand critical scientific scrutiny.
The study of programmed cell death, or apoptosis, represents a cornerstone of oncological research, providing critical insights into the mechanisms of cancer development and the efficacy of therapeutic agents. Central to this field is the precise identification of apoptotic stages, particularly the morphological distinctions between phase IIa (characterized by chromatin condensation and margination) and phase IIb (marked by nuclear fragmentation and apoptotic body formation) [3]. These morphological landmarks are not merely descriptive; they are fundamental biomarkers that indicate the commitment to and execution of cell death, informing researchers about the potency and mechanism of action of experimental treatments. However, the validity of this research is entirely dependent on the biological fidelity of the models employed—the cancer cell lines themselves.
This analysis examines a critical case study where the use of biologically inappropriate cancer cell lines generated problematic data in the context of platinum-based chemotherapy response, ultimately misleading the scientific community. By integrating this case with the essential principles of apoptotic morphology detection, this guide provides researchers and drug development professionals with a framework for critically evaluating model systems, implementing robust morphological assays, and interpreting complex cell death data within the technologically sophisticated landscape of modern cancer research.
Fundamental Concepts: Apoptosis Morphology and Detection
Morphological Hallmarks of Apoptotic Phases
Apoptosis progresses through a series of distinct morphological phases, each with characteristic cellular and nuclear changes. Accurate discrimination between these phases, particularly Phase IIa and IIb, is crucial for correct biological interpretation.
Table 1: Morphological Characteristics of Apoptosis Phases IIa and IIb
| Feature | Phase IIa | Phase IIb |
|---|---|---|
| Nuclear Changes | Chromatin highly condensed and marginalized (pyknosis); assembled on inner nuclear membrane | Nuclei lysed into fragments (karyorrhexis) [3] |
| Cellular Changes | Cell shrinkage, dense cytoplasm, decreased water content, increased eosinophilia [3] | Cytoskeleton degradation, membrane invaginations/sprouting [3] |
| Key Hallmark | Chromatin margination [3] | Formation of membrane-coated apoptotic bodies [3] |
| Primary Detection Method | Transmission Electron Microscopy (best) [3] | Light Microscopy, Fluorescence/Confocal Microscopy [3] |
Technical Approaches for Detecting Apoptosis
A purpose-dependent array of techniques is available for apoptosis detection, each with specific advantages, limitations, and applicability to different apoptotic stages.
Microscopy-Based Morphological Analysis: Direct visualization remains a definitive method for identifying apoptotic cells. Light microscopy after staining (e.g., Hematoxylin and Eosin) is mainly suitable for observing Phase IIb apoptosis, revealing cell shrinking, rounding, and apoptotic bodies [3]. Transmission electron microscopy (TEM) is considered the gold standard for ultrastructural assessment, capable of revealing features across all phases, including cavitations in Phase I, chromatin margination in Phase IIa, and apoptotic bodies in Phase IIb [3]. Fluorescence or confocal microscopy using DNA-binding dyes like Hoechst 33342, DAPI, or Acridine Orange allows for indirect assessment of nuclear and chromatin conditions based on fluorescence intensity and distribution, and is primarily suitable for observing Phase IIb [3].
Biochemical and Molecular Techniques: These methods detect biochemical signatures of apoptosis but may not always distinguish between early and late events. The TUNEL assay (Terminal deoxynucleotidyl transferase dUTP Nick End Labeling) identifies DNA fragmentation by labeling the 3'-OH ends of DNA fragments, making it a relatively sensitive and specific method for quantifying apoptotic cells, though it is more suitable for detecting late-stage apoptosis and can yield false-positive results without proper controls [3]. DNA gel electrophoresis detects the characteristic "ladder" pattern of internucleosomal DNA cleavage (180-200 bp and multiples), a hallmark biochemical indicator of apoptosis. However, it is only semi-quantitative, cannot localize apoptotic cells, and is best for observing large-scale apoptosis during middle and late stages [3]. Analysis of mitochondrial membrane potential using lipophilic cationic dyes (e.g., JC-1) serves as an early marker for the intrinsic apoptotic pathway. A decrease in potential prevents dye accumulation in the matrix, shifting fluorescence from red (aggregate) to green (monomer); the red/green ratio indicates mitochondrial health [3].
Case Study: Problematic Models in Ovarian Cancer Platinum-Response Research
The Central Problem: Use of Non-Representative Cell Lines
A seminal 2025 study by Stordal and colleagues exposed a critical flaw in the foundational research of ovarian cancer (OVCA) and platinum-based chemotherapy resistance [73]. For years, the field had relied on data generated from two commonly used cell lines, SKOV3 and A2780, which were considered models for high-grade serous ovarian carcinoma (HGSOC)—the most common and lethal OVCA subtype [73]. However, this study definitively demonstrated that these cell lines are biologically inappropriate for this purpose; SKOV3 is likely a model of ovarian clear cell carcinoma (OCCC), and A2780 is likely endometrioid ovarian carcinoma (EOC) [73]. This misclassification meant that a substantial body of literature on platinum resistance mechanisms was built upon genetically and physiologically inaccurate models, potentially misleading therapeutic development and biological understanding for HGSOC.
Impact on Apoptosis and Therapeutic Response Data
The use of these non-representative models directly compromised the interpretation of cell death data in response to platinum agents (cisplatin, carboplatin). These drugs primarily induce apoptosis by forming DNA adducts that trigger cell cycle arrest and activate the intrinsic apoptotic pathway [73]. Research using SKOV3 and A2780 cell lines produced data on IC50 values, gene expression signatures, and apoptotic markers that were not representative of the true response in HGSOC tumors. This created a distorted picture of the "cell-intrinsic" factors driving platinum response and resistance, as the observed phenotypes were conflated with the unique biology of different OVCA subtypes [73]. Consequently, mechanisms identified in these models, such as alterations in DNA damage repair, may not be the dominant drivers of resistance in authentic HGSOC, hindering the identification of more relevant targets.
A Path Forward: A Curated Cell Line Resource
To correct this problem, the 2025 study established a robust, quantitative database of cisplatin and carboplatin response across 36 ovarian cancer cell lines, meticulously characterized by subtype [73]. This resource allows researchers to select models based on their authentic histotype and known platinum sensitivity, ensuring that subsequent apoptosis research is biologically relevant. The study found that cell lines largely fell into two categories: those with IC50 values well above the clinically achievable dose (Cmax), and those with IC50 values below it, providing clear benchmarks for defining sensitivity and resistance in vitro [73].
Integrated Experimental Framework: Combining Model Validation with Morphological Analysis
Phase 1: Validation of Model System and Baseline Assays
Before initiating apoptosis studies, the authenticity and drug response profile of the cell line must be established.
Protocol 1.1: Cell Line Authentication and Culture
- Method: Perform Short Tandem Repeat (STR) profiling to confirm cell line identity and conduct regular mycoplasma testing [73]. Culture cells according to established, standardized media formulations specific to each cell line (e.g., RPMI-1640 with 10% FBS for OVCAR8; DMEM with 10% FBS for CAOV3) [73].
- Rationale: Prevents contamination and genetic drift, ensuring the model's genotype and phenotype remain consistent throughout the study. Using correct media is crucial for maintaining expected growth and response characteristics.
Protocol 1.2: Platinum Drug Dose-Response Assay
- Method: Plate cells in 96-well plates at optimized densities (e.g., 2,500 cells/well). Treat cells 24 hours post-plating with a 10-point dose range of cisplatin (60 nM - 400 µM) or carboplatin (980 nM - 500 µM) to accurately capture the point of inflection. After 72 hours, measure cell viability using CellTiter-Glo 2.0 assay to determine the half-maximal inhibitory concentration (IC50) [73].
- Rationale: Establishes a baseline sensitivity profile for the cell line, allowing researchers to classify it as platinum-sensitive or resistant relative to the clinical Cmax and select appropriate doses for subsequent apoptosis assays.
Model Validation Workflow: This diagram outlines the critical steps for validating a cancer cell line model before initiating apoptosis studies.
Phase 2: Multimodal Apoptosis Detection and Morphological Staging
Once a validated model with a known drug response is established, detailed apoptosis analysis can begin.
Protocol 2.1: Concurrent Staining for Morphological Staging (Phase IIa vs. IIb)
- Method: Seed cells on chambered slides and treat with platinum agent at the determined IC50. After 24-48 hours, stain cells simultaneously with Hoechst 33342 (5 µg/mL) to visualize nuclear chromatin and MitoTracker Red CMXRos (100 nM) to assess mitochondrial membrane potential as an early apoptotic indicator. Fix cells and image using a fluorescence or confocal microscope with appropriate filters [3].
- Rationale: Hoechst staining allows for clear discrimination between Phase IIa (condensed, marginalized chromatin) and Phase IIb (fragmented nuclei). Combining this with a mitochondrial integrity marker provides a temporal correlation between early (mitochondrial) and mid-stage (nuclear) apoptotic events.
Protocol 2.2: Quantification of Apoptosis via Flow Cytometry and TUNEL
- Method: For flow cytometry, harvest treated and untreated cells and stain with Annexin V-FITC and Propidium Iodide (PI) according to manufacturer's protocol. For TUNEL assay, use a commercial kit to label DNA strand breaks in fixed cells, which can be analyzed by flow cytometry or fluorescence microscopy [3].
- Rationale: Annexin V/PI staining distinguishes early apoptotic (Annexin V+/PI-), late apoptotic/necrotic (Annexin V+/PI+), and viable cells. The TUNEL assay provides a specific measure of late-stage apoptosis characterized by DNA fragmentation, complementing the morphological data from Protocol 2.1.
Protocol 2.3: Molecular Validation via qRT-PCR of Apoptotic Genes
- Method: Extract total RNA from treated cells. Perform reverse transcription followed by quantitative PCR (qRT-PCR) to measure the transcript levels of key executioner caspases (e.g., caspase-3, -8, -9, -10) and regulators (e.g., Bcl-2 family members) [3] [74].
- Rationale: This molecular readout confirms the activation of apoptotic pathways at the transcriptional and translational level, linking the observed morphological changes to specific gene expression patterns.
Multimodal Apoptosis Detection: This workflow shows the parallel application of different assays to provide a comprehensive analysis of apoptotic progression.
The Scientist's Toolkit: Essential Reagents and Materials
Table 2: Key Research Reagent Solutions for Apoptosis Studies
| Reagent/Material | Function | Key Consideration |
|---|---|---|
| Validated Cell Lines (e.g., OVCAR3, OVCAR4) | Biologically relevant in vitro model for studying disease-specific mechanisms. | Must be authenticated (STR profiled) and tested for mycoplasma. Select based on correct histotype and known drug response [73]. |
| Platinum Compounds (Cisplatin, Carboplatin) | DNA-damaging chemotherapeutic agents to induce apoptosis via the intrinsic pathway. | Prepare fresh stock solutions for each experiment. Use a wide dose range (nM to µM) to accurately determine IC50 [73]. |
| Hoechst 33342 / DAPI | Cell-permeable fluorescent dyes that bind AT-rich regions of DNA for nuclear morphology assessment. | Allows discrimination between Phase IIa (chromatin margination) and Phase IIb (nuclear fragmentation) [3]. |
| MitoTracker Red CMXRos | Cell-permeable dye that accumulates in active mitochondria based on membrane potential. | Loss of signal is an early marker of intrinsic apoptosis, preceding nuclear morphology changes [3]. |
| Annexin V-FITC / PI Kit | Flow cytometry-based kit to distinguish apoptotic (Annexin V+) from necrotic (PI+) cells. | Crucial for quantifying the percentage of cells in early vs. late apoptosis/necrosis. |
| TUNEL Assay Kit | Enzymatic labeling of DNA strand breaks (3'-OH ends), a hallmark of late-stage apoptosis. | Highly sensitive for detecting late apoptosis but requires careful controls to avoid false positives [3]. |
| Caspase & Bcl-2 Family Antibodies | Proteins for Western Blot or immunofluorescence to detect cleavage/expression of apoptotic regulators. | Molecular confirmation of pathway activation (e.g., Caspase-3 cleavage, Bax/Bcl-2 ratio) [29]. |
Navigating Cell Death Complexity: Crosstalk and Future Directions
A critical challenge in modern apoptosis research is the understanding that cell death pathways do not operate in isolation. There is intricate crosstalk among different mechanisms, including apoptosis, autophagy, ferroptosis, necroptosis, and pyroptosis [29]. A cell's fate is determined by a complex integration of signals from these interconnected pathways. For instance, a cell subjected to platinum chemotherapy may initiate apoptotic signaling, but concurrent activation of pro-survival pathways like autophagy can alter the final outcome [29]. This interplay means that a morphological snapshot must be interpreted with caution, as the observed state is the net result of competing life-and-death signals.
Future research must therefore adopt a more integrated approach. This involves:
- Moving beyond single-point assays to dynamic, live-cell imaging that can track morphological transitions in real time.
- Utilizing multiplexed assays that can probe multiple death pathways simultaneously within the same cell population.
- Correlating in vitro morphological data with in vivo tumor response through advanced imaging and analysis of patient-derived models.
By combining rigorously validated cell models with sophisticated, multimodal analytical techniques, researchers can generate more reliable, interpretable, and clinically relevant data on cancer cell death, ultimately accelerating the development of more effective therapies.
Beyond Apoptosis: Validating Phase-Specific Morphology Against Other Cell Death Mechanisms
Within the framework of research into the morphological differences between apoptosis phase IIa and IIb, establishing a definitive standard for phase assignment is paramount. Apoptosis, or programmed cell death, is a tightly regulated process essential for development and tissue homeostasis, characterized by a cascade of morphological and biochemical events [2]. The execution phase of apoptosis is often subdivided based on distinct cellular alterations, where phases IIa and IIb represent critical transitions marked by specific morphological features such as cell shrinkage, membrane blebbing, and nuclear fragmentation [75]. Relying on a single detection method introduces the risk of misclassification, given the intricate and sometimes overlapping nature of cell death pathways [76] [40]. This guide details the gold-standard methodology of correlating precise morphological assessment with definitive biochemical markers to achieve unambiguous phase assignment, providing researchers and drug development professionals with a robust experimental framework.
Core Morphological and Biochemical Hallmarks of Apoptosis
The definition of apoptosis, particularly its execution phase, rests upon a constellation of hallmark features. Morphological changes remain the gold standard for its ultimate identification and classification [43] [40]. These morphological alterations are driven by specific, measurable biochemical events.
Table 1: Key Hallmarks of Apoptotic Cell Death
| Feature Category | Key Characteristics | Primary Regulators / Markers |
|---|---|---|
| General Morphology | Cell shrinkage, chromatin condensation, pyknosis, karyorrhexis, budding forming apoptotic bodies [76] [24]. | - |
| Membrane Alterations | Enhanced membrane permeability, plasma membrane blebbing, phosphatidylserine (PS) externalization [76] [43]. | Annexin V (binds PS), propidium iodide (PI) [77] [43]. |
| Mitochondrial Changes | Loss of mitochondrial transmembrane potential (ΔΨm), mitochondrial atrophy [76] [43]. | BAX/BAK, BCL-XL, Cytochrome c release; TMRM, Rh123 dyes [77] [2]. |
| Nuclear Events | Internucleosomal DNA fragmentation, nuclear condensation and fragmentation [43] [24]. | Caspase-activated DNases; TUNEL assay, Sub-G1 DNA content [43] [75]. |
| Protease Activation | Selective cleavage of cellular substrates, caspase cascade activation [2] [24]. | Initiator Caspases (8, 9), Executioner Caspases (3, 6, 7); FLICA assays [77] [2]. |
The biochemical markers provide a causal link to the observed morphology. For instance, the activation of caspases, a family of cysteine proteases, is an absolute biomarker for the execution of apoptosis [40]. They selectively cleave vital cellular substrates, leading to the characteristic apoptotic morphology, including the activation of endonucleases that cause internucleosomal DNA fragmentation [24]. The Bcl-2 family of proteins serves as critical regulators, controlling mitochondrial events such as the release of cytochrome c, which initiates a caspase cascade [2] [24].
Experimental Protocols for Correlative Analysis
Unambiguous phase assignment requires a multi-parameter approach, ideally combining several assays on the same sample. Flow and laser scanning cytometry are platforms of choice for this, as they allow for high-throughput, single-cell analysis and the correlation of multiple cellular events [77] [43] [40].
Multiparameter Flow Cytometry Using Annexin V/PI and FLICA
This protocol allows for the simultaneous assessment of phosphatidylserine externalization (an early event), caspase activation (a committed step), and loss of membrane integrity (a late event).
Detailed Methodology [77]:
- Cell Preparation: Collect cell suspension (2.5×10⁵ – 2×10⁶ cells/mL) in a FACS tube and centrifuge at 1100 rpm for 5 minutes at room temperature (RT). Wash the pellet by resuspending in 1-2 mL of PBS and repeat centrifugation.
- Annexin V Staining: Discard the supernatant and resuspend the cell pellet in 100 µL of Annexin V Binding Buffer (AVBB). Add the recommended amount of fluorochrome-conjugated Annexin V (e.g., Annexin V-FITC).
- Incubation: Incubate for 15 minutes at RT, protected from direct light.
- Caspase Detection (FLICA): Without washing, add 3 µL of the FLICA working solution (e.g., FAM-VAD-FMK, a poly-caspase inhibitor) directly to the tube.
- Incubation: Incubate for 60 minutes at +37°C, protected from light. Gently agitate cells every 20 minutes.
- Washing: Add 2 mL of PBS and centrifuge at 1100 rpm for 5 minutes at RT. Discard the supernatant and repeat the wash step.
- Membrane Integrity Staining: Resuspend the cell pellet in 100 µL of PI staining mix (diluted in AVBB). Incubate for 3-5 minutes.
- Analysis: Add 500 µL of PBS and analyze immediately on a flow cytometer using 488 nm excitation. Collect fluorescence emissions appropriate for FITC (Annexin V/FLICA) and PI.
Data Interpretation:
- Viable Cells (Phase I): Annexin V⁻ / FLICA⁻ / PI⁻
- Early Apoptotic (Phase IIa): Annexin V⁺ / FLICA⁺ / PI⁻
- Late Apoptotic (Phase IIb): Annexin V⁺ / FLICA⁺ / PI⁺
- Necrotic/Damaged: Annexin V⁺ / FLICA⁻ / PI⁺
Assessment of Mitochondrial Transmembrane Potential (ΔΨm) and DNA Fragmentation
This protocol correlates an early apoptotic event (loss of ΔΨm) with a later nuclear event (DNA fragmentation).
Detailed Methodology [77] [43]:
- ΔΨm Staining: Collect and wash cells as in step 3.1. Resuspend the pellet in 100 µL of a TMRM staining mix (e.g., 1 µM working solution in PBS).
- Incubation: Incubate for 20 minutes at +37°C, protected from light.
- Cell Fixation: Add 500 µL PBS and centrifuge. Discard supernatant and fix cells in 1 mL of cold 70% ethanol for at least 2 hours at -20°C.
- DNA Staining: Centrifuge the fixed cells and thoroughly resuspend the pellet in 1 mL of DNA staining mixture (PBS containing 30 µg/mL RNase A and 16 µg/mL Propidium Iodide).
- Incubation: Incubate for 30 minutes at RT, protected from light.
- Analysis: Analyze on a flow cytometer. Use 488 nm excitation; TMRM fluorescence is collected at ~575 nm, and PI fluorescence (DNA content) is collected at >600 nm.
Data Interpretation: Cells displaying a loss of TMRM fluorescence (ΔΨm collapse) and a sub-diploid DNA content (sub-G1 peak) are classified as being in an advanced apoptotic stage (late IIa/IIb).
Diagram 1: Multiparameter staining workflow and phase assignment logic.
The Scientist's Toolkit: Essential Reagents and Materials
A successful correlative analysis depends on key reagents, each with a specific function in probing the apoptotic cascade.
Table 2: Research Reagent Solutions for Apoptosis Detection
| Reagent / Assay | Function / Target | Key Examples & Notes |
|---|---|---|
| Fluorochrome-conjugated Annexin V | Binds to phosphatidylserine (PS) exposed on the outer leaflet of the plasma membrane, an early marker. | Annexin V-FITC, Annexin V-APC. Requires calcium-containing buffer [77] [43]. |
| Caspase Inhibitors (FLICA) | Fluorochrome-labeled inhibitors that covalently bind to active caspase enzymes, indicating commitment to apoptosis. | FAM-VAD-FMK (pan-caspase), also specific inhibitors for caspase-8 (Z-IETD-FMK) or -9 (Q-LEHD-OPh) [76] [77]. |
| Mitochondrial Potential Probes | Lipophilic cationic dyes that accumulate in active mitochondria; loss of fluorescence indicates ΔΨm dissipation. | TMRM, Tetramethylrhodamine ethyl ester (TMRE), Rhodamine 123 (Rh123) [77] [43]. |
| DNA Binding Dyes | Assess plasma membrane integrity and nuclear DNA content. Distinguishes live from dead cells and identifies sub-G1 population. | Propidium Iodide (PI), 7-Aminoactinomycin D (7-AAD). PI is impermeant to live and early apoptotic cells [77] [43]. |
| TUNEL Assay Reagents | Enzymatically labels DNA strand breaks (a hallmark of apoptosis) with fluorochromes for highly specific detection. | Terminal deoxynucleotidyl transferase (TdT) with fluorescently-labeled dUTP. Considered a definitive marker for advanced apoptosis [43] [24]. |
Data Integration and Phase Assignment Logic
Correlating data from the aforementioned protocols enables a definitive assignment of cells to phases IIa and IIb. The transition is marked by the irreversible activation of executioner caspases and the subsequent loss of plasma membrane integrity.
Diagram 2: Biochemical and morphological signatures define phase transitions.
- Assignment to Phase IIa (Early Execution): A cell is assigned to Phase IIa when it demonstrates caspase activation (FLICA⁺) coupled with the classic early morphological proxy of phosphatidylserine externalization (Annexin V⁺), while maintaining an intact plasma membrane (PI⁻). A loss of mitochondrial transmembrane potential (ΔΨm) is also a frequent correlative event at this stage. The morphology is dominated by cell shrinkage and chromatin condensation [76] [40] [24].
- Assignment to Phase IIb (Late Execution): A cell progresses to Phase IIb when, in addition to the markers of Phase IIa (Annexin V⁺, FLICA⁺), it displays loss of plasma membrane integrity (PI⁺) and definitive evidence of nuclear DNA fragmentation (a positive TUNEL assay or a sub-G1 DNA content) [43]. The predominant morphology is the formation of apoptotic bodies [76] [75].
This multi-parameter, correlative approach is the only way to unambiguously distinguish between Phase IIa and IIb, as it links the causative biochemical event (caspase activation) with its structural consequences.
Advanced Techniques and Future Directions
Emerging technologies are enhancing our ability to perform these correlative analyses with greater speed and subtlety.
- Laser Scanning Cytometry (LSC): This microscope-based cytofluorometer combines the statistical power of flow cytometry with the morphological validation of image analysis. A key advantage is the ability to relocate ("compusort") measured cells for visual inspection after staining, providing a direct link between fluorescence data and cellular morphology [43].
- AI-Assisted Phase-Contrast Microscopy: Machine learning models can now be trained to classify apoptotic cells directly from phase-contrast images. These AI models learn to detect subtle changes in refractive indices that correlate with biochemical events like caspase activation and DNA fragmentation, offering a potential for high-throughput, label-free screening in the future [75].
In the precise study of apoptotic phases, particularly the distinction between IIa and IIb, a singular methodological approach is insufficient. The gold standard remains the strategic correlation of definitive biochemical markers—especially caspase activation and DNA fragmentation—with the hallmark morphological features of each stage. The integrated experimental protocols detailed in this guide, leveraging the power of multiparameter cytometry, provide a robust framework for unambiguous phase assignment. This rigorous methodology is fundamental for advancing basic research into the mechanisms of cell death and for the accurate evaluation of therapeutic compounds designed to modulate apoptosis in diseases such as cancer.
Within the broader study of morphological differences between apoptotic phases, the distinct stage known as Phase IIb apoptosis presents a unique set of cellular alterations. This phase is characterized by the formation of apoptotic bodies, a process that stands in stark contrast to the morphological endpoints of other programmed cell death (PCD) modalities such as pyroptosis, necroptosis, and autophagy. Understanding these distinctions is critical for researchers and drug development professionals who rely on morphological assessment to identify cell death pathways in experimental and therapeutic contexts. This technical guide provides a detailed comparison of these death mechanisms, supported by structured data, experimental protocols, and visualizations, to serve as a definitive resource for morphological differentiation in cell death research.
Programmed cell death (PCD) is a fundamental biological process crucial for maintaining homeostasis, regulating development, and eliminating damaged or infected cells [29] [28]. While multiple forms of PCD have been identified, each follows a distinct molecular pathway and exhibits characteristic morphological features that serve as hallmarks for their identification [78]. Apoptosis, one of the most extensively studied forms of PCD, is itself a multi-phase process. Within the morphological classification of apoptosis, Phase IIb represents the terminal stage of cellular disintegration, marked by the formation of membrane-bound apoptotic bodies [3].
The broader thesis context of differentiating apoptosis Phase IIa from Phase IIb centers on the transition from nuclear fragmentation to cellular fragmentation. Phase IIa is predominantly characterized by nuclear changes, including chromatin condensation and margination, and nuclear fragmentation (karyorrhexis) [3]. The progression to Phase IIb involves the culmination of the apoptotic process through dramatic structural changes to the entire cell, resulting in the packaging of cellular contents into apoptotic bodies for efficient phagocytosis [3] [2]. This stands in sharp contrast to the pro-inflammatory death processes of pyroptosis and necroptosis, or the degradative process of autophagy. Accurate morphological discrimination is therefore essential for interpreting experimental results, understanding disease pathogenesis, and developing targeted therapies that modulate specific cell death pathways [79].
Morphological Hallmarks of Apoptotic Phase IIb
Apoptotic Phase IIb, also referred to as the stage of "apoptotic body formation," is the morphological endpoint of the apoptotic cascade [3]. The defining event of this phase is the systematic disintegration of the cell into discrete, membrane-bound vesicles containing condensed cytoplasm, organelles, and nuclear fragments.
Key morphological characteristics include:
- Membrane Blebbing and Protrusions: The cell membrane undergoes dynamic, zeiotic blebbing, forming protrusions that eventually separate from the main cell body [3] [2].
- Formation of Apoptotic Bodies: The cell splits into numerous, small, membrane-bound vesicles known as apoptotic bodies. These bodies contain various fragments of organelles and chromatin with intact structures [28] [3].
- Cellular Shrinkage and Loss of Cell-Cell Contacts: The cell continues to shrink and detach from its neighboring cells and the extracellular matrix [2].
- Preservation of Organelle Integrity: Unlike necrotic processes, the organelles within apoptotic bodies often retain their structural integrity, though they are slated for degradation [28].
- Absence of Inflammation: Crucially, the plasma membrane remains intact throughout the process, preventing the release of intracellular contents and thereby avoiding an inflammatory response. The apoptotic bodies are rapidly phagocytosed by neighboring phagocytic cells [28] [79].
Table 1: Core Morphological Features of Apoptotic Phase IIb
| Feature | Description | Technical/Observational Note |
|---|---|---|
| Apoptotic Bodies | Small, membrane-bound vesicles formed from cellular disintegration | Visible under light microscopy after HE staining; key diagnostic feature [3] |
| Membrane Integrity | Maintained until phagocytosis | Prevents inflammatory response; distinguishes it from necroptosis/pyroptosis [79] |
| Nuclear Morphology | Pyknotic or fragmented nuclei packaged within bodies | Observed via fluorescence microscopy with Hoechst/DAPI staining [3] |
| Cellular Volume | Markedly decreased, cell is shrunken | Observed via electron microscopy [3] |
| Surface Changes | Phosphatidylserine externalization | "Eat-me" signal detectable by Annexin V binding [28] [3] |
Comparative Morphology of Major PCD Pathways
Pyroptosis
Pyroptosis is an inflammatory form of PCD triggered by microbial infection or danger signals, and it is molecularly executed by gasdermin family proteins [80] [78].
Morphological Characteristics:
- Cell Swelling: The cell swells, a feature shared with necroptosis but not with apoptotic shrinkage [80].
- Pore Formation in Plasma Membrane: Activated gasdermin proteins (e.g., GSDMD) form large pores in the plasma membrane, leading to a loss of ionic gradients [80] [81].
- Membrane Rupture and Release of Contents: The cell eventually lyses, releasing pro-inflammatory cytokines like IL-1β and IL-18, and other cellular contents that trigger a potent inflammatory response [80] [82].
- Moderate Chromatin Condensation: The nucleus undergoes condensation, but this is generally less pronounced than in apoptosis and occurs alongside the other inflammatory features [80].
Necroptosis
Necroptosis is a regulated form of necrosis that can serve as an alternative death pathway when apoptosis is blocked [28] [78].
Morphological Characteristics:
- Early Cell Swelling (Oncosis): The cell and its organelles swell significantly, a hallmark feature distinguishing it from apoptosis [28] [79].
- Organelle Swelling and Dysfunction: Mitochondria, endoplasmic reticulum, and Golgi apparatus become dilated and dysfunctional [28].
- Plasma Membrane Rupture: The plasma membrane ultimately ruptures, leading to the spillage of intracellular components into the extracellular space [80].
- Mild Chromatin Condensation: Some chromatin condensation may occur, but it is not as severe or organized as in apoptosis. The nucleus may undergo pyknosis and karyorrhexis [28] [79].
- Prominent Inflammatory Response: The release of damage-associated molecular patterns (DAMPs) due to membrane rupture incites a strong inflammatory immune response [80].
Autophagic Cell Death
Autophagic cell death (Type II cell death) is characterized by the prominent accumulation of autophagic vacuoles in the cytoplasm [29] [28].
Morphological Characteristics:
- Abundant Autophagic Vacuoles: The cytoplasm is filled with double-membraned autophagosomes and single-membraned autolysosomes, which are the most definitive morphological markers [29] [28].
- No Significant Chromatin Condensation: The nucleus may appear relatively normal or show only minor condensation, a key difference from apoptosis [28].
- General Expansion of Organelles: The endoplasmic reticulum and mitochondria often swell [28].
- Lack of Apoptotic Body Formation: The cell does not form discrete apoptotic bodies. Instead, degradation occurs internally within autolysosomes [29].
Table 2: Comparative Morphology of Programmed Cell Death Types
| Feature | Apoptosis (Phase IIb) | Pyroptosis | Necroptosis | Autophagy |
|---|---|---|---|---|
| Nuclear Changes | Pyknosis, karyorrhexis in bodies | Moderate condensation | Mild condensation/Pyknosis [79] | Little to no condensation [28] |
| Cellular Volume | Decreased | Increased | Increased | Variable |
| Plasma Membrane | Intact, blebbing, bodies | Perforated by pores, ruptures | Ruptured | Intact |
| Key Inflammatory Response | No (anti-inflammatory) | Yes (strongly pro-inflammatory) | Yes (pro-inflammatory) | Variable |
| Hallmark Structure | Apoptotic Bodies | Gasdermin pores | Necrosome, pMLKL pores | Autophagic Vacuoles |
| Primary Degradation Mechanism | Phagocytosis | Inflammatory lysis | Accidental lysis | Autolysosomal |
Experimental Protocols for Morphological Discrimination
Accurate discrimination between these PCD types relies on a combination of techniques that assess morphology, biochemistry, and molecular markers.
Microscopy-Based Identification
1. Transmission Electron Microscopy (TEM) - The Gold Standard
- Principle: TEM provides ultra-high-resolution images of subcellular structures, allowing definitive identification of morphological hallmarks [3] [79].
- Workflow:
- Fixation: Treat cells with glutaraldehyde (2.5%) in 0.1M cacodylate buffer, followed by post-fixation with 1% osmium tetroxide.
- Dehydration: Dehydrate samples through a graded ethanol series (50%, 70%, 90%, 100%).
- Embedding: Infiltrate and embed cells in epoxy resin (e.g., Epon 812) and polymerize at 60°C.
- Sectioning: Use an ultramicrotome to cut ultrathin sections (60-80 nm).
- Staining: Stain with uranyl acetate and lead citrate to enhance contrast.
- Imaging & Analysis: Image using a TEM. Identify:
2. Fluorescence Microscopy
- Principle: Uses specific fluorescent dyes to visualize nuclear morphology and other cellular changes [3].
- Protocol:
- Staining: Incubate cells with Hoechst 33342 (5 µg/mL) or DAPI (1 µg/mL) for 15-20 minutes at 37°C to label DNA.
- Imaging: Capture images using a fluorescence or confocal microscope.
- Analysis:
- Apoptotic Cells: Show bright, condensed, and fragmented nuclei (pyknosis and karyorrhexis) [3].
- Pyroptotic/Necroptotic Cells: May show condensed but often less fragmented nuclei.
- Autophagic Cells: Display relatively normal nuclear morphology.
The following diagram illustrates the core workflow for microscopic differentiation of these cell death pathways.
Diagram 1: Microscopic Differentiation Workflow
Biochemical and Molecular Assays
1. Phosphatidylserine (PS) Externalization (Annexin V Assay)
- Purpose: To detect early-stage apoptosis. PS is translocated from the inner to the outer leaflet of the plasma membrane [28] [3].
- Protocol:
- Harvest cells and wash with cold PBS.
- Resuspend cells in 1X Binding Buffer.
- Add Annexin V-FITC and Propidium Iodide (PI) as per manufacturer's instructions.
- Incubate for 15 minutes in the dark at room temperature.
- Analyze by flow cytometry within 1 hour.
- Interpretation:
- Annexin V+/PI-: Early apoptotic cells (membrane intact).
- Annexin V+/PI+: Late apoptotic or necroptotic cells (membrane compromised).
- Annexin V-/PI+: Necrotic/necroptotic cells (membrane ruptured). Pyroptotic cells will also be PI+.
2. Lactate Dehydrogenase (LDH) Release Assay
- Purpose: To quantify plasma membrane integrity. LDH is a stable cytosolic enzyme released upon membrane damage [82].
- Protocol:
- Collect culture supernatant from treated cells.
- Incubate with the LDH assay reaction mixture according to the kit instructions.
- Measure absorbance at 490-500 nm.
- Interpretation:
- High LDH Release: Indicates membrane rupture, characteristic of pyroptosis, necroptosis, and secondary necrosis. Low release is expected in pure Phase IIb apoptosis due to intact membranes.
3. Western Blotting for Key Effectors
- Purpose: To confirm the activation of specific molecular pathways [82].
- Protocol:
- Lyse cells in RIPA buffer with protease and phosphatase inhibitors.
- Separate proteins by SDS-PAGE and transfer to a PVDF membrane.
- Block membrane and probe with primary antibodies overnight at 4°C.
- Incubate with HRP-conjugated secondary antibody.
- Detect using enhanced chemiluminescence substrate.
- Key Targets:
The Scientist's Toolkit: Essential Research Reagents
Successful morphological and mechanistic discrimination of PCD requires a carefully selected set of reagents and tools.
Table 3: Key Research Reagent Solutions for PCD Detection
| Reagent / Assay | Primary Function | Application in PCD Discrimination |
|---|---|---|
| Annexin V-FITC/PI Kit | Detect PS exposure & membrane integrity | Differentiate early apoptosis (Annexin V+/PI-) from late apoptosis/necrosis (Annexin V+/PI+) [3] |
| Hoechst 33342 / DAPI | Fluorescent nuclear staining | Identify nuclear condensation & fragmentation (apoptosis) vs. normal nuclei (autophagy) [3] |
| Anti-Cleaved Caspase-3 Ab | Marker of apoptotic executioner caspase | Confirm activation of the apoptotic cascade [28] [2] |
| Anti-pMLKL Ab | Marker of necroptosis execution | Definitive confirmation of necroptotic pathway activation [80] [78] |
| Anti-GSDMD (N-term) Ab | Detect active, pore-forming fragment | Specific biomarker for pyroptosis execution [80] [81] |
| Anti-LC3B Ab | Marker of autophagosomes | Identify and quantify autophagic structures (puncta) in cells [29] |
| LDH Release Assay Kit | Quantify cytosolic enzyme release | Measure plasma membrane rupture (high in pyroptosis/necroptosis, low in pure apoptosis) [82] |
| Z-VAD-FMK | Pan-caspase inhibitor | Inhibit apoptosis & caspase-mediated pyroptosis; can unmask necroptosis [78] |
| Necrostatin-1 (Nec-1) | RIPK1 inhibitor | Specific inhibitor of necroptosis; used to confirm this pathway [78] |
| CY-09 | NLRP3 Inflammasome inhibitor | Inhibits pyroptosis initiation via the NLRP3 pathway [82] |
Integrated Signaling Pathways in Programmed Cell Death
The distinct morphological outcomes of each PCD type are the direct result of specific and often interconnected signaling pathways. The following diagram summarizes the core molecular machinery governing these processes.
Diagram 2: Core Signaling Pathways in PCD
The meticulous differentiation of apoptotic Phase IIb from pyroptosis, necroptosis, and autophagy is foundational to accurate interpretation of cellular phenomena in research and drug development. While Phase IIb apoptosis is morphologically defined by the silent packaging of the cell into apoptotic bodies, pyroptosis and necroptosis are characterized by pro-inflammatory membrane disruption, and autophagy by extensive cytoplasmic vacuolation. The integration of advanced microscopic techniques with specific biochemical and molecular assays, as outlined in this guide, provides a robust framework for unambiguous identification. This comparative morphological analysis, set within the broader context of apoptosis phase research, not only deepens our fundamental understanding of cell death but also directly informs the development of therapeutic strategies aimed at modulating these critical pathways in disease.
Programmed cell death (PCD) is essential for maintaining physiological homeostasis, but different PCD modalities exhibit strikingly divergent impacts on the immune system. Whereas apoptosis has long been characterized as an immunologically silent process that avoids inflammation, pyroptosis and necroptosis are notably loud, triggering potent inflammatory responses and immune activation [83] [80]. This fundamental difference in immunological consequence stems from distinct morphological and molecular mechanisms that characterize each cell death pathway. The silent nature of apoptosis is particularly evident during its intermediate phases (IIa and IIb), where the cell undergoes controlled dismantling without releasing inflammatory cellular contents [4]. In contrast, the lytic mechanisms of pyroptosis and necroptosis result in plasma membrane rupture and the uncontrolled release of damage-associated molecular patterns (DAMPs) and pro-inflammatory cytokines, alerting the entire immune system to potential danger [83] [80]. Understanding these differences is crucial for researchers and drug development professionals seeking to modulate cell death pathways in cancer, inflammatory diseases, and infection.
Molecular Mechanisms and Morphological Transitions in Cell Death
Apoptosis: A Controlled, Silent Process
Apoptosis, the first well-characterized form of programmed cell death, proceeds through meticulously orchestrated phases that maintain membrane integrity until the final stages. The morphological hallmarks of apoptosis include cell shrinkage, chromatin condensation, and nuclear fragmentation [80] [4]. During the middle phase (Phase IIa), chromatin undergoes pronounced condensation, forming dense masses along the inner nuclear membrane, followed by nuclear fragmentation [4]. In the late phase (Phase IIb), the cytoskeleton degrades, generating membrane invaginations that produce membrane-coated vesicles containing nuclear debris, cytoplasmic components, and organelles [4]. These morphological changes preserve plasma membrane integrity throughout most of the death process, preventing the release of intracellular contents that could trigger inflammation.
The molecular regulation of apoptosis occurs through two main pathways. The extrinsic pathway initiates when death receptors (such as Fas or TNFR1) bind their ligands, recruiting FADD and pro-caspase-8 to form the Death-Inducing Signaling Complex (DISC), activating caspase-8 [29] [84] [80]. The intrinsic pathway triggers in response to intracellular stress (e.g., DNA damage, oxidative stress) through mitochondrial outer membrane permeabilization (MOMP), mediated by BCL-2 family proteins, resulting in cytochrome c release, apoptosome formation, and caspase-9 activation [29] [84] [80]. Both pathways converge on the activation of executioner caspases (caspase-3, -6, and -7), which cleave cellular substrates including PARP, leading to the characteristic morphological changes of apoptosis [29] [80] [4]. The preservation of membrane integrity and efficient phagocytosis of apoptotic bodies by neighboring cells ensures the silent nature of this cell death modality.
Pyroptosis: An Inflammatory Lytic Death
Pyroptosis represents a highly inflammatory form of programmed cell death characterized by cell swelling, membrane blebbing, and eventual lysis [83] [80]. This lytic process allows the release of pro-inflammatory cytokines, particularly IL-1β and IL-18, along with DAMPs that alert the immune system to potential threat [83]. The defining molecular executioner of pyroptosis is the gasdermin protein family, with GSDMD being the best characterized [83] [80]. In the canonical pathway, inflammasome sensors (such as NLRP3, AIM2, or Pyrin) detect pathogen-associated molecular patterns (PAMPs) or DAMPs, leading to the assembly of inflammasome complexes that activate caspase-1 [83]. Activated caspase-1 cleaves pro-IL-1β and pro-IL-18 into their active forms while simultaneously cleaving GSDMD, releasing its N-terminal pore-forming domain [83] [80]. These GSDMD fragments oligomerize and insert into the plasma membrane, forming pores approximately 10-20 nm in diameter that disrupt osmotic balance and eventually cause cell lysis [83]. Non-canonical pyroptosis occurs when human caspases-4/5 or mouse caspase-11 directly bind intracellular LPS, activating GSDMD independently of caspase-1 [83].
Necroptosis: A Regulated Necrotic Pathway
Necroptosis represents a form of regulated necrosis that morphologically resembles accidental necrosis, featuring cell swelling, organelle breakdown, and plasma membrane rupture [83] [84] [80]. This pathway typically activates when caspase-8 is inhibited during death receptor signaling, redirecting the cell toward a necrotic outcome [83] [84]. The core molecular machinery of necroptosis centers on the phosphorylation cascade involving RIPK1, RIPK3, and MLKL [83] [84] [80]. When TNF binds to TNFR1, complex I forms containing RIPK1. When caspase-8 is absent or inhibited, RIPK1 and RIPK3 form a heterodimeric complex via their RHIM domains, recruiting additional RIPK3 molecules to form filamentous structures [83] [84]. RIPK3 then phosphorylates MLKL, inducing a conformational change that enables MLKL to oligomerize and translocate to the plasma membrane [83] [80]. At the membrane, MLKL oligomers form pores or activate other channels, disrupting ionic homeostasis and ultimately causing plasma membrane rupture [83]. This membrane disruption results in the release of cellular contents, including DAMPs and inflammatory mediators, that stimulate robust immune responses in surrounding tissues [83] [80].
Comparative Analysis: Silent versus Loud Cell Death
Table 1: Morphological and Immunological Comparison of Cell Death Pathways
| Feature | Apoptosis | Pyroptosis | Necroptosis |
|---|---|---|---|
| Morphological Characteristics | Cell shrinkage, chromatin condensation, membrane blebbing, apoptotic bodies | Cell swelling, large membrane blebs, pore formation, eventual lysis | Cell and organelle swelling, plasma membrane rupture, loss of intracellular content organization |
| Membrane Integrity | Maintained until late stages (preserved in apoptotic bodies) | Compromised by gasdermin pores, leading to lysis | Compromised by MLKL-mediated disruption, leading to rupture |
| Inflammatory Outcome | Immunologically silent (non-inflammatory) | Highly inflammatory (loud) | Highly inflammatory (loud) |
| Key Executioners | Caspase-3, -6, -7 | Gasdermin-D (GSDMD) | Phosphorylated MLKL oligomers |
| DAMP Release | Minimal (contained in apoptotic bodies) | Extensive (through membrane pores and lysis) | Extensive (through membrane rupture) |
| Cytokine Release | None | Mature IL-1β, IL-18 | DAMPs that induce cytokine production |
| Phagocytic Clearance | Efficient (by neighboring cells) | Inefficient (contents released extracellularly) | Inefficient (contents released extracellularly) |
Table 2: Key Molecular Mediators in Cell Death Pathways
| Molecule | Primary Function | Regulatory Role |
|---|---|---|
| Caspase-3 | Apoptosis executioner caspase | Cleaves cellular substrates including PARP; inactivated in pyroptosis/necroptosis |
| Caspase-8 | Apoptosis initiator caspase | Inhibits necroptosis; cleaves RIPK1 and RIPK3; activation can lead to apoptosis |
| GSDMD | Pyroptosis executioner | Forms membrane pores upon caspase cleavage; allows IL-1β/IL-18 release |
| MLKL | Necroptosis executioner | Forms membrane pores upon RIPK3 phosphorylation; disrupts osmotic balance |
| RIPK1 | Necroptosis regulator | Scaffold protein; kinase activity promotes necroptosis when caspase-8 inhibited |
| RIPK3 | Necroptosis regulator | Phosphorylates MLKL; forms necrosome with RIPK1 |
| IL-1β | Pro-inflammatory cytokine | Activated by caspase-1; released through GSDMD pores; potent inflammatory mediator |
The silent nature of apoptosis versus the loud characteristics of pyroptosis and necroptosis fundamentally stem from differences in membrane integrity management and intracellular content disposition. During apoptosis phases IIa and IIb, the cell packages its contents into apoptotic bodies that are efficiently phagocytosed by neighboring cells or professional phagocytes, preventing the release of immunostimulatory molecules [4]. Additionally, apoptotic cells actively suppress inflammation through mechanisms that include the anti-inflammatory cytokines they produce and the specific modifications of their surface molecules that facilitate "find-me" and "eat-me" signals for phagocytes [80]. In contrast, both pyroptosis and necroptosis feature premature plasma membrane compromise before the cell's contents can be neatly packaged. The GSDMD pores in pyroptosis and MLKL-mediated membrane disruption in necroptosis allow the uncontrolled release of DAMPs (such as HMGB1, ATP, and DNA), mitochondrial components, and pro-inflammatory cytokines into the extracellular space [83] [80]. These released molecules act as potent danger signals that activate pattern recognition receptors on innate immune cells, initiating and amplifying inflammatory responses [83].
Experimental Approaches for Cell Death Characterization
Morphological Assessment Techniques
Differentiating between apoptosis (IIa/IIb), pyroptosis, and necroptosis requires multimodal experimental approaches that assess morphological, molecular, and immunological features. Phase-contrast and electron microscopy provide critical morphological evidence, with apoptosis showing cell shrinkage and apoptotic bodies, while pyroptosis and necroptosis display cell swelling and membrane rupture [4] [85]. For specific detection of apoptosis phases, transmission electron microscopy can identify the chromatin condensation and nuclear fragmentation characteristic of phase IIa, and the membrane blebbing and apoptotic body formation of phase IIb [4]. Scanning electron microscopy can reveal the large gasdermin-mediated pores characteristic of pyroptosis and the membrane disruptions in necroptosis [82]. Membrane integrity can be directly assessed using propidium iodide staining or lactate dehydrogenase (LDH) release assays, with apoptosis showing minimal release until late stages, while pyroptosis and necroptosis demonstrate significant and rapid release due to membrane compromise [82] [85].
Molecular Detection Methods
Western blot analysis represents a cornerstone technique for detecting specific molecular markers of each cell death pathway [4]. For apoptosis, antibodies against cleaved caspase-3, cleaved PARP, and caspase-8 provide specific evidence of activation [4]. Pyroptosis can be confirmed by detecting cleaved GSDMD and active caspase-1 fragments, while necroptosis is characterized by phosphorylated MLKL and RIPK3 [83] [85]. Immunofluorescence and immunohistochemistry enable spatial localization of these markers within cells and tissues, with phosphorylated MLKL showing characteristic membrane localization in necroptosis, and GSDMD-N terminal fragments similarly localizing to membranes during pyroptosis [83] [85]. For comprehensive assessment of multiple cell death pathways simultaneously, researchers can employ multiplex approaches that combine morphological analysis with molecular marker detection. Recent advances include the development of PANoptosis analysis, which examines the concurrent activation of pyroptosis, apoptosis, and necroptosis pathways, often involving complex interactions between components of each pathway [82] [85] [86].
The Scientist's Toolkit: Essential Research Reagents
Table 3: Key Research Reagents for Cell Death Detection
| Reagent/Tool | Application | Experimental Function |
|---|---|---|
| z-VAD-fmk | Pan-caspase inhibitor | Inhibits apoptotic caspases; can shift cell death to necroptosis when combined with TNF-α |
| Necrostatin-1 | RIPK1 inhibitor | Specifically inhibits necroptosis by targeting RIPK1 kinase activity |
| Disulfiram | MLKL inhibitor | Blocks MLKL oligomerization; inhibits necroptosis execution |
| Caspase-1 Antibody | Western blot/IF | Detects inflammasome activation and pyroptosis induction |
| Phospho-MLKL Antibody | Western blot/IF | Specific marker for necroptosis activation |
| Cleaved Caspase-3 Antibody | Western blot/IF | Specific marker for apoptosis execution |
| Cy-09 | NLRP3 inhibitor | Blocks NLRP3 inflammasome assembly; inhibits canonical pyroptosis |
| Annexin V | Flow cytometry | Detects phosphatidylserine externalization in early apoptosis |
| Propidium Iodide | Flow cytometry/microscopy | Assesses membrane integrity; differentially stains lytic cell death |
| LDH Assay Kit | Spectrophotometry | Quantifies plasma membrane rupture in lytic cell death |
Signaling Pathways and Molecular Interactions
Research Applications and Therapeutic Implications
The differential inflammatory outcomes of silent versus loud cell death pathways have profound implications for disease pathogenesis and treatment strategies. In cancer therapy, inducing immunologically silent apoptosis has been the traditional goal of many chemotherapeutic agents, but this approach may limit the engagement of anti-tumor immunity [80] [87]. Recent strategies explore inducing pyroptosis or necroptosis in tumor cells to stimulate immunogenic cell death, activating dendritic cells and cross-priming tumor-specific CD8+ T cells for enhanced anti-tumor immunity [80] [88]. However, this approach requires careful balancing, as excessive inflammation in the tumor microenvironment can also promote immunosuppression and tumor progression [84] [80]. In infectious diseases, pyroptosis serves as a crucial defense mechanism against intracellular pathogens, eliminating the replicative niche while alerting the immune system through cytokine release and DAMP exposure [83]. Some pathogens have consequently evolved strategies to inhibit pyroptosis or promote alternative death pathways, highlighting the evolutionary importance of this loud death modality in host-pathogen interactions [83].
The emerging concept of PANoptosis—the simultaneous activation of pyroptosis, apoptosis, and necroptosis pathways—complicates this landscape but offers new therapeutic opportunities [82] [85] [86]. PANoptosis represents an integral immune response where a single molecular complex (the PANoptosome) can regulate all three death pathways simultaneously, creating an inflammatory cell death process with features of each pathway that cannot be fully accounted for by any one alone [85] [86]. In inflammatory diseases and cancer, understanding and potentially modulating PANoptosis may provide more effective therapeutic strategies than targeting individual pathways [82] [88]. For instance, in bone infection models, TNF-α has been shown to inhibit osteogenic differentiation through PANoptosis, and inhibition of NLRP3 could rescue cells from this combined death pathway [82]. As research continues to elucidate the complex crosstalk between cell death pathways, more sophisticated therapeutic approaches will emerge that can precisely modulate the inflammatory outcomes of cell death for clinical benefit across a spectrum of diseases.
Experimental Workflow for Cell Death Characterization
Within the tightly regulated process of apoptosis, the intermediate morphological phases, IIa and IIb, represent a critical transition where the cell's fate is sealed and packaged for immunologically silent disposal. This whitepaper delineates the distinct structural changes characterizing these phases and explicates how their precise execution is fundamental to ensuring the clean removal of cellular debris and preventing collateral inflammation. Framed within ongoing research on apoptotic morphology, we provide a detailed analysis of the underlying molecular mechanisms, supported by quantitative data and advanced experimental protocols for their detection. This guide is intended to equip researchers and drug development professionals with the methodologies necessary to dissect these phases, with the ultimate goal of leveraging this understanding in therapeutic contexts, such as cancer and neurodegenerative diseases.
Apoptosis, or programmed cell death, is a cornerstone of physiological processes including embryonic development, immune system regulation, and the maintenance of tissue homeostasis [4] [89]. Its defining feature is a series of controlled morphological changes that allow a cell to be dismantled and removed without triggering a detrimental inflammatory response [89]. This is in stark contrast to necrotic cell death, which results from acute injury and is characterized by cell swelling, membrane rupture, and the release of pro-inflammatory cellular contents [90] [91].
The apoptotic process is conventionally divided into sequential phases. Following the initial Phase I (characterized by cell shrinkage and condensed cytoplasm), the cell enters two critical intermediate stages: Phase IIa and Phase IIb [3]. The distinct morphological events in these phases are crucial for packaging the cell's contents into manageable, membrane-bound parcels that are readily engulfed and digested by phagocytic cells. The integrity of this process ensures that intracellular antigens and inflammatory signals remain contained, thereby preventing an immune reaction and maintaining the health of the surrounding tissue [89]. Research into the specific distinctions between phases IIa and IIb is thus vital for understanding the fundamental biology of clean cell removal and for identifying points of dysregulation in disease.
Morphological Hallmarks of Phase IIa and Phase IIb
The transition from Phase IIa to Phase IIb represents the physical dismantling of the cell's core structures. The table below summarizes the key morphological and biochemical distinctions between these two phases.
Table 1: Comparative Morphology of Apoptotic Phases IIa and IIb
| Feature | Phase IIa (Nuclear Condensation & Fragmentation) | Phase IIb (Apoptotic Body Formation) |
|---|---|---|
| Primary Process | Nuclear disintegration [4] [3] | Cytoskeletal degradation and membrane budding [4] [3] |
| Nuclear Morphology | Chromatin condensation (pyknosis), margination on the inner nuclear membrane, and nuclear fragmentation (karyorrhexis) [3] [89] | Nuclear fragments dispersed within forming apoptotic bodies [3] |
| Cytoplasmic & Membrane Changes | Cell continues to shrink; cytoplasm densifies [4] | Degradation of the cytoskeleton; membrane blebbing and sprouting to form apoptotic bodies [4] [3] |
| Key End Product | A cell with a fragmented nucleus [3] | Small, membrane-coated vesicles (apoptotic bodies) containing nuclear debris, cytoplasmic membrane, and organelle components [4] [3] |
| Biochemical Markers | Activation of executioner caspases (e.g., Caspase-3); initiation of specific substrate cleavage (e.g., PARP) [4] | Continued caspase activity; completion of protein cleavage and DNA fragmentation [4] |
The following diagram illustrates the sequential relationship between these morphological stages and their functional outcomes.
Molecular Mechanisms Ensuring Clean Removal
The meticulously orchestrated morphology of phases IIa and IIb is driven by specific biochemical pathways. The integrity of the plasma membrane throughout the process is the single most important factor in preventing inflammation.
- Caspase Activation and Substrate Cleavage: The execution of the morphological changes is carried out by a family of cysteine proteases called caspases. Executioner caspases, such as caspase-3 and -7, are activated in these phases and cleave a suite of structural and regulatory proteins [4] [29]. A key substrate is Poly (ADP-ribose) polymerase (PARP), whose cleavage inactivates its DNA repair function and serves as a definitive biochemical marker of apoptosis [4]. Other substrates include nuclear lamins and cytoskeletal proteins, whose cleavage directly facilitates nuclear fragmentation and membrane blebbing [29].
- Preservation of Membrane Integrity: A hallmark of apoptosis is the preservation of the plasma membrane as a barrier, even as the cell fragments into apoptotic bodies. This is fundamentally different from necrosis, where early membrane rupture leads to the release of damage-associated molecular patterns (DAMPs) that trigger inflammation [91]. In apoptosis, the "eat-me" signal phosphatidylserine is translocated to the outer leaflet of the plasma membrane while the membrane itself remains intact [4]. This signal ensures the swift recognition and engulfment of apoptotic bodies by macrophages and other phagocytic cells before the contents can leak out [89].
Table 2: Key Molecular Players in Apoptotic Cleanup
| Molecule/Process | Role in Phase IIa/IIb | Functional Consequence |
|---|---|---|
| Executioner Caspases (e.g., Casp-3) | Proteolytic cleavage of nuclear and cytoskeletal substrates [4] [29] | Direct execution of nuclear fragmentation and cell budding. |
| PARP Cleavage | Inactivation of DNA repair protein; biomarker [4] | Conserves cellular energy and facilitates dismantling. |
| Phosphatidylserine Exposure | "Eat-me" signal on the outer membrane surface [4] | Promotes recognition and phagocytosis by immune cells. |
| Membrane Integrity | Maintained throughout apoptotic body formation [89] | Prevents release of pro-inflammatory cellular contents. |
Advanced Detection and Experimental Protocols
Accurately distinguishing between Phase IIa and Phase IIb, as well as differentiating apoptosis from other cell death forms like necroptosis, requires a combination of techniques. The following workflow and protocols provide a guide for rigorous experimental analysis.
A Multi-Modal Workflow for Discriminating Apoptosis
The complex nature of cell death, including potential crosstalk between pathways like apoptosis and necroptosis, necessitates a multi-faceted approach [29] [91]. The integrated workflow below outlines how different techniques can be combined to confirm apoptosis and characterize its phases.
Detailed Experimental Protocols
Protocol 1: Western Blot for Apoptosis Markers
This is a standard method for detecting key biochemical events in phases IIa/IIb [4].
- Sample Preparation: Lyse control and treated cells using RIPA buffer supplemented with protease and phosphatase inhibitors.
- Protein Quantification & Separation: Determine protein concentration using a BCA assay. Load equal amounts of protein (20-30 μg) and separate by SDS-PAGE.
- Membrane Transfer & Blocking: Transfer proteins to a PVDF or nitrocellulose membrane. Block the membrane with 5% non-fat milk or BSA in TBST for 1 hour.
- Antibody Incubation:
- Incubate with primary antibodies (in blocking buffer) overnight at 4°C.
- Key Antibodies: Cleaved Caspase-3 (for activation), Cleaved PARP (marker for execution phase), Total Caspase-3 (loading control comparison), and a housekeeping protein (β-actin or GAPDH for normalization) [4].
- Detection: Incubate with an HRP-conjugated secondary antibody for 1 hour at room temperature. Develop using a chemiluminescent substrate and image.
- Analysis: Use densitometry software (e.g., ImageJ) to quantify band intensities. The ratio of cleaved to total protein indicates the level of apoptotic activity [4].
Protocol 2: Real-Time Live-Cell Imaging to Distinguish Apoptosis from Necrosis
This advanced protocol, adapted from a 2017 study, allows for real-time, single-cell discrimination of apoptosis from necrosis [27].
- Cell Line Engineering:
- Imaging Setup:
- Seed cells expressing both probes in a glass-bottom culture dish.
- Use a wide-field or confocal fluorescence microscope with environmental control (37°C, 5% CO₂).
- Set up time-lapse imaging, acquiring images every 30-45 minutes for 24-48 hours.
- Induction and Data Acquisition: Treat cells with the apoptotic stimulus and begin imaging.
- Interpretation of Results:
- Apoptotic Cell: Shows a loss of FRET (increase in CFP/EYFP ratio) while retaining the mitochondrial DsRed signal.
- Necrotic Cell: Loses both CFP and EYFP fluorescence (due to probe leakage) but retains the mitochondrial DsRed signal.
- Live Cell: Shows intact FRET and mitochondrial signals [27].
The Scientist's Toolkit: Key Research Reagents
Table 3: Essential Reagents for Apoptosis Morphology Research
| Reagent / Solution | Function / Application | Key Characteristics |
|---|---|---|
| Antibody Cocktails (e.g., ab136812) | Simultaneous detection of multiple apoptosis markers (pro/p17-caspase-3, cleaved PARP1) in a single WB [4]. | Increases efficiency, enhances detection, and improves reproducibility. |
| FRET-based Caspase Sensor (e.g., CFP-DEVD-YFP) | Real-time visualization of caspase activation in live cells [27]. | Genetically encoded; enables high-temporal-resolution imaging of apoptosis initiation. |
| MitoTracker Dyes (e.g., MitoTracker Green) | Staining of mitochondria for morphological analysis via super-resolution SIM [92]. | Live-cell compatible; allows quantification of mitochondrial fragmentation during apoptosis. |
| Fixable Viability Dyes | Distinguishing live from dead cells in flow cytometry, often based on membrane integrity [90]. | Useful for pre-sorting samples to remove necrotic cells and reduce background. |
| Annexin V-FITC / PI Staining | Flow cytometry assay to detect phosphatidylserine exposure (early apoptosis) and membrane integrity [3]. | Industry standard for quantifying early and late apoptotic populations. |
| Necrostatin-1 | Specific inhibitor of RIPK1, used to inhibit necroptosis in mechanistic studies [93]. | Critical for disentangling the crosstalk between apoptotic and necroptotic pathways. |
The phase-specific morphological changes of apoptosis, particularly the nuclear dismantling in Phase IIa and the packaging into apoptotic bodies in Phase IIb, are not merely structural events but are fundamental to the immunologically silent nature of this cell death process. The integrity of the plasma membrane, coupled with the exposure of "eat-me" signals, ensures that cellular contents are safely contained and swiftly cleared by phagocytes. Disruptions to this finely tuned process can lead to inflammatory and autoimmune pathologies or, conversely, permit the survival of damaged cells that may contribute to cancer. The advanced experimental methodologies detailed herein provide a framework for researchers to probe these critical phases with greater precision, offering insights that can be harnessed for therapeutic intervention in a range of human diseases.
Within the context of a broader thesis on the morphological and functional differences in apoptotic pathways, the precise induction and assessment of specific apoptotic phases present a critical frontier in drug discovery. Apoptosis, a genetically regulated form of programmed cell death, occurs primarily via two principal pathways: the extrinsic (death receptor) pathway and the intrinsic (mitochondrial) pathway [2] [28]. The terminal, execution phase, where these pathways converge, is characterized by the irreversible activation of effector caspases and distinct morphological changes [28].
The therapeutic imperative is clear; the ability to quantitatively measure a compound's capacity to induce a specific apoptotic phase—particularly the decisive execution phase—provides a direct readout of its efficacy and potential mechanism of action. This guide details the methodologies and tools for kinetically quantifying compound-induced apoptosis, focusing on the execution phase as a gold-standard indicator of irreversible commitment to cell death.
Core Apoptotic Pathways and Molecular Targets
The extrinsic and intrinsic pathways constitute the primary routes to apoptotic commitment. The accompanying diagram illustrates the sequence of events from initiation to execution, highlighting key molecular markers used in experimental assessment.
Key Molecular Events and Detection Targets
The extrinsic pathway initiates outside the cell, triggered when death ligands bind to surface receptors, leading to the formation of the Death-Inducing Signaling Complex (DISC) and activation of caspase-8 [2] [28]. The intrinsic pathway activates from within in response to cellular damage, causing Mitochondrial Outer Membrane Permeabilization (MOMP) and release of cytochrome c, which activates caspase-9 via the apoptosome [2] [28]. Critically, both pathways converge to activate the execution phase, mediated by effector caspases-3 and -7, which orchestrate the controlled dismantling of the cell [94] [28]. This irreversible commitment makes caspase-3/7 activation a definitive marker for assessing a compound's efficacy in inducing terminal apoptosis.
Quantitative Kinetic Assays for Apoptosis Assessment
Real-Time Kinetic Apoptosis Assays
Endpoint measurements provide a limited snapshot of apoptosis. Kinetic assays, however, capture the dynamic and asynchronous nature of cell death, enabling researchers to quantify the timing, rate, and extent of apoptotic induction by a test compound [95] [94]. The experimental workflow for a multiplexed kinetic assay is outlined below.
Key Apoptosis Detection Methods
The following table summarizes the primary biomarkers and techniques used to quantify apoptotic activity, along with their key advantages.
Table 1: Key Methods for Detecting Apoptotic Activity
| Detection Method | Target / Mechanism | Key Advantage | Common Readout |
|---|---|---|---|
| Caspase-3/7 Activation [95] [94] | Cleavage of DEVD peptide sequence by active caspases | Direct marker of irreversible commitment to apoptosis; high specificity | Fluorescence from cleaved DNA-binding dye |
| Phosphatidylserine (PS) Externalization [95] [96] | Binding of Annexin V to PS flipped to outer membrane leaflet | Early-stage detection, before membrane integrity loss | Fluorescence microscopy or flow cytometry |
| Nuclear Morphology Changes [96] [28] | Chromatin condensation, nuclear fragmentation, and apoptotic body formation | Direct link to classic apoptotic morphology; high visual confirmation | High-definition phase-contrast or fluorescent imaging |
| DNA Fragmentation [96] | Labeling of DNA strand breaks (TUNEL assay) | Late-stage apoptotic marker | Fluorescence microscopy |
The Scientist's Toolkit: Essential Research Reagents
Robust assessment of compound efficacy requires a suite of reliable reagents. The following table details key solutions for probing apoptosis.
Table 2: Research Reagent Solutions for Apoptosis Detection
| Reagent / Assay | Function & Mechanism | Application in Efficacy Assessment |
|---|---|---|
| Caspase-3/7 DEVDase Probes [95] [94] | Cell-permeable, non-fluorescent substrates cleaved by caspase-3/7 to release fluorescent DNA label. | Kinetic quantification of execution-phase activity; definitive proof of apoptotic induction by a compound. |
| Annexin V Conjugates [95] [96] | Fluorescently labeled protein binds exposed phosphatidylserine (PS) on outer plasma membrane. | Detection of early apoptotic events; can be multiplexed with viability dyes to distinguish early vs. late apoptosis. |
| Nuclear Labeling Dyes [95] | Constitutive fluorescent labeling of cell nuclei (e.g., Nuclight reagents). | Multiplexed measurement of cell proliferation and apoptosis in co-culture; normalization of cell presence. |
| ZipGFP Caspase Reporter [94] | Stable cell line expressing a caspase-3/7-specific DEVD-cleavable biosensor (split-GFP). | Single-cell, long-term tracking of apoptosis in 2D and 3D cultures; low background and irreversible signal. |
| Pan-Caspase Inhibitors (zVAD-fmk) [2] [94] | Irreversibly inhibits activity of a broad range of caspases. Control experiment to confirm caspase-dependent cell death. | Validation that a compound's cytotoxic effect is specifically mediated through apoptotic pathways. |
Experimental Protocol: Kinetic Caspase-3/7 Activation Assay
This protocol details the steps for performing a no-wash, kinetic apoptosis assay in a 96-well format using adherent cells, enabling high-throughput pharmacological screening [95].
Materials and Reagents
- Cell line of interest (e.g., HT-1080 fibrosarcoma, A549 carcinoma)
- Test compounds and appropriate vehicle controls
- Complete cell culture medium
- Incucyte Caspase-3/7 Green Dye (or equivalent)
- Opti-MEM or similar reduced-serum medium
- 96-well clear-bottom tissue culture plates
- Real-time live-cell analysis system (e.g., Incucyte)
Procedure
- Cell Seeding: Seed adherent cells at an optimal density (e.g., 2,000 - 5,000 cells per well) in a 96-well plate. Incubate for 18-24 hours to allow for proper cell attachment and recovery.
- Dye Preparation and Treatment: Dilute the Caspase-3/7 Green Dye 1:100 in Opti-MEM. Prepare serial dilutions of your test compounds in complete medium. Remove the cell plate from the incubator and replace the medium with 100 µL of the compound-dye mixture per well. Include vehicle control and a known apoptosis inducer (e.g., 10 µM Camptothecin) as a positive control.
- Real-Time Data Acquisition: Place the plate into the live-cell analysis system. Acquire images automatically every 2-4 hours for the desired assay duration (e.g., 48-72 hours). Collect both phase-contrast and green fluorescence (for caspase activation) images.
- Image and Data Analysis: Use integrated software to automatically segment and quantify fluorescent objects (apoptotic cells) in each well. Normalize the apoptotic count to the total cell confluence or nuclear count if a proliferation dye is used. Generate kinetic curves and concentration-response curves for quantitative analysis of compound efficacy.
Data Analysis and Interpretation
Quantitative Pharmacological Profiling
The power of kinetic assays lies in the rich, time-dependent data they generate. Analysis of the fluorescent signal over time allows researchers to determine the potency (EC₅₀), speed of onset, and maximal efficacy of a test compound in inducing apoptosis [95]. As demonstrated in a study on A549 cancer cells, distinct kinetic profiles were observed for different chemotherapeutic agents (e.g., Camptothecin, Cisplatin, Staurosporine), providing a fingerprint for their mechanism of action [95]. Concentration-response curves generated from this data are essential for lead compound optimization.
Multiplexing for Comprehensive Assessment
To gain a more holistic view of compound effect, caspase-3/7 activity can be multiplexed with other parameters. For instance, co-labeling with a nuclear dye allows for the simultaneous quantification of apoptosis and proliferation from the same well [95]. This enables direct correlation of a compound's pro-apoptotic effect with its anti-proliferative activity, providing a multi-parametric assessment of its overall anti-tumor efficacy and helping to identify phenomena like apoptosis-induced proliferation [94].
The strategic induction and precise quantification of specific apoptotic phases, particularly the terminal execution phase, provide an unambiguous metric for a compound's biological efficacy in drug discovery. The methodologies detailed herein—centered on real-time, kinetic measurement of caspase-3/7 activation—offer a robust, high-content framework for screening and optimizing novel therapeutics. Integrating these specific apoptotic readouts with other cell health parameters ensures a comprehensive understanding of a candidate drug's mechanism of action and potency, ultimately de-risking the pipeline and accelerating the development of effective oncology treatments and beyond.
Conclusion
The precise discrimination between apoptotic phases IIa and IIb is not merely an academic exercise but a critical competency for advancing biomedical research and therapeutic development. A firm grasp of their distinct morphological and biochemical signatures enables accurate assessment of cell death mechanisms in response to experimental treatments and disease states. Future directions will likely involve the development of more sophisticated, real-time imaging techniques and phase-specific molecular probes. Furthermore, as the crosstalk between different regulated cell death pathways becomes clearer, understanding the decision points that lead a cell into phase IIa apoptosis will open new avenues for combination therapies, particularly in overcoming treatment resistance in cancer and mitigating unwanted cell loss in degenerative diseases.
References
- 1. Apoptosis - StatPearls - NCBI Bookshelf [https://www.ncbi.nlm.nih.gov/books/NBK499821/]
- 2. Apoptosis: A Comprehensive Overview of Signaling ... [https://www.mdpi.com/2073-4409/13/22/1838]
- 3. Apoptosis detection: a purpose-dependent approach ... [https://pmc.ncbi.nlm.nih.gov/articles/PMC8208110/]
- 4. Apoptosis western blot guide [https://www.abcam.com/en-us/knowledge-center/western-blot/western-blot-analysis-of-apoptosis]
- 5. Quantitative analysis and comparison of 3D morphology ... [https://journals.plos.org/plosone/article?id=10.1371/journal.pone.0184726]
- 6. The Quantitative-Phase Dynamics of Apoptosis and Lytic ... [https://www.nature.com/articles/s41598-020-58474-w]
- 7. Caspases as master regulators of programmed cell death [https://www.nature.com/articles/s12276-025-01470-9]
- 8. Three Distinct Stages of Apoptotic Nuclear Condensation ... [https://pmc.ncbi.nlm.nih.gov/articles/PMC2705844/]
- 9. Modeling Apoptotic Chromatin Condensation in Normal ... [https://www.sciencedirect.com/science/article/pii/S0021925820704266]
- 10. Chromatin compaction precedes apoptosis in developing ... [https://www.nature.com/articles/s42003-022-03704-2]
- 11. Activation and Cleavage of Caspase-3 in Apoptosis Induced ... [https://pmc.ncbi.nlm.nih.gov/articles/PMC6793169/]
- 12. Catalytic activity of caspase-3 is required for its degradation [https://www.nature.com/articles/4401360]
- 13. Apoptosis: A Comprehensive Overview of Signaling Pathways ... [https://pmc.ncbi.nlm.nih.gov/articles/PMC11592877/]
- 14. Mechanisms of Cell Death: Apoptosis - CST Blog [https://blog.cellsignal.com/mechanisms-of-cell-death-apoptosis]
- 15. Apoptosis Signaling Pathway: Stages, Types and Key ... [https://geneglobe.qiagen.com/us/knowledge/pathways/apoptosis-signaling]
- 16. Coordinated changes in cell membrane and cytoplasm during ... [https://pmc.ncbi.nlm.nih.gov/articles/PMC7185959/]
- 17. Blebs produced by actin–myosin contraction during ... [https://www.nature.com/articles/cdd201369]
- 18. Isolation and Quantification of Blood Apoptotic Bodies, a Non ... [https://biologicalproceduresonline.biomedcentral.com/articles/10.1186/s12575-020-00130-8]
- 19. – Pathologia Apoptosis [https://pathologia.ed.ac.uk/topic/apoptosis/]
- 20. Morphologic criteria and detection of apoptosis | Herz [https://link.springer.com/article/10.1007/BF03044961]
- 21. Morphological Aspects of Apoptosis [http://www.cyto.purdue.edu/sites/default/files/__subsites__/archive/flowcyt/research/cytotech/apopto/data/malorni/malorni.htm]
- 22. High-Resolution Imaging of Morphological Changes ... [https://www.mdpi.com/2079-6374/15/8/522]
- 23. 50 years on and still very much alive: 'Apoptosis [https://www.nature.com/articles/s41416-022-02020-0]
- 24. Morphologic and biochemical hallmarks of apoptosis [https://pubmed.ncbi.nlm.nih.gov/10728374/]
- 25. Caspase activation cascades in apoptosis [https://pubmed.ncbi.nlm.nih.gov/18208375/]
- 26. Caspase activation pathways: some recent progress [https://www.nature.com/articles/cdd200959]
- 27. A quantitative real-time approach for discriminating ... [https://pmc.ncbi.nlm.nih.gov/articles/PMC5253725/]
- 28. Research progress on morphology and mechanism of ... [https://www.nature.com/articles/s41419-024-06712-8]
- 29. Insights on the crosstalk among different cell death ... [https://www.nature.com/articles/s41420-025-02328-9]
- 30. The formation of the 'footprint of death' as a mechanism for ... [https://www.nature.com/articles/s41467-025-64206-3]
- 31. Light Microscopy as a Tool to Detect Apoptosis and Other ... [https://pubmed.ncbi.nlm.nih.gov/40329982/]
- 32. Light Microscopy as a Tool to Detect Apoptosis and Other ... [https://pmc.ncbi.nlm.nih.gov/articles/PMC12051451/]
- 33. "Reading cell death with light: Real-time visualization of ... [https://www.eurekalert.org/news-releases/1096590]
- 34. Bruceine D induces lung cancer cell apoptosis and ... [https://pmc.ncbi.nlm.nih.gov/articles/PMC7028916/]
- 35. Jack (Jie) Huang MD, PhD [https://www.linkedin.com/posts/csteam_westernblot-apoptosis-celldeath-activity-7258510026825154560-DJu7]
- 36. Pharmacological targeting of caspase-8/c-FLIPL ... [https://pmc.ncbi.nlm.nih.gov/articles/PMC11698904/]
- 37. Caspase-1 cleaves Bid to release mitochondrial SMAC ... [https://www.life-science-alliance.org/content/3/6/e202000735]
- 38. Cleavage of CAD by caspase-3 determines the cancer cell ... [https://www.nature.com/articles/s41467-025-60144-2]
- 39. Myosin IIA-related Actomyosin Contractility Mediates ... [https://www.frontiersin.org/journals/molecular-neuroscience/articles/10.3389/fnmol.2017.00075/full]
- 40. Apoptosis and Beyond: Cytometry in Studies of ... [https://pmc.ncbi.nlm.nih.gov/articles/PMC3263828/]
- 41. Annexin V Staining | Thermo Fisher Scientific - US [https://www.thermofisher.com/us/en/home/life-science/cell-analysis/cell-viability-and-regulation/apoptosis/annexin-v-staining.html]
- 42. flow cytometry using Annexin V and propidium iodide ... [https://pubmed.ncbi.nlm.nih.gov/12116376/]
- 43. Analysis of Apoptotic Cells by Flow and Laser Scanning ... [https://www.sciencedirect.com/science/article/abs/pii/S0076687900220053]
- 44. Robust high-throughput kinetic analysis of apoptosis with ... [https://pmc.ncbi.nlm.nih.gov/articles/PMC5261025/]
- 45. Imaging flow cytometry: from high - resolution ... [https://www.frontiersin.org/journals/bioengineering-and-biotechnology/articles/10.3389/fbioe.2025.1580749/full]
- 46. TUNEL Assays | Thermo Fisher Scientific - US [https://www.thermofisher.com/us/en/home/life-science/cell-analysis/cell-viability-and-regulation/apoptosis/tunel-assays.html]
- 47. Apoptosis and cancer drug targeting - PMC - PubMed Central [https://pmc.ncbi.nlm.nih.gov/articles/PMC409892/]
- 48. TUNEL assay [https://en.wikipedia.org/wiki/TUNEL_assay]
- 49. TUNEL staining [https://www.abcam.com/en-us/technical-resources/guides/cell-health-guide/tunel-staining-or-tunel-assay]
- 50. TUNEL assay-Standardized method for testing sperm DNA ... [https://pubmed.ncbi.nlm.nih.gov/32706440/]
- 51. Harmonizing TUNEL with multiplexed iterative ... [https://pmc.ncbi.nlm.nih.gov/articles/PMC12146639/]
- 52. Apoptosis-based therapies and drug targets | Cell Death & ... [https://www.nature.com/articles/4401556]
- 53. The molecular mechanisms and therapeutic implications of ... [https://link.springer.com/article/10.1007/s10495-025-02157-2]
- 54. Comprehensive assessment of markers of apoptosis and ... [https://pmc.ncbi.nlm.nih.gov/articles/PMC9925059/]
- 55. Secondary necrosis: The natural outcome of the complete ... [https://www.sciencedirect.com/science/article/pii/S0014579310008641]
- 56. Necroptosis, necrosis and secondary ... - Nature [https://www.nature.com/articles/cdd2009184]
- 57. BIOMARKERS DISTINGUISH APOPTOTIC AND NECROTIC ... [https://pmc.ncbi.nlm.nih.gov/articles/PMC4213307/]
- 58. Detecting Cell Apoptosis on Tissue Slides [https://bitesizebio.com/34739/cell-apoptosis-on-tissue-slides/]
- 59. Targeting apoptotic pathways for cancer therapy - PMC [https://pmc.ncbi.nlm.nih.gov/articles/PMC11245162/]
- 60. Single-cell dynamics reveal a stress-induced decision ... [https://www.sciencedirect.com/science/article/pii/S277297612500203X]
- 61. Deep transfer learning approach for automated cell death ... [https://pmc.ncbi.nlm.nih.gov/articles/PMC12085637/]
- 62. The integrated stress response engages a cell- ... [https://www.nature.com/articles/s41419-025-07403-8]
- 63. Helminthic larval stage induces cellular apoptosis via caspase ... [https://pmc.ncbi.nlm.nih.gov/articles/PMC12507911/]
- 64. Cleaved PARP (Asp214) (7C9) Mouse Monoclonal Antibody [https://www.cellsignal.com/products/primary-antibodies/cleaved-parp-asp214-7c9-mouse-monoclonal-antibody/9548?srsltid=AfmBOoppBcw5TU_vdqro2kAqn6FWNNOkAjTn8q2DSye0mGwCn0IC7QM-]
- 65. Cleaved PARP (Asp214) Antibody #9545 [https://www.cellsignal.com/products/primary-antibodies/cleaved-parp-asp214-antibody/9545?srsltid=AfmBOooj5W3Za8EqFU2GRy2A2L-zxPCCfDM19VQn9pWHAwuQL_4uPnIg]
- 66. BD Pharmingen™ PE Mouse Anti-Cleaved PARP (Asp214) [https://www.bdbiosciences.com/en-us/products/reagents/flow-cytometry-reagents/research-reagents/single-color-antibodies-ruo/pe-mouse-anti-cleaved-parp-asp214.552933]
- 67. HTRF Human and Mouse PARP cleaved-Asp214 ... [https://www.revvity.com/product/htrf-parp-cleaved-asp214-kit-500-pts-64parpeg]
- 68. Caspase 3 and caspase 7 promote cytoprotective autophagy ... [https://journals.plos.org/plosbiology/article?id=10.1371/journal.pbio.3003034]
- 69. Designing an apoptosis reporter by mutagenesis-based ... [https://www.sciencedirect.com/science/article/pii/S2090123225004795]
- 70. Limitations of the single-cell gel electrophoresis assay to ... [https://pubmed.ncbi.nlm.nih.gov/11322925/]
- 71. Guidelines for the use and interpretation of assays ... [https://pmc.ncbi.nlm.nih.gov/articles/PMC2757140/]
- 72. Exploring necroptosis: mechanistic analysis and antitumor ... [https://pmc.ncbi.nlm.nih.gov/articles/PMC12041361/]
- 73. Cell-intrinsic platinum response and associated genetic ... [https://www.nature.com/articles/s41417-025-00941-5]
- 74. Effect of monkeypox virus B14R protein fragments binding to ... [https://pmc.ncbi.nlm.nih.gov/articles/PMC12538970/]
- 75. AI-based Apoptosis Cell Classification Using Phase ... [https://ar.iiarjournals.org/content/44/3/935]
- 76. Insights on the crosstalk among different cell death mechanisms [https://pmc.ncbi.nlm.nih.gov/articles/PMC11811070/]
- 77. Flow cytometry-based apoptosis detection - PMC [https://pmc.ncbi.nlm.nih.gov/articles/PMC3863590/]
- 78. Different types of cell death and their shift in shaping disease [https://www.nature.com/articles/s41420-023-01581-0]
- 79. Programmed cell death detection methods: a systematic ... [https://link.springer.com/article/10.1007/s10495-022-01735-y]
- 80. Targeting regulated cell death: Apoptosis, necroptosis ... [https://pmc.ncbi.nlm.nih.gov/articles/PMC11921819/]
- 81. Ferroptosis and pyroptosis are connected through autophagy [https://molecular-cancer.biomedcentral.com/articles/10.1186/s12943-024-02217-2]
- 82. Identification of the pyroptosis, apoptosis, and necroptosis ... [https://eurjmedres.biomedcentral.com/articles/10.1186/s40001-025-02702-4]
- 83. Pyroptosis versus necroptosis: similarities, differences, and ... [https://pmc.ncbi.nlm.nih.gov/articles/PMC6294779/]
- 84. Specific signaling pathways mediated programmed cell death ... [https://pmc.ncbi.nlm.nih.gov/articles/PMC12084487/]
- 85. A comparative study of apoptosis, pyroptosis, necroptosis, and ... [https://journals.plos.org/plosone/article?id=10.1371/journal.pone.0299577]
- 86. From pyroptosis, apoptosis and necroptosis to PANoptosis [https://www.sciencedirect.com/science/article/pii/S2001037021003287]
- 87. Apoptosis, necroptosis, and pyroptosis as alternative cell ... [https://www.sciencedirect.com/science/article/pii/S0304419X23001737]
- 88. Cell Death: Mechanisms and Potential Targets in Breast ... [https://www.mdpi.com/1422-0067/25/17/9703]
- 89. Apoptosis: A Review of Programmed Cell Death - PMC [https://pmc.ncbi.nlm.nih.gov/articles/PMC2117903/]
- 90. Necrosis Vs. Apoptosis: Processes, Necrotic Cell Death ... [https://www.akadeum.com/blog/necrosis-vs-apoptosis-processes-necrotic-cell-death-apoptosis-steps/?srsltid=AfmBOoqGnWU7bWbk5RFEXOei3x5thzt8SnyAZcWuMBCK2S4LlsOzVcvs]
- 91. Programmed cell death detection methods - PubMed Central [https://pmc.ncbi.nlm.nih.gov/articles/PMC9308588/]
- 92. Quantitative assessment of morphology and sub-cellular ... [https://pmc.ncbi.nlm.nih.gov/articles/PMC7510918/]
- 93. Screening of an FDA-Approved Drug Library: Menadione ... [https://www.mdpi.com/1424-8247/18/8/1145]
- 94. Integrated real-time imaging of executioner caspase dynamics ... [https://pmc.ncbi.nlm.nih.gov/articles/PMC12328661/]
- 95. Kinetic quantification of apoptosis using Incucyte® live-cell ... [https://www.news-medical.net/whitepaper/20251027/Kinetic-quantification-of-apoptosis-using-Incucytec2ae-live-cell-imaging-assays.aspx]
- 96. Morphological and cytochemical determination of cell death by apoptosis | Histochemistry and Cell Biology [https://link.springer.com/article/10.1007/s00418-007-0356-9]