Density Gradient Centrifugation for Mitochondrial Purification: A Comprehensive Guide from Foundational Principles to Advanced Applications
This comprehensive article explores density gradient centrifugation as a critical technique for isolating high-purity, functional mitochondria across diverse biological samples.
Density Gradient Centrifugation for Mitochondrial Purification: A Comprehensive Guide from Foundational Principles to Advanced Applications
Abstract
This comprehensive article explores density gradient centrifugation as a critical technique for isolating high-purity, functional mitochondria across diverse biological samples. Tailored for researchers, scientists, and drug development professionals, it covers foundational principles through differential centrifugation and density separation mechanisms. The content provides detailed methodological protocols for various specimen types including mammalian tissues, plant materials, and cultured cells, alongside troubleshooting guidance for common challenges like contamination and functional loss. The article further examines advanced validation techniques assessing mitochondrial purity, integrity, and bioenergetic functionality, while comparing traditional and innovative purification approaches. This resource serves as both an introductory guide and technical reference for implementing robust mitochondrial isolation protocols in biomedical research and therapeutic development.
Understanding Density Gradient Centrifugation: Core Principles and Mitochondrial Isolation Fundamentals
Density gradient centrifugation is a cornerstone technique in cell biology for the high-resolution separation of cellular components based on their intrinsic physical properties. Unlike differential centrifugation, which separates primarily by size and sedimentation rate, density gradient centrifugation resolves subcellular particles by their buoyant density. When a cellular homogenate is subjected to centrifugal force within a medium of progressively increasing density, particles migrate until they reach a position where their own density matches that of the surrounding medium—a point known as their isopycnic point. This equilibrium-based separation is exceptionally effective for purifying organelles with overlapping size distributions but distinct densities, such as mitochondria, lysosomes, and peroxisomes, which are often co-pelleted in simple differential centrifugation protocols [1] [2].
The critical requirement for this technique is a stable, pre-formed gradient of increasing density from the top to the bottom of the centrifuge tube. This gradient can be continuous (a smooth, uninterrupted increase in density) or discontinuous (a series of layered solutions with discrete density steps). The gradient medium itself is chosen for properties such as solubility, density, viscosity, and osmotic pressure. Common media include sucrose, Percoll, Nycodenz, Iodixanol, and Ficoll, each with specific advantages for different applications and organelle types [2].
Core Separation Mechanism
The Principle of Isopycnic Separation
The fundamental mechanism driving the separation is the attainment of isopycnic equilibrium. Each type of cellular particle possesses a characteristic buoyant density, determined by its unique biochemical composition (e.g., lipid-to-protein ratio, nucleic acid content). During centrifugation, particles sediment through the gradient under the influence of centrifugal force. A particle will continue to sediment so long as the density of the gradient medium at its current position is less than the particle's own density. Once the particle encounters a region of the gradient where the medium density is equal to its own density, sedimentation ceases, and the particle comes to rest. This process effectively sorts a heterogeneous mixture of cellular components into distinct bands or zones at their respective isopycnic points, enabling their individual recovery [2].
Gradient Types and Their Roles
The formation of a stable density gradient is paramount to the success of the separation.
- Discontinuous Gradients: These are prepared by carefully layering solutions of decreasing density one on top of the other. Upon centrifugation, particles move through the interfaces between layers and band at the interface that matches their density. This format is widely used for its preparative simplicity and effectiveness, as demonstrated in mitochondrial purification protocols where a crude organelle pellet is resuspended and layered atop a pre-formed gradient [3] [4].
- Continuous Gradients: These provide a smooth, linear increase in density. They can be formed manually or using specialized gradient-making equipment. Continuous gradients can offer higher resolution for separating particles with very similar densities.
- Self-Generating Gradients: In some cases, such as with CsCl for DNA separation, the gradient material redistributes under high centrifugal force to form a continuous density gradient in situ, within which the sample components then band [2] [5].
The table below summarizes the properties of common gradient media used in cellular component separation.
Table 1: Properties of Common Density Gradient Media
| Medium | Typical Stock Solution Concentration | Stock Density (g/cm³) | Key Characteristics and Applications |
|---|---|---|---|
| Sucrose | 65% (w/w) | ~1.32 | High osmotic pressure; widely used for organelle separation but can penetrate and shrink some organelles. |
| Percoll | 100% (Colloidal Silica) | ~1.13 | Low viscosity, low osmotic pressure; ideal for separating intact, functional organelles like mitochondria [4] [6]. |
| Nycodenz/Iodixanol | Varies | Varies | Inert, non-ionic; low osmolarity and viscosity; excellent for preserving organelle function [1]. |
| Ficoll | 46.5% (w/w) | 1.16 (at 4°C) | A synthetic polymer; low osmolarity; often used in lymphocyte isolation and some organelle separations. |
| CsCl | 60% (w/w) | 1.79 (at 20°C) | Very high density; primarily used for the separation of nucleic acids and viruses [5]. |
Experimental Protocols for Mitochondrial Purification
Protocol 1: Purification from Cultured Cells using a Discontinuous Sucrose Gradient
This protocol is adapted from standard methods for isolating mitochondria from cultured mammalian cells for downstream analyses such as western blotting [7].
Workflow Overview:
Required Reagents and Buffers:
- Homogenization Buffer: 10 mM Tris-HCl (pH 6.7), 10 mM KCl, 0.15 mM MgCl₂, 1 mM PMSF, 1 mM DTT (added fresh).
- Mitochondrial Suspension Buffer: 10 mM Tris-HCl (pH 6.7), 0.25 M sucrose, 0.15 mM MgCl₂, 1 mM PMSF, 1 mM DTT.
- Sucrose Solutions: For a discontinuous gradient, prepare solutions of 30%, 40%, and 60% (w/w) sucrose in a suitable buffer (e.g., 10 mM Tris-HCl, pH 7.4).
- NKM Wash Buffer: 1 mM Tris-HCl (pH 7.4), 0.13 M NaCl, 5 mM KCl, 7.5 mM MgCl₂.
Step-by-Step Procedure:
- Cell Homogenization: Harvest and wash cells in NKM buffer. Resuspend the cell pellet in 6 packed cell volumes of ice-cold Homogenization Buffer. Incubate on ice for 10 minutes. Transfer to a Dounce homogenizer and apply 20-30 strokes with a tight-fitting pestle. Monitor cell breakage under a microscope; ~60% lysis is optimal.
- Crude Mitochondrial Isolation: Transfer the homogenate to a tube and add 1 packed cell volume of 2 M sucrose solution. Mix gently. Centrifuge at 1,200 x g for 5 minutes at 4°C to pellet nuclei and unbroken cells. Carefully transfer the supernatant (S1) to a new tube. Repeat this low-speed spin to ensure complete removal of debris. Transfer the clarified supernatant to a fresh tube and centrifuge at 7,000 x g for 10 minutes at 4°C. The resulting pellet (P2) is the crude mitochondrial fraction.
- Density Gradient Purification: Resuspend the crude mitochondrial pellet gently in a small volume of Mitochondrial Suspension Buffer. Prepare a discontinuous sucrose gradient in an ultracentrifuge tube by carefully layering solutions from bottom to top: 60% sucrose, 40% sucrose, 30% sucrose. Layer the resuspended crude mitochondria on top of the gradient. Balance the tubes precisely. Centrifuge at 52,000 x g for 90 minutes at 4°C.
- Mitochondrial Recovery: After centrifugation, mitochondria will typically band at the interface between the 40% and 60% sucrose layers. Use a Pasteur pipette or a syringe with a long, blunt needle to carefully aspirate the mitochondrial band. Transfer the purified mitochondria to a new tube, dilute with at least 3 volumes of Mitochondrial Suspension Buffer, and pellet by centrifuging at 15,000 x g for 20 minutes. Discard the supernatant and resuspend the final, purified mitochondrial pellet in an appropriate buffer for downstream applications [3] [7].
Protocol 2: Purification from Tissue using a Discontinuous Percoll Gradient
This method, optimized for sensitive tissues like plant moss or mammalian brain, uses Percoll to obtain mitochondria with high structural integrity and functional activity [4] [6].
Workflow Overview:
Required Reagents and Buffers:
- Homogenization Buffer (HB): 210 mM mannitol, 70 mM sucrose, 5 mM HEPES (pH 7.2). Supplemented (HBS) with 1 mM EGTA and protease inhibitors before use. For plant tissues, additives like Polyvinylpyrrolidone (PVP, to bind phenolics) and sodium ascorbate (antioxidant) are critical [6].
- Percoll Solutions: Prepare a 50% (v/v) stock by mixing Percoll with 2x concentrated HB. Then, dilute this stock with HBS to make 22% and 15% Percoll solutions.
Step-by-Step Procedure:
- Sample Preparation: Quickly mince approximately 1 gram of fresh tissue on ice. For resilient tissues, a pre-treatment with a low-temperature immersion in cold homogenization buffer can improve yield [6].
- Homogenization and Differential Centrifugation: Homogenize the tissue in ice-cold HBS using a Potter-Elvehjem homogenizer with a motor-driven Teflon pestle (e.g., 20 strokes). Centrifuge the homogenate at 1,500 x g for 3-5 minutes to remove debris, nuclei, and unbroken cells. Transfer the supernatant to a new tube and centrifuge at 13,000 x g for 15 minutes to pellet the crude mitochondria.
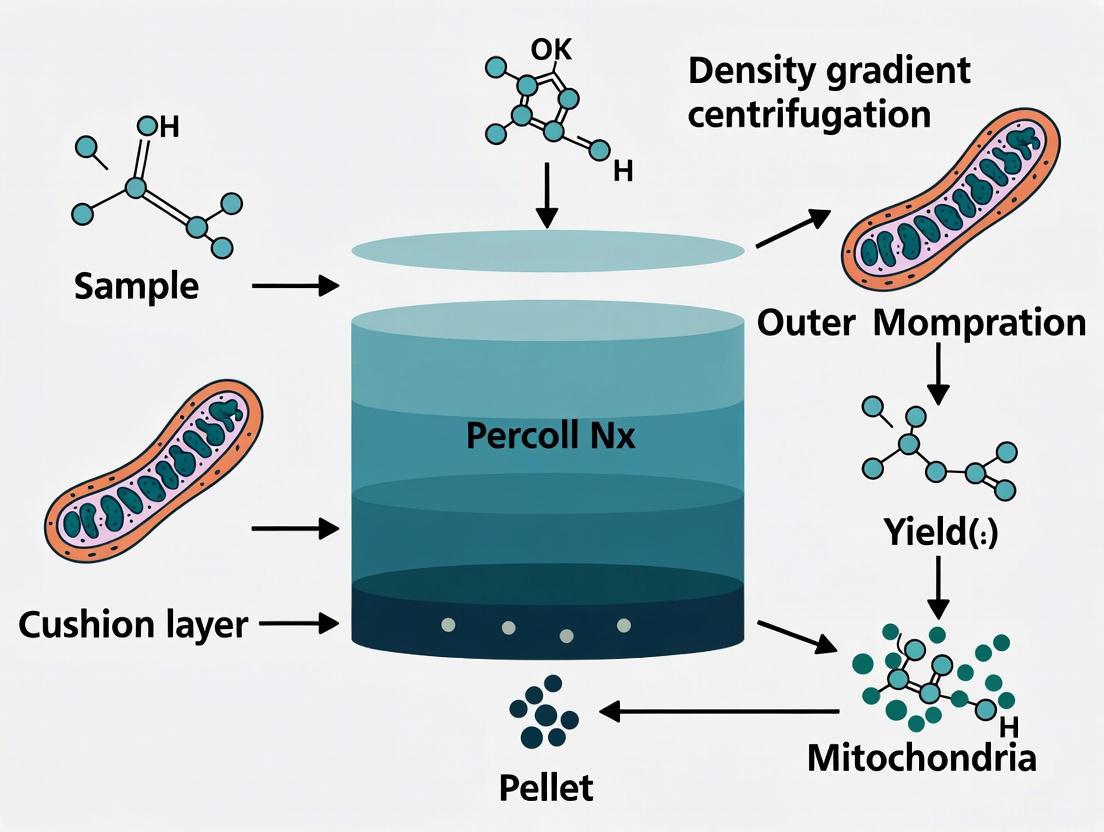
- Percoll Gradient Purification: Gently resuspend the crude mitochondrial pellet in a small volume of HBS. Mix this suspension with 50% Percoll to achieve a final concentration of 15% Percoll. In an ultracentrifuge tube, layer 1 mL of 50% Percoll as a cushion, then carefully overlay with 3 mL of 22% Percoll. Finally, layer the 15% Percoll/mitochondria mixture on top. Centrifuge at 30,700 x g for 6-10 minutes at 4°C.
- Mitochondrial Recovery and Washing: After centrifugation, purified mitochondria form a tight band at the interface between the 22% and 50% Percoll layers. Collect this band using a pipette. To remove the Percoll particles, dilute the collected fraction with at least 10 volumes of HBS or mitochondrial assay buffer. Centrifuge at 15,600 x g for 30 minutes. The resulting pellet contains highly purified and functional mitochondria [4].
The Scientist's Toolkit: Essential Reagents for Mitochondrial Isolation
Table 2: Key Research Reagent Solutions for Mitochondrial Purification
| Reagent/Buffer | Core Function | Key Components and Their Roles |
|---|---|---|
| Homogenization Buffer | Lyse cells and release organelles while preserving integrity. | Sucrose/Mannitol: Osmotic stabilizer. HEPES/Tris: pH buffer. EGTA: Chelates Ca²⁺ to inhibit damaging enzymes. PMSF/DTT: Protease inhibitors. |
| Density Gradient Medium | Forms the density matrix for isopycnic separation. | Percoll/Sucrose/Nycodenz: Inert solute to create density range. Choice depends on required density, osmolarity, and intended downstream use. |
| Mitochondrial Suspension/Wash Buffer | Maintains mitochondrial integrity after purification. | Sucrose: Provides osmotic support. HEPES: Maintains physiological pH. BSA/EDTA: Can be added to absorb fatty acids and chelate metals, respectively. |
| Protease Inhibitor Cocktail | Prevents proteolytic degradation of mitochondrial proteins. | PMSF, Leupeptin, Aprotinin, etc.: Broad-spectrum inhibitors of serine, cysteine, and metalloproteases. Essential for functional and proteomic studies. |
Assessment of Purity and Functionality
Validating the success of a density gradient separation is a critical step. This involves assessing both the purity of the mitochondrial fraction and the functional integrity of the isolated organelles.
- Purity Analysis: Western blotting is the most common method for assessing purity. The mitochondrial fraction is probed for a specific marker protein, such as Voltage-Dependent Anion Channel (VDAC) or Succinate Dehydrogenase. To check for contamination from other organelles, the same fraction is probed for markers of other compartments, such as RbcL for chloroplasts (in plants), catalase for peroxisomes, or β-actin for cytosol. A pure mitochondrial preparation will show a strong signal for the mitochondrial marker and negligible signals for contaminant markers [7] [6].
- Functional Integrity Assays:
- Membrane Potential (ΔΨm): This is a key indicator of healthy mitochondria. It can be measured using fluorescent dyes like JC-1 or TMRE. Functional mitochondria with a high membrane potential accumulate the dye, resulting in a shift in fluorescence (e.g., JC-1 aggregates emit red fluorescence), while depolarized mitochondria do not [6].
- Enzymatic Activity: The activity of electron transport chain complexes, such as Cytochrome c Oxidase (COX), can be measured spectrophotometrically. High specific activity confirms that the mitochondria are not only intact but also functionally active [6].
- Structural Integrity: Staining with organelle-specific dyes like MitoTracker or Janus Green B, followed by microscopy, allows for visual confirmation of mitochondrial morphology and integrity [6].
Density gradient centrifugation provides a powerful and versatile mechanism for resolving the complex mixture of a cell homogenate into highly purified components. By exploiting the fundamental property of buoyant density, this technique enables the isolation of organelles like mitochondria in a state of high purity and functional integrity, which is indispensable for accurate downstream biochemical, proteomic, and functional analyses. The choice of gradient medium and specific protocol parameters can be optimized for different starting materials, from cultured cells to challenging tissues, ensuring the reliability and reproducibility of this essential method in mitochondrial research.
Key Historical Developments in Mitochondrial Purification Techniques
Mitochondria, as the powerhouses of eukaryotic cells, are indispensable for energy production, calcium homeostasis, and regulation of apoptotic pathways. The study of these multifaceted organelles relies fundamentally on the ability to isolate them with high purity and functionality. The evolution of mitochondrial purification techniques mirrors advances in cellular biology, moving from simple separations based on physical properties to highly specific isolations targeting unique molecular signatures. Within the context of a broader thesis on density gradient centrifugation, this review traces the key historical developments in mitochondrial purification. It provides detailed protocols and application notes designed to equip researchers and drug development professionals with the practical knowledge to select and implement the most appropriate methods for their specific experimental goals, particularly when high-purity organelles are required for sophisticated downstream applications like proteomics and lipidomics.
Historical Timeline of Key Methodological Developments
The pursuit of purer and more functional mitochondrial preparations has driven significant innovation over decades. The following table summarizes the pivotal milestones in this field.
Table 1: Historical Timeline of Key Mitochondrial Purification Techniques
| Time Period | Key Development | Underlying Principle | Key Advantage(s) | Primary Application Scope |
|---|---|---|---|---|
| Mid-20th Century | Differential Centrifugation | Separation by size and density via sequential centrifugation speeds [8] [7] | Simplicity, speed, preservation of function [9] | Crude isolation for basic functional assays |
| 1980 | Density Gradient Centrifugation (Percoll) | Separation by buoyant density using a Percoll medium [10] | Reduced contamination from SR and other organelles [11] [10] | High-purity isolation from challenging tissues like skeletal muscle |
| Early 2000s | Immunoaffinity Purification (Magnetic Beads) | Antibody-mediated binding to outer membrane proteins (e.g., TOMM22) [12] [13] | High specificity, isolation of sub-populations [12] [9] | Cell-type or compartment-specific mitochondria (e.g., synaptic) |
| Recent Advances (2010s+) | Hybrid & Advanced Techniques | Combines differential centrifugation with filtration or beads [14] [13] | Improved uniformity, yield from small samples [14] [13] | High-resolution 'omics' studies (e.g., lipidomics, proteomics) |
Foundational Technique: Differential Centrifugation
Principles and Applications
Differential centrifugation represents the most foundational and widely used method for mitochondrial isolation. Its core principle relies on the sequential use of increasing centrifugal forces to separate cellular components based on their size and density. Initial low-speed spins remove intact cells, nuclei, and large debris, while subsequent high-speed centrifugation pellets the mitochondria, leaving lighter organelles and vesicles in the supernatant [8] [7]. This method is prized for its simplicity, cost-effectiveness, and the ability to produce mitochondria with well-preserved respiratory function suitable for many bioenergetic studies [9]. However, a significant limitation is the substantial contamination by other organelles, such as the endoplasmic reticulum, peroxisomes, and Golgi membranes, which can confound downstream analyses [11] [9].
Detailed Protocol: Isolation from Cultured Cells
This protocol is optimized for the isolation of a crude mitochondrial fraction from cultured mammalian cells for western blot analysis [7].
Reagents Required:
- NKM Buffer: 1 mM Tris-HCl (pH 7.4), 0.13 M NaCl, 5 mM KCl, 7.5 mM MgCl₂.
- Homogenization Buffer: 10 mM Tris-HCl (pH 6.7), 10 mM KCl, 0.15 mM MgCl₂. Always add fresh 1 mM PMSF and 1 mM DTT immediately before use.
- Mitochondrial Suspension Buffer: 10 mM Tris-HCl (pH 6.7), 0.15 mM MgCl₂, 0.25 M sucrose, with fresh 1 mM PMSF and 1 mM DTT.
- 2 M Sucrose solution.
Procedure:
- Cell Harvesting: Collect cells by centrifugation at 370 × g for 10 minutes at 4°C. Decant the supernatant and wash the pellet by resuspending it in 10 volumes of ice-cold NKM buffer and re-pellet. Repeat this wash step twice.
- Cell Permeabilization: Resuspend the final cell pellet in 6 packed-cell volumes of Homogenization Buffer. Transfer the suspension to a glass Dounce homogenizer and incubate on ice for 10 minutes.
- Homogenization: Homogenize the cells with approximately 30 strokes of a tight-fitting pestle. To optimize yield and avoid damage, check a small aliquot under a microscope; target around 60% cell breakage.
- Clarification: Pour the homogenate into a tube containing 1 packed-cell volume of 2 M sucrose and mix gently. Centrifuge the mixture at 1,200 × g for 5 minutes at 4°C to pellet nuclei and unbroken cells. Transfer the supernatant to a new tube and repeat the centrifugation step to ensure complete clarification.
- Mitochondrial Pelletting: Centrifuge the pooled supernatant at 7,000 × g for 10 minutes at 4°C. The resulting pellet contains the crude mitochondrial fraction.
- Wash: Resuspend the mitochondrial pellet in 3 volumes of Mitochondrial Suspension Buffer and centrifuge again at 9,500 × g for 5 minutes at 4°C. The final pellet can be resuspended in an appropriate buffer for downstream analysis.
The following diagram illustrates the workflow and decision points in this differential centrifugation protocol:
The Resolution Revolution: Density Gradient Centrifugation
Principles and Applications
The introduction of density gradient centrifugation, particularly using media like Percoll, marked a significant leap forward in achieving high-purity mitochondrial preparations. This technique separates organelles based on their buoyant density rather than size alone. A heterogeneous crude mitochondrial extract is layered onto a pre-formed gradient of increasing density and subjected to high-speed centrifugation. Organelles migrate until they reach a zone with a density matching their own, resulting in highly purified bands that can be collected separately [11] [4]. This method is exceptionally effective at removing contaminating organelles like lysosomes, peroxisomes, and sarcoplasmic reticulum fragments, which are common in preparations from tissues like skeletal muscle [11] [10]. As evidenced by proteomic and lipidomic analyses, mitochondria purified via density gradient ultracentrifugation (UC) show the highest enrichment of mitochondrial-specific markers, such as cardiolipins, and the most effective depletion of contaminants from other organelles [9].
Detailed Protocol: Percoll Purification from Skeletal Muscle
This protocol details the isolation of high-purity, functional mitochondria from mouse skeletal muscle using a discontinuous Percoll gradient [11].
Reagents Required:
- IM Buffer: For homogenization and dilution.
- Percoll Solutions: 40%, 24%, and 15% (v/v) Percoll in 1X IM Buffer.
- MAS Buffer: For resuspending the final mitochondrial pellet.
- Nagarse (Protease): For tissue digestion.
Procedure:
- Tissue Preparation: Excise the quadriceps femoris muscle, remove connective tissue, and mince finely on ice. Digest the minced tissue in IM Buffer containing Nagarse (0.6 mg/ml) for 5 minutes at room temperature.
- Homogenization: Transfer the digested tissue to a Dounce homogenizer and homogenize with a loose-fitting pestle for 10 strokes. Add more IM buffer and perform an additional 1-3 strokes.
- Crude Mitochondrial Isolation: Centrifuge the homogenate at 1,000 × g for 5 minutes at 4°C. Collect the supernatant, avoiding the floating lipid layer. Resuspend the pellet in more IM buffer, re-centrifuge, and pool the supernatants. Centrifuge the pooled supernatants at 21,000 × g for 10 minutes to pellet the crude mitochondria.
- Percoll Gradient Preparation: In a 10 ml polycarbonate ultracentrifuge tube, create a discontinuous gradient by carefully layering 3.7 ml of 24% Percoll on top of a 1.5 ml cushion of 40% Percoll, maintaining a sharp interface.
- Density Gradient Centrifugation: Resuspend the crude mitochondrial pellet in 2 ml of 15% Percoll and filter through a 70 μm nylon filter. Gently layer this suspension on top of the prepared Percoll gradient. Centrifuge at 30,750 × g for 10 minutes at 4°C with slow acceleration and no brake.
- Mitochondrial Collection and Wash: After centrifugation, collect the enriched mitochondrial band found at the interface between the 24% and 40% Percoll layers. Transfer this band to a new tube, dilute with at least 6 ml of IM buffer, and centrifuge at 16,750 × g for 10 minutes to pellet the purified mitochondria. Wash the pellet once more in IM buffer with BSA and a final time in MAS buffer without BSA.
- Resuspension: Gently resuspend the final mitochondrial pellet in a small volume of MAS buffer for immediate functional analysis or other downstream applications.
The workflow for this high-purity purification is more complex, involving the creation and use of a density gradient, as shown below:
The Modern Era of Specificity: Immunoaffinity and Hybrid Techniques
Principles and Applications
The most recent paradigm shift in mitochondrial purification leverages antibody-based affinity to isolate specific sub-populations with unparalleled precision. These methods typically use magnetic beads conjugated to antibodies against proteins abundant on the outer mitochondrial membrane, such as TOMM20 or TOMM22 [12] [13]. When a cell or tissue homogenate is incubated with these beads, mitochondria bind specifically and can be retrieved using a magnetic field. This technique bypasses the need for high-speed centrifugation, which can be damaging, and allows for the isolation of mitochondria from specific cellular compartments, such as synaptic mitochondria from brain tissue, which are critically involved in neurodegenerative diseases [13]. A key development is Fractionated Mitochondrial Magnetic Separation (FMMS), which uses sequential magnetic pulldowns to isolate both non-synaptic and synaptic mitochondria from the same sample without ultracentrifugation, resulting in a 3x higher synaptic mitochondrial yield compared to UC methods [13].
Detailed Protocol: Immuno-Magnetic Isolation (MACS)
This protocol outlines the core principles of immuno-magnetic isolation for mitochondria, which can be adapted for different tissues and sub-populations [12] [13].
Reagents Required:
- Mitochondrial Isolation Buffer: Typically a sucrose- or mannitol-based isotonic buffer with protease inhibitors.
- Anti-TOMM22/TOMM20 Magnetic Beads: Commercially available or prepared by conjugating the antibody to paramagnetic beads.
- MACS Column and Magnetic Stand.
Procedure:
- Sample Preparation: Generate a homogenate from cells or tissue using a gentle method (e.g., Dounce homogenizer) in ice-cold isolation buffer.
- Antibody Incubation: Incubate the clarified homogenate (after a low-speed spin to remove nuclei) with the magnetic antibody beads for a specified time (e.g., 1 hour) on a rotator at 4°C. Optimization is critical; for brain tissue, saturation may require >3-4 μL of bead solution per mg of tissue [13].
- Magnetic Separation: Apply the bead-mitochondria mixture to a MACS column placed in a magnetic field. The labeled mitochondria will be retained in the column, while unbound contaminants flow through.
- Washing: Wash the column with several volumes of isolation buffer to remove non-specifically bound material.
- Elution: Remove the column from the magnetic field and elute the purified, bead-bound mitochondria by flushing with an appropriate buffer.
Comparative Performance and Applications
The choice of purification method has a profound impact on the yield, purity, and functionality of the isolated mitochondria, which in turn dictates the validity and interpretation of downstream experiments.
Table 2: Quantitative Comparison of Mitochondrial Yield and Purity
| Purification Method | Reported Protein Yield | Key Purity Indicators | Reported Respiratory Control Ratio (RCR) |
|---|---|---|---|
| Differential Centrifugation | Varies widely with starting material | Significant ER, Golgi, and nuclear contamination [9] | Functional, but assays can be confounded by contaminants |
| Percoll Density Gradient | ~200-400 μg from 100-200 mg mouse muscle [11] | High enrichment of mitochondrial proteins via proteomics; low contamination [15] [11] | 3.9 - 7.1 (using various substrates) [11] |
| Immunoaffinity (FMMS) | 3x higher synaptic yield vs. UC from hippocampus [13] | High specificity for mitochondrial sub-populations; purity confirmed by Western blot [13] | Comparable to, or slightly higher than, UC methods [13] |
Table 3: Suitability for Downstream Applications
| Application | Differential Centrifugation | Density Gradient Centrifugation | Immunoaffinity Purification |
|---|---|---|---|
| Respiratory Functional Assays | Good [9] | Excellent [11] [10] | Excellent [13] |
| Western Blotting | Good [7] | Excellent | Excellent |
| Proteomics & Lipidomics | Limited (high contamination) [9] | Excellent (gold standard for purity) [15] [9] | Excellent (for specific sub-populations) [12] |
| Isolation of Sub-populations | Not possible | Possible with specialized protocols [8] [13] | Superior (e.g., synaptic vs. non-synaptic) [13] |
The Scientist's Toolkit: Essential Reagents for Mitochondrial Purification
Successful isolation of high-quality mitochondria depends on the use of specific, well-formulated reagents.
Table 4: Essential Research Reagent Solutions for Mitochondrial Isolation
| Reagent / Tool | Function / Rationale | Example Components |
|---|---|---|
| Isotonic Homogenization Buffer | Maintains osmotic balance to prevent organelle rupture during cell disruption. | Mannitol, Sucrose, HEPES or Tris buffer, EGTA [8] [4] |
| Protease Inhibitors | Protects mitochondrial proteins from degradation during isolation. | PMSF, DTT, EDTA-free commercial cocktails [7] [4] |
| Density Gradient Media | Separates organelles based on buoyant density for high-purity isolation. | Percoll, Sucrose, Ficoll [8] [11] |
| Fatty-Acid Free BSA | Binds free fatty acids and contaminants during washes, improving function and purity. | Added to wash buffers in skeletal muscle protocols [11] |
| Specific Antibodies | Targets mitochondria for immunoaffinity isolation; defines the specificity of the protocol. | Anti-TOMM22, Anti-TOMM20 conjugated to magnetic beads [12] [13] |
| Respiratory Assay Buffers | Provides specific substrates and conditions to probe mitochondrial function. | MAS buffer, ADP, Oligomycin, FCCP, Rotenone, Antimycin A [11] |
The field of mitochondrial purification has evolved remarkably from the one-size-fits-all approach of differential centrifugation to the high-purity, high-specificity methods available today. Density gradient centrifugation remains a cornerstone technique for applications demanding the highest level of general purity, such as lipidomics and proteomics, as it most effectively removes contaminating organelles. The development of immunoaffinity techniques has opened new frontiers by enabling the selective isolation of mitochondrial sub-populations, which is crucial for understanding their distinct roles in health and disease in complex tissues like the brain. The choice of method is not merely a technical decision but a foundational one that directly shapes experimental outcomes. Future directions will likely involve further refinement of these techniques to minimize processing time, maximize yield from precious samples, and allow for even more precise functional and molecular characterization of these vital organelles.
Within the context of mitochondrial research, the purification of functional and high-quality mitochondria is a prerequisite for reliable downstream analyses, including bioenergetic assessments and proteomic studies. Density gradient centrifugation serves as a critical technique for separating mitochondria from contaminating organelles such as lysosomes, peroxisomes, and various membranes, which often co-sediment with crude mitochondrial fractions obtained via differential centrifugation [16] [1]. The choice of density medium profoundly influences the purity, functionality, and overall yield of the isolated mitochondria. This application note provides a detailed comparison of four common density media—Sucrose, Percoll, Nycodenz, and Iodixanol—framed within a broader thesis on mitochondrial purification. It is designed to equip researchers and drug development professionals with the protocols and data necessary to select the optimal medium for their specific experimental requirements.
Characteristics and Comparison of Density Media
The selection of a density medium impacts not only the purity of the final mitochondrial preparation but also its functional integrity. Key properties of these media include viscosity, osmolarity, and the potential for organelle damage.
Table 1: Comparative Properties of Density Gradient Media for Mitochondrial Isolation
| Medium | Chemical Composition | Viscosity | Osmolarity | Typical Working Concentration Range | Key Advantages | Key Limitations |
|---|---|---|---|---|---|---|
| Sucrose | Disaccharide | High | Hyperosmotic | 0.25 - 2.0 M | Low cost, widely available | High osmolarity can damage organelles, high viscosity [17] |
| Percoll | Colloidal silica coated with PVP | Low | Physiological, iso-osmotic | 15% - 50% [16] [4] | Low viscosity, self-forming gradients, maintains mitochondrial function [16] [11] | Difficult to remove completely, may interfere with downstream assays [16] |
| Nycodenz | Tri-iodinated benzoic acid derivative | Moderate | Low, can be adjusted to iso-osmotic | - | Non-ionic, low osmolarity, inert | - |
| Iodixanol | Non-ionic, iso-osmotic dimer | Moderate | Iso-osmotic | - | Iso-osmotic, minimal organelle stress, inert | Higher cost compared to sucrose and Percoll |
Table 2: Application-Based Performance of Density Media in Mitochondrial Purification
| Performance Metric | Sucrose | Percoll | Nycodenz | Iodixanol |
|---|---|---|---|---|
| Purity (Contaminant Removal) | Moderate [1] | High [16] [11] | High [1] | High [1] |
| Mitochondrial Functionality | Potential compromise due to osmolarity | High (RCR 3.9-7.1) [16] | Preserved | Preserved |
| Suitability for Proteomics | Less suitable due to contamination | Highly suitable (high enrichment confirmed) [16] | Suitable | Suitable |
| Typical Yield (Mouse Muscle) | - | ~200-400 µg from 100-200 mg tissue [16] | - | - |
| Ease of Use & Protocol Speed | Standard, requires precise gradient preparation | Fast, discontinuous gradients common; protocol ~3-4h [16] | Standard | Standard |
Detailed Experimental Protocols
Mitochondrial Isolation from Mouse Skeletal Muscle using Percoll Gradients
This protocol, adapted from Anunciado-Koza et al. (2023), yields high-purity, functional mitochondria from murine skeletal muscle, ideal for respirometry and proteomics [16] [11].
Reagents and Solutions:
- Homogenization Buffer (HB): 210 mM mannitol, 70 mM sucrose, 5 mM HEPES (pH 7.4). Supplement with 1 mM EGTA and protease inhibitors as needed [4].
- Isolation Medium (IM): As per the specific protocol, often similar to HB [16].
- Percoll Solutions: Prepare in 1X IM buffer (pH 7.4): 15%, 24%, and 40% Percoll [16].
- MAS Buffer: For resuspending the final mitochondrial pellet.
Procedure:
- Tissue Harvest and Homogenization: Euthanize the mouse without anesthesia to preserve mitochondrial function [16]. Rapidly dissect the quadriceps femoris muscle (100-200 mg), remove connective tissue, and mince it on ice in IM buffer containing Nagarse (0.6 mg/ml) for 2 minutes. Digest the tissue for 5 minutes at room temperature. Transfer the digested tissue to a Dounce homogenizer and homogenize with 10-13 strokes using a loose-fitting pestle [16].
- Differential Centrifugation: Transfer the homogenate to a tube and centrifuge at 1,000 g for 5 min at 4°C. Collect the supernatant, avoiding the flocculent layer. Resuspend the pellet in IM buffer, re-centrifuge at 1,000 g, and pool the supernatants. Centrifuge the pooled supernatants at 21,000 g for 10 min to pellet the crude mitochondrial fraction [16].
- Percoll Density Gradient Purification:
- Prepare a discontinuous gradient in a 10 mL polycarbonate tube by carefully layering 3.7 mL of 24% Percoll, then underlaying with 1.5 mL of 40% Percoll, maintaining a sharp interface [16].
- Resuspend the crude mitochondrial pellet in 2 mL of 15% Percoll and filter through a pre-wetted 70 μm nylon filter.
- Carefully layer the filtrate on top of the prepared discontinuous gradient.
- Centrifuge at 30,750 g for 10 min at 4°C with slow acceleration and no brake.
- Mitochondrial Collection and Washing: After centrifugation, a distinct mitochondrial band will be visible at the interface between the 24% and 40% Percoll layers. Carefully aspirate and discard the upper layers and collect the mitochondrial band. Dilute the collected fraction with at least 6 mL of IM buffer and centrifuge at 16,750 g for 10 min to wash out the Percoll. Resuspend the final pellet in a suitable buffer (e.g., MAS + 0.5% BSA) for functional assays or in a BSA-free buffer for proteomics [16].
Figure 1: Workflow for Mitochondrial Purification via Percoll Density Gradient Centrifugation.
Protocol for Iodixanol (OptiPrep) Density Gradient Centrifugation
Iodixanol is favored for its iso-osmotic properties, minimizing osmotic stress on organelles.
Procedure:
- Homogenate Preparation: Prepare a tissue homogenate or cell lysate in an isotonic buffer (e.g., 0.25 M sucrose) using a Dounce homogenizer.
- Crude Mitochondrial Pellet: Subject the homogenate to differential centrifugation to obtain a crude mitochondrial pellet (e.g., 1,000 g for 10 min to remove nuclei/debris, followed by 10,000 g for 20 min to pellet mitochondria) [17].
- Gradient Formation and Centrifugation: Resuspend the crude mitochondrial pellet in a small volume of isotonic buffer. Prepare a discontinuous gradient, for example, by layering solutions of decreasing density (e.g., 30%, 25%, 20%, 15% iodixanol) in a centrifuge tube. Carefully layer the mitochondrial suspension on top of the gradient. Centrifuge at high speed (e.g., 50,000 g for 1-2 hours) using a swinging-bucket rotor with slow acceleration and deceleration settings.
- Collection and Washing: Mitochondria will typically band at their equilibrium density. Collect the band, dilute it with isolation buffer, and pellet the mitochondria by centrifugation at 10,000 g for 15 min. The final pellet consists of highly purified mitochondria.
The Scientist's Toolkit: Essential Research Reagents
Table 3: Essential Reagents and Materials for Mitochondrial Isolation
| Reagent/Material | Function/Description | Example |
|---|---|---|
| Density Gradient Media | Forms the density barrier for organelle separation. | Percoll (colloidal silica) [16], Iodixanol (OptiPrep) [17] |
| Protease Inhibitor Cocktail | Prevents proteolytic degradation during isolation. | EDTA-free tablets [4] |
| Fatty Acid-Free BSA | Binds free fatty acids that can uncouple mitochondrial respiration. | Added to isolation and wash buffers [16] |
| HEPES or MOPS Buffer | Provides pH stability during the isolation procedure. | 5-10 mM, pH 7.4 [18] [4] |
| Osmotic Support | Maintains osmotic integrity of mitochondria. | Mannitol (0.21 M) and Sucrose (0.07 M) [4] |
| Dounce Homogenizer | Efficiently disrupts tissue/cells while preserving organelle integrity. | Glass homogenizer with loose-fitting pestle [16] |
The choice between sucrose, Percoll, Nycodenz, and iodixanol is dictated by the specific goals of the research. For routine isolations where maximum mitochondrial functionality is critical, Percoll is an excellent choice due to its low viscosity and proven success in yielding respiring organelles [16]. When the highest purity is required for sensitive applications like proteomics, or when osmotic stress must be minimized, Iodixanol is superior due to its inertness and iso-osmotic properties [17] [1]. Sucrose, despite its historical use and low cost, is less ideal for purifying highly functional mitochondria due to its hyperosmotic nature. As mitochondrial research progresses toward single-organelle analysis and the study of heterogeneous populations, the demand for highly refined purification techniques that combine these media with advanced methods like immunoisolation and flow cytometry will continue to grow [12].
Differential Centrifugation as a Preliminary Separation Step
Differential centrifugation is a fundamental technique in biochemistry and cell biology for the separation of organelles and other sub-cellular particles based on their sedimentation rate [19]. This process involves subjecting a tissue homogenate to repeated centrifugations, where particles that sediment quickly at a given centrifugal force form a compact "pellet" at the bottom of the tube [19]. The supernatant is then sequentially centrifuged at increased forces to pellet out progressively smaller components [19].
In the context of mitochondrial purification research, differential centrifugation serves as a critical preliminary step to rapidly isolate a crude mitochondrial fraction from a complex cellular homogenate before further refinement using density gradient centrifugation. This initial separation effectively removes nuclei, cellular debris, and other larger organelles, providing a partially purified mitochondrial sample suitable for subsequent high-resolution purification.
Theoretical Principles
The rate of particle sedimentation during differential centrifugation depends on multiple factors, including the applied gravitational force, the density difference between the particle and the medium, the fluid viscosity, and the particle's size and shape [19]. Larger and denser particles sediment more quickly and at lower centrifugal forces compared to smaller, less dense ones [20].
The following equation governs the sedimentation process in a viscous fluid:
t ≅ 6π × (η × l) / (d² × (ρ - ρ₀) × G) [21]
Where:
- t = sedimentation time
- η = viscosity of the suspension (kg.m⁻¹.s⁻¹)
- l = pathlength of suspension in centrifuge tube (m)
- d = average diameter of the particle (m)
- ρ and ρ₀ = densities of particle and solvent, respectively (kg.m³)
- G = centrifugal force (m.s⁻²)
It is important to note that the Relative Centrifugal Force (RCF or g-force), rather than revolutions per minute (RPM), is the appropriate metric for standardizing centrifugation protocols [21]. RCF can be calculated using the formula: RCF = (1.118 × 10⁻³) × r × RPM², where 'r' is the radius in meters [21].
Key Parameters for Optimization
Several critical parameters must be controlled to ensure efficient separation and maintain mitochondrial integrity:
- Temperature: While lower temperatures (e.g., 4°C) help minimize protein degradation, they increase medium viscosity. The viscosity of water increases from 1.11 g.m⁻¹.s⁻¹ at 25°C to 1.49 g.m⁻¹.s⁻¹ at 4°C, potentially increasing required sedimentation time or RCF by 25% [21].
- Osmolarity: The ionic composition of the suspension medium affects viscosity through water structuring. Kosmotropic ions increase viscosity while chaotropic ions decrease it [21].
- Medium Composition: Sucrose solutions (typically 0.25-0.34 M) are commonly used as they are isosmolar, help maintain oxidative phosphorylation, and provide shorter sedimentation times compared to more concentrated solutions [22].
Experimental Protocol: Crude Mitochondrial Isolation from Cells
Reagents and Equipment
- TES Buffer: 70 mM Tris base, 1 mM EDTA, 0.25 M sucrose, pH 7.4 [23]
- TMG Buffer: 10 mM Tris, 5 mM MgCl₂, 20% (v/v) glycerol [23]
- Dounce homogenizer (loose and tight fitting) [23]
- Refrigerated centrifuge capable of 10,000 × g [23]
- Ultracentrifuge (optional for subsequent steps) [23]
Step-by-Step Procedure
Start with a cell pellet (minimum from a confluent 10cm dish for crude preparation; 3-6 confluent T175 flasks for sub-fractionation). Keep the pellet cold on ice throughout [23].
Wash the cell pellet with 1X PBS and centrifuge at 1,200 × g, 21°C for 5 minutes [23].
Homogenize the cells in approximately 1,000 µL of ice-cold TES buffer using a loose-fit homogenizer (10 turns with strong force). Transfer to a tight-fitting glass Dounce homogenizer and homogenize with 10 strong strokes [23].
Perform sequential centrifugations as outlined in Table 1.
Resuspend the final mitochondrial pellet in TMG buffer and determine protein concentration (minimum 0.7 mg/mL for most applications) [23].
Table 1: Differential Centrifugation Scheme for Mitochondrial Isolation [23] [19]
| Sample Input | G-Force | Time | Temperature | Pellet Contents | Supernatant Contents |
|---|---|---|---|---|---|
| Cell homogenate | 1,000 × g | 10 min | 4°C | Nuclei, unbroken cells | Cytosol, organelles |
| Supernatant from previous step | 9,800 × g | 15 min | 4°C | Crude mitochondria (red/brown/yellow, flaky) | Cytosol, microsomes |
| Optional: Wash mitochondrial pellet | 9,800 × g | 10 min | 4°C | Washed mitochondria | Wash contaminants |
Expected Results and Quality Assessment
A successful preparation yields a red/brown/yellow, flaky, hydrophobic mitochondrial pellet. Contamination appearing as a white fluffy layer around the mitochondrial pellet can be carefully removed with a pipette [23]. The crude mitochondrial fraction maintains a relatively high degree of normal functioning when isolated under appropriate conditions [19].
Differential Centrifugation Workflow
The following diagram illustrates the complete workflow for differential centrifugation as a preliminary step for mitochondrial isolation:
Research Reagent Solutions
Table 2: Essential Materials for Differential Centrifugation
| Reagent/Equipment | Function/Specification | Application Notes |
|---|---|---|
| TES Buffer | 70 mM Tris base, 1 mM EDTA, 0.25 M sucrose, pH 7.4 | Maintains osmolarity, stabilizes organelles, chelates divalent cations [23] |
| TMG Buffer | 10 mM Tris, 5 mM MgCl₂, 20% (v/v) glycerol | Storage buffer for mitochondrial fractions; glycerol acts as cryoprotectant [23] |
| Sucrose Solutions | 0.25-0.34 M concentration | Provides isosmotic conditions; 0.25 M preserves oxidative phosphorylation [22] |
| Dounce Homogenizer | Glass homogenizer with loose & tight-fitting pestles | Provides gentle mechanical disruption while preserving organelle integrity [23] |
| Digitonin | 0.2 mg/mg mitochondrial protein | Used for sub-fractionation to separate outer and inner mitochondrial membranes [23] |
Troubleshooting and Technical Considerations
- Shear Forces: High centrifugal forces can damage sensitive cell surface properties and reduce viability [21].
- Incomplete Sedimentation: Low centrifugal force or time may result in cell loss in the supernatant [21].
- Temperature Sensitivity: Viscosity changes significantly with temperature, requiring protocol adjustments [21].
- Pellet Contamination: A white fluffy layer around the mitochondrial pellet indicates contamination that should be carefully removed [23].
Differential centrifugation provides an efficient, straightforward method for the initial isolation of mitochondria from cellular homogenates. While this technique produces a crude mitochondrial fraction that may contain some contamination, it serves as an essential preliminary step that enables subsequent purification through density gradient centrifugation. By carefully controlling parameters such as centrifugal force, time, temperature, and medium composition, researchers can obtain functionally intact mitochondria suitable for a wide range of biochemical and physiological studies.
Within mitochondrial research, the isolation of high-purity, functional mitochondria is a foundational prerequisite for a wide range of biochemical, omics, and therapeutic applications. Density gradient centrifugation stands as a critical technique for achieving this purification, separating mitochondria from other cellular components and from heterogeneous mitochondrial populations themselves. The efficacy of this separation hinges on the precise management of three interdependent physical parameters: the buoyant density of the particles, the viscosity of the gradient medium, and the osmotic balance of the supporting solutions. Failure to optimize these parameters can lead to compromised mitochondrial integrity, low yield, and unreliable experimental results. This application note details the core principles and practical protocols for controlling these critical parameters to ensure the successful isolation of mitochondria for advanced research and drug development.
Core Principles and Parameter Optimization
The separation of mitochondria via density gradient centrifugation relies on exploiting differences in the physical properties of subcellular particles. The following parameters must be carefully controlled to achieve high-resolution separation while preserving mitochondrial function.
Buoyant Density: This is the intrinsic density of a particle, determined by its composition of proteins, lipids, and membranes. During isopycnic centrifugation, particles migrate until they reach a position in the gradient where their density matches that of the surrounding medium. Mitochondria from different tissues or physiological states exhibit different buoyant densities. For instance, mitochondria from rat liver can be separated into distinct bands with mean buoyant densities of 1.162 (disrupted mitochondria), 1.184 (intact condensed mitochondria), and 1.216 (intact mitochondria with sucrose-accessible matrix space) on sucrose gradients [24]. The choice of gradient medium directly influences the achievable density range and the sharpness of the separation.
Viscosity: The viscosity of the gradient medium impacts the sedimentation rate of particles and the time required for them to reach their isopycnic point. High viscosity can slow centrifugation and extend run times, but it can also provide better resolution by preventing streaming and aggregation. Media like Percoll form gradients of varying viscosity; when diluted in 0.25 M sucrose, Percoll requires a greater g-force to form gradients compared to when suspended in 0.15 M NaCl due to differences in resultant viscosity [25]. Nycodenz is often preferred for mitochondrial isolation due to its low viscosity and osmolarity, which helps maintain organellar integrity [26].
Osmotic Balance: Mitochondria are osmotically sensitive organelles. Hyperosmotic conditions can cause cremation and loss of function, while hypoosmotic conditions can lead to swelling and rupture. An ideal density gradient medium should be neither hyper- nor hypoosmotic to the particles being separated [27]. Solutions must be adjusted to a physiological osmolality. For example, homogenization buffers for mitochondrial isolation typically contain sucrose or mannitol as osmotic stabilizers [8] [26]. The osmolality of Percoll must be adjusted with saline or culture medium for mammalian cells to prevent swelling or shrinking [25].
Table 1: Properties of Common Density Gradient Media for Mitochondrial Isolation
| Medium | Chemical Composition | Typical Working Density Range (g/mL) | Viscosity | Osmotic Properties | Key Applications |
|---|---|---|---|---|---|
| Sucrose | Disaccharide | 1.06 - 1.30 [24] | High | Hyperosmotic; can penetrate matrix, causing shrinkage [24] | Historical standard; separation of liver mitochondrial subpopulations [24] |
| Nycodenz | Tri-iodinated benzoic acid derivative | 1.04 - 1.20 [26] | Low | Low osmolarity; non-ionic and inert [26] | Isolation of intact mitochondria from skeletal muscle [26] and other tissues |
| Percoll | Silica particles coated with PVP | 1.0 - 1.3 [25] | Medium | Must be diluted to isotonicity with saline or sucrose [25] | Rapid isolation of cells, subcellular particles, and viruses; in situ gradient formation [25] |
| Ficoll | Synthetic polymer of sucrose | ~1.07 - 1.12 [8] | High | Can be formulated to be iso-osmotic [8] | Purification of synaptic and non-synaptic mitochondria from brain [8] |
Experimental Protocols
Protocol: Isolation of Mitochondria from Skeletal Muscle using Nycodenz Density Gradient Centrifugation
This protocol is adapted for mouse skeletal muscle and emphasizes the control of critical parameters for high-yield, high-purity mitochondrial isolation [26].
Reagents and Solutions:
- Homogenization Buffer: 100 mM Tris-HCl (pH 7.4), 100 mM sucrose, 10 mM EDTA, 46 mM KCl. Add 5 mg/mL BSA and 1X protease/phosphatase inhibitors fresh before use. The sucrose and KCl provide osmotic support and ionic strength.
- 50% (w/v) Nycodenz Stock: 5 mM Tris (pH 7.4), 3 mM KCl, 0.3 mM EDTA, 50% Nycodenz.
- Dilution Buffer: 128 mM NaCl, 5 mM Tris (pH 7.4), 3 mM KCl, 0.3 mM EDTA. Used to create working solutions.
- Working Solutions: Use Dilution Buffer to prepare 23%, 25%, and 30% Nycodenz solutions (w/v). These concentrations create the density steps for the gradient.
- Muscle Dissection Solution: 145 mM NaCl, 5 mM KCl, 2 mM MgCl2, 10 mM HEPES (pH 7.2), 10 mM glucose.
Equipment:
- Potter-Elvehjem homogenizer with PTFE pestle
- Refrigerated centrifuge with fixed-angle and swinging-bucket rotors (e.g., Sorvall Legend X1R, Ultra series centrifuge)
- Swinging bucket rotor (e.g., Beckman SW60 Ti)
- 11 x 60 mm Ultra-Clear centrifuge tubes
Methodology:
- Tissue Preparation: Euthanize the mouse and dissect skeletal muscle into ice-cold Muscle Dissection Solution. Transfer to Homogenization Buffer, weigh, and mince finely with scissors.
- Homogenization: Add 9-10 volumes of Homogenization Buffer per gram of tissue. Homogenize using a motor-driven Potter-Elvehjem homogenizer with 10 complete passes at speed setting 8, keeping the tube on ice.
- Differential Centrifugation:
- Centrifuge the homogenate at 800 × g, 4°C for 10 min to pellet nuclei, cell debris, and intact cells.
- Carefully collect the supernatant (S1) and centrifuge at 10,000 × g, 4°C for 10 min to pellet the crude mitochondrial fraction.
- Discard the resulting supernatant (S2).
- Density Gradient Centrifugation:
- Gently resuspend the crude mitochondrial pellet in 1.5 mL of 25% Nycodenz solution.
- In an Ultra-Clear tube, prepare a discontinuous gradient by carefully layering the following:
- Bottom: 1.25 mL of 30% Nycodenz (highest density)
- Middle: 1.5 mL of the mitochondrial suspension in 25% Nycodenz
- Top: 1.25 mL of 23% Nycodenz (lowest density)
- Centrifuge in a swinging bucket rotor at 19,800 rpm (≈ 63,000 × g), 4°C for 90 min.
- Mitochondrial Collection: After centrifugation, a light brown band of purified mitochondria will form at the interface between the 25% and 30% Nycodenz layers. Carefully collect this band using a Pasteur pipette.
- Washing: Dilute the collected mitochondria with 5-10 volumes of Dilution Buffer or isotonic respiration buffer and pellet by centrifugation at 10,000 × g, 4°C for 10 min. Resuspend the final mitochondrial pellet in an appropriate buffer for downstream applications.
The following workflow diagram illustrates the key steps and critical decision points in this protocol:
Protocol: Isolation of Synaptic and Non-Synaptic Mitochondria from Rat Brain using Ficoll Gradients
This protocol highlights the separation of functionally distinct mitochondrial populations from neural tissue, requiring precise density steps [8].
Reagents and Solutions:
- Solution A (Homogenization Buffer): 0.32 M Sucrose, 1.0 mM EDTA-K+, 10 mM Tris-HCl, pH 7.4.
- Solution B & D (Gradient Buffers): Contain varying concentrations of sucrose, mannitol, EDTA, and Tris to control density and osmolality.
- Ficoll Solutions: Discontinuous gradients are formed using Ficoll (a high-viscosity polymer) dissolved in the above buffers (e.g., 7.5% and 12% w/w for Gradient I; 4.5% and 6% for Gradient II).
Methodology Overview:
- Prepare crude mitochondria from rat brain hemicortexes by differential centrifugation in Solution A.
- To separate free mitochondria (FM) from synaptosomes, layer the crude mitochondrial fraction onto a discontinuous Ficoll gradient (7.5%/12% in Solution B).
- Centrifuge at 73,000 × g for 24 min. Synaptosomal mitochondria band at the 7.5%/12% interface, while free mitochondria form a pellet.
- To fractionate synaptosomal mitochondria into light (LM) and heavy (HM) fractions, osmotically lyse the synaptosomal fraction and load it onto a second Ficoll gradient (4.5%/6% in Solution D).
- Centrifuge at 10,000 × g for 30 min. The LM fraction bands at the 4.5%/6% interface, and the HM fraction pellets.
The Scientist's Toolkit: Essential Reagents and Materials
Successful mitochondrial purification depends on the use of specific, high-quality reagents and equipment. The following table catalogs key solutions and their functions in managing buoyant density, viscosity, and osmotic balance.
Table 2: Essential Research Reagents for Mitochondrial Density Gradient Centrifugation
| Reagent/Material | Function and Rationale | Example Usage |
|---|---|---|
| Nycodenz | Low-viscosity, inert, and low-osmolarity density gradient medium. Preserves mitochondrial integrity and function. | Creating discontinuous gradients for purifying mitochondria from skeletal muscle [26]. |
| Ficoll | High-viscosity polymer used to create iso-osmotic gradients. Ideal for separating delicate organelles like synaptic mitochondria. | Forming multi-step gradients to isolate distinct populations of mitochondria from brain tissue [8]. |
| Sucrose/Mannitol | Osmotic stabilizers. Added to homogenization and gradient buffers to prevent mitochondrial swelling or shrinkage during isolation. | Component of homogenization buffers across all protocols (e.g., 0.32 M sucrose in brain isolation [8]). |
| EDTA (Chelating Agent) | Chelates divalent cations, inhibiting phospholipases and nucleases that can degrade mitochondrial membranes and DNA. | Included at 1 mM - 50 µM in all homogenization and gradient solutions [8] [26]. |
| BSA (Bovine Serum Albumin) | Binds free fatty acids and other contaminants that can uncouple oxidative phosphorylation. Protects mitochondrial function. | Added at 5 mg/mL to the homogenization buffer for skeletal muscle mitochondria [26]. |
| Protease/Phosphatase Inhibitors | Prevents proteolytic degradation and maintains the phosphorylation status of mitochondrial proteins during isolation. | Added fresh to homogenization and washing buffers prior to use [26]. |
| Ultra-Clear Centrifuge Tubes | Specialized tubes with minimal wall thickness and high clarity, designed for ultracentrifugation. Essential for visualizing mitochondrial bands after centrifugation. | Used in swinging bucket rotors for the final density gradient step [26]. |
Practical Protocols: Implementing Density Gradient Centrifugation Across Sample Types
Standardized Protocol for Mammalian Tissues and Cultured Cells
Mitochondrial purification is a foundational technique in cell biology, essential for studying organelle function, metabolic pathways, and the role of mitochondria in disease. Within the broader context of mitochondrial research, density gradient centrifugation stands as a critical method for obtaining high-purity organelle preparations, free from significant contamination by other cellular components [8]. This Application Note provides a standardized framework for isolating mitochondria from both mammalian tissues and cultured cells, with protocols specifically optimized to maintain mitochondrial integrity and function for downstream applications.
The fundamental principle underlying these methods is differential centrifugation, which separates organelles based on size and sedimentation velocity, often followed by density gradient centrifugation, which further resolves cellular components based on their buoyant densities [8]. This combination is particularly crucial for research requiring highly pure mitochondria, such as proteomic, lipidomic, and functional studies where contamination from other organelles could compromise results [8] [28].
Theoretical Basis: Density Gradient Centrifugation
Density gradient centrifugation significantly enhances mitochondrial purity beyond what can be achieved by differential centrifugation alone. This technique separates cellular components based on their buoyant density by centrifuging them in a medium whose density increases with depth.
- Discontinuous Gradients: The protocols herein primarily employ discontinuous (step) gradients, where organelles partition at the interfaces between solutions of different densities. This is highly effective for resolving distinct mitochondrial populations and removing contaminants like lysosomes, peroxisomes, and microsomes [8].
- Gradient Media: Common media include sucrose and Ficoll, each offering advantages. Sucrose is widely used but can exert osmotic stress. Ficoll, a synthetic sucrose polymer, is often preferred for its lower osmolarity, making it suitable for sensitive tissues like brain [8].
The choice of gradient medium and centrifugation parameters directly impacts yield, purity, and the functional integrity of the isolated organelles, necessitating careful optimization for specific sample types and research goals.
Materials and Reagents
Research Reagent Solutions
The following table details essential reagents and their functions in mitochondrial isolation protocols.
Table 1: Key Reagents for Mitochondrial Isolation
| Reagent/Solution | Function and Composition |
|---|---|
| Homogenization Buffer | Provides an osmotic cushion and ionic balance to preserve organelle integrity during cell disruption. Typically contains sucrose, Tris-HCl, and EDTA [8] [7]. |
| Density Gradient Media (Ficoll) | Forms a discontinuous density barrier for ultracentrifugation. Used to separate and purify distinct mitochondrial populations from crude extracts [8]. |
| Density Gradient Media (Sucrose) | A common medium for density gradient centrifugation; used to separate organelles based on buoyant density [8] [7]. |
| Mitochondrial Suspension Buffer | A stable, isotonic solution for resuspending and storing the final mitochondrial pellet. Often contains sucrose, Tris-HCl, and EDTA to maintain function [8] [7]. |
| Protease Inhibitors (PMSF, DTT) | Added to buffers immediately before use to prevent proteolytic degradation of mitochondrial proteins during the isolation process [7]. |
Essential Equipment
- Homogenizer: A Potter-Elvehjem Teflon-glass homogenizer is standard for tissue samples [8]. A Dounce homogenizer is typically used for cultured cells [7].
- Centrifuges: Both a high-speed centrifuge (e.g., Beckman J2-21, Sorvall RC-5B) for differential centrifugation and an ultracentrifuge (e.g., Beckman L5-50) for density gradient steps are required [8].
- Centrifuge Rotors: Fixed-angle rotors for pelleting during differential centrifugation and swinging-bucket rotors for density gradients are essential [8].
- Ultracentrifuge Tubes: Thin-wall polyallomer tubes designed for high g-forces are necessary for gradient centrifugation [8].
Standardized Protocols
Protocol 1: Isolation from Rat Brain by Differential and Density Gradient Centrifugation
This protocol is designed to resolve heterogeneous populations of mitochondria from neural tissue, specifically free mitochondria (FM) and synaptosomal mitochondria, which can be further subdivided into heavy (HM) and light (LM) fractions [8].
Diagram Title: Mitochondria Isolation Workflow from Rat Brain
Solutions
- Solution A: 0.32 M Sucrose, 1.0 mM EDTA-K+, 10 mM Tris-HCl, pH 7.4
- Solution B: 0.32 M Sucrose, 50 μM EDTA-K+, 10 mM Tris-HCl, pH 7.4
- Solution C: 6 mM Tris-HCl, pH 8.1
- Solution D: 0.24 M Mannitol, 60 mM Sucrose, 50 μM EDTA-K+, 10 mM Tris-HCl, pH 7.4
- Solution E: 3% (w/w) Ficoll, 0.12 M Mannitol, 30 mM Sucrose, 25 μM EDTA-K+, 5 mM Tris-HCl, pH 7.4
- Solution F (Final Resuspension): 0.22 M Mannitol, 0.07 M Sucrose, 50 mM Tris-HCl, 1 mM EDTA, pH 7.2 [8]
Step-by-Step Procedure
- Tissue Preparation: Rapidly dissect the rat brain and place hemicortexes in ice-cold Solution A.
- Homogenization: Homogenize the tissue in a Teflon-glass homogenizer with 5 up-and-down passes at 800 rpm.
- Differential Centrifugation:
- Centrifuge the homogenate at 1,000 × g for 4 min (+11 sec). Retain the supernatant.
- Re-homogenize the pellet in fresh Solution A and repeat the low-speed centrifugation. Pool all supernatants.
- Centrifuge the pooled supernatant at 15,000 × g for 20 min to pellet the crude mitochondrial fraction.
- Density Gradient Centrifugation (Gradient I):
- Prepare a discontinuous Ficoll gradient: 1.9 mL of 12% Ficoll (in Solution B) underlayed with 1.9 mL of 7.5% Ficoll.
- Resuspend the crude mitochondrial pellet in 0.7 mL of Solution A and carefully layer onto the pre-formed gradient.
- Centrifuge in a swinging-bucket rotor at 73,000 × g for 24 min.
- After centrifugation, the myelin band is discarded. The synaptosomal mitochondria are collected from the 7.5%/12% interface. The pellet contains the free mitochondria (FM).
- Isolation of HM and LM Fractions:
- The collected synaptosomal fraction is diluted in Solution A and pelleted at 15,000 × g for 20 min.
- The pellet is resuspended in Solution C and centrifuged twice at 14,000 × g for 30 min.
- The final pellet is resuspended in Solution E and applied to a second gradient (Gradient II: 1.4 mL of 6% Ficoll underlayed with 2.6 mL of 4.5% Ficoll, both in Solution D).
- After centrifugation at 10,000 × g for 30 min, the HM fraction is found in the pellet and the LM fraction is at the 4.5%/6% interface.
- Final Preparation: Harvested fractions are diluted in Solution A, pelleted at high speed, and the final mitochondrial pellets are resuspended in Solution F [8].
Protocol 2: Isolation from Cultured Cells by Differential Centrifugation
This protocol is optimized for cultured mammalian cells and relies on differential centrifugation without a density gradient step, providing a balance between speed, yield, and sufficient purity for many applications like western blotting [7].
Solutions
- NKM Buffer: 1 mM Tris-HCl (pH 7.4), 0.13 M NaCl, 5 mM KCl, 7.5 mM MgCl₂
- Homogenization Buffer: 10 mM Tris-HCl (pH 6.7), 10 mM KCl, 0.15 mM MgCl₂, 1 mM PMSF, 1 mM DTT (add fresh)
- Mitochondrial Suspension Buffer: 10 mM Tris-HCl (pH 6.7), 0.15 mM MgCl₂, 0.25 M Sucrose, 1 mM PMSF, 1 mM DTT (add fresh) [7]
Step-by-Step Procedure
- Cell Harvesting: Collect cells by centrifugation at 370 × g for 10 min. Wash the pellet twice with ice-cold NKM buffer.
- Cell Permeabilization: Resuspend the cell pellet in 6 volumes of Homogenization Buffer and incubate on ice for 10 min.
- Homogenization: Transfer the suspension to a Dounce homogenizer. Perform approximately 30 strokes with a tight-fitting pestle, monitoring for ~60% cell breakage under a microscope.
- Nuclei and Debris Removal:
- Mix the homogenate gently with 1 volume of 2 M sucrose solution.
- Centrifuge at 1,200 × g for 5 min. Transfer the supernatant to a new tube.
- Repeat this low-speed centrifugation step to ensure complete removal of nuclei and unbroken cells.
- Mitochondrial Pelleting: Centrifuge the post-nuclear supernatant at 7,000 × g for 10 min to pellet the mitochondria.
- Mitochondrial Wash: Resuspend the mitochondrial pellet in 3 volumes of Mitochondrial Suspension Buffer and recentrifuge at 9,500 × g for 5 min to obtain a final, purified mitochondrial pellet [7].
Table 2: Centrifugation Parameters for Mitochondrial Isolation
| Sample Type | Differential Centrifugation Steps | Speed & Duration | Density Gradient Centrifugation | Speed & Duration |
|---|---|---|---|---|
| Rat Brain | Debris/Nuclei Removal | 1,000 × g, 4 min [8] | Ficoll Gradient I (7.5%/12%) | 73,000 × g, 24 min [8] |
| Crude Mitochondria Pellet | 15,000 × g, 20 min [8] | Ficoll Gradient II (4.5%/6%) | 10,000 × g, 30 min [8] | |
| Cultured Cells | Debris/Nuclei Removal | 1,200 × g, 5 min (repeated) [7] | Not typically used in basic protocol | - |
| Crude Mitochondria Pellet | 7,000 × g, 10 min [7] | - | - | |
| Mitochondria Wash | 9,500 × g, 5 min [7] | - | - |
Table 3: Mitochondrial Populations Isolated from Rat Brain
| Mitochondrial Population | Abbreviation | Source/Location | Isolation Method |
|---|---|---|---|
| Free Mitochondria | FM | Neuronal soma; multiple cell types [8] | Pellet from Ficoll Gradient I [8] |
| Synaptosomal Mitochondria | - | Nerve terminals; regulate neurotransmitter release [8] | Interface of Ficoll Gradient I (7.5%/12%) [8] |
| Heavy Mitochondria | HM | Subpopulation of synaptosomal mitochondria [8] | Pellet from Ficoll Gradient II [8] |
| Light Mitochondria | LM | Subpopulation of synaptosomal mitochondria [8] | Interface of Ficoll Gradient II (4.5%/6%) [8] |
Applications and Integration in Research
The isolation of pure mitochondria is a critical step in modern cell biology and drug development. These protocols enable:
- Functional Studies: Investigation of mitochondrial respiration, metabolic activity, protein import, and apoptosis [8].
- "Omics" Studies: Highly pure mitochondria are essential for reliable proteomic, lipidomic, and phosphoproteomic analyses to define composition and post-translational modifications [8] [28].
- Therapeutic Applications: Mitochondria transfer and transplantation (MTT) is an emerging therapy for diseases caused by mitochondrial dysfunction, such as neurodegenerative and cardiovascular disorders. The purity and functional integrity of isolated mitochondria are paramount for the success of these approaches [29].
- Disease Modeling: Isolating mitochondria from specific cell types or disease models allows researchers to study the organelle's direct role in pathological processes.
Troubleshooting and Methodological Considerations
- Purity vs. Yield vs. Function: A key trade-off exists in mitochondrial isolation. Ultracentrifugation on a density gradient provides high purity but can lower yield and potentially damage mitochondrial structure, rendering some preparations unsuitable for functional assays [28]. Differential centrifugation offers higher yields of functional organelles but with lower purity.
- Homogenization Efficiency: This is a critical step. Under-homogenization reduces yield, while over-homogenization damages organelles. Optimal cell breakage should be around 60% for cultured cells [7].
- Mitochondrial Integrity: Always keep samples on ice and use pre-chilled buffers. Protease inhibitors (PMSF, DTT) must be added fresh immediately before use to prevent protein degradation [7].
- Protocol Selection: The choice of protocol should be guided by the downstream application. Western blot analysis may tolerate the lower purity of a differential centrifugation protocol [7], whereas proteomics requires the high purity achieved through density gradient centrifugation [8] [28].
The standardized protocols outlined here provide robust methods for isolating mitochondria from mammalian tissues and cultured cells. The method of density gradient centrifugation remains the gold standard for achieving the high-purity preparations required for advanced analytical techniques and sensitive functional assays. By carefully selecting the appropriate protocol and meticulously executing each step, researchers can obtain high-quality mitochondrial samples that are foundational for advancing our understanding of mitochondrial biology and its implications in health and disease.
The investigation of plant mitochondria has traditionally focused on model species or agricultural crops, leaving a significant gap in our understanding of mitochondrial biology in extremophile plants. The desiccation-tolerant moss Syntrichia caninervis, which survives near-complete cellular dehydration, cryogenic freezing, and intense radiation, presents a unique opportunity to study stress resilience mechanisms [6]. Recent research has established that mitochondria are central integrators of environmental stress responses in these organisms, making their isolation and study crucial for advancing our knowledge of plant extremophily [6] [30]. This application note details a specialized methodology for isolating high-purity, functional mitochondria from S. caninervis, leveraging density gradient centrifugation within the broader context of mitochondrial purification research.
The exceptional resilience of S. caninervis, capable of surviving cellular dehydration exceeding 98% (anhydrobiosis) and temperatures as low as -196°C, establishes it as a model organism for pioneering studies on plant stress adaptation [6] [30]. Mitochondria in such organisms are not merely energy-producing organelles but play multifaceted roles in stress signaling, redox homeostasis, and programmed cell death [6]. Unraveling the mechanisms that allow these organelles to maintain ATP production and structural integrity under extreme conditions requires isolation protocols that yield mitochondria of exceptional purity and functional integrity, a challenge that conventional methods are poorly suited to address [6].
Technical Challenges and Innovative Solutions
Key Challenges in Moss Mitochondria Isolation
The isolation of mitochondria from desiccation-tolerant bryophytes like S. caninervis presents unique technical hurdles that render standard plant mitochondrial protocols suboptimal. These challenges primarily stem from fundamental differences in cellular architecture and stress physiology compared to vascular plants [6].
- Robust Cell Walls: Bryophytes possess unique polysaccharide compositions in their cell walls that resist standard mechanical homogenization or enzymatic digestion methods [6].
- Resilient Membrane Systems: Highly resilient membrane systems adapted to withstand repeated hydration-dehydration cycles require gentle disruption methods to preserve mitochondrial integrity [6].
- Interfering Compounds: Plant tissues often contain high levels of phenolics, pigments, and other secondary metabolites that can interfere with mitochondrial function and integrity during extraction [6] [31].
Core Principles of the Isolation Strategy
The protocol overcomes these challenges through several key innovations centered on density gradient centrifugation and careful buffer optimization:
- Low-Temperature Immersion: An extended cold immersion step (4°C for 8-12 hours) allows extraction buffer to gradually permeate intercellular spaces via osmotic gradients, minimizing mechanical damage [6].
- Sorbitol Substitution: Replacement of sucrose with sorbitol in extraction and suspension buffers provides stable physical support to mitochondria, reducing collisions and aggregation during processing [6].
- Density Gradient Centrifugation: Discontinuous Percoll density gradient centrifugation effectively separates mitochondria from contaminants including chloroplasts, nuclei, and cytoplasmic debris [6] [1] [31].
The following workflow diagram illustrates the complete mitochondrial isolation and validation process:
Materials and Reagents
Research Reagent Solutions
The successful isolation of functional mitochondria relies on a carefully formulated system of buffers and reagents designed to maintain organellar integrity throughout the purification process.
Table 1: Essential Reagents for Mitochondrial Isolation from S. caninervis
| Reagent/Buffer | Key Components | Function/Purpose |
|---|---|---|
| Extraction Buffer | Sorbitol, HEPES, PVP, sodium ascorbate, PMSF, EDTA | Maintains osmotic balance, stabilizes pH, protects against phenolics/oxidation [6] |
| Suspension Buffer | Sorbitol, HEPES | Provides stable physical support, reduces mitochondrial aggregation [6] |
| Density Gradient Medium | Percoll | Creates discontinuous density interface for organelle separation [6] [31] |
| Homogenization Buffer | Tris-HCl, KCl, MgCl₂, PMSF, DTT | Facilitates cell breakage while preserving organelle integrity [7] |
| Wash Buffer | Tris-HCl, MgCl₂, sucrose, PMSF, DTT | Removes residual contaminants after gradient centrifugation [7] |
Specialized Equipment
The protocol requires standard laboratory equipment supplemented with specialized centrifugation capabilities:
- Preparative Centrifuge: Capable of accommodating JA-10 and JA-25.5 rotors or equivalent, with temperature control [32]
- Dounce Homogenizer: Glass homogenizer with tight-fitting pestle for effective cell disruption [7]
- Ultracentrifuge: For high-resolution density gradient separations [32]
- Peristaltic Pump: Enables careful collection of mitochondrial bands from gradients with minimal disruption [31]
Step-by-Step Protocol
Mitochondrial Extraction and Purification
Tissue Preparation:
- Begin with 50g of fresh S. caninervis tissue. Remove any debris or contaminated portions.
- Rinse tissue with cold distilled water to remove surface contaminants.
- Cut tissue into approximately 4×4 cm pieces to facilitate buffer infiltration [32].
Low-Temperature Immersion:
- Immerse tissue in 150-200 mL of pre-chilled Extraction Buffer.
- Incubate at 4°C for 8-12 hours to allow gradual buffer infiltration through osmotic gradients [6].
Tissue Homogenization:
- Transfer tissue and buffer to a Dounce homogenizer.
- Perform 25-30 strokes with the tight-fitting pestle while keeping the assembly on ice.
- Monitor cell breakage efficiency microscopically, targeting approximately 60% cell disruption [7].
Differential Centrifugation:
- Centrifuge homogenate at 1,200 × g for 5 minutes at 4°C to pellet nuclei, cell debris, and unbroken cells.
- Carefully transfer supernatant to fresh tubes using a peristaltic pump [31].
- Repeat low-speed centrifugation to ensure complete removal of particulate matter.
- Centrifuge resulting supernatant at 7,000 × g for 10 minutes at 4°C to pellet crude mitochondria [6] [7].
Density Gradient Centrifugation:
- Prepare discontinuous Percoll gradient: carefully layer 35%, 22.5%, and 0% Percoll solutions in centrifuge tubes.
- Resuspend crude mitochondrial pellet in minimal suspension buffer and carefully layer onto gradient.
- Centrifuge at 40,000 × g for 45 minutes at 4°C [6] [31].
- Mitochondria collect at the 22.5-35% Percoll interface as a distinct band.
Mitochondrial Recovery:
- Carefully collect mitochondrial band using a peristaltic pump or Pasteur pipette.
- Dilute mitochondrial fraction with 3-4 volumes of wash buffer.
- Pellet mitochondria at 9,500 × g for 5 minutes at 4°C.
- Repeat wash step to remove residual Percoll [6] [7].
- Resuspend final mitochondrial pellet in appropriate buffer for downstream applications.
Critical Optimization Parameters
Several parameters require careful optimization to ensure successful mitochondrial isolation:
- Buffer pH and Osmolarity: Maintain extraction buffer at pH 7.2-7.4 and osmolarity of 400-450 mOsm to preserve membrane integrity [6] [31].
- Protease Inhibition: Add PMSF and DTT immediately before use as they degrade rapidly in aqueous solution [7].
- Temperature Control: Perform all steps at 0-4°C to minimize proteolytic degradation and maintain mitochondrial function.
- Gradient Preparation: Prepare Percoll gradients freshly and ensure sharp interfaces for optimal separation resolution [6].
Quality Assessment and Validation
Rigorous quality assessment is essential to confirm mitochondrial purity, structural integrity, and functional activity. The following validation methods provide complementary metrics for evaluation.
Table 2: Mitochondrial Quality Assessment Metrics and Expected Outcomes
| Assessment Method | Procedure | Expected Result for High-Quality Mitochondria |
|---|---|---|
| Western Blot Analysis | Probe with compartment-specific markers: VDAC1/SHMT (mitochondria), RbcL (chloroplasts), UGPase (cytosol), Catalase (peroxisomes) [6] [31] | Strong mitochondrial marker signals; absence or minimal detection of non-mitochondrial markers |
| Structural Integrity Assays | JC-1 staining (membrane potential), Janus Green B staining, MitoTracker staining, Transmission Electron Microscopy [6] | High membrane potential (red JC-1 fluorescence), intact double membranes and cristae by TEM |
| Functional Activity Assays | Cytochrome c oxidase activity, Electron transport chain complex measurements [6] | COX activity: ~1.83 μmol/min/mg; intact respiratory function |
| Yield Quantification | Bicinchoninic Acid (BCA) protein assay [6] | ~56.7 mg mitochondria from 50g tissue; protein content: 5.67 ± 0.61 μg/μL |
The validation workflow employs multiple complementary approaches to thoroughly assess mitochondrial quality:
Applications and Research Implications
The isolation of high-purity mitochondria from desiccation-tolerant mosses enables diverse research applications that advance our understanding of extreme stress tolerance:
- Mechanistic Studies of Stress Resilience: Investigate how mitochondria maintain ATP production and membrane potential during dehydration-rehydration cycles, potentially revealing novel conservation mechanisms [6].
- Comparative Mitochondrial Proteomics: Identify stress-responsive proteins and post-translational modifications through high-coverage proteomic analysis of isolated mitochondria [31].
- Bioenergetic Profiling: Characterize electron transport chain efficiency and oxidative phosphorylation capacity under various stress conditions using functional mitochondria [6].
- Translational Applications: Insights gained may inform strategies for improving stress tolerance in crops and developing novel preservation methods for biological materials [30].
The established protocol for isolating mitochondria from the desiccation-tolerant moss S. caninervis represents a significant technical advancement in plant organelle research. By combining low-temperature immersion with optimized differential and density gradient centrifugation, this method successfully addresses the unique challenges posed by extremophile bryophytes. The resulting mitochondrial preparations exhibit high purity, structural integrity, and robust functional activity, making them suitable for sophisticated downstream applications including proteomic profiling, bioenergetic studies, and mechanistic investigations of stress tolerance.
Future methodological developments will likely focus on increasing throughput through affinity purification techniques [12], enhancing single-organelle analysis capabilities [12], and integrating multi-omics approaches to fully characterize mitochondrial responses to extreme environments. As interest in extremophile biology grows, this protocol provides a standardized workflow that enables reproducible isolation of high-quality mitochondria from desiccation-tolerant plants, paving the way for discoveries that may ultimately transform our understanding of stress resilience in eukaryotic systems.
Skeletal Muscle Mitochondria Isolation Using Percoll Density Gradients
The isolation of high-quality mitochondria is a cornerstone of mitochondrial research, enabling detailed study of their structure, function, and role in cellular metabolism. For skeletal muscle—a tissue accounting for approximately 40% of total body mass and playing critical roles in locomotion and metabolic function—obtaining pure and functional mitochondrial preparations is particularly valuable yet challenging due to the tissue's complex structure [16]. Among available techniques, Percoll density gradient centrifugation has emerged as a superior method for isolating skeletal muscle mitochondria, effectively balancing the competing demands of high sample purity and preserved bioenergetic functionality [16]. This protocol details the application of this technique to murine skeletal muscle, providing researchers with a reliable method to obtain mitochondria suitable for downstream applications including high-resolution respirometry, proteomic analysis, and other functional assays.
Mitochondria are indispensable organelles responsible for cellular energy production, calcium homeostasis, and regulation of apoptotic pathways. In skeletal muscle, their density and functional capacity directly influence metabolic health and physical endurance. Studying these organelles in isolation requires methods that preserve their structural integrity and biochemical activity while minimizing contamination from other cellular components [16].
Traditional mitochondrial isolation often relies on differential centrifugation, a method that separates organelles based on size and sedimentation velocity. While this technique is rapid and inexpensive, its primary limitation for skeletal muscle applications is significant contamination from other organelles such as lysosomes, peroxisomes, Golgi membranes, and sarcoplasmic reticulum [16] [33]. These contaminants can profoundly influence the results of sensitive downstream analyses, including proteomic studies and enzymatic assays.
Density-gradient centrifugation with Percoll, a low-viscosity colloidal silica solution, addresses this limitation by separating cellular components based on their buoyant densities rather than just size. This process results in highly purified mitochondrial preparations while maintaining robust respiratory activity, making it particularly suitable for applications requiring high sample purity [16]. This application note provides a detailed protocol for isolating functional mitochondria from mouse skeletal muscle using a Percoll density gradient, framed within broader thesis research on advanced mitochondrial purification techniques.
Method Comparison and Rationale
The table below summarizes key mitochondrial isolation techniques, highlighting the advantages of Percoll density gradient centrifugation for purity-sensitive applications.
Table 1: Comparison of Mitochondrial Isolation Techniques for Skeletal Muscle
| Method | Principle | Purity | Functionality | Time | Best Applications |
|---|---|---|---|---|---|
| Differential Centrifugation | Separation by size and sedimentation velocity | Moderate (organelle contamination) | Preserved | 1-1.5 hours [33] | Respirometry when purity is not critical |
| Percoll Density Gradient | Separation by buoyant density in a colloidal silica gradient | High (minimal contamination) [16] | Preserved (RCR 3.9-7.1) [16] | 3-4 hours [16] | Proteomics, bioenergetics, high-purity requirements |
| Nitrogen Cavitation | Cell lysis by nitrogen gas pressure release | High (ultrastructure preserved) | Preserved (appropriate RCR) [34] | <1 hour [34] | Rapid isolation for time-sensitive assays |
| Immunoaffinity Purification | Antibody-binding to mitochondrial surface proteins (e.g., TOMM22) [12] | Very High (specific subpopulations) | Preserved | Varies | Isolation of specific mitochondrial subsets |
As evidenced in the table, Percoll density gradient centrifugation offers an optimal balance for researchers requiring both high purity and maintained bioenergetic function, albeit with a longer processing time compared to some alternative methods.
Materials and Reagents
Research Reagent Solutions
The following table lists essential reagents and materials required for successful mitochondrial isolation using the Percoll density gradient method.
Table 2: Essential Reagents and Materials for Mitochondrial Isolation
| Reagent/Material | Function/Role | Example Specifications |
|---|---|---|
| Percoll | Forms density gradient for organelle separation [16] | Sigma-Aldrich P1644 or equivalent [4] |
| Nagarse | Protease for tissue digestion and softening [16] | Sigma-Aldrich P8038, 0.6 mg/ml in IM Buffer [16] |
| Fatty Acid-Free BSA | Prevents mitochondrial adhesion and absorbs fatty acids [16] | 0.5% in resuspension buffers [16] |
| Homogenization Buffer | Maintains osmotic and ionic balance during processing [16] | Sucrose/HEPES/EGTA typically used [4] |
| MAS Buffer | Assay medium for respirometry measurements [16] | With 1% BSA for mitochondrial suspensions [16] |
| Anti-TOMM20 Antibody | For immunoisolation methods (comparative) [12] | Conjugated to magnetic beads [12] |
| Density Gradient Tubes | Containment for gradient separation | 10ml polycarbonate centrifuge tubes [16] |
| Tissue Homogenizer | Mechanical disruption of muscle tissue | Dounce homogenizer with loose-fitting pestle [16] |
Experimental Protocol
The schematic below illustrates the complete mitochondrial isolation process from tissue harvest to functional assessment.
Detailed Step-by-Step Procedure
Step 1: Tissue Harvest and Preparation
- Euthanize mouse by cervical dislocation without anesthesia to prevent mitochondrial respiration impacts [16].
- Excise quadriceps femoris muscle from both legs (typically 100-200 mg) and immediately place in ice-cold DPBS.
- Remove connective and adipose tissue, then mince with scissors into fine pieces in 0.5 ml IM buffer containing Nagarse (0.6 mg/ml).
Step 2: Homogenization
- Transfer digested tissue to a Dounce homogenizer with additional IM buffer.
- Homogenize with 10 strokes of a loose-fitting pestle, followed by 1-3 additional strokes after adding 1 ml more IM buffer.
- Rinse homogenizer with 2.5 ml IM buffer/0.5% fatty acid-free BSA and combine with homogenate.
Step 3: Differential Centrifugation
- Centrifuge homogenate at 1,000 × g for 5 minutes at 4°C.
- Collect supernatant, avoiding the flocculent layer above the pellet.
- Add 4 ml IM buffer to pellet, vortex briefly, and centrifuge again at 1,000 × g for 5 minutes.
- Pool supernatants and centrifuge at 21,000 × g for 10 minutes at 4°C.
- Discard supernatant and resuspend pellet in 2 ml of 15% Percoll in IM buffer.
Step 4: Density Gradient Centrifugation
- Prepare discontinuous Percoll gradient in 10 ml polycarbonate tube:
- Bottom layer: 3.7 ml of 24% Percoll in IM buffer
- Middle layer: 1.5 ml of 40% Percoll in IM buffer (pipetted underneath 24% layer)
- Filter mitochondrial suspension (in 15% Percoll) through 70 μm nylon filter.
- Carefully layer filtered suspension on top of the gradient.
- Centrifuge at 30,750 × g for 10 minutes at 4°C with slow acceleration and no brake.
Step 5: Mitochondrial Collection and Washing
- After centrifugation, discard upper layers and collect the mitochondrial band at the 24%-40% Percoll interface.
- Transfer to a clean tube and add 6 ml IM buffer.
- Centrifuge at 16,750 × g for 10 minutes at 4°C.
- Discard supernatant and resuspend pellet in 1 ml IM buffer with 0.5% BSA, then add 4 ml IM buffer with 0.1% BSA.
- Centrifuge at 7,000 × g for 10 minutes.
- Resuspend final mitochondrial pellet in 100 μl MAS buffer without BSA for protein quantification.
Quantitative Performance Metrics
The table below summarizes typical yields and functional parameters achieved using this protocol with murine quadriceps muscle.
Table 3: Expected Yield and Functional Outcomes from Murine Skeletal Muscle
| Parameter | Typical Result | Conditions/Notes |
|---|---|---|
| Processing Time | 3-4 hours [16] | From tissue harvest to quantification |
| Protein Yield | 200-400 μg [16] | From 100-200 mg fresh tissue |
| Optimal Input for Respirometry | 500 ng [16] | For Seahorse XFe96 analyzer |
| Respiratory Control Ratio (RCR) | 3.9-7.1 [16] | Varies with substrates used |
| Purity Assessment | Significant enrichment of mitochondrial proteins [16] | Via proteomic analysis |
Quality Assessment and Functional Validation
Respirometry Analysis
Mitochondrial functionality should be assessed immediately after isolation using a Seahorse XFe96 Analyzer or similar high-resolution respirometry system:
- Dilute mitochondria to 0.4 mg/mL in respiration buffer [33].
- Use substrate combinations to probe specific electron transport chain complexes:
- Complex I: Glutamate and malate
- Complex II: Succinate
- Complex IV: Ascorbate and TMPD [33]
- Calculate Respiratory Control Ratio (RCR) as State 3 (ADP-stimulated) / State 4 (ADP-depleted) respiration [33].
- Expect RCR values between 3.9-7.1, indicating well-coupled, functional mitochondria [16].
Purity Assessment
Proteomic analysis via mass spectrometry should demonstrate significant enrichment of mitochondrial proteins with minimal contamination markers from other organelles [16]. Alternatively, Western blotting for mitochondrial markers (e.g., TOMM20, VDAC) and contaminants (e.g., endoplasmic reticulum proteins) can verify purity.
Technical Considerations and Troubleshooting
Purity Versus Functionality Trade-Off
The diagram below illustrates the critical relationship between isolation stringency and mitochondrial integrity—a fundamental consideration in purification methodology.
Key Technical Considerations:
- Temperature Control: Maintain all buffers and samples on ice throughout the procedure to preserve mitochondrial function.
- Timing: Complete the isolation within 3-4 hours and perform functional assays immediately afterward.
- Gradient Handling: Carefully layer solutions to maintain sharp interfaces and avoid mixing gradients.
- Antibiotic Consideration: Include protease inhibitors in buffers to prevent protein degradation during isolation.
Application in Broader Research Context
Within a comprehensive thesis on density gradient centrifugation for mitochondrial purification, this protocol represents an optimal balance for skeletal muscle applications. While other techniques exist—including nitrogen cavitation for rapid isolation [34] and immunocapture for maximum purity [12]—Percoll density gradient centrifugation remains the gold standard for studies requiring both high purity and preserved bioenergetic function.
The methodology enables diverse downstream applications including:
- Proteomic profiling of mitochondrial proteins
- Bioenergetic assessment of respiratory function
- Evaluation of mitochondrial dysfunction in disease models
- Therapeutic development for mitochondrial diseases [35]
This protocol provides a robust framework for obtaining high-quality mitochondrial preparations from skeletal muscle, facilitating advanced research into mitochondrial biology and pathophysiology.
Adapting Methods for Small Sample Sizes and Limited Starting Material
Mitochondrial research is fundamental to understanding cellular energy metabolism, apoptotic signaling, and the pathogenesis of numerous diseases. Density gradient centrifugation has long been a cornerstone technique for obtaining high-purity mitochondrial preparations. However, the substantial sample requirements of traditional protocols present a significant barrier for research involving precious human biopsies, limited primary cell cultures, or complex genetically engineered animal models. This application note details validated methodologies adapted for small sample sizes and limited starting material, ensuring researchers can obtain high-quality, functional mitochondria for downstream analyses. The protocols are framed within the context of a broader thesis on refining density gradient centrifugation, highlighting key modifications that enable successful mitochondrial purification from minimal input.
Methodological Approaches for Small-Scale Mitochondrial Isolation
Several core methodologies have been adapted for working with limited samples. The following sections provide detailed protocols and expected outcomes.
Density Gradient Centrifugation from Skeletal Muscle
The following protocol, adapted for mouse skeletal muscle, uses a discontinuous Percoll gradient to achieve high-purity mitochondria from ~100-200 mg of tissue, a significant reduction from traditional requirements [11].
Protocol: Percoll Density Gradient Purification from Skeletal Muscle [11]
- Sample Preparation: Excise the quadriceps femoris muscle from mice sacrificed without anesthesia (to preserve mitochondrial respiration). Remove connective and adipose tissue promptly. Place tissue in ice-cold DPBS.
- Tissue Disruption: Mince tissue finely with scissors in 0.5 mL of IM Buffer (10 mM HEPES, 1 mM EGTA, 200 mM Mannitol, 70 mM Sucrose, pH 7.4) containing Nagarse (0.6 mg/mL). Incubate with an additional 0.5 mL of IM Buffer/Nagarse for 5 minutes at room temperature.
- Homogenization: Transfer the digested tissue to a Dounce homogenizer. Add 0.5 mL of IM buffer and homogenize with 10 strokes of a loose-fitting pestle. Add another 1 mL of IM buffer and perform 1-3 additional strokes.
- Differential Centrifugation: Combine homogenates and centrifuge at 1,000 g for 5 minutes at 4°C. Collect the supernatant, avoiding the flocculent layer. Resuspend the pellet in 4 mL IM buffer, vortex, and repeat centrifugation. Pool the supernatants and centrifuge at 21,000 g for 10 minutes at 4°C. Discard the final supernatant.
- Percoll Gradient Preparation: In a 10 mL polycarbonate tube, create a discontinuous gradient by carefully layering 3.7 mL of 24% Percoll (in IM buffer) over 1.5 mL of 40% Percoll (in IM buffer), maintaining a sharp interface.
- Gradient Centrifugation: Resuspend the crude mitochondrial pellet from the previous step in 2 mL of 15% Percoll. Filter through a pre-wetted 70 μm nylon filter and layer gently on top of the prepared Percoll gradient. Centrifuge at 30,750 g for 10 minutes at 4°C with slow acceleration and no brake.
- Mitochondrial Collection: After centrifugation, collect the enriched mitochondrial band at the interface between the 24% and 40% Percoll layers. Transfer to a new tube and dilute with 6 mL of IM buffer.
- Washing: Centrifuge the diluted mitochondria at 16,750 g for 10 minutes. Discard the supernatant, resuspend the pellet in 1 mL of IM buffer with 0.5% BSA, add 4 mL of IM buffer with 0.1% BSA, and centrifuge at 7,000 g for 10 minutes. The final mitochondrial pellet is resuspended in an appropriate assay buffer (e.g., MAS + 1% BSA for respirometry).
Expected Outcomes: This method yields ~200-400 μg of mitochondrial protein from 100-200 mg of fresh tissue. Mitochondria are functionally intact, with Respiratory Control Ratios (RCR) between 3.9 and 7.1 when assessed with a Seahorse XFe96 Analyzer, confirming coupled respiration [11]. Proteomic analysis shows significant enrichment of mitochondrial proteins, indicating high sample purity.
Magnetic Bead Affinity Purification
For extremely small samples, such as cultured cells, magnetic bead-based affinity purification offers a highly specific and gentle alternative to ultracentrifugation. The following method is described for yeast but is adaptable to mammalian systems with anti-TOMM20 conjugated beads [36] [37].
Protocol: Ni-NTA Magnetic Bead Purification of Yeast Mitochondria [36] [37]
- Genetic Engineering: Generate a yeast strain (e.g., S. cerevisiae) where a mitochondrial outer membrane protein (e.g., Tom70) is chromosomally tagged with 6xHis.
- Cell Growth and Spheroplast Formation: Grow yeast in lactate medium. Harvest cells and treat with zymolyase in Tris-DTT buffer to digest the cell wall and form spheroplasts.
- Homogenization: Suspend spheroplasts in SEH buffer (0.6 M Sorbitol, 20 mM HEPES-KOH pH 7.4, 2 mM MgCl2) with protease inhibitors. Lyse cells using a Dounce homogenizer with a limited number of strokes to preserve mitochondrial integrity.
- Crude Mitochondrial Isolation: Subject the lysate to differential centrifugation: centrifuge at 1,500 g for 5 minutes to remove nuclei and unbroken cells. Transfer the supernatant to a new tube and centrifuge at 18,000 g for 10-12 minutes to pellet a crude mitochondrial fraction.
- Affinity Purification: Resuspend the crude mitochondrial pellet in SEH buffer. Incubate with Ni-NTA magnetic beads for 60 minutes at 4°C with gentle rotation.
- Washing and Elution: Place the tube on a magnetic rack to capture the bead-bound mitochondria. Wash the beads several times with SEH buffer. To release the purified mitochondria, incubate the beads with SEH buffer containing a high concentration of imidazole (e.g., 300-500 mM) for 10 minutes on ice. Use the magnetic rack to separate the eluted mitochondria from the beads.
Expected Outcomes: This method yields approximately 100 μg of mitochondrial protein per gram of wet yeast cells. The resulting mitochondria demonstrate less contamination from endoplasmic reticulum and vacuoles compared to differential centrifugation alone and are intact and functional for protein import and respiratory assays [37].
Micro-Scale Adaptations for Functional Assays
When mitochondrial isolation is not feasible, functional assays can be adapted for minimal material directly from homogenized small samples.
Protocol: Spectrophotometric Complex V Activity in PBMCs [38]
- PBMC Isolation: Isolate Peripheral Blood Mononuclear Cells (PBMCs) from ~2 mL of whole blood via density centrifugation, yielding approximately 2 x 10^6 cells.
- Sample Preparation: Use whole cell extracts without mitochondrial isolation. The assay leverages the reverse activity (ATPase) of Complex V.
- Activity Measurement: The assay couples ATP hydrolysis to NADH oxidation, monitored as a decrease in absorbance at 340 nm. Test samples with and without the Complex V-specific inhibitor oligomycin (62.5 nM). The oligomycin-sensitive activity represents specific Complex V activity.
Expected Outcomes: This micro-assay robustly detects Complex V activity from as few as 4 x 10^5 PBMCs. In control experiments, over 90% of the total ATPase activity was oligomycin-sensitive, confirming the specificity for Complex V [38].
Quantitative Comparison of Adapted Methods
The table below summarizes the key performance metrics of the small-scale methods described.
Table 1: Performance Metrics of Small-Scale Mitochondrial Isolation and Assessment Methods
| Method | Typical Starting Material | Reported Yield | Key Purity/Functionality Metrics | Processing Time |
|---|---|---|---|---|
| Percoll Gradient (Skeletal Muscle) [11] | 100-200 mg fresh tissue | 200-400 μg protein | RCR: 3.9 - 7.1; High purity by proteomics | ~3-4 hours |
| Magnetic Bead (Yeast) [36] [37] | 1 g wet yeast cells | ~100 μg protein | Low ER/vacuole contamination; functional for import | ~2-3 hours (excl. growth) |
| Complex V Assay (PBMCs) [38] | 2 x 10^6 cells (~2 mL blood) | N/A (direct assay) | >90% oligomycin-sensitive activity | N/A |
Workflow Visualization
The following diagram summarizes the decision-making workflow for selecting the appropriate small-scale method based on sample type and research goals.
The Scientist's Toolkit: Essential Research Reagents
Successful implementation of these protocols relies on key reagents. The following table lists essential solutions and their critical functions.
Table 2: Key Reagent Solutions for Small-Scale Mitochondrial Research
| Reagent/Buffer | Key Components | Primary Function |
|---|---|---|
| Homogenization Buffer [18] [7] | Sucrose/Mannitol, HEPES/MOPS, EGTA, BSA | Maintains osmotic balance, provides pH stability, chelates Ca²⁺, and prevents mitochondrial adhesion. |
| Percoll Gradient Media [11] | Percoll, Sucrose/Mannitol, HEPES, EGTA | Forms an iso-osmotic density gradient for separation of mitochondria from lighter contaminants. |
| Mitochondrial Assay Buffer (MAS) [11] | Sucrose, Mannitol, KCl, MgCl₂, K₂HPO₄, HEPES | Provides an ideal ionic environment for assessing mitochondrial respiration and coupling. |
| SEH Buffer [36] | Sorbitol, HEPES-KOH, MgCl₂ | Maintains mitochondrial integrity during affinity purification and washing steps. |
| Protease Inhibitor Cocktails | PMSF, various protease inhibitors | Prevents proteolytic degradation of mitochondrial proteins during isolation. |
Advanced Functional Assessment in Frozen Tissue
A major challenge with limited samples is the inability to perform fresh isolations consistently. A recent innovation allows for assessing mitochondrial respiratory capacity in frozen cardiac tissue, bypassing the need for fresh isolates [39].
Protocol: Tailored Substrate-Inhibitor Titration (TSIT) for Frozen Tissue [39]
- Sample Preparation: Prepare whole-tissue homogenate from frozen cardiac samples without centrifugation to avoid mitochondrial loss.
- Respirometry Measurement: Using an O2k-FluoRespirometer, add substrates and inhibitors sequentially to measure specific ETC complex capacities.
- CI-linked Capacity: Add acetyl-CoA to fuel the TCA cycle and generate NADH.
- Maximal CI Capacity: Add exogenous NADH.
- CII-linked Capacity: Add rotenone (CI inhibitor) and succinate.
- Data Interpretation: The acetyl-CoA-mediated respiration reflects TCA cycle-coupled ETC function, while NADH-driven respiration reveals the maximum capacity of CI.
This method has successfully detected mitochondrial dysfunction in various mouse models and human frozen samples, providing a powerful tool for leveraging biobank resources [39].
The constraints of small sample sizes and limited starting material no longer preclude high-quality mitochondrial research. The methods detailed herein—refined density gradient centrifugation, affinity-based purification, and direct micro-assays—provide a comprehensive toolkit for researchers. The choice of method depends critically on the sample type, the required level of mitochondrial purity, and the specific downstream application, whether it be functional respirometry, proteomics, or enzymatic activity measurement. By adopting these adapted protocols, research into mitochondrial biology and its role in disease can progress even with the most challenging and precious of samples.
Mitochondrial integrity is paramount for cellular health, influencing processes from energy production to apoptosis. Within the context of mitochondrial purification via density gradient centrifugation, the composition of the buffers used throughout isolation is a critical determinant of success. Optimized buffers preserve morphological integrity, sustain bioenergetic function, and minimize contamination from other organelles, thereby ensuring that downstream analyses reflect the true in vivo state of the mitochondria [11] [18]. Recent research underscores that suboptimal perfusion and isolation solutions can induce significant metabolic stress, characterized by mitochondrial swelling, endoplasmic reticulum dilation, and a shift in metabolic pathways, ultimately compromising experimental outcomes [40]. This application note details a optimized buffer system designed to maintain mitochondrial integrity during purification, supported by quantitative data and standardized protocols.
Key Additives for Mitochondrial Integrity
The following table summarizes critical buffer additives, their optimal concentrations, and mechanistic roles in preserving mitochondrial function during isolation.
Table 1: Essential Additives for Mitochondrial Integrity Buffer Formulation
| Additive Category | Specific Compound | Recommended Concentration | Primary Function |
|---|---|---|---|
| Osmotic Regulators | Sucrose | 0.225 M [18] | Maintains osmotic balance, prevents swelling/contraction |
| Mannitol | 0.075 - 0.225 M [18] | Works synergistically with sucrose as an osmotic stabilizer | |
| Energy Substrates & Metabolites | Pyruvate / Malate / Succinate | 1-5 mM (context-dependent) [40] | Fuels TCA cycle and oxidative phosphorylation |
| NAD+ Precursors (e.g., Nicotinamide) | To be optimized [40] | Supports NAD+ signaling and biosynthesis pathways | |
| Membrane Stabilizers | Fatty Acid-Free BSA | 0.1 - 0.5% [11] [18] | Binds free fatty acids, prevents membrane disruption |
| Ion Chelators & Homeostasis | EGTA | 1 mM [18] | Chelates calcium, prevents mPTP opening and swelling |
| KCl | 0.1 M [18] | Maintains ionic strength and membrane potential | |
| Protease & Phosphatase Inhibitors | Protease Inhibitor Cocktail | As per manufacturer | Prevents proteolytic degradation of mitochondrial proteins |
| Phosphatase Inhibitor Cocktail | As per manufacturer | Preserves post-translational modification states |
Experimental Protocol: Mitochondrial Isolation and Integrity Assessment
Optimized Mitochondrial Isolation via Density Gradient Centrifugation
This protocol is adapted from established methods for skeletal muscle and cardiac tissue [11] [18], incorporating key additives for integrity preservation.
Materials:
- Homogenization Buffer: 10 mM MOPS (pH 7.4), 0.225 M sucrose, 0.075 M mannitol, 1 mM EGTA, 0.2% fatty acid-free BSA.
- Percoll Gradient Solutions: 15%, 24%, and 40% Percoll (v/v) in 1X IM Buffer (e.g., 30 mM Tris-HCl, 0.225 M mannitol, 0.075 M sucrose, 0.1 mM EGTA, pH 7.4).
- MAS Respiration Buffer: 70 mM sucrose, 220 mM mannitol, 10 mM KH₂PO₄, 5 mM MgCl₂, 2 mM HEPES, 1 mM EGTA, pH 7.4, supplemented with 0.2% fatty acid-free BSA.
Procedure:
- Tissue Homogenization: Mince ~100-200 mg of fresh skeletal muscle or heart tissue in ice-cold Homogenization Buffer containing protease/phosphatase inhibitors. Use a Dounce homogenizer (10-15 strokes) for mechanical disruption.
- Differential Centrifugation:
- Centrifuge the homogenate at 1,000 g for 5 min at 4°C to pellet nuclei and cellular debris.
- Transfer the supernatant to a new tube and centrifuge at 21,000 g for 10 min at 4°C to pellet the crude mitochondrial fraction.
- Percoll Density Gradient Purification:
- Resuspend the crude mitochondrial pellet in 2 mL of 15% Percoll solution.
- Carefully layer this suspension on top of a pre-formed discontinuous gradient (3.7 mL of 24% Percoll underlaid with 1.5 mL of 40% Percoll).
- Centrifuge at 30,750 g for 10 min at 4°C with slow acceleration and no brake.
- Mitochondrial Collection:
- Collect the opaque band at the interface between the 24% and 40% Percoll layers.
- Dilute the collected fraction with at least 3 volumes of BSA-free MAS Respiration Buffer.
- Pellet the purified mitochondria by centrifugation at 16,750 g for 10 min.
- Gently resuspend the final pellet in MAS Respiration Buffer with 0.1% BSA for functional assays.
The following workflow diagram illustrates the key steps of the mitochondrial isolation and assessment protocol:
Assessment of Mitochondrial Integrity and Function
A. High-Resolution Respirometry
- Principle: Measures oxygen consumption rate (OCR) to assess mitochondrial function.
- Protocol: Utilize a Seahorse XFe96 Analyzer. Dilute purified mitochondria to 500 ng/well in MAS Respiration Buffer. Inject substrates and inhibitors sequentially:
- Complex I Substrates: Pyruvate (5 mM) + Malate (2.5 mM).
- State 3 Respiration: ADP (4 mM).
- Complex II Substrate: Succinate (10 mM).
- Complex I Inhibitor: Rotenone (2 µM).
- Complex III Inhibitor: Antimycin A (4 µM).
- Data Interpretation: A Respiratory Control Ratio (RCR = State 3/State 4 OCR) above 3.9 indicates well-coupled, functional mitochondria [11].
B. Ultrastructural Analysis via Transmission Electron Microscopy (TEM)
- Principle: Direct visualization of mitochondrial integrity.
- Protocol: Fix purified mitochondrial pellets in Karnovsky's fixative for 48h. Process through osmium tetroxide post-fixation, dehydration, and EPON resin embedding. Cut ultra-thin sections (80 nm), stain with uranyl acetate and lead citrate, and image at 10,000x magnification [41].
- Quantitative Morphometry: Use software to measure:
- Mean Size (µm²) and Elongation: Indicators of fusion-fission balance.
- Conglomeration Score: Reflects abnormal clustering.
- Hydropic Change: Defined by decreased matrix density and cristae loss [41].
The Scientist's Toolkit: Key Research Reagent Solutions
Table 2: Essential Reagents for Mitochondrial Isolation and Analysis
| Reagent / Kit | Vendor Examples | Critical Function |
|---|---|---|
| Percoll | Sigma-Aldrich, Cytiva | Density gradient medium for high-purity mitochondrial isolation [11]. |
| Fatty Acid-Free BSA | Sigma-Aldrich | Stabilizes mitochondrial membranes by binding free fatty acids [11] [18]. |
| Seahorse XF Mitochondrial Stress Test Kit | Agilent Technologies | Standardized reagents for assessing mitochondrial respiration in live cells or isolated organelles [11]. |
| Mitochondria Isolation Kits | Qiagen, Thermo Scientific | Commercial kits providing optimized buffers for standardized mitochondrial isolation from cells and tissues [18]. |
| Protease/Phosphatase Inhibitor Cocktails | Roche, Thermo Scientific | Protect the mitochondrial proteome and phosphoproteome from degradation during isolation [18]. |
Metabolic Pathways Governing Mitochondrial Integrity
The efficacy of the optimized buffer is rooted in its support of key metabolic pathways. Compromised mitochondria, often due to poor buffer conditions, exhibit a metabolic shift away from oxidative phosphorylation (OXPHOS) and towards stress-response pathways like the pentose phosphate pathway (PPP) to manage reactive oxygen species (ROS) [42]. Key regulators include:
- MacroD1: A mitochondrial enzyme whose loss leads to reduced OXPHOS gene expression and increased carbohydrate dependency [42].
- Sirtuin Signaling: This pathway, downregulated in suboptimal conditions, is crucial for metabolic regulation and stress resistance [40].
- NAD+ Biosynthesis: Metabolomic studies identify NAD+ signaling deficiency as a key feature of mitochondrial injury, which can be mitigated by metabolite supplementation [40].
The following diagram illustrates the critical signaling pathways that impact mitochondrial integrity and how optimized buffers exert their protective effects:
Overcoming Technical Challenges: Optimization Strategies and Problem Solving
Within the context of mitochondrial purification research, achieving a high-purity isolate is a cornerstone for reliable proteomic, metabolic, and functional analyses. The inherent similarities in size and density between mitochondria and other organelles, however, present a significant challenge. Lysosomes, peroxisomes, and fragments of the endoplasmic reticulum (ER) are frequent contaminants that can confound experimental results. This application note details the identification and mitigation strategies for these common contaminants within the framework of density gradient centrifugation, providing researchers with validated protocols to enhance the fidelity of their mitochondrial preparations.
Contaminant Profile and Marker Analysis
A critical first step in assessing mitochondrial purity is the analysis of specific marker enzymes associated with common contaminating organelles. The table below summarizes the key markers and their typical enrichment patterns across subcellular fractions obtained via differential centrifugation.
Table 1: Marker Enzymes for Identifying Organellar Contaminants in Mitochondrial Preparations
| Organelle | Marker Enzyme/Protein | Presence in Crude Mitochondrial Fraction (P2/P3) | Enrichment in Purified Mitochondria |
|---|---|---|---|
| Mitochondria | Succinate Dehydrogenase [1] | High | High |
| Lysosomes | β-galactosidase [1] | Moderate | Should be Low/Absent |
| Peroxisomes | Catalase [1] | Moderate | Should be Low/Absent |
| Endoplasmic Reticulum | NADPH-cytochrome c reductase | High (in microsomal fractions) | Should be Low/Absent [43] |
The sedimentation characteristics of organelles during differential centrifugation provide a predictive outline for potential contaminants. The following workflow illustrates a typical differential centrifugation process for subcellular fractionation, highlighting the fractions where cross-contamination most frequently occurs.
Figure 1: Differential Centrifugation and Contaminant Profile. This diagram outlines the initial subcellular fractionation via differential centrifugation. The crude mitochondrial fraction (P2/P3) is typically contaminated with lysosomes and peroxisomes due to overlapping sedimentation properties, necessitating further purification.
Methods for Contaminant Reduction
Density Gradient Centrifugation
Density gradient centrifugation is the most common and effective method for resolving mitochondria from lysosomes and peroxisomes. This technique separates organelles based on their intrinsic buoyant densities.
Table 2: Density Gradient Media and Parameters for Organelle Separation
| Gradient Medium | Organelles Separated | Density Range | Centrifugation Parameters | Key Applications |
|---|---|---|---|---|
| Sucrose | Mitochondria, Lysosomes, Peroxisomes [1] | 1.0 - 1.3 g/mL [44] | 100,000+ g for several hours [43] | Widely used; requires osmotic support |
| Nycodenz/Iodixanol | Mitochondria, Lysosomes, Peroxisomes [1] [45] | 1.0 - 1.3 g/mL | 100,000+ g for several hours [45] | Iso-osmotic; better organelle preservation |
| Percoll | Mitochondria, Lysosomes, Peroxisomes [44] | 1.01 - 1.13 g/mL [44] | 30,000+ g for 30-90 min [44] | Rapid separation; self-forming gradients |
The strategic application of density gradients is key to resolving organellar mixtures. The following diagram contrasts two primary gradient approaches for achieving high-purity mitochondria.
Figure 2: Density Gradient Strategies for Mitochondrial Purification. Discontinuous (isopycnic) gradients separate organelles based on equilibrium density, while velocity sedimentation gradients separate based on size and density under lower centrifugal force.
Protocol: Purification of Mitochondria from Mouse Liver Using a Discontinuous Sucrose Gradient
This protocol is adapted from established methodologies for high-purity mitochondrial isolation [45].
- Homogenization: Rapidly excise the liver and rinse in ice-cold MB buffer (e.g., 210 mM Mannitol, 70 mM Sucrose, 10 mM Tris-base, 1 mM EDTA, pH 7.4). Mince the tissue finely and homogenize manually using a pre-cooled glass homogenizer with a Teflon pestle. Perform all subsequent steps on ice or at 4°C.
- Differential Centrifugation:
- Centrifuge the homogenate at 2,000 g for 5 minutes at 4°C to pellet nuclei and unbroken cells.
- Transfer the supernatant to a new tube and centrifuge at 11,700 g for 10 minutes at 4°C to pellet the crude mitochondrial fraction.
- Gently resuspend the pellet in 50 mL of cold MB buffer.
- Density Gradient Centrifugation:
- Prepare a discontinuous sucrose gradient in an ultracentrifuge tube. Carefully layer the following solutions from bottom to top:
- 4 mL of 60% (w/v) sucrose
- 4 mL of 32% (w/v) sucrose
- 1.5 mL of 23% (w/v) sucrose
- 1.5 mL of 15% (w/v) sucrose (all in 10 mM MOPS/1 mM EDTA, pH 7.2)
- Carefully layer the resuspended crude mitochondrial fraction on top of the gradient.
- Centrifuge at 134,000 g for 1 hour at 4°C in an ultracentrifuge.
- Prepare a discontinuous sucrose gradient in an ultracentrifuge tube. Carefully layer the following solutions from bottom to top:
- Collection and Washing:
- After centrifugation, collect the purified mitochondria, which band at the interface between the 32% and 23% sucrose layers.
- Dilute the collected fraction with at least 2 volumes of MB buffer to reduce sucrose concentration.
- Pellet the mitochondria by centrifuging at 8,000 g for 10 minutes at 4°C.
- Resuspend the final mitochondrial pellet in a suitable buffer (e.g., SEM buffer), aliquot, and store at -80°C.
Advanced and Alternative Techniques
For applications requiring the highest possible purity, such as spatial proteomics or single-mitochondrion analysis, advanced techniques beyond traditional gradients are available.
- Immunoaffinity Purification: This method offers superior specificity. For example, one innovative approach utilizes magnetic beads conjugated with an anti-TOMM20 (a mitochondrial outer membrane protein) antibody to immunocapture highly purified intact mitochondria directly from a pre-cleared tissue homogenate [12]. This method effectively excludes contaminants that have similar densities but different surface epitopes.
- PEROXO-Tag for Peroxisome Isolation: While not a direct mitochondrial purification method, the development of the "PEROXO-Tag" system highlights the power of immunoaffinity. This technique uses a peroxisome-targeted 3XHA epitope tag for rapid (~10 minutes) immunoprecipitation of peroxisomes, which can be applied to deplete this specific contaminant from a starting homogenate prior to mitochondrial isolation [46].
The Scientist's Toolkit: Research Reagent Solutions
Table 3: Essential Reagents and Kits for Mitochondrial Purification and QC
| Reagent/Kit | Function | Specific Example/Note |
|---|---|---|
| Homogenization Buffers | Provide osmotic support and pH stability during cell disruption. | Typically contain sucrose or mannitol (e.g., 250 mM), Tris or MOPS, and EDTA/EGTA [45]. |
| Density Gradient Media | Form the density barrier for separation of organelles. | Sucrose, Nycodenz, Iodixanol, or Percoll. Choice depends on required resolution and osmolarity [1] [45]. |
| Protease Inhibitor Cocktails | Prevent proteolytic degradation of mitochondrial proteins during isolation. | Added to all buffers immediately before use. PMSF is common but may inhibit some assays; EDTA-free versions are available for metalloprotease inhibition [45]. |
| Antibody-Conjugated Magnetic Beads | Enable high-purity immunoisolation of specific organelles. | Anti-TOMM20 beads for mitochondria [12] or anti-HA beads for PEROXO-Tag systems [46]. |
| Marker Enzyme Assay Kits | Quantify organelle-specific enzymes to assess purity and enrichment. | Commercial kits are available for Succinate Dehydrogenase (mito), Catalase (peroxisomes), and β-galactosidase (lysosomes) [1]. |
Concluding Remarks
The pursuit of high-purity mitochondria is not a mere technical exercise but a fundamental prerequisite for generating robust and interpretable data in downstream applications. By understanding the sources and identities of common contaminants—lysosomes, peroxisomes, and ER—researchers can make informed decisions on purification strategies. While density gradient centrifugation remains a versatile and powerful workhorse, the integration of advanced immunoaffinity techniques provides a path to unparalleled purity. The consistent application of the quality control measures outlined herein, particularly the validation of isolates via specific marker analysis, is essential for advancing our understanding of mitochondrial biology in health and disease.
Mitochondrial functionality is critically dependent on strict adherence to temperature control and time management during isolation procedures. The integrity of the mitochondrial membrane, the activity of respiratory complexes, and the accuracy of downstream analytical results are highly susceptible to degradation caused by prolonged processing or thermal stress. Within the broader context of density gradient centrifugation research, these factors become paramount, as the extended protocols, while yielding higher purity, inherently increase the risk of functional decline. This application note details the quantitative impact of these variables and provides validated protocols to preserve mitochondrial viability for research and drug development applications.
Quantitative Impact of Time and Temperature
The following table summarizes key data on how isolation time and temperature directly influence critical mitochondrial quality metrics, based on current methodologies.
Table 1: Quantitative Impact of Time and Temperature on Mitochondrial Quality
| Parameter | Rapid Filtration Method (<30 min) | Percoll Gradient Method (3-4 hours) | Functional Correlation |
|---|---|---|---|
| Total Procedural Time | ~30 minutes [47] | ~3-4 hours [11] | Shorter time reduces exposure to proteases and reactive oxygen species. |
| Mitochondrial Yield | ~2-2.75 x 10^10 particles from ~0.18g tissue [47] | ~200-400 μg protein from 100-200 mg tissue [11] | High yield is maintained in rapid protocols; purity is higher in longer gradients. |
| Respiratory Control Ratio (RCR) | Data not explicitly provided, but mitochondria are "respiration competent" [47] | 3.9 to 7.1 (indicative of high functionality) [11] | RCR is a key indicator of coupled respiration and membrane integrity. |
| Key Temperature | 0-4°C for all buffers and centrifugation steps [47] [11] [18] | 0-4°C for all buffers and centrifugation steps [11] [18] | Prevents metabolic activity, preserves enzyme function, and reduces swelling. |
Detailed Experimental Protocols
Protocol 1: Rapid Mitochondrial Isolation via Differential Filtration
This protocol is designed for situations where speed is critical, such as for subsequent transplantation or acute functional assays, and can be completed in under 30 minutes [47].
Materials:
- Homogenizing Buffer: 300 mM sucrose, 10 mM K-HEPES (pH 7.2), 1 mM K-EGTA [47].
- Respiration Buffer: 250 mM sucrose, 2 mM KH2PO4, 10 mM MgCl2, 20 mM K-HEPES (pH 7.2), 0.5 mM K-EGTA (pH 8.0) [47].
- Reagents: Subtilisin A, Fatty Acid-Free BSA [47].
- Equipment: Tissue dissociator (e.g., Miltenyi Biotec), 40 μm and 10 μm nylon mesh filters, pre-chilled centrifuges [47].
Procedure:
- Homogenization: Transfer fresh tissue (e.g., two 6 mm biopsy punches) to a dissociation tube containing 5 mL of ice-cold Homogenizing Buffer. Homogenize using a standardized cycle on a tissue dissociator (e.g., 60 seconds) [47].
- Digestion: Add 250 μL of Subtilisin A stock to the homogenate, mix by inversion, and incubate on ice for 10 minutes [47].
- Differential Filtration:
- Filter the homogenate through a pre-wetted 40 μm mesh filter into a tube on ice.
- Add 250 μL of BSA stock to the filtrate and mix.
- Sequentially filter the homogenate through a second 40 μm filter and then a 10 μm filter [47].
- Mitochondrial Pelletting: Transfer the final filtrate to pre-chilled microcentrifuge tubes. Centrifuge at 9,000 x g for 10 minutes at 4°C [47].
- Resuspension: Carefully discard the supernatant and resuspend the mitochondrial pellet in 1 mL of ice-cold Respiration Buffer. Keep on ice for immediate use [47].
Rapid Mitochondrial Isolation Workflow
Protocol 2: High-Purity Isolation via Percoll Density Gradient Centrifugation
This method prioritizes purity over speed, ideal for proteomic or detailed bioenergetic studies, but requires careful time management across its 3-4 hour duration [11].
Materials:
- IM Buffer: 10 mM MOPS (pH 7.4), 200 mM mannitol, 70 mM sucrose, 1 mM EGTA [11].
- Percoll Gradients: Discontinuous gradient of 40%, 24%, and 15% Percoll in IM buffer [11].
- MAS Buffer: For final resuspension and respirometry assays [11].
- Reagents: Nagarse (protease), Fatty Acid-Free BSA [11].
- Equipment: Dounce homogenizer, ultracentrifuge, Seahorse XF Analyzer (for validation) [11].
Procedure:
- Tissue Preparation and Homogenization: Mince ~100-200 mg of skeletal muscle (e.g., quadriceps) in IM buffer containing Nagarse (0.6 mg/mL). Digest for 5 minutes at room temperature, then homogenize with a Dounce homogenizer (10 strokes with a loose pestle) [11].
- Differential Centrifugation:
- Centrifuge the homogenate at 1,000 x g for 5 minutes at 4°C to remove debris and nuclei.
- Transfer the supernatant and centrifuge at 21,000 x g for 10 minutes at 4°C to pellet a crude mitochondrial fraction [11].
- Percoll Gradient Purification:
- Resuspend the crude pellet in 2 mL of 15% Percoll and layer it onto a pre-formed discontinuous gradient (24% and 40% Percoll).
- Centrifuge at 30,750 x g for 10 minutes at 4°C with slow acceleration and no brake.
- Collect the purified mitochondrial fraction found at the interface between the 24% and 40% Percoll layers [11].
- Washing and Final Resuspension:
- Dilute the collected fraction with 6 mL of IM buffer and centrifuge at 16,750 x g for 10 minutes at 4°C to wash away Percoll.
- Resuspend the final, purified mitochondrial pellet in MAS buffer + 0.5% BSA for functional assays [11].
Percoll Density Gradient Purification Workflow
The Scientist's Toolkit: Essential Research Reagents
The following table lists key reagents and their critical functions in preserving mitochondrial functionality during isolation.
Table 2: Key Research Reagent Solutions for Mitochondrial Isolation
| Reagent/Chemical | Function in Protocol | Rationale & Optimization Tip |
|---|---|---|
| Sucrose & Mannitol | Osmotic support in homogenization and isolation buffers [47] [11] [18]. | Creates a balanced osmotic pressure to prevent mitochondrial swelling and rupture. Concentrations typically range from 70-300 mM. |
| HEPES/K-HEPES Buffer | Maintains physiological pH (7.2-7.4) during isolation [47] [11] [18]. | Prevents acidification that can uncouple oxidative phosphorylation and damage ETC complexes. |
| EGTA/K-EGTA | Chelator of calcium ions (Ca²⁺) [47] [11] [18]. | Prevents calcium overload, which triggers mitochondrial permeability transition (MPT) and swelling [48]. |
| Fatty Acid-Free BSA | Added to washing and resuspension buffers [11] [18]. | Binds free fatty acids and detergents released during homogenization, which can uncouple respiration. Essential for maintaining high RCR. |
| Protease Inhibitor Cocktail | Added to all buffers to prevent proteolysis [18]. | Preserves the integrity of the mitochondrial proteome for downstream analyses like Western Blot and mass spectrometry. |
| Percoll | Silica nanoparticle solution for density gradient centrifugation [11]. | Provides a low-osmolarity, inert medium for high-resolution separation of mitochondria from contaminants like lysosomes and peroxisomes. |
The isolation of high-purity, functional mitochondria from plant tissues rich in phenolics and characterized by tough cell walls presents significant technical challenges. These compounds can inhibit mitochondrial function and co-purify with organelles, compromising downstream analyses. This application note details optimized protocols leveraging density gradient centrifugation to overcome these obstacles, enabling high-quality mitochondrial preparations from complex plant samples for biomedical and pharmacological research.
Plant phenolics, a class of secondary metabolites with strong antioxidant properties, are abundant throughout the plant kingdom and can interfere with mitochondrial isolation and function [49]. Furthermore, tough plant tissues, such as stems and seeds, possess resilient cell walls that hinder efficient cellular disruption and organelle release. Within the context of mitochondrial research for biomedical studies, the demand for highly purified mitochondria is growing [12]. Standard differential centrifugation often results in mitochondrial preparations contaminated with other organelles, including lysosomes, peroxisomes, and fragments of the endoplasmic reticulum [11]. Density gradient centrifugation, however, can achieve highly purified preparations while maintaining organelle viability and respiratory activity, making it essential for overcoming sample-specific challenges [11].
Protocol: Density Gradient Centrifugation for Challenging Plant Tissues
The following protocol is adapted from methods established for purifying mitochondria from tough tissues like skeletal muscle [11] and modified to address the specific challenges posed by phenolic-rich plant materials.
Research Reagent Solutions
Table 1: Essential Reagents for Mitochondrial Isolation from Plant Tissues
| Reagent/Material | Function | Considerations for Plant Tissues |
|---|---|---|
| Isolation Medium (IM) Buffer | Provides osmotic support and maintains pH during homogenization. | Supplement with Polyvinylpyrrolidone (PVP) or bovine serum albumin (BSA) to bind and sequester phenolic compounds. |
| Percoll | Silica nanoparticle solution used to form density gradients for organelle separation. | Enables separation of intact mitochondria from cellular debris and phenolic-containing vesicles [11]. |
| Nagarse (Protease) | Enzymatically digests tough connective proteins in animal tissue. | For plant tissues, use specific cellulase and pectinase mixtures to digest resilient cell walls. |
| Fatty Acid-Free BSA | Scavenges fatty acids and contaminants; improves mitochondrial integrity. | Also acts as a phenolic-binding agent, preventing oxidation and enzyme inhibition [11]. |
| Density Gradient Buffers | Forms the discontinuous gradient for purification (e.g., 15%, 24%, 40% Percoll). | Sharp interfaces between layers are critical for effective separation and purity [11]. |
Detailed Step-by-Step Methodology
Step 1: Tissue Harvest and Pre-Homogenization
- Rapidly harvest plant tissue and immediately submerge it in ice-cold Isolation Medium (IM) supplemented with 2% PVP and 0.5% fatty acid-free BSA.
- Remove any connective or vascular tissue. Quickly mince the tissue into fine pieces using a sharp blade or scissors on a chilled surface.
Step 2: Cell Homogenization
- Transfer the minced tissue to a pre-chilled Dounce homogenizer.
- Add ice-cold IM buffer (with PVP/BSA) and homogenize using a loose-fitting pestle with 10-15 controlled strokes. Note: Over-homogenization can damage mitochondria, while under-homogenization reduces yield.
- Filter the resulting homogenate through a pre-wetted 70-100 μm nylon mesh to remove large debris and cell wall fragments [11].
Step 3: Differential Centrifugation for Crude Mitochondrial Fraction
- Centrifuge the filtered homogenate at 1,000 × g for 5 minutes at 4°C to pellet nuclei, unbroken cells, and heavy debris.
- Carefully collect the supernatant and centrifuge it at 21,000 × g for 10 minutes at 4°C to pellet a crude mitochondrial fraction.
- Gently resuspend the pellet in 2 ml of 15% Percoll in IM buffer.
Step 4: Discontinuous Percoll Density Gradient Centrifugation
- In a 10 ml polycarbonate centrifuge tube, prepare a discontinuous gradient by carefully layering the following, from bottom to top [11]:
- 1.5 ml of 40% Percoll in IM buffer
- 3.7 ml of 24% Percoll in IM buffer
- Gently layer the 2 ml of resuspended crude mitochondria (in 15% Percoll) on top of the gradient.
- Centrifuge the tubes at 30,750 × g for 10 minutes at 4°C using slow acceleration and no brake to preserve the gradient integrity.
- After centrifugation, a purified mitochondrial band will be visible at the interface between the 24% and 40% Percoll layers. Carefully collect this band using a Pasteur pipette.
Step 5: Post-Gradient Washing
- Transfer the collected mitochondrial fraction to a new centrifuge tube.
- Add at least 6 ml of IM buffer (with 0.1% BSA) to dilute the residual Percoll.
- Centrifuge at 16,750 × g for 10 minutes at 4°C to re-pellet the mitochondria.
- Discard the supernatant and gently resuspend the final, purified mitochondrial pellet in a suitable respiration buffer (e.g., MAS buffer) for immediate functional analysis.
Experimental Workflow
The following diagram illustrates the complete experimental workflow for the mitochondrial purification protocol.
Quantitative Data and Functional Assessment
Expected Outcomes and Performance Metrics
Table 2: Expected Yield, Purity, and Functional Metrics from Plant Mitochondrial Purification
| Parameter | Typical Result / Value | Measurement Technique | Notes |
|---|---|---|---|
| Protein Yield | 200 - 400 µg per 100-200 mg fresh tissue | Qubit Protein Assay [11] | Yield is highly tissue-dependent. |
| Preparation Time | ~3 - 4 hours | - | From tissue harvest to final purified pellet. |
| Respiratory Control Ratio (RCR) | 3.9 - 7.1 | Seahorse XFe96 Analyzer [11] | Indicator of mitochondrial coupling and functional integrity. |
| Purity Assessment | Significant enrichment of mitochondrial proteins (e.g., TOMM20) | Mass Spectrometry Proteomics [11] | Confirms minimal contamination from other organelles. |
| Phenolic Contamination | Significantly reduced | Spectrophotometric assay (e.g., Folin-Ciocalteu) | Compared to crude homogenate or differential centrifugation pellets. |
Comparison of Mitochondrial Isolation Techniques
Table 3: Comparative Analysis of Mitochondrial Isolation Methods
| Isolation Technique | Principle | Advantages | Disadvantages | Suitability for Phenolic-Rich/Tough Tissues |
|---|---|---|---|---|
| Differential Centrifugation | Sequential centrifugation at increasing speeds to pellet organelles by mass. | Rapid, simple, maintains high mitochondrial function [11]. | Low purity, high risk of co-precipitating phenolic compounds and other organelles [11]. | Low |
| Density Gradient Centrifugation (Percoll) | Separation based on buoyant density in an inert medium. | High purity, maintains respiratory activity, effective for removing contaminants [11]. | Longer preparation time, requires ultracentrifuge, Percoll must be washed from final sample [11]. | High |
| Immunoaffinity Purification | Use of magnetic beads conjugated with antibodies against mitochondrial surface proteins (e.g., TOMM20) [12]. | Very high specificity and purity, suitable for small samples [12]. | High cost, requires specific antibodies, potential for antibody-mediated functional impact. | Medium |
Troubleshooting and Technical Notes
- Low Yield: Ensure tissue is finely minced and homogenization is efficient. Test different enzyme cocktails for cell wall digestion.
- Poor Respiration (Low RCR): Minimize processing time; keep samples on ice at all steps. Ensure all buffers are freshly prepared and at the correct pH.
- Percoll Contamination: Ensure adequate dilution and repeated washing steps post-gradient centrifugation. Failure to do so can inhibit downstream assays.
- Phenolic Interference: If oxidation (browning) is observed, increase the concentration of PVP or BSA in the initial isolation buffers. Work quickly and perform initial steps under inert gas if possible.
The application of density gradient centrifugation is a powerful strategy for overcoming the specific challenges posed by phenolic-rich and tough plant tissues in mitochondrial purification. The protocol detailed herein, emphasizing the use of phenolic-binding agents and a discontinuous Percoll gradient, enables the isolation of functional mitochondria with high purity and integrity. This facilitates reliable assessment of mitochondrial function, which is crucial for advancing research in oxidative stress, metabolic disorders, and the evaluation of bioactive plant compounds in biomedical and drug development contexts.
Optimizing Gradient Formation and Centrifugation Parameters
Density gradient centrifugation is a cornerstone technique in mitochondrial research, enabling the isolation of high-purity, functional organelles for downstream biochemical and functional analyses. The fundamental principle relies on separating cellular components based on their buoyant density by centrifuging samples through media of varying densities [13] [11]. This method effectively partitions mitochondria from contaminants like lysosomes, peroxisomes, and sarcoplasmic reticulum, which is unattainable with simple differential centrifugation [11]. The choice of gradient medium—Percoll, Ficoll, or sucrose—along with precise optimization of centrifugation force, duration, and gradient formation, is critical for isolating intact mitochondria with preserved respiratory function [13] [11]. This application note details optimized protocols and parameters for successful mitochondrial purification, framed within the context of advanced mitochondrial research.
Key Research Reagent Solutions
The following table summarizes essential reagents and their specific functions in mitochondrial isolation protocols.
Table 1: Essential Reagents for Mitochondrial Isolation via Density Gradient Centrifugation
| Reagent | Function in Protocol |
|---|---|
| Percoll | A low-viscosity, colloidal silica medium used to form iso-osmotic density gradients for purifying mitochondria away from contaminating organelles [11]. |
| Ficoll | A high-mass polymer used in sucrose density gradients, particularly for separating synaptic from non-synaptic mitochondria in neural tissue [50] [13]. |
| Sucrose | Provides the osmotic support necessary to maintain mitochondrial integrity in homogenization and isolation buffers [50] [51] [7]. |
| Fatty Acid-Free BSA | Absorbs free fatty acids and detergents that could otherwise compromise the integrity of the mitochondrial membranes [50] [11]. |
| HEPES/EGTA | Buffering system (HEPES) and calcium chelator (EGTA) that maintain stable pH and protect mitochondria from calcium-induced permeability transition [50] [52]. |
| Digitonin | A mild detergent used at low concentrations to selectively permeabilize the plasma membrane without damaging internal organelles, facilitating their release [52]. |
Comparative Analysis of Gradient Media and Parameters
Different gradient media are suited to specific tissue types and research goals. The table below provides a quantitative comparison of parameters from established protocols.
Table 2: Optimized Centrifugation Parameters for Different Density Gradient Media
| Gradient Medium | Tissue / Application | Gradient Composition (v/v) | Centrifugation Parameters (Force & Time) | Reported Outcome |
|---|---|---|---|---|
| Percoll | Skeletal Muscle (Quadriceps) [11] | Discontinuous: 40%, 24%, and 15% layers | 30,750 g for 10 min (slow acceleration, no brake) | High purity; ~200-400 µg mitochondrial protein yield from 100-200 mg tissue; RCR 3.9-7.1 [11] |
| Ficoll-Sucrose | Brain / Synaptic Mitochondria [50] [13] | Ficoll in sucrose-based STE buffer | 32,000 g for 30 min | Effective separation of synaptic from non-synaptic mitochondria; 3x higher synaptic yield than UC [13] |
| Sucrose | General Use / iBAT [51] [7] | Homogenization in 250mM sucrose buffer | Sequential spins: 1,000 g (10 min), 15,000 g (20 min) | Pelleted "pure" mitochondria; suitable for Western blotting [51] |
Detailed Experimental Protocols
Protocol 1: Percoll Density Gradient for Skeletal Muscle Mitochondria
This protocol, adapted from [11], yields high-purity, functional mitochondria from mouse skeletal muscle.
Materials:
- Isolation Medium (IM) Buffer: 250 mM sucrose, 10 mM HEPES, 1 mM EGTA, pH 7.4.
- Percoll Solutions: 40%, 24%, and 15% (v/v) Percoll in 1X IM buffer.
- MAS Buffer: For resuspending the final mitochondrial pellet.
Methodology:
- Tissue Preparation: Mince ~100-200 mg of fresh quadriceps muscle finely on ice. Digest the minced tissue in IM buffer containing Nagarse (0.6 mg/ml) for 5 minutes at room temperature.
- Homogenization: Transfer the digested tissue to a Dounce homogenizer and homogenize with 10-13 strokes using a loose-fitting pestle.
- Crude Mitochondria Isolation:
- Centrifuge the homogenate at 1,000 g for 5 min at 4°C to remove nuclei and debris.
- Collect the supernatant and centrifuge at 21,000 g for 10 min at 4°C. Discard the supernatant; this pellet is the crude mitochondrial fraction.
- Density Gradient Centrifugation:
- In a 10 ml polycarbonate tube, prepare a discontinuous gradient by carefully layering 3.7 ml of 24% Percoll, then underlaying with 1.5 ml of 40% Percoll.
- Resuspend the crude mitochondrial pellet in 3.5 ml of 15% Percoll and carefully layer it on top of the prepared gradient.
- Centrifuge at 30,750 g for 10 min at 4°C using slow acceleration and no brake.
- Mitochondria Collection:
- After centrifugation, collect the purified mitochondrial band found at the interface between the 24% and 40% Percoll layers.
- Dilute the collected fraction with at least 6 ml of IM buffer and centrifuge at 16,750 g for 10 min to wash away the Percoll.
- Resuspend the final mitochondrial pellet in MAS buffer for immediate functional analysis [11].
Protocol 2: Ficoll-Sucrose Density Gradient for Synaptic Mitochondria
This protocol isolates synaptic mitochondria from brain tissue, leveraging Ficoll-sucrose density gradients [50] [13].
Materials:
- Mitochondria Isolation Buffer (MIB): 215 mM mannitol, 75 mM sucrose, 0.1% BSA, 20 mM HEPES, 1 mM EGTA, pH 7.2.
- STE Buffer: Sucrose, Tris, and EDTA solution for preparing the Ficoll gradient.
- Ficoll Gradient: Prepared in STE buffer.
Methodology:
- Synaptosome Preparation: Homogenize brain tissue (e.g., cortex or hippocampus) in MIB. Centrifuge the homogenate at low speed (e.g., 1,300 g for 3 min) to obtain a supernatant containing synaptosomes.
- Synaptosome Pellet: Pellet the synaptosomes from the supernatant by centrifugation at a higher force (e.g., 13,000 g for 10 min).
- Synaptosome Disruption: Resuspend the synaptosome pellet and disrupt it using a nitrogen cell disruptor at 1250 psi for 10 minutes to release synaptic mitochondria [50].
- Density Gradient Centrifugation:
- Layer the post-disruption supernatant onto a pre-formed Ficoll-sucrose density gradient.
- Centrifuge at 32,000 g for 30 min at 4°C.
- Mitochondria Collection:
- Discard the supernatant and resuspend the pellet, which contains the purified synaptic mitochondria, in fresh MIB.
- A final wash step (13,000 g for 10 min) is performed to ensure purity before resuspension for functional assays [50].
Critical Optimization Parameters
Successful isolation of functional mitochondria hinges on several key parameters:
- Gradient Formation: Sharp interfaces between gradient layers are crucial for effective separation. Underlaying denser solutions using a syringe pump or careful pipetting is recommended to maintain distinct layers [11].
- Centrifugation Force and Time: Excessive force or duration can damage mitochondria, while insufficient parameters lead to poor yield and purity. The optimized values in Table 2 provide a reliable starting point [13] [11].
- Centrifugation Kinetics: Using slow acceleration and no brake during gradient centrifugation prevents the re-mixing of gradient layers, which is vital for achieving high-resolution separation [11].
- Mitochondrial Integrity: The inclusion of EGTA and BSA in buffers, along with maintaining samples at 0-4°C throughout the protocol, is essential for preserving mitochondrial function and membrane integrity [50] [52].
The meticulous optimization of gradient formation and centrifugation parameters is fundamental to advancing mitochondrial research. The protocols and data presented here provide a validated framework for researchers to isolate high-quality mitochondria, enabling accurate assessment of mitochondrial function, proteomics, and the investigation of subpopulations, thereby supporting drug development and mechanistic studies in metabolic and neurodegenerative diseases.
Quality Control Checkpoints Throughout the Isolation Process
The integrity of mitochondrial function is a cornerstone of cellular metabolic research, and its preservation begins with the isolation process. The application of density gradient centrifugation has become a gold standard for purifying functional mitochondria away from contaminating organelles. However, the technique's success is critically dependent on the implementation of rigorous, multi-stage quality control checkpoints [53]. These checkpoints are not mere validations but are integrated components of the isolation protocol, essential for obtaining reproducible, high-quality mitochondrial preparations suitable for downstream applications such as bioenergetic profiling and proteomics [16]. This document outlines the essential checkpoints and provides detailed protocols to ensure the structural and functional integrity of isolated mitochondria.
Essential Quality Control Checkpoints
A successful mitochondrial isolation protocol is monitored through a series of checkpoints that assess purity, structural integrity, and biological function at critical stages. The table below summarizes the key parameters to be measured.
Table 1: Key Quality Control Checkpoints for Mitochondrial Isolation
| Checkpoint Stage | Parameter Assessed | Measurement Technique | Acceptance Criteria / Expected Outcome |
|---|---|---|---|
| Post-Homogenization | Tissue Disruption & Cell Lysis | Microscopy | Effective cell lysis with release of organelles. |
| Post-Differential Centrifugation | Crude Mitochondrial Yield | Protein Quantification (e.g., Qubit Assay) | Variable yield, dependent on starting tissue [16]. |
| Post-Density Gradient | Mitochondrial Purity & Enrichment | Proteomic Analysis (e.g., SWATH-MS) | Significant enrichment of mitochondrial proteins [16]. |
| Final Mitochondrial Pellet | Structural Integrity | Cytochrome c Oxidase Assay | >90% intact outer membranes [54]. |
| Particle Size Uniformity | Laser Light Scattering | Uniform population with diameter ~520-540 nm [54]. | |
| Concentration & Yield | Protein/DNA Quantification | e.g., 200-400 μg protein from 100-200 mg mouse muscle [16]. | |
| Functional Assessment | Bioenergetic Competence | Seahorse XF Analyzer (Respiratory Control Ratio - RCR) | RCR values ranging from 3.9 to 7.1 with various substrates [16]. |
Purity and Integrity Assessments
- Proteomic Analysis for Purity: Confirming isolation purity involves techniques like Sequential Window Acquisition of all Theoretical Mass Spectrometry (SWATH-MS). This method allows for the relative quantitation of proteins in the sample. A successful preparation will show significant enrichment of mitochondrial proteins and minimal presence of markers for other organelles like the sarcoplasmic reticulum or lysosomes, which are common contaminants in differential centrifugation preparations [16].
- Cytochrome c Oxidase Assay for Integrity: The integrity of the mitochondrial outer membrane is crucial for function. This is assessed using a cytochrome c oxidase assay. Intact mitochondria retain cytochrome c within the intermembrane space. The assay measures the enzyme's activity before and after permeabilizing the outer membrane with a detergent. A high percentage of cytochrome c retention (>90%) indicates a preparation with mostly intact mitochondria [54].
- Particle Size Analysis: Laser light scattering particle size analysis can be used to monitor the purification process. After differential centrifugation, filtration through 1.2μm and 0.8μm filters can produce a more uniform mitochondrial population, with mean particle diameters refining to approximately 520-540 nm, indicating removal of debris and other contaminants [54].
Functional Bioenergetic Assessment
The ultimate validation of mitochondrial quality is their functional capacity, primarily measured through respiratory control.
- Seahorse XF Analysis: The Seahorse XFe96 Analyzer provides a high-throughput platform for measuring mitochondrial respiration in real-time. The key metric is the Respiratory Control Ratio (RCR), which is the ratio of the oxygen consumption rate (OCR) in the presence of ADP (State 3, phosphorylating state) to the OCR after ADP is depleted (State 4, non-phosphorylating state). A high RCR (e.g., 3.9-7.1, as reported for purified skeletal muscle mitochondria [16]) indicates coupled mitochondria with intact inner membranes and functional electron transport chains. Low RCR values suggest damage or uncoupling.
Detailed Experimental Protocols
Mitochondrial Isolation via Density Gradient Centrifugation
This protocol, adapted for mouse skeletal muscle, ensures minimal contamination and high functionality [16].
- Tissue Preparation: Excise the quadriceps femoris muscle (100-200 mg) and place it in ice-cold DPBS. Remove connective and adipose tissue, mince finely with scissors in Isolation Medium (IM) containing Nagarse (0.6 mg/ml), and incubate for 5 minutes at room temperature.
- Homogenization: Transfer the digested tissue to a Dounce homogenizer and homogenize with 10 strokes of a loose-fitting pestle. Rinse the homogenizer with IM buffer containing 0.5% fatty acid-free BSA and combine with the homogenate.
- Differential Centrifugation:
- Centrifuge the homogenate at 1,000 g for 5 minutes at 4°C to pellet nuclei and debris.
- Collect the supernatant and repeat the low-speed spin on the pellet after resuspension.
- Pool the supernatants and centrifuge at 21,000 g for 10 minutes at 4°C to pellet the crude mitochondrial fraction.
- Density Gradient Purification:
- Prepare a discontinuous Percoll gradient in a 10 ml polycarbonate tube: carefully underlay 1.5 ml of 40% Percoll with 3.7 ml of 24% Percoll (both in IM buffer).
- Resuspend the crude mitochondrial pellet in 2 ml of 15% Percoll, filter through a 70μm nylon filter, and layer onto the pre-formed gradient.
- Centrifuge at 30,750 g for 10 minutes at 4°C with slow acceleration and no brake.
- After centrifugation, collect the enriched mitochondrial band at the 24%/40% Percoll interface.
- Final Washing:
- Dilute the collected mitochondria with 6 ml of IM buffer and centrifuge at 16,750 g for 10 minutes.
- Wash the pellet again in IM buffer with 0.1% BSA and perform a final centrifugation at 7,000 g for 10 minutes.
- Resuspend the pure mitochondrial pellet in a suitable buffer (e.g., MAS) for immediate use or storage.
Quality Control Assay Protocols
This spectrophotometric assay determines the integrity of the mitochondrial outer membrane.
- Reagents: Cytochrome c oxidase assay kit, isolated mitochondria, 1 mM n-dodecyl β-D-maltoside (detergent), enzyme dilution buffer.
- Procedure:
- Prepare two samples of mitochondria (0.2 mg/mL): one in enzyme dilution buffer (control) and one in buffer containing detergent (permeabilized).
- Incubate on ice for 10 minutes.
- Add 20 µL of each sample to a cuvette containing 950 µL of assay buffer (10 mM Tris-HCl, 120 mM KCl, pH 7.0) and 80 µL of enzyme dilution buffer.
- Initiate the reaction by adding 50 µL of reduced ferrocytochrome c substrate.
- Immediately read the absorbance at 550 nm (A550) every 10 seconds for 45-60 seconds.
- Calculations:
- Plot A550 versus time and determine the maximum linear rate (ΔA550/s) for both the control and permeabilized samples.
- Calculate the percentage of mitochondria with an intact outer membrane as follows:
% Integrity = [1 - (Rate_control / Rate_detergent)] * 100%
This protocol assesses the bioenergetic function of isolated mitochondria.
- Reagents: 1X MAS buffer, Substrates (e.g., Pyruvate/Malate, Succinate), ADP, Oligomycin, FCCP, Antimycin A/Rotenone.
- Procedure:
- Mitochondrial Loading: Load 500 ng of isolated mitochondria per well into an XFe96 cell culture microplate. Centrifuge gently to adhere mitochondria to the well bottom.
- Injector Setup:
- Port A: 4 mM ADP (to induce State 3 respiration).
- Port B: 2 µg/mL Oligomycin (to inhibit ATP synthase, measure State 4o).
- Port C: 4 µM FCCP (to uncouple mitochondria, measure maximal respiration).
- Port D: 2 µM Antimycin A & 2 µM Rotenone (to inhibit ETC, measure non-mitochondrial respiration).
- Assay Run: Execute the standard Seahorse XF assay protocol, measuring the Oxygen Consumption Rate (OCR) after each injection.
- Data Analysis:
- Calculate the Respiratory Control Ratio (RCR) as
State 3 OCR (after ADP) / State 4o OCR (after Oligomycin). - A high RCR (e.g., >4 for skeletal muscle mitochondria [16]) indicates a high-quality, coupled preparation.
- Calculate the Respiratory Control Ratio (RCR) as
Workflow Visualization
The following diagram illustrates the sequential stages and integrated quality control checkpoints in the mitochondrial isolation process.
The Scientist's Toolkit: Key Research Reagents
The following table lists essential reagents and materials required for the successful isolation and quality control of mitochondria.
Table 2: Essential Research Reagents for Mitochondrial Isolation and QC
| Reagent/Material | Function / Application | Example / Specification |
|---|---|---|
| Percoll | Medium for density gradient centrifugation; separates mitochondria from contaminants based on buoyant density. | Discontinuous gradients (e.g., 15%, 24%, 40%) in Isolation Medium [16]. |
| Fatty Acid-Free BSA | Scavenges free fatty acids; prevents mitochondrial damage and uncoupling during isolation. | Added to wash buffers (e.g., 0.1-0.5%) [16]. |
| Nagarse (Protease) | Digests connective tissue in skeletal muscle to facilitate cell lysis and mitochondrial release. | 0.6 mg/mL in Isolation Medium, short incubation [16]. |
| Seahorse XF Analyzer | High-throughput platform for real-time measurement of mitochondrial oxygen consumption rate (OCR). | XFe96 Analyzer with specific substrate/inhibitor kits [16]. |
| Isolation Buffer (IM) | Provides ionic and osmotic support to preserve mitochondrial integrity during the isolation process. | Typically contains sucrose, MOPS, EGTA, pH 7.4 [16]. |
| MAS Buffer | Assay medium for respirometry; optimized for maintaining mitochondrial function during Seahorse assays. | 1X Mitochondrial Assay Solution [16]. |
| Anti-TOMM20 Antibody | Target for immuno-purification of highly purified intact mitochondria using magnetic beads. | For immunoisolation techniques [12]. |
| Cytochrome c Oxidase Assay Kit | Spectrophotometric determination of outer membrane integrity. | Commercial kit (e.g., Sigma-Aldrich) [54]. |
Assessing Purity and Function: Validation Methods and Technique Comparisons
Within the context of mitochondrial purification research, particularly methods utilizing density gradient centrifugation, confirming the success of an isolation procedure is a critical step. A preparation of high-purity, functional mitochondria is a prerequisite for reliable downstream analyses in metabolic studies, proteomics, and drug discovery. While assessment of mitochondrial function, for instance through respirometry, confirms biological activity, it does not unequivocally prove the absence of contaminating organelles. Marker enzyme analysis serves as a definitive method for quantitatively evaluating mitochondrial purity and identifying specific contaminants. This application note details the protocols for using these enzymatic assays to validate mitochondrial fractions isolated via density gradient centrifugation, providing researchers with a robust framework for quality control.
Mitochondrial Purification: Core Principles and Methods
The foundation of successful marker enzyme analysis is an effective mitochondrial purification strategy. Density gradient centrifugation remains a gold standard for separating mitochondria from other cellular components based on their unique buoyant densities.
Purification Methodologies
Density Gradient Centrifugation with Percoll: This method effectively separates mitochondria from contaminants like lysosomes, peroxisomes, and sarcoplasmic reticulum, which is crucial for skeletal muscle studies [11]. The protocol involves creating a discontinuous gradient, typically with layers of 40%, 24%, and 15% Percoll. The crude mitochondrial fraction is layered on top and centrifuged, resulting in a purified mitochondrial band at the interface of the 24% and 40% layers. This method yields mitochondria with a high respiratory control ratio (3.9–7.1), demonstrating both purity and functional integrity [11].
Immunoisolation with Anti-TOMM20 Antibody: For applications requiring extremely high purity, immunoaffinity techniques using magnetic beads conjugated with antibodies against outer mitochondrial membrane proteins, such as TOMM20, are highly effective. This method allows for the isolation of highly purified intact mitochondria directly from cells or tissues, minimizing co-isolation of other organelles [12].
Hypotonic Swelling Method: This technique, suitable for primary human skeletal myoblasts, combines differential centrifugation with a hypotonic swelling step to disrupt the plasma membrane while preserving nuclear and mitochondrial integrity. A subsequent purification in a hypertonic buffer yields mitochondrial fractions of high purity, as confirmed by Western blot analysis with organelle-specific markers [18].
Table 1: Comparison of Mitochondrial Isolation Methods
| Method | Principle | Advantages | Yield & Purity | Typical Source |
|---|---|---|---|---|
| Percoll Density Gradient | Buoyant density separation | High purity & functionality; removes organelles | ~200-400 μg protein from 100-200 mg tissue; high purity [11] | Tissues (e.g., skeletal muscle) [11] |
| Immunoaffinity (TOMM20) | Antibody-antigen binding | Extremely high purity; isolates intact organelles | High purity, lower yield; suitable for proteomics [12] | Cells & tissues [12] |
| Hypotonic Swelling | Osmotic lysis & centrifugation | High purity from limited cells; preserves function | High purity confirmed by Western blot [18] | Primary cells (e.g., myoblasts) [18] |
| Differential Centrifugation | Sequential g-force separation | Simple, fast | Moderate yield & purity; potential contamination [18] | Homogenized tissues/cells |
The following workflow illustrates a generalized process for mitochondrial purification and subsequent validation, integrating multiple methods described in the research:
Marker Enzyme Analysis: A Toolkit for Validation
Marker enzyme analysis measures the activity of enzymes that are highly enriched in specific organelles. By comparing the specific activity of these markers in the homogenate versus the purified mitochondrial fraction, one can calculate enrichment factors and identify contaminating organelles.
Key Marker Enzymes and Assays
Table 2: Essential Marker Enzymes for Assessing Mitochondrial Purity
| Contaminant Organelle | Marker Enzyme | Assay Principle & Method | Significance of Contamination |
|---|---|---|---|
| Cytosol | Lactate Dehydrogenase (LDH) | Spectrophotometric; monitors NADH oxidation during pyruvate-to-lactate conversion [18]. | Indicates cytosolic protein contamination or mitochondrial damage. |
| Plasma Membrane | 5'-Nucleotidase | Colorimetric; measures inorganic phosphate release from AMP. | Suggests presence of membrane fragments from other organelles. |
| Lysosomes | Acid Phosphatase / Cathepsin | Colorimetric; uses p-nitrophenyl phosphate as substrate at acidic pH. | Proteolytic and hydrolytic enzymes can degrade mitochondrial proteins. |
| Endoplasmic Reticulum | Glucose-6-Phosphatase / NADPH-Cytochrome c Reductase | Spectrophotometric; monitors cytochrome c reduction by NADPH. | Indicates contamination from major site of lipid & protein synthesis. |
| Peroxisomes | Catalase | Spectrophotometric; tracks decomposition of H₂O₂ at 240 nm. | Suggests presence of organelles involved in fatty acid oxidation. |
| Mitochondria (Matrix) | Citrate Synthase / Succinate Dehydrogenase | Spectrophotometric; citrate synthase reaction uses DTNB, measured at 412 nm [11]. | Positive Control: Confirms mitochondrial presence & enrichment. |
| Mitochondria (Inner Membrane) | Cytochrome c Oxidase | Spectrophotometric; monitors oxidation of reduced cytochrome c at 550 nm. | Positive Control: Validates functional inner membrane integrity. |
Detailed Experimental Protocol for Enzyme Assays
This protocol is designed for a 96-well plate format, enabling high-throughput analysis of multiple fractions.
A. Sample Preparation:
- Homogenate (H): Reserve a sample of the initial tissue or cell homogenate.
- Mitochondrial Fraction (M): Lyse purified mitochondria using a gentle detergent (e.g., 0.1% Triton X-100) in an appropriate buffer. Perform brief sonication on ice (e.g., 3 pulses of 10 seconds) to ensure complete lysis [18].
- Cytosolic Fraction (C - Optional): For a more complete analysis, retain the post-mitochondrial supernatant.
B. Protein Quantification:
- Determine the protein concentration of all samples (H, M, C) using a compatible assay (e.g., Bicinchoninic Acid (BCA) Assay). This is essential for calculating specific activity.
C. Lactate Dehydrogenase (LDH) Assay - Representative Protocol:
- Reaction Mix (per well):
- 50 µL Potassium Phosphate Buffer (50 mM, pH 7.5)
- 20 µL NADH (2.4 mM)
- 20 µL Sodium Pyruvate (10 mM)
- 10 µL Sample (H or M, diluted appropriately)
- Procedure:
- Add all components except pyruvate to the well.
- Incubate at 37°C for 2-3 minutes.
- Initiate the reaction by adding pyruvate.
- Immediately monitor the decrease in absorbance at 340 nm (for NADH consumption) for 3-5 minutes.
- Calculation:
- LDH Activity (mU/mL) = (ΔA₃₄₀/min × Total Reaction Volume × Dilution Factor) / (6.22 × Sample Volume)
- Specific Activity = Total LDH Activity (mU/mL) / Protein Concentration (mg/mL)
D. Citrate Synthase Assay - Mitochondrial Enrichment Control:
- Reaction Mix (per well):
- 50 µL Tris-HCl Buffer (100 mM, pH 8.0)
- 20 µL Acetyl CoA (0.1 mM)
- 20 µL DTNB (1 mM)
- 10 µL Sample (H or M, diluted)
- Procedure:
- Add all components except oxaloacetate.
- Incubate at 37°C for 2-3 minutes.
- Initiate the reaction by adding 10 µL Oxaloacetate (10 mM).
- Immediately monitor the increase in absorbance at 412 nm for 3-5 minutes.
- Calculation:
- Citrate Synthase Activity (mU/mL) = (ΔA₄₁₂/min × Total Reaction Volume × Dilution Factor) / (13.6 × Sample Volume)
- Specific Activity = Total Citrate Synthase Activity (mU/mL) / Protein Concentration (mg/mL)
E. Data Interpretation:
- Enrichment Factor (EF) = (Specific Activity in Mitochondrial Fraction) / (Specific Activity in Homogenate)
- A high EF (>2) for citrate synthase indicates successful mitochondrial enrichment.
- A low EF (close to 1 or less) for contaminant markers (LDH, etc.) indicates effective removal of that organelle. An EF >1 for a contaminant marker signifies its presence in the final preparation.
The Scientist's Toolkit: Essential Research Reagents
Table 3: Key Reagent Solutions for Mitochondrial Purification and Validation
| Reagent / Kit | Function / Application | Example Use in Protocol |
|---|---|---|
| Percoll | Silica nanoparticle solution for forming density gradients. | Creating discontinuous gradients (e.g., 15%/24%/40%) for organelle separation [11]. |
| Iodixanol | Inert, iso-osmotic density gradient medium. | Used in optimized density gradient ultracentrifugation protocols [55]. |
| Anti-TOMM20 Antibody | Specific marker for the mitochondrial outer membrane. | Conjugated to magnetic beads for immunoisolation of highly pure mitochondria [12]. |
| Fatty Acid-Free BSA | Prevents mitochondrial adhesion and absorbs free fatty acids. | Added to isolation and resuspension buffers to maintain mitochondrial integrity and function [11]. |
| Protease Inhibitor Cocktail | Suppresses proteolytic degradation of proteins. | Essential component of all isolation buffers to preserve the mitochondrial proteome for assays and omics [18]. |
| NADH / DTNB | Key cofactors/chromogens for spectrophotometric enzyme assays. | Used in LDH and Citrate Synthase assays, respectively, to track reaction progress [11]. |
| Seahorse XF Analyzer Kits | Pre-configured reagent kits for measuring mitochondrial respiration in live cells or isolated organelles. | For validating functional mitochondrial capacity after purification [11]. |
| Qproteome Mitochondria Isolation Kit | Commercial kit for standardized mitochondrial preparation. | Provides a reliable, manufacturer-optimized protocol for consistent isolations [18]. |
Marker enzyme analysis is an indispensable component of mitochondrial research, providing quantitative, objective data on the purity and quality of mitochondrial preparations. When integrated with density gradient centrifugation and functional assays like respirometry, it forms a comprehensive validation pipeline. This rigorous approach ensures that experimental results from downstream applications—whether in proteomics to study complexes like SLC25A45 [56], functional studies of oxidative phosphorylation [57], or drug screening—are reliable, reproducible, and accurately reflect mitochondrial biology, thereby strengthening the overall validity of scientific findings.
Within mitochondrial research, the purity and functional integrity of the isolated organelle are paramount for downstream assays. Density gradient centrifugation, particularly using Percoll, has emerged as a critical technique for achieving high-purity mitochondrial preparations from complex tissues like skeletal muscle and brain, minimizing contamination from other organelles such as lysosomes and sarcoplasmic reticulum [16]. This protocol details the application of this purification method for the subsequent precise assessment of two key functional parameters: the Respiratory Control Ratio (RCR) and the mitochondrial membrane potential (ΔΨm). These measurements are indispensable for evaluating mitochondrial bioenergetic health and are widely used in basic research and drug development, especially for screening compounds targeting metabolic diseases and neurodegenerative disorders [16] [58].
Quantitative Functional Benchmarks
The following table summarizes expected outcomes for functional parameters in mitochondria isolated via density gradient centrifugation, providing benchmarks for assessing preparation quality.
Table 1: Key Functional Parameters for Mitochondria Isolated via Density Gradient Centrifugation
| Parameter | Typical Value | Tissue/Cell Type | Significance & Context |
|---|---|---|---|
| RCR (with complex I substrates) | 3.9 - 7.1 [16] | Mouse skeletal muscle | A hallmark of coupled mitochondria; values >3 indicate well-coupled, functional preparations. |
| Mitochondrial Protein Yield (Percoll) | ~1-4 µg protein per mg fresh tissue [16] [13] | Mouse skeletal muscle, mouse hippocampus | Yield is tissue-dependent; sufficient for high-throughput respirometry and proteomics. |
| Synaptic Mitochondrial Yield (FMMS vs. UC) | 3x higher yield [13] | Mouse brain (hippocampus/cortex) | Magnetic separation (FMMS) offers superior yield from limited tissue compared to ultracentrifugation. |
| ΔΨm (in coupled state with ATP synthesis) | ~100-140 mV (in vivo), ~180-220 mV (isolated) [58] | Rat liver, rat heart | High ΔΨm in isolated mitochondria can be lowered to near-physiological levels by regulating matrix ATP/ADP ratio. |
Experimental Protocols
Mitochondrial Isolation via Percoll Density Gradient
This protocol is optimized for mouse skeletal muscle (e.g., quadriceps femoris) and ensures minimal contamination [16].
- Reagents Required: Isolation Medium (IM) buffer (e.g., 250 mM sucrose, 10 mM HEPES, 1 mM EGTA, pH 7.4), Nagarse (or other protease), Fatty acid-free BSA, Percoll.
- Step-by-Step Procedure:
- Tissue Harvest & Homogenization: Euthanize the mouse and rapidly dissect the target muscle. Mince the tissue finely with scissors in IM buffer containing Nagarse (e.g., 0.6 mg/ml) and incubate for 5-7 minutes at room temperature. Transfer the digested tissue to a Dounce homogenizer and homogenize with 10-12 strokes using a loose-fitting pestle.
- Differential Centrifugation: Centrifuge the homogenate at 1,000 g for 5 min at 4°C to pellet nuclei and cell debris. Collect the supernatant and centrifuge it at 21,000 g for 10 min at 4°C to pellet the crude mitochondrial fraction.
- Percoll Gradient Purification:
- Prepare a discontinuous gradient in a centrifuge tube. Gently layer 3.7 mL of 24% Percoll in IM buffer over 1.5 mL of 40% Percoll in IM buffer, maintaining a sharp interface.
- Resuspend the crude mitochondrial pellet in 2 mL of 15% Percoll, filter through a 70 μm nylon mesh, and carefully layer on top of the prepared gradient.
- Centrifuge at 30,750 g for 10 min at 4°C with slow acceleration and no brake.
- Mitochondrial Collection & Washing: After centrifugation, collect the enriched mitochondrial band at the interface between the 24% and 40% Percoll layers. Dilute this fraction with at least 3 volumes of IM buffer and centrifuge at 16,750 g for 10 min to wash. Resuspend the final pellet in an appropriate respiration or storage buffer (e.g., MAS buffer with BSA). Keep the preparation on ice and use for functional assays within 4 hours.
Assessment of Mitochondrial Respiration and RCR
Mitochondrial oxygen consumption can be measured using a Clarke-type oxygen electrode or a high-throughput platform like the Seahorse XFe96 Analyzer [16] [59].
- Reagents Required: Respiration buffer (e.g., 150 mM sucrose, 2.5 mM KH₂PO₄, 2 mM MgCl₂, 20 mM Tris/HCl, 0.1% BSA, pH 7.2), Substrates (e.g., 5 mM Pyruvate + 2.5 mM Malate for Complex I), 150 μM ADP, 2.5 μM Oligomycin, 0.5-4 μM FCCP.
- Step-by-Step Procedure:
- System Calibration: Calibrate the oxygen electrode according to the manufacturer's instructions.
- Mitochondrial Incubation: Add isolated mitochondria (e.g., 500 ng - 2 µg protein for Seahorse, 0.5-2 mg for a chamber system) to the respiration buffer at 37°C with continuous stirring.
- Substrate Addition: Add glutamate and malate (or succinate with rotenone) to initiate State 2 (non-phosphorylating) respiration.
- ADP Pulse: Add a known concentration of ADP (e.g., 150 μM) to induce State 3 (phosphorylating) respiration.
- Inhibitor Additions:
- After State 3 respiration, add the ATP synthase inhibitor oligomycin to induce State 4o (non-phosphorylating respiration after ADP depletion).
- Titrate the uncoupler FCCP to achieve maximum (uncoupled) respiration capacity.
- Data Analysis:
- State 3 Respiration: Oxygen consumption rate after ADP addition.
- State 4 Respiration: Oxygen consumption rate after ADP depletion (post-oligomycin).
- RCR Calculation: RCR = State 3 / State 4. An RCR value above 3.9 for skeletal muscle mitochondria indicates a high-quality, well-coupled preparation [16].
Simultaneous Measurement of Respiration and Membrane Potential
The ΔΨm can be measured concurrently with oxygen consumption using a TPP⁺ (tetraphenylphosphonium)-specific electrode [58] [59].
- Reagents Required: TPP⁺ chloride, Respiration buffer (as in 3.2), Calibration solutions of TPP⁺.
- Step-by-Step Procedure:
- Electrode Calibration: Calibrate the TPP⁺ electrode with sequential additions of known TPP⁺ concentrations (e.g., 0.4, 0.4, 0.8, 1.6 μM). At the end of each run, add FCCP to release all matrix TPP⁺ for baseline correction.
- Simultaneous Measurement: Place both oxygen and TPP⁺ electrodes in the reaction chamber containing mitochondria and respiration buffer. Follow the same substrate/inhibitor addition protocol as in section 3.2.
- Data Acquisition: Monitor the distribution of TPP⁺ between the medium and the mitochondrial matrix, which reflects the ΔΨm according to the Nernst equation. Matrix volume is assumed to be 2.0 μL × mg⁻¹ protein for calculations [59].
- Data Interpretation: A decrease in TPP⁺ in the medium (indicating uptake into mitochondria) corresponds to a higher (more negative) ΔΨm. In healthy, coupled mitochondria, the addition of ADP during State 3 respiration often causes a transient, moderate depolarization (decrease in ΔΨm) due to increased proton flux through ATP synthase, which is a normal response [58] [60].
Diagram 1: Mitochondrial isolation and functional assessment workflow.
The Scientist's Toolkit: Essential Research Reagents
Table 2: Key Reagents for Mitochondrial Isolation and Functional Assessment
| Reagent/Category | Specific Examples | Function & Application Notes |
|---|---|---|
| Density Gradient Media | Percoll | Forms inert, non-toxic gradients for high-purity organelle separation based on buoyant density. |
| Protease for Tissue Dissociation | Nagarse (Sigma P8038) | Enzymatically digests contractile proteins in skeletal muscle, facilitating the release of mitochondria. |
| Respiratory Substrates | Pyruvate, Malate, Glutamate, Succinate | Provide electrons to specific complexes of the electron transport chain (e.g., Malate/Pyruvate for CI). |
| Effectors & Inhibitors | ADP, Oligomycin, FCCP, Rotenone | Modulate mitochondrial bioenergetic states to measure RCR and probe specific ETC functions. |
| Membrane Potential Probe | TPP⁺ (Tetraphenylphosphonium) | Cationic dye distributed across the inner membrane according to ΔΨm; used with a selective electrode. |
| Fatty-Acid Free BSA | Sigma A6003 | Binds free fatty acids and contaminants, preserving mitochondrial integrity and function during isolation. |
Diagram 2: Key bioenergetic relationships and parameters.
Critical Interpretation of Functional Data
Accurate interpretation of RCR and ΔΨm data is crucial. The RCR is a robust, quantitative indicator of coupling quality—the mitochondria's ability to efficiently convert substrate oxidation into ATP synthesis. A low RCR suggests damaged or uncoupled mitochondria, often resulting from poor isolation techniques or a pathological state [16].
Interpreting ΔΨm requires caution. It is not a direct proxy for overall respiratory function. In coupled mitochondria, an increase in ATP demand (high ADP) can stimulate respiration while causing a slight depolarization (decrease in ΔΨm) due to increased proton flux through ATP synthase [60]. Conversely, inhibition of ATP synthase with oligomycin will hyperpolarize ΔΨm but simultaneously decrease oxygen consumption. Therefore, simultaneous measurement of both oxygen consumption and ΔΨm provides a far more powerful and accurate assessment of mitochondrial physiology than either parameter alone [59] [60]. Furthermore, researchers must be aware that fluorescent ΔΨm dyes, while convenient, are subject to artifacts and their signal intensity should not be simplistically equated with "mitochondrial health" without proper controls and calibration [60].
Within the broader context of mitochondrial purification research, establishing robust methods for evaluating structural integrity is paramount. Density gradient centrifugation, a cornerstone technique for isolating highly pure mitochondrial fractions, must be paired with rigorous validation to ensure that the isolated organelles retain their native morphological and functional characteristics [11]. This application note details integrated protocols for transmission electron microscopy (TEM) and fluorescent staining techniques, providing researchers with a comprehensive toolkit for the quantitative assessment of mitochondrial integrity post-purification. The methodologies outlined herein are designed to be applied after purification via techniques such as Percoll density gradient centrifugation, enabling scientists in both academic and drug development settings to confirm that their isolation procedures yield mitochondria that are not only pure but also structurally and functionally intact [11]. By combining high-resolution ultrastructural analysis with dynamic, quantitative fluorescence-based morphology assessment, this multi-modal approach offers a more complete picture of mitochondrial health and authenticity.
The following tables summarize key quantitative metrics essential for evaluating mitochondrial isolation and integrity.
Table 1: Mitochondrial Yield and Function Post-Percoll Purification
| Parameter | Value or Range | Measurement Context |
|---|---|---|
| Protein Yield | ~200–400 µg | From 100-200 mg fresh mouse quadriceps femoris muscle [11] |
| Preparation Time | 3–4 hours | From tissue harvest to quantified mitochondrial isolation [11] |
| Optimal Input for Respirometry | 500 ng | For Seahorse XFe96 Analyzer [11] |
| Respiratory Control Ratio (RCR) | 3.9 to 7.1 | Indicative of high functionality with various substrates [11] |
Table 2: Key Parameters for Quantitative Mitochondrial Morphology Analysis
| Parameter | Description | Application Example |
|---|---|---|
| Analysis Scale | From solitary organelles to population-level clusters in single cells [61] | High-content screening (HCS) for toxicology (MITOMATICS pipeline) [61] |
| Number of Morphological Descriptors | 104 shape descriptors in advanced software (MitoRadar) [61] | Generating specific 'mito-signatures' to predict cellular state [61] |
| Key Endpoints | Average length, width, spatial density, and intracellular localization [62] | Objective characterization of morphology from fluorescent images [62] |
| Consistency | High (R ≥ 0.74 for localization, R ≥ 0.89 for other endpoints) [62] | Ensures reliable detection of subtle, consistent morphological changes [62] |
Experimental Protocols
Mitochondrial Purification via Percoll Density Gradient Centrifugation
This protocol yields highly purified and functional mitochondria from mouse skeletal muscle, suitable for subsequent structural integrity evaluation [11].
- Tissue Harvest and Homogenization: Euthanize the mouse and rapidly dissect the quadriceps femoris muscle. Remove connective and adipose tissue. Mince the tissue finely with scissors in 0.5 mL of IM Buffer (e.g., 100 mM KCl, 50 mM MOPS, 1 mM EGTA, 5 mM MgSO4, 1 mM ATP, pH 7.4) containing Nagarse (0.6 mg/mL). Incubate for 5 minutes at room temperature. Add an additional 0.5 mL of IM Buffer/Nagarse and homogenize the mixture using a Dounce tissue grinder with a loose-fitting pestle (10 strokes). Add more IM buffer and perform 1-3 additional strokes [11].
- Differential Centrifugation: Transfer the homogenate to a centrifuge tube and bring the volume to approximately 7 mL with IM Buffer supplemented with 0.5% fatty acid-free BSA. Centrifuge at 1,000 g for 5 minutes at 4°C to pellet nuclei and debris. Carefully collect the supernatant, avoiding the flocculent layer above the pellet. Resuspend the pellet in 4 mL of IM Buffer, vortex briefly, and repeat the centrifugation. Pool the supernatants and centrifuge at 21,000 g for 10 minutes at 4°C. Discard the resulting supernatant [11].
- Percoll Gradient Purification: Resuspend the crude mitochondrial pellet in 2 mL of 15% Percoll in IM Buffer. Filter this suspension through a pre-wetted 70 µm nylon filter. Prepare a discontinuous gradient in a 10 mL polycarbonate tube by layering 3.7 mL of 24% Percoll in IM Buffer over 1.5 mL of 40% Percoll in IM Buffer, maintaining a sharp interface. Carefully layer the filtered mitochondrial suspension (in 15% Percoll) on top of the gradient. Centrifuge at 30,750 g for 10 minutes at 4°C with slow acceleration and no brake [11].
- Mitochondrial Collection and Washing: After centrifugation, collect the enriched mitochondrial fraction located at the interface between the 24% and 40% Percoll layers. Transfer this fraction to a new tube and add at least 6 mL of IM Buffer. Centrifuge at 16,750 g for 10 minutes at 4°C. Discard the supernatant, resuspend the pellet in 1 mL of IM Buffer with 0.5% BSA, and add another 4 mL of IM Buffer with 0.1% BSA. Centrifuge at 7,000 g for 10 minutes. Perform a final wash in IM Buffer without BSA if required for downstream applications. Resuspend the final purified mitochondrial pellet in an appropriate buffer (e.g., 1X MAS) for immediate use or storage [11].
Correlative Immunofluorescence and TEM (iCLEM) for Ultrastructural Analysis
This protocol leverages the Tokuyasu cryo-preparation method to preserve antigenicity for high-quality immunofluorescence followed by high-resolution TEM, ideal for identifying specific mitochondrial proteins within their ultrastructural context [63].
- Sample Preparation and Fixation: Fix tissue samples (e.g., small pieces of zebrafish brain or mammalian tissue) in 4% formaldehyde, or a mixture of 4% formaldehyde and 0.1% glutaraldehyde, for several hours. For cells, culture them on suitable substrates and fix similarly [63].
- Cryo-Embedding and Sectioning: Infuse the fixed tissue with 2.3 M sucrose for cryoprotection and embed the samples in gelatin. Mount the samples on metal pins and freeze in liquid nitrogen. Using a cryo-ultramicrotome, cut semithin (200-300 nm) or ultrathin (70 nm) sections. Collect semithin sections on the surface of Ibidi chambers for iCLEM-SEM or ultrathin sections on Formvar-coated EM grids for iCLEM-TEM [63].
- Immunolabeling: For sections on Ibidi chambers or EM grids, perform immunofluorescent staining by applying a blocking solution (e.g., 10% fetal bovine serum in PBS), followed by incubation with a primary antibody (e.g., anti-TOMM20 for mitochondria, anti-GS for radial-glial cells) diluted in a blocking buffer. After washing, incubate with a fluorophore-conjugated secondary antibody (e.g., Alexa Fluor 488) [63].
- Fluorescence Imaging and Correlation: Acquire fluorescence images of the immunolabeled sections to identify regions of interest (e.g., cells with specific mitochondrial markers). For sections on EM grids, this can be done using an integrated correlative microscope or a separate fluorescence microscope, noting coordinates for later correlation [64] [63].
- TEM Staining and Imaging: After fluorescence imaging, stain the sections on EM grids with heavy metal stains: first with uranyl acetate (e.g., 2% in water) and then with lead citrate. For semithin sections on Ibidi chambers, they can be post-fixed, dehydrated, and embedded in resin before being re-sectioned and stained for TEM. Image the identified regions of interest using a TEM at various magnifications to resolve ultrastructural details [63] [65].
Quantitative Analysis of Mitochondrial Morphology from Fluorescent Images
This protocol describes a software-based method for the objective and quantitative assessment of mitochondrial morphology in live or fixed cells, which can be applied to assess stress responses or the effects of drug treatments [62].
- Cell Staining and Imaging: Culture and treat cells in a 96-well black polystyrene microplate. For live-cell imaging, stain mitochondria with 250 nM MitoTracker Deep Red FM and nuclei with 2.5 µg/mL Hoechst 33342 for 30 minutes at 37°C. Optionally, counterstain the plasma membrane. Acquire high-resolution confocal images using a system like the Opera Phenix with a 63x water immersion lens. Acquire multiple fields per well to ensure a robust sample size [61].
- Image Import and Preprocessing: Import the fluorescence images into analysis software (e.g., MitoRadar, or custom ImageJ plugins). Use a data handling module to assign images to their respective experimental groups (e.g., control vs. treated) [61] [62].
- Segmentation and Feature Extraction: Use a segmentation module, which may employ deep learning or other advanced algorithms, to accurately identify and outline individual mitochondria and cells within the images [61]. The software will then extract a wide array of morphological descriptors (e.g., length, width, area, perimeter, branching, network interconnectivity) for each detected mitochondrion [61] [62].
- Data Analysis and Interpretation: The software compiles the extracted features to generate average values per condition (e.g., mean mitochondrial length) or complex "mito-signatures" represented by radar charts. Use statistical analyses to compare these quantitative endpoints between control and experimental groups to identify significant morphological shifts indicative of changes in cellular health [61] [62].
Workflow and Pathway Visualizations
The Scientist's Toolkit: Research Reagent Solutions
Table 3: Essential Reagents for Mitochondrial Integrity Evaluation
| Reagent Solution | Function | Application Note |
|---|---|---|
| Percoll | Forms a density gradient for the separation of mitochondria from contaminating organelles [11]. | Ensures high sample purity essential for reliable proteomics and bioenergetics [11]. |
| Anti-TOMM20 Antibody | Immuno-labeling of the outer mitochondrial membrane for identification and immunoisolation [12]. | Used in immuno-EM (iCLEM) to correlate fluorescence with ultrastructure and for immuno-purification [12] [63]. |
| MitoTracker Deep Red FM | A cell-permeant fluorescent dye that accumulates in active mitochondria [61]. | Enables live-cell imaging of mitochondrial networks for high-content morphological screening [61]. |
| Uranyl Acetate & Lead Citrate | Heavy metal stains that provide electron density and contrast for TEM imaging [65]. | Essential for visualizing the detailed ultrastructure of mitochondrial cristae and membranes [65]. |
| Nagarse (Protease) | Digests contractile proteins in muscle tissue to facilitate homogenization and mitochondrial release [11]. | Critical for achieving high yields from tough tissues like skeletal muscle [11]. |
| Seahorse XF Assay Reagents | Include substrates (e.g., pyruvate, succinate), inhibitors (e.g., oligomycin, FCCP), and rotentone to probe mitochondrial respiratory function [11]. | Directly measures functionality (e.g., RCR) of isolated mitochondria, confirming physiological relevance [11]. |
Mitochondrial purification is a foundational technique in biomedical research, enabling the study of organelle function, dysfunction, and therapeutic applications. Density gradient centrifugation has long been the benchmark method for obtaining high-purity mitochondrial fractions. However, emerging technologies including immunoisolation and microfluidic sorting present compelling alternatives with unique advantages for specific research and clinical applications. This application note provides a comparative analysis of these three core methodologies, presenting quantitative performance data and detailed protocols to guide researchers in selecting the optimal approach for their experimental requirements. The framework is particularly designed for drug development professionals and research scientists requiring high-quality mitochondrial preparations for functional analysis, proteomics, and therapeutic development.
Comparative Performance Analysis
The following tables summarize key performance metrics for density gradient, immunoisolation, and microfluidic mitochondrial isolation methods, based on current literature.
Table 1: Quantitative Outcomes of Mitochondrial Isolation Methods
| Performance Metric | Density Gradient Centrifugation | Immunoisolation | Microfluidic Sorting |
|---|---|---|---|
| Isolation Principle | Density-based separation via centrifugation [11] | Antibody-based affinity capture (e.g., anti-TOMM20) [12] | Inertial sorting or mechanical lysis in microchannels [66] [67] |
| Sample Throughput | High (suitable for larger tissue samples) [11] | Moderate | Low to Moderate (ideal for small-scale samples) [66] |
| Purity | High (minimal organelle contamination) [11] | Very High (specific immunocapture) [12] | High (above 93.7%) [67] |
| Membrane Integrity/Functionality | High Respiratory Control Ratio (RCR: 3.9-7.1) [11] | Preserved (assessed by membrane potential) [12] | High (retained normal activity and morphology) [67] |
| Typical Yield | ~200-400 µg protein from 100-200 mg tissue [11] | Information Not Available in Search Results | Similar to conventional kits [67] |
| Relative Processing Speed | Moderate (3-4 hours) [11] | Information Not Available in Search Results | Fast (rapid, continuous processing) [66] |
Table 2: Methodological Advantages and Limitations
| Method | Key Advantages | Key Limitations |
|---|---|---|
| Density Gradient Centrifugation | High purity and yield; maintains respiratory proficiency; well-established protocol [11] | Time-consuming; requires ultracentrifuge; potential for mechanical stress |
| Immunoisolation | Exceptional specificity and purity; targets specific mitochondrial populations [12] | Higher cost (antibodies); potential for antibody-mediated functional impact |
| Microfluidic Sorting | Rapid, chemical-free processing; high functionality retention; ideal for small samples [66] [67] | Lower throughput; specialized equipment required; relatively new technology |
Detailed Experimental Protocols
Density Gradient Centrifugation with Percoll
This protocol is adapted from established methods for isolating functional mitochondria from mouse skeletal muscle [11].
Reagents Required:
- IM Buffer (e.g., containing Mannitol, Sucrose, HEPES, EGTA)
- Percoll Solutions (15%, 24%, and 40% in IM Buffer)
- Fatty acid-free BSA
- Nagarse protease
- 1X MAS Buffer
Procedure:
- Tissue Preparation: Excise and mince ~100-200 mg of fresh skeletal muscle (e.g., quadriceps femoris) in ice-cold IM buffer containing Nagarse (0.6 mg/ml) and incubate for 5 minutes at room temperature.
- Homogenization: Transfer the digested tissue to a Dounce homogenizer and homogenize with 10 strokes using a loose-fitting pestle.
- Differential Centrifugation:
- Centrifuge the homogenate at 1,000 × g for 5 min at 4°C to remove nuclei and cell debris.
- Collect the supernatant and centrifuge at 21,000 × g for 10 min at 4°C to pellet the crude mitochondrial fraction.
- Density Gradient Purification:
- Resuspend the crude mitochondrial pellet in 2 ml of 15% Percoll and filter through a 70 µm nylon filter.
- Carefully layer this suspension on top of a pre-formed discontinuous gradient consisting of 3.7 ml of 24% Percoll layered over 1.5 ml of 40% Percoll in a centrifuge tube.
- Centrifuge at 30,750 × g for 10 min at 4°C with slow acceleration and no brake.
- Mitochondrial Collection: After centrifugation, collect the purified mitochondrial fraction located at the interface between the 24% and 40% Percoll layers.
- Washing: Dilute the collected fraction with IM buffer and centrifuge at 16,750 × g for 10 min. Wash the resulting pellet once more in IM buffer with BSA, and perform a final resuspension in MAS buffer for immediate functional analysis [11].
The workflow for this protocol is illustrated below.
Immunoisolation with Magnetic Beads
This protocol outlines the use of antibody-conjugated magnetic beads for high-purity mitochondrial isolation [12].
Reagents Required:
- Anti-TOMM20 Antibody (or other outer mitochondrial membrane protein target)
- Magnetic Beads (e.g., epoxy-activated or tosylactivated magnetic beads)
- Coupling Buffer
- Blocking Buffer
- Lysis Buffer (for preparing crude cell lysate)
Procedure:
- Bead Preparation: Covalently conjugate anti-TOMM20 antibody to magnetic beads according to the bead manufacturer's protocol. Block remaining active sites with an appropriate blocking agent.
- Sample Preparation: Harvest and lyse cells using a gentle, hypotonic lysis buffer to release intracellular organelles. A pre-clearing centrifugation step (e.g., 1,000 × g) can be performed to remove nuclei and unbroken cells.
- Immunoaffinity Incubation: Incub the crude mitochondrial supernatant with the antibody-conjugated magnetic beads for 30-60 minutes with gentle agitation at 4°C.
- Magnetic Separation: Place the tube on a magnetic stand to capture the beads. Carefully remove and discard the supernatant.
- Washing: Wash the bead-bound mitochondria several times with an appropriate isotonic buffer to remove non-specifically bound contaminants.
- Elution (Optional): The purified mitochondria can be used directly in downstream applications while bound to the beads, or eluted using a gentle, competitive elution method [12].
Microfluidic Sorting
This protocol describes a chemical-free, inertia-based method for isolating functional mitochondria from a small number of cells [66] [67].
Reagents Required:
- Hypo-osmotic Lysis Buffer
- Hypertonic Homogenization Buffer (for osmotic pressure reconstruction)
- Cell Culture Suspension
Procedure:
- Device Fabrication: Fabricate a PDMS-based microfluidic device via soft lithography, featuring a microchannel system designed for cell breakage [67].
- Cell Preparation: Harvest and swell cells in a hypo-osmotic lysis buffer on ice for 15 minutes.
- Microfluidic Processing: Load the cell suspension into a syringe and inject it into the microfluidic device at a controlled flow rate (e.g., 5 mL/h). The shear stress within the microchannels disrupts the cell membranes, releasing intracellular contents.
- Mitochondrial Reconstruction: Immediately collect the output homogenate and add a hypertonic homogenization buffer to reconstruct the mitochondrial osmotic environment.
- Concentration: Centrifuge the homogenate at low speed (e.g., 3,000 × g) to remove large debris. Then, centrifuge the resulting supernatant at high speed (e.g., 17,000 × g) to pellet the mitochondria [67]. The mitochondrial pellet is then resuspended in a suitable preservation buffer.
The conceptual process of microfluidic sorting is shown below.
The Scientist's Toolkit: Essential Research Reagents
Table 3: Key Reagent Solutions for Mitochondrial Isolation and Analysis
| Reagent / Kit | Primary Function | Example Application / Note |
|---|---|---|
| Percoll | Density gradient medium for purification of organelles based on buoyant density [11]. | Used in discontinuous gradients to separate mitochondria from contaminants like lysosomes and peroxisomes. |
| Anti-TOMM20 Antibody | Target for immunocapture of mitochondria via the outer membrane translocase complex [12]. | Conjugated to magnetic beads for high-specificity isolation. |
| Magnetic Beads | Solid phase for antibody conjugation and magnetic separation [12]. | Enable selective pulldown and washing of mitochondrial complexes. |
| JC-1 Dye | Fluorescent probe for assessing mitochondrial membrane potential and integrity [68]. | Aggregate formation (red fluorescence) vs. monomer (green) indicates high vs. low membrane potential. |
| DCFH-DA | Cell-permeable probe for detecting general reactive oxygen species (ROS) [68]. | Measures mitochondrial activity via H₂O₂ production; non-fluorescent until oxidized. |
| Seahorse XF Analyzer Buffers | Specialized media for high-throughput respirometry of isolated mitochondria [11]. | Contains specific substrates/inhibitors (e.g., ADP, Oligomycin, FCCP, Rotenone) to probe electron transport chain function. |
The choice of mitochondrial isolation method is critical and should be dictated by the specific goals of the research or application. Density gradient centrifugation remains the gold standard for balancing high yield, purity, and functionality from substantial tissue samples. When exceptional specificity and purity are paramount, and cost is less prohibitive, immunoisolation is the superior choice. For projects involving very small sample sizes or requiring rapid, chemical-free processing while maintaining high functionality, microfluidic technologies represent a powerful and emerging alternative. Researchers must weigh these factors—throughput, purity, yield, functionality, and technical requirements—to select the most appropriate methodology for their mitochondrial purification needs.
In mitochondrial research, the isolation of pure organelles is a critical prerequisite for generating reliable and reproducible data. Density gradient centrifugation is a widely employed method for mitochondrial purification, designed to separate organelles based on their buoyant density [1]. However, even the most meticulous isolation protocols can result in preparations contaminated by other subcellular components, such as lysosomes, peroxisomes, and endoplasmic reticulum fragments [1] [69]. The presence of these contaminants can significantly confound the interpretation of downstream analyses, from biochemical assays to omics studies.
Mass spectrometry (MS)-based proteomics has emerged as a powerful and objective tool for quantitatively assessing the purity of mitochondrial samples [70] [71] [69]. Unlike traditional methods that rely on the activity or presence of a single or limited number of markers, proteomics provides a comprehensive, untargeted snapshot of the entire protein composition of a sample. This allows for the precise quantification of both mitochondrial and non-mitochondrial proteins, offering an unambiguous measure of isolation efficacy. This application note details the protocols and methodologies for employing mass spectrometry to validate mitochondrial sample purity within the broader context of a research thesis on density gradient centrifugation, providing researchers with a framework for ensuring the integrity of their mitochondrial preparations.
Quantitative Assessment of Purity Using Proteomic Data
The core of the proteomic validation strategy lies in the quantitative analysis of the proteins identified in the sample. By comparing the spectral data against a curated mitochondrial protein database, researchers can compute a Mitochondrial Enrichment Factor (MEF), a quantitative metric for sample purity.
A study systematically evaluating mitochondrial isolations from various mouse tissues exemplifies this approach. The researchers isolated mitochondria from brown adipose tissue (BAT), heart, kidney, and liver via differential centrifugation and analyzed them using label-free nanoLC-MS/MS. The resulting proteomic data was searched against the MitoCarta database (a comprehensive inventory of mitochondrial proteins) and the entire mouse proteome. The MEF was calculated as the summed abundance of all MitoCarta-positive proteins divided by the total protein abundance (mitochondrial + non-mitochondrial) [69].
Table 1: Mitochondrial Purity and Citrate Synthase Activity Across Mouse Tissues
| Tissue | Mitochondrial Enrichment Factor (MEF) | Citrate Synthase Activity (nmol/min/mg) | Correlation between CS and MEF |
|---|---|---|---|
| Brown Adipose (BAT) | > 90% | ~1200 | Not Significant |
| Heart | > 90% | ~1000 | Not Significant |
| Kidney | ~80% | ~400 | Not Significant |
| Liver | ~65% | ~120 | Significant |
| Skeletal Muscle | Not Reported | Strong Correlation [69] | Established Biomarker [69] |
The data in Table 1 reveals several critical points. First, mitochondrial purity can vary substantially across different tissues, with liver isolations showing significantly higher contamination (~35% non-mitochondrial protein) compared to BAT or heart [69]. Second, it highlights the limitation of single-marker assays. While citrate synthase (CS) activity is a well-established biomarker for mitochondrial content in skeletal muscle, the study found it was not a reliable marker of purity across diverse tissues. Except for liver, CS activity did not correlate with the empirically determined MEF, underscoring the need for comprehensive proteomic assessment, especially when working with new or disease-state tissues [69].
Furthermore, the study attempted to identify individual proteins whose expression universally correlated with MEF across all tissues. No single protein was significantly correlated with mitochondrial enrichment in all four tissues analyzed, reinforcing that a multi-protein, proteomic approach is superior for accurate purity assessment [69].
Experimental Protocol for Purity Assessment
The following protocol describes the process for preparing mitochondrial samples for mass spectrometric analysis to determine purity.
Sample Preparation for Mass Spectrometry
Materials & Reagents:
- Isolated mitochondrial pellet (from density gradient centrifugation)
- Lysis buffer (e.g., RIPA buffer or 1% SDS in Tris-HCl)
- Protease inhibitors
- Bicinchoninic acid (BCA) Protein Assay Kit
- Reducing agent (e.g., dithiothreitol - DTT)
- Alkylating agent (e.g., iodoacetamide)
- Trypsin (sequencing grade)
- Solid-phase extraction cartridges for clean-up (e.g., C18)
Procedure:
- Protein Extraction: Suspend the isolated mitochondrial pellet in a suitable lysis buffer supplemented with protease inhibitors. Lyse the mitochondria by sonication or repeated passage through a fine-gauge needle. Incubate on ice for 30 minutes.
- Protein Quantification: Clarify the lysate by centrifugation at high speed (e.g., 14,000 x g for 15 min at 4°C). Transfer the supernatant to a new tube and determine the protein concentration using the BCA assay.
- Protein Digestion: Aliquot a specific amount of protein (e.g., 50 µg) for digestion. First, reduce disulfide bonds with 5 mM DTT for 30 minutes at 60°C, then alkylate with 15 mM iodoacetamide for 30 minutes at room temperature in the dark. Digest the proteins into peptides using trypsin (typically at a 1:50 enzyme-to-protein ratio) overnight at 37°C.
- Peptide Clean-up: Acidify the digested peptide mixture with trifluoroacetic acid (TFA) to a pH < 3. Desalt and purify the peptides using C18 solid-phase extraction cartridges according to the manufacturer's instructions. Dry the purified peptides under vacuum and reconstitute them in a mass spectrometry-compatible solvent (e.g., 0.1% formic acid) for LC-MS/MS analysis.
Liquid Chromatography and Tandem Mass Spectrometry (nLC-MS/MS)
Instrumentation:
- Nanoflow Liquid Chromatography (nLC) system coupled to a high-resolution tandem mass spectrometer (e.g., Orbitrap, timsTOF, ZenoTOF).
Procedure:
- Chromatographic Separation: Inject the reconstituted peptide sample onto a C18 reversed-phase nanoLC column. Separate the peptides using a gradient of increasing organic solvent (e.g., acetonitrile from 2% to 35%) over 60-120 minutes.
- Mass Spectrometric Analysis: Operate the mass spectrometer in data-dependent acquisition (DDA) or data-independent acquisition (DIA) mode.
- In DDA mode, the MS1 survey scan is followed by the selection and fragmentation of the most intense precursor ions for MS/MS analysis.
- In DIA mode, all precursors within a defined m/z window are systematically fragmented, providing a more comprehensive and reproducible data set [72].
Data Processing and Purity Calculation
Software & Databases:
- Proteomic search software (e.g., MaxQuant, Spectronaut, DIA-NN)
- Protein sequence database (e.g., UniProt for your species)
- Curated mitochondrial protein database (e.g., MitoCarta 2.0/3.0)
Procedure:
- Database Search: Process the raw MS/MS data using proteomic software to identify and quantify peptides and proteins. Search the data against a combined protein sequence database that includes the species-specific proteome and common contaminants.
- MitoCarta Filtering: Cross-reference the identified protein list with the MitoCarta database to classify proteins as mitochondrial or non-mitochondrial.
- Calculate MEF: Calculate the Mitochondrial Enrichment Factor using the quantitative data. With label-free quantification, this is typically done using the Top3 or iBAQ intensity.
MEF = (Sum of Intensities of MitoCarta Proteins) / (Sum of Intensities of All Identified Proteins) * 100
Diagram 1: Workflow for MS-based mitochondrial purity assessment.
The Scientist's Toolkit: Research Reagent Solutions
Table 2: Essential Reagents and Kits for Mitochondrial Proteomic Purity Assessment
| Item | Function/Description | Example Use in Protocol |
|---|---|---|
| Anti-TOMM22 / TOMM20 Antibody | Target for immunocapture of intact mitochondria, enriching for organelles prior to lysis. | Coated onto magnetic beads for immunoaffinity purification of mitochondria from homogenates [73] [12]. |
| MitoCarta Database | Curated inventory of mitochondrial proteins; used as a reference for classifying identified proteins. | Used in data analysis to filter identified proteins and calculate the Mitochondrial Enrichment Factor (MEF) [69]. |
| Density Gradient Media (e.g., Sucrose, Percoll, Nycodenz, Iodixanol) | Forms a density barrier for the separation of cellular components during initial mitochondrial isolation. | Used in the primary purification of mitochondria from crude cellular homogenates via density-gradient centrifugation [1] [74]. |
| Trypsin, Sequencing Grade | High-purity protease that digests proteins into peptides for mass spectrometric analysis. | Used in-solution to digest purified mitochondrial proteins into peptides for LC-MS/MS analysis [69]. |
| Comprehensive QC System (e.g., MSCohort) | Software tool that extracts multiple QC metrics to evaluate the quality of proteomics data. | Assesses the robustness and reproducibility of the DIA or DDA MS data generated from mitochondrial samples [72]. |
Integrating mass spectrometry-based proteomic validation into mitochondrial research workflows provides an indispensable layer of quality control. Moving beyond assumptions and single-marker assays, this method offers a quantitative, comprehensive, and objective measure of sample purity through the calculation of a Mitochondrial Enthancement Factor. The detailed protocol outlined herein—from sample preparation and LC-MS/MS analysis to data interpretation—empowers researchers to critically evaluate their mitochondrial isolations following density gradient centrifugation. Adopting this rigorous approach is fundamental for ensuring the integrity of downstream functional, biochemical, and omics analyses, thereby strengthening the conclusions drawn in biomedical research and drug development.
Conclusion
Density gradient centrifugation remains a cornerstone technique for mitochondrial purification, offering robust separation of functional organelles across diverse biological sources from human tissues to extremophile plants. The methodology continues to evolve with optimized protocols for challenging samples and integration with advanced validation techniques. Future directions point toward increasing automation through microfluidic technologies, enhanced specificity via immunoisolation approaches, and application in emerging fields including cancer stem cell research and mitochondrial transplantation therapy. As mitochondrial dysfunction becomes increasingly recognized in disease pathogenesis, refined purification techniques will play a pivotal role in drug discovery, disease modeling, and ultimately, the development of mitochondrial-targeted therapeutics. The continued innovation in purification and validation methodologies will enable more precise investigations into mitochondrial biology and its clinical applications.
References
- 1. of a crude Purification fraction by mitochondrial - density ... gradient [https://pubmed.ncbi.nlm.nih.gov/18228356/]
- 2. Density Gradient - an overview [https://www.sciencedirect.com/topics/immunology-and-microbiology/density-gradient]
- 3. 线粒体分离:一种从人卵巢癌组织样本中分离线粒体的技术 [https://www.jove.com/cn/v/30015/mitochondrial-isolation-technique-to-isolate-mitochondria-from-human]
- 4. Mitochondrial Purification via Percoll Gradient from Adherent ... [https://biostat.duke.edu/mitochondrial-purification-percoll-gradient-adherent-cells-grown-culture]
- 5. Limitations in the quantitative separation of DNA samples ... [https://link.springer.com/content/pdf/10.1007/BF01897630.pdf]
- 6. Establishment of a low-temperature immersion method for extracting... [https://plantmethods.biomedcentral.com/articles/10.1186/s13007-025-01419-z]
- 7. Mitochondrial purification protocol for western blot [https://www.abcam.com/en-us/technical-resources/protocols/mitochondrial-purification-for-western-blot]
- 8. Isolation of mitochondria from cells and tissues - PMC [https://pmc.ncbi.nlm.nih.gov/articles/PMC8530414/]
- 9. Purity matters: A workflow for the valid high-resolution lipid ... [https://www.nature.com/articles/srep21107]
- 10. Purification of skeletal-muscle mitochondria by density- ... [https://experts.umn.edu/en/publications/purification-of-skeletal-muscle-mitochondria-by-density-gradient-/]
- 11. Purification of functional mouse skeletal muscle mitochondria ... [https://bmcresnotes.biomedcentral.com/articles/10.1186/s13104-023-06519-4]
- 12. Innovative methods for isolating highly purified ... [https://www.sciencedirect.com/science/article/pii/S2590279224000105]
- 13. Fractionated mitochondrial magnetic separation for ... [https://www.nature.com/articles/s41598-019-45568-3]
- 14. An Improved Method for Preparation of Uniform and ... [https://www.xiahepublishing.com/2310-8819/JCTH-2018-00064]
- 15. Purification of functional mouse skeletal muscle ... [https://pubmed.ncbi.nlm.nih.gov/37503222/]
- 16. Purification of functional mouse skeletal muscle ... [https://pmc.ncbi.nlm.nih.gov/articles/PMC10544150/]
- 17. Subcellular Fractionation [https://www.labome.com/method/Subcellular-Fractionation.html]
- 18. Hypotonic Swelling Method for the Isolation of Pure ... [https://pmc.ncbi.nlm.nih.gov/articles/PMC11745819/]
- 19. Differential centrifugation [https://en.wikipedia.org/wiki/Differential_centrifugation]
- 20. Type of Centrifugation : Differential & Density Gradient [https://uberstrainer.com/an-overview-of-differential-centrifugation-and-density-gradient-centrifugation/?srsltid=AfmBOootq6d7qbC4OGcIwmHUlGkEySGFmRJ2RvlrYarX97PUE0oxeBRz]
- 21. Guidelines for an optimized differential centrifugation of cells [https://pmc.ncbi.nlm.nih.gov/articles/PMC10709023/]
- 22. Differential Centrifugation - an overview [https://www.sciencedirect.com/topics/agricultural-and-biological-sciences/differential-centrifugation]
- 23. Mitochondrial Sub-fractionation Using Differential ... [https://www.protocols.io/view/mitochondrial-sub-fractionation-using-differential-d5ne85be.html]
- 24. The isolation by isopycnic density-gradient centrifugation of ... [https://pmc.ncbi.nlm.nih.gov/articles/PMC1179050/]
- 25. Percoll Gradient Centrifugation: What to consider when ... [https://labsup.net/blogs/blog/percoll-gradient-centrifugation-what-to-consider-when-isolating-cells-subcellular-particles-and-virus?srsltid=AfmBOorG-rnrJhZ_cbFyE6Fe2mcfugP5HqdPbg1LPrxGpAbWYPjaf_vl]
- 26. Isolation of Mitochondria from Murine Skeletal Muscle - PMC [https://pmc.ncbi.nlm.nih.gov/articles/PMC12145866/]
- 27. Density Gradient Centrifugation: Principle and Applications [https://uberstrainer.com/density-gradient-centrifugation-principle-and-applications/?srsltid=AfmBOopKq5-ZTKl9VaIiEJh-eItN55pd-BgLX45O_RXRL4OV6rCZrRKY]
- 28. Isolation of large amounts of highly pure mitochondria for “ ... [https://link.springer.com/article/10.1134/S0006297918010108]
- 29. Biotechnological approaches and therapeutic potential of ... [https://www.nature.com/articles/s41467-025-61239-6]
- 30. Life on the dry side: a roadmap to understanding ... [https://www.nature.com/articles/s41467-025-58656-y]
- 31. Isolation and comparative proteomic analysis of ... [https://www.nature.com/articles/s41438-021-00470-w]
- 32. and Cryo-electron Microscopy Analysis of Purification ... Plant [https://bio-protocol.org/en/bpdetail?id=4111&type=0]
- 33. Isolation of Intact Mitochondria from Skeletal Muscle by ... [https://pmc.ncbi.nlm.nih.gov/articles/PMC5408903/]
- 34. Rapid isolation of respiring skeletal muscle mitochondria ... [https://www.frontiersin.org/journals/physiology/articles/10.3389/fphys.2023.1114595/full]
- 35. Mitochondrial transplantation as a promising therapy for ... [https://www.sciencedirect.com/science/article/pii/S2211383522004257]
- 36. Isolation of yeast mitochondria by affinity purification using ... [https://pmc.ncbi.nlm.nih.gov/articles/PMC11952200/]
- 37. Isolation of yeast mitochondria by affinity purification using ... [https://www.sciencedirect.com/science/article/abs/pii/S0076687924003689]
- 38. Small-scale protocols to characterize mitochondrial Complex ... [https://journals.plos.org/plosone/article?id=10.1371/journal.pone.0323136]
- 39. A robust method for assessing mitochondrial function in ... [https://www.nature.com/articles/s42003-025-08608-5]
- 40. Metabolite-enhanced normothermic machine perfusion ... [https://pmc.ncbi.nlm.nih.gov/articles/PMC12487851/]
- 41. Protocol for the Systematic Quantitative Ultrastructural ... [https://www.mdpi.com/2409-9279/8/4/87]
- 42. MacroD1 sustains mitochondrial integrity and oxidative ... [https://www.nature.com/articles/s41467-025-62410-9]
- 43. Protocol of Preparation of the Subcellular Organelle ... [https://www.creativebiomart.net/resource/principle-protocol-protocol-of-preparation-of-the-subcellular-organelle-protein-samples-425.htm]
- 44. A modified density gradient proteomic-based method to ... [https://www.sciencedirect.com/science/article/pii/S2589004221009172]
- 45. Methods for Mitochondrial Isolation [https://www.creative-proteomics.com/subcell/methods-for-mitochondrial-isolation.htm]
- 46. A PEROXO-Tag Enables Rapid Isolation of Peroxisomes ... [https://pmc.ncbi.nlm.nih.gov/articles/PMC7254474/]
- 47. Rapid Isolation And Purification Of Mitochondria For ... - PMC [https://pmc.ncbi.nlm.nih.gov/articles/PMC4828055/]
- 48. Quantitative Assessment of Mitochondrial Volumetric ... [https://pmc.ncbi.nlm.nih.gov/articles/PMC12134972/]
- 49. A review on the composition, extraction and applications ... [https://www.sciencedirect.com/science/article/abs/pii/S2950509724000947]
- 50. Mitochondrial isolation from cultured fibroblasts [https://www.protocols.io/view/mitochondrial-isolation-from-cultured-fibroblasts-g7s9bznh7.html]
- 51. 2.5. Purification of Mitochondria [https://bio-protocol.org/exchange/minidetail?id=17633051&type=30]
- 52. A method for isolating and cryopreserving intact ... [https://pubmed.ncbi.nlm.nih.gov/40621198/]
- 53. Isolation and quality control of functional mitochondria [https://pubmed.ncbi.nlm.nih.gov/25630999/]
- 54. An Improved Method for Preparation of Uniform and ... [https://www.xiahepublishing.com/m/2310-8819/JCTH-2018-00064]
- 55. Isolating Small Extracellular Vesicles from Small Volumes ... [https://elifesciences.org/reviewed-preprints/92796]
- 56. SLC25A45 is required for mitochondrial uptake of ... [https://www.sciencedirect.com/science/article/pii/S1097276525007038]
- 57. Mitochondrial complexome reveals quality-control ... [https://www.nature.com/articles/s41586-022-05641-w]
- 58. Mitochondrial respiration and membrane potential are ... [https://pubmed.ncbi.nlm.nih.gov/20599681/]
- 59. 4.4. Measurements of Mitochondrial Respiration and ... [https://bio-protocol.org/exchange/minidetail?id=6045513&type=30]
- 60. Measuring mitochondrial membrane potential | The EMBO ... [https://link.springer.com/article/10.1038/s44318-025-00632-9]
- 61. Quantitative assessment of mitochondrial morphology ... [https://pmc.ncbi.nlm.nih.gov/articles/PMC10690410/]
- 62. Fully automated software for quantitative measurements of ... [https://pmc.ncbi.nlm.nih.gov/articles/PMC5891219/]
- 63. TEM, SEM, and STEM-based immuno-CLEM workflows ... [https://www.nature.com/articles/s41598-020-79637-9]
- 64. Integrated fluorescence and transmission electron ... [https://www.sciencedirect.com/science/article/abs/pii/S1047847708001767]
- 65. Staining - TEM [https://myscope.training/TEM_Staining]
- 66. Isolation of functional mitochondria by inertial microfluidics [https://pubs.rsc.org/en/content/articlelanding/2017/ra/c7ra03384b]
- 67. Chemical-Free Extraction of Functional Mitochondria Using ... [https://www.mdpi.com/2411-5134/3/4/68]
- 68. Comparison of three methods for mitochondria isolation ... [https://pmc.ncbi.nlm.nih.gov/articles/PMC4833849/]
- 69. Novel approach to quantify mitochondrial content and ... [https://www.nature.com/articles/s41598-020-74718-1]
- 70. Assessment of Mitochondrial Protein Composition and ... [https://pubmed.ncbi.nlm.nih.gov/34545491/]
- 71. Assessment of Mitochondrial Protein Composition and ... [https://link.springer.com/protocol/10.1007/978-1-0716-1653-6_11]
- 72. Standard operating procedure combined with ... [https://www.nature.com/articles/s41467-025-56337-4]
- 73. DNA Isolation: Considerations and Methods Mitochondrial [https://bitesizebio.com/47040/isolate-dna-mitochondria/]
- 74. Comparison of ultracentrifugation and density gradient ... [https://pmc.ncbi.nlm.nih.gov/articles/PMC4156197/]