Electron Microscopy vs. Light Microscopy for Apoptosis Detection: A Comprehensive Guide for Biomedical Researchers
This article provides a detailed comparison of electron microscopy (EM) and light microscopy (LM) for detecting and analyzing apoptosis, crucial for drug development and cancer research.
Electron Microscopy vs. Light Microscopy for Apoptosis Detection: A Comprehensive Guide for Biomedical Researchers
Abstract
This article provides a detailed comparison of electron microscopy (EM) and light microscopy (LM) for detecting and analyzing apoptosis, crucial for drug development and cancer research. It covers the foundational principles of both techniques, explores their specific methodological applications in identifying key apoptotic features like membrane blebbing and apoptosome formation, and offers practical troubleshooting advice. A direct comparative analysis equips researchers with the knowledge to select the optimal imaging strategy or integrate these complementary methods for validated, high-quality data in studying programmed cell death.
Visualizing Cell Death: Core Principles of Light and Electron Microscopy
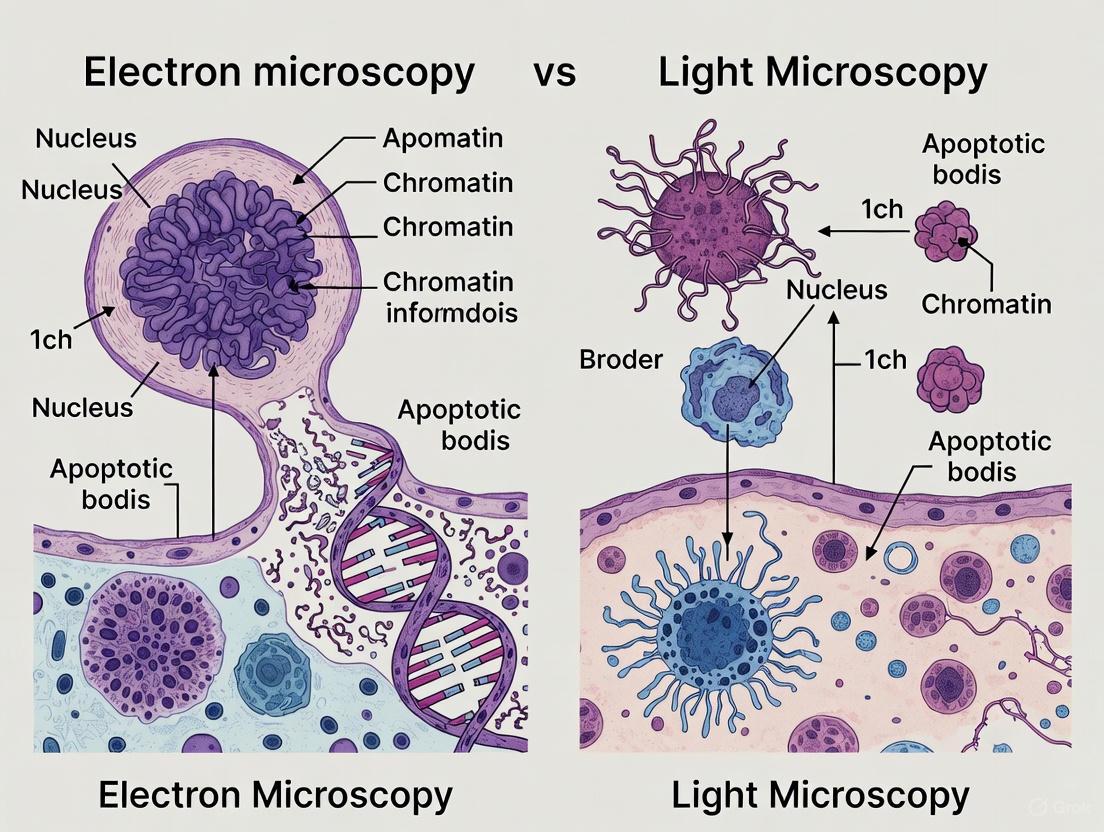
Apoptosis, or programmed cell death, is a fundamental biological process essential for development, tissue homeostasis, and the removal of damaged or potentially harmful cells. Unlike necrosis, which results from acute injury and causes inflammation, apoptosis is a highly regulated energy-dependent process characterized by specific morphological and biochemical changes that allow for clean cell removal without damaging surrounding tissues. Precise identification of apoptosis is crucial for research in cancer, neurodegenerative diseases, and drug development. This guide objectively compares the performance of two principal microscopy techniques—electron microscopy (EM) and light microscopy (LM)—in detecting the key hallmarks of apoptosis, providing researchers with data-driven insights for their experimental design.
Morphological Hallmarks of Apoptosis
The definitive identification of apoptosis relies on recognizing its characteristic structural changes, which occur in a specific sequence.
- Cell Shrinkage and Chromatin Condensation (Pyknosis): One of the earliest morphological changes is the compaction of the cell and its nuclear material. The chromatin condenses into dense, featureless masses adjacent to the nuclear envelope [1] [2].
- Nuclear Fragmentation (Karyorrhexis): Following condensation, the nucleus breaks up into discrete fragments [1] [2].
- Plasma Membrane Blebbing: The cell surface undergoes dynamic changes, forming bulges known as "blebs." Crucially, the integrity of the plasma membrane is maintained, which helps prevent the release of inflammatory cellular contents [1] [2].
- Formation of Apoptotic Bodies: The cell eventually disassembles into small, membrane-bound vesicles called apoptotic bodies. These contain condensed cytoplasm and nuclear fragments and are swiftly phagocytosed by neighboring cells or macrophages, leaving no trace [1] [2].
Biochemical Hallmarks of Apoptosis
Parallel to the morphological changes, a cascade of biochemical events drives and facilitates the apoptotic process.
- Caspase Activation: Cysteine-dependent aspartate-cleaving proteases (caspases) are the central executors of apoptosis. They are activated through either the extrinsic (death receptor) or intrinsic (mitochondrial) pathway and cleave key cellular proteins [2].
- Phosphatidylserine Externalization: In healthy cells, phosphatidylserine (PS) is confined to the inner leaflet of the plasma membrane. During apoptosis, PS is translocated to the outer leaflet, serving as an "eat-me" signal for phagocytes [3].
- DNA Fragmentation: Activated endonucleases cleave genomic DNA at the linker regions between nucleosomes, producing fragments in multiples of 180-200 base pairs. This creates a characteristic "DNA ladder" pattern in gel electrophoresis [4] [2].
- Mitochondrial Alterations: The intrinsic pathway involves mitochondrial outer membrane permeabilization (MOMP), leading to the release of pro-apoptotic proteins like cytochrome c into the cytosol. Cytochrome c then binds to Apaf-1 to form the "apoptosome," a complex that activates caspase-9 [5] [2].
Comparative Analysis: Electron Microscopy vs. Light Microscopy
The choice between EM and LM involves significant trade-offs in resolution, information depth, throughput, and technical requirements. The table below summarizes a direct comparison of their capabilities in apoptosis research.
Table 1: Performance Comparison of Microscopy Techniques in Apoptosis Detection
| Feature | Transmission Electron Microscopy (TEM) | Scanning Electron Microscopy (SEM) | Fluorescence Light Microscopy | Transmitted Light (DIC/PC) |
|---|---|---|---|---|
| Resolution | ~1-2 nm (Ultra-structural) [1] | ~10 nm (Surface topology) [1] | ~200 nm (Diffraction-limited) [6] | ~200 nm (Diffraction-limited) [6] |
| Key Apoptotic Hallmarks | Nuclear condensation & fragmentation, intact organelles, apoptotic bodies [1] [2] | Membrane blebbing, cell shrinkage [1] | Caspase activation, PS exposure, DNA fragmentation, mitochondrial potential [3] | Cell shrinkage, membrane blebbing [3] |
| Quantitative Capability | Low (Labor-intensive) [2] | Low [1] | High (Image analysis, flow cytometry) [6] | Moderate (Image analysis) [3] |
| Throughput | Very Low [2] | Low | High [6] | High [3] |
| Live-Cell Imaging | No | No | Yes (Real-time kinetics) [3] | Yes (Real-time kinetics) [3] |
| Technical Complexity & Cost | Very High [2] | High [1] | Moderate [6] | Low [3] |
Table 2: Suitability Assessment for Different Research Goals
| Research Goal | Recommended Technique | Justification |
|---|---|---|
| Definitive, gold-standard identification | Transmission Electron Microscopy (TEM) | Uniquely visualizes ultrastructural hallmarks like pyknosis and apoptotic bodies with supreme resolution [1] [2]. |
| High-throughput screening/quantification | Fluorescence Microscopy / Flow Cytometry | Provides rapid, quantitative data on viability and specific biochemical markers (e.g., caspase activation) for large sample sizes [3] [6]. |
| Live-cell dynamics & kinetic studies | Time-lapse Fluorescence or Transmitted Light Microscopy | Enables real-time observation of processes like membrane blebbing and shrinkage in living cells [3]. |
| Surface morphology analysis | Scanning Electron Microscopy (SEM) | Provides detailed 3D topographical information of membrane blebbing and cell shrinkage [1]. |
Advanced Integrated Workflows
To overcome the limitations of individual techniques, advanced correlative workflows are increasingly employed. For instance, 3D Correlative Light and Electron Microscopy (3D-CLEM) combines the live-cell and labeling capabilities of fluorescence microscopy with the ultrastructural detail of EM. One established workflow uses confocal fluorescence microscopy to identify cells of interest based on fluorescent probes, which are then precisely targeted for detailed imaging with Focused Ion Beam Scanning Electron Microscopy (FIB-SEM). This approach can utilize intrinsic cellular structures like lipid droplets as fiduciary markers, avoiding the need for external markers and streamlining the process [7]. Such methodologies provide a more comprehensive understanding by linking dynamic biochemical activity to high-resolution structural outcomes.
Essential Research Reagent Solutions
The following table catalogizes key reagents and their applications for detecting apoptosis using the discussed microscopy techniques.
Table 3: Essential Research Reagents for Apoptosis Detection
| Reagent / Assay | Target / Function | Primary Application | Microscopy Compatibility |
|---|---|---|---|
| Annexin V | Binds externalized Phosphatidylserine (PS) | Detection of early/mid-stage apoptosis [3] | Fluorescence LM, Flow Cytometry [6] |
| Caspase-3/7 Substrates | Activated effector caspases | Detection of mid-stage apoptosis execution [3] | Fluorescence LM (live or fixed) |
| TUNEL Assay | 3'-OH ends of fragmented DNA | Labels cells with DNA cleavage [4] [3] | Fluorescence LM |
| Propidium Iodide (PI) | DNA in cells with compromised membranes | Distinguishes late apoptosis/necrosis (Annexin V-/PI+) [4] [6] | Fluorescence LM, Flow Cytometry |
| Hoechst 33342 / DAPI | DNA, shows nuclear morphology | Visualizes chromatin condensation and nuclear fragmentation [3] | Fluorescence LM |
| Antibodies (Bax, Bcl-2) | Pro- and anti-apoptotic Bcl-2 family proteins | Assess expression levels of regulatory proteins [8] | Immunofluorescence, IHC |
| MitoTracker Dyes | Mitochondrial mass and membrane potential | Assess early mitochondrial alterations [3] | Fluorescence LM (live cells) |
Apoptosis Signaling Pathways
The following diagram summarizes the core biochemical pathways of apoptosis, highlighting key events that can be detected microscopically.
Both electron and light microscopy are indispensable tools for defining the morphological and biochemical hallmarks of apoptosis, yet they serve distinct purposes. TEM remains the unequivocal gold standard for definitive ultrastructural confirmation, while light microscopy, particularly fluorescence-based methods, offers unparalleled power for quantitative, high-throughput, and live-cell kinetic studies. The optimal research strategy often involves a synergistic approach: using light microscopy for screening and quantification, and reserving EM for final, definitive confirmation of ambiguous results or for gaining deep ultrastructural insights. Advanced correlative techniques that merge the strengths of both modalities represent the cutting edge, enabling researchers to build a more complete and dynamic picture of programmed cell death.
In the study of cellular processes such as apoptosis (programmed cell death), microscopy serves as an indispensable tool for researchers and drug development professionals. The fundamental difference between light microscopy and electron microscopy lies in their resolution capabilities and application scope. Light microscopy, including both transmitted light and fluorescence modalities, enables real-time observation of living cells with minimal perturbation, making it ideal for tracking dynamic processes like apoptosis [3] [9]. In contrast, electron microscopy provides significantly higher resolution, revealing ultrastructural details at the nanometer scale, but requires fixed, non-living samples and extensive preparation [10] [2]. This guide objectively compares the performance of light microscopy techniques against electron microscopy and emerging alternatives for apoptosis research, providing experimental data and protocols to inform methodological selection.
Apoptosis research is particularly dependent on imaging technologies because this form of cell death presents characteristic morphological features that evolve over time. The ability to resolve these changes - from initial membrane blebbing to eventual cell fragmentation - directly impacts the accuracy of experimental conclusions in both basic research and drug development contexts [3] [10]. This article provides a comprehensive comparison of imaging platforms, detailing their respective capabilities, limitations, and optimal applications for resolving cellular morphology in apoptosis studies.
Technical Comparison of Imaging Platforms
Fundamental Principles and Performance Metrics
The following table summarizes the key technical parameters and performance characteristics of major microscopy platforms used in apoptosis research:
Table 1: Technical Comparison of Microscopy Platforms for Apoptosis Research
| Microscopy Platform | Best Resolution | Live Cell Capability | Sample Preparation | Key Apoptosis Features Visualized | Cost & Complexity |
|---|---|---|---|---|---|
| Light Microscopy (Transmitted Light) | ~200 nm (lateral) | Yes (real-time) | Minimal (label-free) | Cell shrinkage, membrane blebbing, apoptotic bodies [3] | Low [3] |
| Light Microscopy (Fluorescence) | ~200 nm (lateral) | Yes (with compatible dyes) | Fluorescent staining required | Caspase activation, phosphatidylserine exposure, DNA fragmentation [3] [9] | Moderate [3] |
| Electron Microscopy | <1 nm | No (fixed samples only) | Extensive (fixation, sectioning) | Ultrastructural details, organelle changes, nuclear fragmentation [10] [2] | High [3] [10] |
| Full-Field OCT | ~1 μm (3D) | Yes | Label-free | Echinoid spines, membrane blebbing, adhesion changes [11] [12] | Moderate-High |
| Super-resolution SIM | ~120 nm (lateral), ~300 nm (axial) | Yes (with limitations) | Fluorescent staining required | Subcellular organelle dynamics [13] | High |
Quantitative Performance Data for Apoptosis Detection
The following table compares quantitative performance metrics across different apoptosis detection methods, highlighting the distinct advantages of each approach:
Table 2: Performance Comparison of Apoptosis Detection Methods [3] [9]
| Method | Time to Complete | Complexity | Cost | Invasiveness | Accuracy | Real-time Monitoring |
|---|---|---|---|---|---|---|
| Light Microscopy (Transmitted Light) | + (Low) | + (Low) | + (Low) | + (Low) | +++ (High) | Yes |
| Light Microscopy (Fluorescence) | ++ (Moderate) | ++ (Moderate) | + (Low) | ++ (Moderate) | +++ (High) | Yes |
| Gel Electrophoresis | ++ (Moderate) | ++ (Moderate) | + (Low) | +++ (High) | ++ (Moderate) | No |
| Flow Cytometry | ++ (Moderate) | +++ (High) | + (Low) | ++ (Moderate) | +++ (High) | No |
| Western Blot | +++ (High) | +++ (High) | + (Low) | +++ (High) | +++ (High) | No |
| Electron Microscopy | +++ (High) | +++ (High) | +++ (High) | +++ (High) | +++ (High) | No |
Experimental Protocols for Apoptosis Imaging
Light Microscopy Protocol for Live-Cell Apoptosis Detection
Cell Culture and Preparation:
- Utilize appropriate cell lines (e.g., HeLa or PtK cells) grown in specialized glass-bottom culture dishes to ensure optimal imaging conditions [3] [9].
- Maintain cells in phenol red-free medium during imaging to reduce background fluorescence and autofluorescence [3] [9].
- Culture cells at 37°C with 5% CO₂ for 24 hours prior to experimentation to ensure adherence and normal growth [3].
Apoptosis Induction:
- Prepare a 10 μM staurosporine solution in 1% dimethyl sulfoxide (DMSO) as an apoptosis inducer [3] [9]. Staurosporine is a protein kinase inhibitor that triggers intrinsic apoptosis through both caspase-dependent and independent pathways [3].
- Treat cells 30 minutes prior to imaging initiation to synchronize the apoptotic process across the cell population [3].
Image Acquisition:
- For transmitted light imaging (DIC or phase contrast), use a framing rate of 2-4 frames per minute to capture morphological changes without excessive phototoxicity [3] [9].
- For fluorescence detection of caspase activation, utilize NucView 488 substrate or similar caspase-cleavable probes at recommended concentrations [3] [9].
- Implement environmental control (temperature, CO₂, humidity) throughout time-lapse acquisition to maintain cell viability [3].
Electron Microscopy Protocol for Apoptosis Ultrastructure
Sample Fixation:
- Primary fixation with 2.5% glutaraldehyde in 0.1 M cacodylate buffer (pH 7.4) for 2 hours at 4°C [10] [2].
- Post-fix with 1% osmium tetroxide for 1 hour to enhance membrane contrast [10] [2].
Dehydration and Embedding:
- Dehydrate samples through graded ethanol series (30%, 50%, 70%, 90%, 100%) [10] [2].
- Infiltrate with resin (EPON or Spurr's) and polymerize at 60°C for 48 hours [10] [2].
Sectioning and Staining:
- Cut ultrathin sections (60-90 nm) using an ultramicrotome and collect on copper grids [10] [2].
- Stain with uranyl acetate and lead citrate to enhance contrast [10] [2].
Image Acquisition:
- Acquire images at appropriate magnifications (typically 2,000-10,000X) to capture key apoptotic features including nuclear condensation, organelle integrity, and membrane blebbing [10] [2].
Visualizing Apoptosis Pathways and Detection Workflows
Biochemical Pathways in Apoptosis
Diagram 1: Apoptosis Signaling Pathways
Light Microscopy Workflow for Apoptosis Detection
Diagram 2: Apoptosis Detection Workflow
Research Reagent Solutions for Apoptosis Detection
Table 3: Essential Reagents for Apoptosis Detection Assays [3] [9] [10]
| Reagent Category | Specific Examples | Detection Method | Function & Application |
|---|---|---|---|
| Caspase Substrates | NucView 488, Caspase-3/7 fluorescent substrates | Fluorescence microscopy, Flow cytometry | Detect early apoptosis through caspase enzyme activity [3] [9] |
| Membrane Integrity Probes | Annexin V conjugates, BioTracker Apo-15 | Fluorescence microscopy, Flow cytometry | Identify phosphatidylserine externalization on apoptotic cells [3] [9] |
| DNA Binding Dyes | Hoechst, DAPI, Propidium Iodide | Fluorescence microscopy | Detect nuclear condensation and fragmentation; distinguish viable/non-viable cells [3] [10] |
| Apoptosis Inducers | Staurosporine, Doxorubicin | Experimental controls | Induce intrinsic apoptosis pathway for method validation [3] [11] |
| Mitochondrial Probes | JC-1, TMRM, MitoTracker | Fluorescence microscopy | Assess mitochondrial membrane potential changes during apoptosis [10] |
| DNA Fragmentation Assays | TUNEL assay reagents | Fluorescence microscopy, Light microscopy | Detect DNA strand breaks characteristic of late apoptosis [3] [10] |
Comparative Analysis and Research Applications
Strengths and Limitations in Apoptosis Research
Light Microscopy Advantages:
- Enables real-time monitoring of dynamic apoptotic processes in living cells, providing kinetic data unavailable through other methods [3] [9].
- Minimal sample perturbation through label-free transmitted light techniques (DIC, phase contrast) allows observation of native cellular morphology without staining artifacts [3].
- Lower cost and complexity compared to electron microscopy makes it accessible for high-throughput screening applications in drug development [3].
Light Microscopy Limitations:
- Resolution limitation (~200 nm) prevents visualization of ultrastructural details such as mitochondrial membrane integrity and nuclear envelope changes that are readily apparent in electron micrographs [10] [2].
- Potential phototoxicity from prolonged illumination can inadvertently induce cellular stress, potentially confounding apoptosis studies [3].
Electron Microscopy Advantages:
- Unmatched resolution reveals ultrastructural details critical for definitive apoptosis identification, including precise organelle morphology and chromatin patterns [10] [2].
- Considered the "gold standard" for apoptosis identification based on morphological criteria established in seminal works [10] [2].
Electron Microscopy Limitations:
- No live-cell capability restricts analysis to fixed time points, preventing observation of dynamic processes [10].
- Extensive sample preparation (fixation, embedding, sectioning) introduces potential artifacts and limits throughput [10] [2].
Emerging Technologies and Future Directions
Advanced imaging technologies are continuously expanding capabilities for apoptosis research. Full-field optical coherence tomography (FF-OCT) provides label-free, high-resolution 3D visualization of apoptotic morphology, including echinoid spine formation and membrane blebbing, without the need for staining [11] [12]. Super-resolution techniques such as 3D structured illumination microscopy (3D-SIM) now achieve ~120 nm lateral resolution, bridging the gap between conventional light and electron microscopy [13]. Recent developments in cryo-electron microscopy demonstrate improved performance for thick samples, potentially enhancing in situ structural biology applications [14]. The integration of computational modeling with imaging data is further revolutionizing structural cell biology, adding molecular, kinetic, and dynamical details to our description of cellular processes including apoptosis [15].
Light microscopy remains a fundamental tool for apoptosis research, offering unparalleled capabilities for live-cell imaging and real-time observation of dynamic morphological changes. While electron microscopy provides superior resolution for ultrastructural analysis, its requirement for fixed samples limits application to static endpoints. The choice between these platforms should be guided by specific research questions: light microscopy for kinetic studies and high-throughput screening, electron microscopy for definitive ultrastructural characterization. Emerging technologies such as FF-OCT and super-resolution microscopy are progressively bridging the historical gap between these platforms, offering enhanced resolution while maintaining live-cell compatibility. For researchers in drug development and basic biology, a multimodal approach often yields the most comprehensive understanding of apoptotic processes, leveraging the respective strengths of each imaging technology.
The investigation of programmed cell death, or apoptosis, relies heavily on advanced imaging technologies to visualize characteristic morphological changes. Electron microscopy (EM) and light microscopy (LM) represent two fundamental approaches with complementary capabilities and limitations. While LM enables real-time observation of dynamic processes in living cells, EM provides unparalleled resolution for revealing ultrastructural details at the nanoscale. This guide objectively compares the performance of these imaging modalities within the specific context of apoptosis research, providing researchers with experimental data and methodological considerations to inform their imaging strategy.
The fundamental difference between these technologies stems from their respective resolution limits. Conventional LM is constrained by the diffraction barrier of light, typically achieving lateral resolution of approximately 200-250 nanometers and axial resolution around 500 nanometers [16] [17]. In contrast, EM utilizes electron beams rather than photons, enabling resolution down to the nanometer scale and revealing subcellular structures invisible to light optics [18].
Technical Comparison: Fundamental Operating Principles
Table 1: Fundamental Characteristics of Electron and Light Microscopy
| Parameter | Electron Microscopy | Light Microscopy |
|---|---|---|
| Resolution Limit | Nanoscale (sub-cellular) [18] | Diffraction-limited (~200 nm lateral) [16] |
| Probe Type | Electron beam | Photons (visible light) |
| Visualized Features | Ultrastructural details, organelle morphology | Cellular morphology, dynamics in living cells |
| Sample Environment | High vacuum, thin sections | Ambient conditions, live cells |
| Labeling Requirement | Often label-free (inherent contrast) | Frequently requires fluorescent probes/stains [3] |
| Real-time Monitoring | Not possible (fixed samples) | Possible (live-cell imaging) [3] |
Comparative Performance in Apoptosis Research
Apoptosis manifests through a series of characteristic morphological changes that are differentially visualized by EM and LM techniques.
Detection of Characteristic Apoptotic Features
Table 2: Detection of Apoptotic Features by Different Imaging Modalities
| Apoptotic Feature | Electron Microscopy Capability | Light Microscopy Capability |
|---|---|---|
| Cell Shrinkage | Visualized indirectly in fixed samples | Quantifiable in real-time via DHM [19] |
| Chromatin Condensation | Excellent visualization of nuclear structure | Detectable with DNA-binding dyes (Hoechst) [3] |
| Membrane Blebbing | High-resolution surface detail | Observable via DIC/Phase contrast [3] |
| Mitochondrial Changes | Ultrastructural details of cristae | Probes for membrane potential or caspase activation [3] |
| Apoptotic Bodies | Detailed morphology of fragments | Observable via DIC/Phase contrast [3] |
| DNA Fragmentation | Indirect evidence | TUNEL assay, DNA laddering [3] |
EM excels in revealing the ultrastructural details of late apoptosis, including pronounced nuclear fragmentation and the formation of apoptotic bodies with intact membranes [7]. However, it cannot capture the temporal dynamics of these processes in living cells.
LM techniques, particularly transmitted light modalities like Differential Interference Contrast (DIC) and Phase Contrast (PC), can identify apoptosis in real-time without staining by detecting cellular shrinkage and membrane blebbing [3]. Quantitative phase imaging techniques like Digital Holographic Microscopy (DHM) can precisely measure apoptotic volume decrease (AVD), showing volume reductions of 50-60% in KB cells after staurosporine induction [19].
Methodological Approaches and Workflows
The experimental workflow differs significantly between these imaging approaches. EM typically requires extensive sample preparation including chemical fixation, dehydration, resin embedding, ultrathin sectioning, and often heavy metal staining [7]. This process preserves cellular ultrastructure but eliminates any possibility of live monitoring.
In contrast, LM approaches for apoptosis detection employ various staining strategies and can be performed on living cells. Common fluorescence-based methods include:
- Annexin V binding: Detects phosphatidylserine externalization on the outer membrane leaflet [3]
- Caspase activation assays: Utilize fluorescent substrates like NucView 488 for caspase-3/7 activity [3]
- DNA fragmentation labels: TUNEL assay or DNA-binding dyes (Hoechst, DAPI) [3]
- Membrane integrity probes: Propidium iodide exclusion for viable cells [6]
Advanced Imaging Modalities and Correlative Approaches
Recent technological advances have bridged some gaps between these imaging paradigms. Full-field optical coherence tomography (FF-OCT) provides high-resolution, label-free visualization of cellular structures with sub-micrometer resolution, enabling identification of apoptotic features such as echinoid spine formation, cell contraction, and membrane blebbing [20] [11]. Similarly, quantitative phase microscopy (QPM) maps refractive index variations to visualize cell status without labels [20].
Correlative Light and Electron Microscopy (CLEM) has emerged as a powerful approach that combines the strengths of both techniques. As demonstrated in a study of nanoparticle uptake, 3D-CLEM workflows can correlate confocal fluorescence microscopy with focused ion beam scanning electron microscopy (FIB-SEM) to precisely localize events within cellular ultrastructure [7].
Diagram 1: Correlative workflow integrating light and electron microscopy
Experimental Design and Protocol Considerations
Electron Microscopy Protocol for Apoptosis Detection
For traditional EM analysis of apoptotic cells:
- Induction: Treat cells with apoptosis inducer (e.g., 1-2 μM staurosporine for 2-4 hours) [19]
- Fixation: Use glutaraldehyde (2.5%) in cacodylate buffer for primary fixation
- Post-fixation: Treat with osmium tetroxide (1%) for membrane contrast
- Dehydration: Ethanol series (50-100%) followed by resin infiltration and embedding
- Sectioning: Cut ultrathin sections (70-90 nm) using ultramicrotome
- Staining: Uranyl acetate and lead citrate for contrast enhancement
- Imaging: Acquire images at appropriate magnifications (typically 2,500-15,000X)
Light Microscopy Protocol for Live-Cell Apoptosis Imaging
For real-time monitoring of apoptosis via LM:
- Cell Preparation: Plate cells in glass-bottom dishes 24 hours before imaging [3]
- Staining (Optional): Load with fluorescent probes (e.g., 1-5 μM caspase substrate) if using fluorescence microscopy [3]
- Induction: Add apoptosis inducer (e.g., 1 μM staurosporine) directly during imaging [19]
- Image Acquisition: Capture time-lapse sequences every 30 seconds to 5 minutes for 2-24 hours [3]
- Environmental Control: Maintain 37°C, 5% CO2 during live-cell imaging [3]
Research Reagent Solutions for Apoptosis Imaging
Table 3: Essential Reagents for Apoptosis Detection Assays
| Reagent/Category | Specific Examples | Function/Application |
|---|---|---|
| Apoptosis Inducers | Staurosporine, Doxorubicin | Experimentally trigger apoptotic pathways [3] [20] |
| Caspase Substrates | NucView 488, Caspase-3/7 reagents | Detect caspase activation (early apoptosis) [3] |
| Membrane Asymmetry Probes | Annexin V conjugates | Bind exposed phosphatidylserine [3] |
| DNA Stains | Hoechst, DAPI, Propidium iodide | Assess nuclear morphology and membrane integrity [3] |
| Viability Indicators | FDA, Calcein-AM, PI | Distinguish live/dead cells [6] |
| Mitochondrial Probes | DiIC1, JC-1 | Monitor mitochondrial membrane potential [6] |
The choice between electron and light microscopy for apoptosis research depends fundamentally on the scientific question. EM provides unmatched resolution for detailed ultrastructural analysis of fixed cells, revealing nanoscale morphological changes during cell death. LM offers the critical advantage of dynamic monitoring in living cells, enabling real-time observation of apoptotic progression with molecular specificity through fluorescent labeling.
For comprehensive analysis, correlative approaches that combine both techniques are increasingly valuable, allowing researchers to locate specific events via LM and then examine their ultrastructural context via EM. This integrated approach leverages the respective strengths of each technology to provide a more complete understanding of apoptotic processes in both physiological and pathological contexts.
Apoptosis, or programmed cell death, is a fundamental biological process crucial for maintaining tissue homeostasis, proper development, and eliminating damaged or potentially harmful cells. Unlike accidental cell death (necrosis), apoptosis is a highly regulated and controlled process characterized by a continuum of distinct morphological and biochemical changes. These include cell shrinkage, chromatin condensation, nuclear fragmentation, membrane blebbing, and the formation of apoptotic bodies. Accurate detection and characterization of these changes are paramount in various research fields, particularly in cancer biology and drug development, where modulating cell death pathways is a primary therapeutic strategy.
The choice of imaging technique profoundly impacts the type and quality of information researchers can extract from apoptotic cells. This guide provides a objective comparison between two cornerstone imaging modalities—electron microscopy and light microscopy—within the context of apoptosis research. We will compare their performance, provide supporting experimental data, and detail the methodologies that enable researchers to visualize and quantify the complex process of cellular self-destruction.
Visualizing the Apoptotic Cascade: A Timeline of Key Events
The following diagram illustrates the sequence of key morphological events in apoptosis and the imaging techniques most suitable for their detection.
This timeline of apoptosis highlights the progression from early to late-stage events. Light microscopy is particularly effective for detecting initial changes like cell shrinkage and membrane blebbing, often in real-time [3]. In contrast, electron microscopy excels at visualizing ultrastructural details such as precise nuclear fragmentation and organelle disintegration, typically requiring fixed samples [21]. Emerging label-free techniques like Quantitative Phase Imaging (QPI) and Full-Field Optical Coherence Tomography (FF-OCT) can non-invasively monitor dynamic morphological changes throughout the continuum [22] [11].
Comparative Analysis: Electron Microscopy vs. Light Microscopy
The following tables provide a detailed, data-driven comparison of electron and light microscopy techniques for apoptosis research, summarizing their key parameters and specific applications.
Table 1: Technical and Performance Comparison for Apoptosis Detection
| Parameter | Electron Microscopy (EM) | Light Microscopy (Transmitted) | Light Microscopy (Fluorescence) |
|---|---|---|---|
| Max Resolution | ~0.1 nm (Sub-nanometer) [7] | ~200 nm (Diffraction-limited) [3] | ~200 nm (Diffraction-limited) [3] |
| Key Apoptotic Features Visualized | Ultrastructural details: chromatin condensation, nuclear membrane disintegration, organelle pathology, apoptotic bodies [21] [23] | Gross morphology: cell shrinkage, membrane blebbing, apoptotic body formation [3] | Molecular events: caspase activation, PS exposure, DNA fragmentation, mitochondrial permeability [3] [24] |
| Real-time / Live-cell Capability | No (Fixed samples only) [11] | Yes (Ideal for time-lapse) [3] | Yes (With viable dyes/reporters) [3] [24] |
| Complexity & Cost | High (+++) [3] | Low (+) [3] | Moderate (++) [3] |
| Invasiveness | High (Requires fixation, sectioning) [11] | None (Label-free) [3] | Low to Moderate (May require dyes/transfection) [3] |
| Throughput | Low | Moderate to High | High (Especially with automated systems) [24] |
Table 2: Detecting Specific Apoptotic Markers: A Technique Capability Matrix
| Apoptotic Marker / Event | Electron Microscopy | Light Microscopy (Transmitted) | Light Microscopy (Fluorescence) |
|---|---|---|---|
| Cell Shrinkage (AVD) | Indirectly, via morphology | Directly and quantitatively (e.g., via QPI) [22] [11] | Possible with membrane dyes |
| Membrane Blebbing | High-detail visualization | Direct visualization (Phase contrast/DIC) [3] | Possible with membrane dyes |
| Chromatin Condensation | High-detail visualization (Nuclear morphology) [21] | Not detectable | Direct detection (Hoechst, DAPI) [3] [24] |
| Phosphatidylserine (PS) Exposure | Not detectable | Not detectable | Direct detection (Annexin V probes) [3] [24] |
| Caspase-3/7 Activation | Not detectable | Not detectable | Direct detection (Fluorescent substrates/reporters) [3] |
| DNA Fragmentation | Indirectly (TUNEL-EM) | Not detectable | Direct detection (TUNEL assay) [3] |
| Mitochondrial Outer Membrane Permeabilization (MOMP) | High-detail visualization (Membrane integrity) | Not detectable | Direct detection (Cytochrome c release dyes) [24] |
| Formation of Apoptotic Bodies | High-detail visualization [21] | Direct visualization [3] | Direct visualization (With counterstains) |
Experimental Protocols for Apoptosis Imaging
Light Microscopy Protocol: Time-Lapse Imaging of Apoptosis
This protocol outlines the use of transmitted light and fluorescence to monitor apoptosis in live cells, adapted from methodologies in the search results [3] [24].
- Cell Preparation: Plate cells (e.g., HeLa or PtK2) in glass-bottom dishes and allow to adhere. For fluorescence imaging, transfert cells with a FRET-based caspase sensor or load with a fluorescent dye like NucView 488 for caspase-3/7 activity [3].
- Induction of Apoptosis: Treat cells with an appropriate apoptotic inducer. A common method is to use 1-10 µM Staurosporine (diluted from a stock in DMSO) for 30 minutes to several hours before imaging [3]. A negative control with DMSO vehicle alone should be included.
- Image Acquisition: Use an inverted microscope equipped with phase contrast or DIC, fluorescence optics, a environmental chamber (37°C, 5% CO₂), and a perfect focus system. Acquire time-lapse images in both transmitted light and fluorescence channels every 2-5 minutes for 2-24 hours. For fluorescence, use minimal laser exposure to reduce phototoxicity.
- Data Analysis: Quantify parameters such as the percentage of cells showing membrane blebbing (from DIC/phase images) or the time-to-caspase activation (from fluorescence images) using image analysis software.
Correlative Light and Electron Microscopy (CLEM) Protocol
CLEM combines the dynamic and molecular specificity of light microscopy with the ultrastructural detail of EM, providing a comprehensive view of apoptosis [7].
- Sample Preparation and Live-Cell Imaging: Culture cells (e.g., H8N8 cancer cells) on a CLEM-compatible substrate. Induce apoptosis and, if needed, stain with a fluorescent viability probe. Acquire confocal fluorescence images to map the locations of apoptotic cells.
- Chemical Fixation and Processing: Immediately after live imaging, fix cells with a mixture of 2.5% glutaraldehyde and 2% paraformaldehyde in buffer. Post-fix with 1% osmium tetroxide, followed by dehydration in a graded ethanol series.
- Embedding and Sectioning: Infiltrate and embed the sample in a resin (e.g., Epon). Polymerize the resin into a block. Trim the block and cut semi-thin (300 nm) sections to stain and confirm the region of interest under a light microscope. Then, cut ultra-thin (70 nm) sections and collect them on EM grids.
- Staining and EM Imaging: Stain the ultra-thin sections with heavy metals (uranyl acetate and lead citrate) to enhance contrast. Image the exact locations previously identified by fluorescence using a transmission electron microscope.
- Image Correlation: Overlay the fluorescence and EM images using software, aligning them based on intrinsic fiduciary markers (e.g., lipid droplets) or added fiducials to correlate molecular information with ultrastructure [7].
The workflow for this powerful correlative approach is illustrated below.
The Scientist's Toolkit: Essential Reagents for Apoptosis Imaging
Table 3: Key Research Reagent Solutions for Apoptosis Detection
| Reagent / Assay | Function and Target | Common Readout |
|---|---|---|
| Staurosporine | A broad-spectrum protein kinase inhibitor used to experimentally induce intrinsic apoptosis [3]. | Induction of characteristic apoptotic morphology (shrinkage, blebbing) and biochemical markers. |
| Annexin V (conjugates) | Binds to phosphatidylserine (PS), which is externalized on the outer leaflet of the plasma membrane during early apoptosis [3] [24]. | Fluorescence microscopy or flow cytometry. Often used with a viability dye (e.g., Propidium Iodide) to distinguish early apoptosis from necrosis. |
| NucView 488 | A cell-permeable, non-fluorescent substrate that is cleaved by active caspase-3/7, releasing a bright DNA-binding dye [3]. | Fluorescent staining of the nucleus upon caspase activation, detectable by fluorescence microscopy. |
| Hoechst 33342 / DAPI | Cell-permeable DNA-binding dyes that stain the nucleus. Used to visualize nuclear morphology changes like condensation and fragmentation [3] [24]. | Fluorescence microscopy (blue channel). |
| Tetramethylrhodamine, Ethyl Ester (TMRE) | A cell-permeable, cationic dye that accumulates in active mitochondria based on membrane potential. Loss of signal indicates mitochondrial membrane depolarization, an early apoptotic event [24]. | Fluorescence microscopy (red channel). |
| TUNEL Assay Kit | Labels the 3'-hydroxyl termini of fragmented DNA, a hallmark of mid-late apoptosis [3]. | Fluorescence microscopy or flow cytometry. |
The choice between electron and light microscopy for apoptosis research is not a matter of selecting a superior technique, but of aligning the tool with the specific research question. As the data and protocols above demonstrate, light microscopy is unparalleled for live-cell dynamics, kinetic studies, and multiplexed molecular detection across a population of cells. In contrast, electron microscopy provides the ultimate resolution for defining ultrastructural pathology in fixed samples.
The future of apoptosis imaging lies in integration and innovation. Correlative Light and Electron Microscopy (CLEM) is a powerful embodiment of this, directly combining the strengths of both worlds [7]. Furthermore, advanced label-free light microscopy techniques like Quantitative Phase Imaging (QPI) and Full-Field Optical Coherence Tomography (FF-OCT) are rapidly evolving, offering new ways to quantify subtle biophysical changes like dry mass and cell topography during apoptosis without any labels [22] [11]. The integration of artificial intelligence with these imaging platforms is also poised to transform the field, enabling automated, high-throughput, and highly precise analysis of the complex apoptotic continuum. For the researcher, a careful consideration of the apoptosis continuum, from initial trigger to final clearance, will guide the optimal selection and combination of these powerful imaging tools.
Practical Applications: Mapping Apoptotic Pathways with LM and EM
Apoptosis, or programmed cell death, is a fundamental biological process characterized by a series of distinctive morphological changes, including cell shrinkage, plasma membrane blebbing, nuclear condensation, and DNA fragmentation [25] [26]. Accurately detecting and quantifying these changes is crucial for researchers in fields ranging from cancer biology to drug development. Among the various techniques available, light microscopy (LM) stands out for its unique capacity for real-time, live-cell imaging of apoptosis without necessarily perturbing the cellular environment with exogenous labels [3] [27]. This guide provides a comparative analysis of light microscopy against other prominent techniques, with a specific focus on its application for tracking key apoptotic hallmarks—membrane blebbing and cell shrinkage—within the broader context of comparing microscopic methodologies for cell death research.
The Technical Showdown: Comparing Microscopy Techniques for Apoptosis Research
The choice of technique for apoptosis analysis often depends on the research question, balancing the need for high-resolution ultrastructural detail against the benefits of live-cell dynamics and ease of use.
Table 1: Comparison of Microscopy Techniques for Apoptosis Detection
| Technique | Key Apoptotic Features Visualized | Resolution | Live-Cell Capability | Throughput | Complexity & Cost |
|---|---|---|---|---|---|
| Light Microscopy (Transmitted) | Cell shrinkage, membrane blebbing, apoptotic body formation [3] | ~200 nm (diffraction-limited) [28] | Yes (ideal for real-time) [3] [27] | ++ (Moderate) [3] | + (Low) [3] |
| Light Microscopy (Fluorescence) | Caspase activation, phosphatidylserine exposure, DNA fragmentation, mitochondrial changes [3] [26] | ~200 nm (diffraction-limited) [28] | Yes (with potential for phototoxicity) [3] | ++ (Moderate) [3] | ++ (Moderate) [3] |
| Electron Microscopy (EM) | Ultra-structural details: chromatin condensation, organelle disruption, apoptotic bodies (Gold Standard) [10] | <1 nm (Near-atomic) | No (requires fixed, sectioned samples) [10] | + (Low) | +++ (High) [10] |
| Flow Cytometry | Phosphatidylserine exposure, membrane permeability, caspase activation, DNA content [28] [4] | N/A (Population-based) | No (typically endpoint analysis) | +++ (High) [28] | +++ (High) [3] |
Key Insights from the Comparison
- Light Microscopy's Niche: Transmitted light techniques like Differential Interference Contrast (DIC) and Phase Contrast (PC) are unparalleled for non-invasively monitoring rapid morphological events like membrane blebbing and cell shrinkage in real time [3] [27]. Fluorescence LM adds specificity by allowing visualization of biochemical events using a wide array of fluorescent probes and antibodies [3] [29].
- Electron Microscopy's Role: EM remains the gold standard for confirming apoptosis based on ultrastructural morphology and is often used for definitive validation [10]. However, its requirement for fixed samples and inability to monitor dynamics limit its utility for kinetic studies.
- Flow Cytometry's Strength: FCM excels at rapidly quantifying apoptotic markers across thousands of cells, providing robust statistical power, and identifying heterogeneous subpopulations, which is a limitation of LM's smaller sample size [28] [4]. A 2025 study directly comparing Fluorescence Microscopy (FM) and Flow Cytometry (FCM) found a strong correlation (r = 0.94) in viability assessment, but noted FCM's superior precision under high cytotoxic stress [28].
Quantitative Performance Data: LM vs. Flow Cytometry
A direct methodological comparison study highlights how different techniques can yield complementary data on cell death.
Table 2: Quantitative Comparison of Viability Assessment by Fluorescence Microscopy and Flow Cytometry Data from a study treating SAOS-2 cells with Bioglass 45S5 particles (<38 µm) [28]
| Condition | Viability by Fluorescence Microscopy (FDA/PI) | Viability by Flow Cytometry (Multiparametric Staining) |
|---|---|---|
| Control (Untreated) | >97% | >97% |
| 100 mg/mL, 3 hours | 9% | 0.2% |
| 100 mg/mL, 72 hours | 10% | 0.7% |
Interpretation of Data: The data demonstrates a clear correlation between the two methods, confirming the cytotoxic trend [28]. However, the consistently lower viability percentages measured by flow cytometry suggest it has higher sensitivity, likely because it can more accurately distinguish and exclude late apoptotic and necrotic cells from the viable population based on multiparametric staining (e.g., Hoechst, DiIC1, Annexin V-FITC, PI) [28]. This underscores that while LM provides visual confirmation, FCM can offer more precise quantification, especially in high-stress scenarios.
Visualizing the Process: Signaling Pathways and Morphological Changes in Apoptosis
The hallmark features of apoptosis monitored by light microscopy are the result of a tightly regulated biochemical cascade. The following diagram illustrates the key signaling pathways leading to membrane blebbing and cell shrinkage.
Diagram Title: Signaling Pathways in Apoptotic Morphology
This diagram shows how diverse apoptotic signals converge on the activation of executioner caspases (like caspase-3), which then cleave specific cytosolic targets, leading to the activation of the actomyosin machinery responsible for cell shrinkage and blebbing [30] [26].
Experimental Protocol: Tracking Apoptosis in Real-Time via Light Microscopy
The following protocol provides a detailed methodology for observing membrane blebbing and cell shrinkage in adherent cells using light microscopy, based on established practices in the literature [3] [30].
Materials and Reagents
- Cell Line: Adherent cells (e.g., PtK, HeLa, or other relevant model) [3].
- Induction Agent: Staurosporine (1 µM prepared in DMSO) is a well-characterized inducer of intrinsic apoptosis [3] [30].
- Microscopy Equipment: Inverted light microscope equipped with DIC or Phase Contrast optics, a temperature and CO₂ incubation system, and a high-sensitivity camera for time-lapse imaging [3].
- Culture Vessels: MatTek glass-bottom dishes or similar imaging-optimized plates [3].
Step-by-Step Procedure
- Cell Preparation and Plating: Plate cells onto MatTek dishes at an appropriate density (e.g., 30,000 cells per 35 mm dish) in phenol-red-free growth medium. Allow cells to adhere for 24 hours under standard culture conditions (37°C, 5% CO₂) [3].
- Induction of Apoptosis: Prepare a working solution of staurosporine (e.g., 1 µM) in pre-warmed, phenol-red-free medium. Replace the culture medium in the dish with the staurosporine-containing medium. A control dish should receive medium with an equivalent volume of DMSO vehicle [3] [30].
- Microscope Setup and Image Acquisition:
- Mount the dish on the pre-warmed microscope stage maintaining 37°C and 5% CO₂.
- Using a 40x or 60x oil-immersion DIC objective, locate a field of healthy, well-spread cells.
- Configure time-lapse acquisition software (e.g., Nikon Elements or equivalent) to capture images at a rate of 2-4 frames per minute for a duration of 2-4 hours [3].
- Begin acquisition approximately 30 minutes after adding the inducer to capture the onset of morphological changes [3].
- Data Analysis: Review the time-lapse sequence. Quantify the percentage of cells exhibiting membrane blebbing and/or significant cell shrinkage over time. Measure the size of cells in the field of view using image analysis software (e.g., ImageJ) to quantify shrinkage.
The Scientist's Toolkit: Essential Reagents for Apoptosis Imaging
Successful apoptosis monitoring often relies on a suite of reagents and tools designed to probe specific aspects of the cell death process.
Table 3: Key Reagent Solutions for Apoptosis Research
| Reagent / Assay | Target/Antigen | Function & Application in Apoptosis Detection |
|---|---|---|
| Staurosporine | Protein Kinases | A broad-spectrum kinase inhibitor commonly used to experimentally induce intrinsic apoptosis in cell models [3] [30]. |
| Annexin V-FITC | Phosphatidylserine (PS) | Binds to PS exposed on the outer leaflet of the plasma membrane, a key early event in apoptosis. Used in fluorescence microscopy and flow cytometry [28] [4]. |
| Propidium Iodide (PI) | DNA | A membrane-impermeant DNA dye that stains late apoptotic and necrotic cells with compromised plasma membrane integrity. Used to distinguish viability [28] [4]. |
| Caspase-3 Antibodies | Cleaved Caspase-3 | Detect the active (cleaved) form of the key executioner caspase, serving as a definitive biochemical marker of apoptosis via ICC, IHC, or Western Blot [29] [26]. |
| NucView 488 Caspase-3/7 Substrate | Active Caspase-3/7 | A cell-permeable, non-fluorescent probe that becomes fluorescent upon cleavage by caspase-3/7, allowing real-time visualization of caspase activity in live cells [3]. |
| Hoechst 33342 | DNA | A cell-permeable nuclear stain. Changes in nuclear morphology (condensation, fragmentation) can be visualized in apoptotic cells [28] [3]. |
| Membrane Blebbing Inhibitors | MLCK / Rho Kinase | Inhibitors like specific MLCK inhibitors (e.g., ML-7) or Rho kinase inhibitors can be used to experimentally dissect the signaling mechanism controlling membrane blebbing [30]. |
Light microscopy remains an indispensable tool in the apoptosis researcher's arsenal, offering the unique ability to visually capture the dynamic processes of membrane blebbing and cell shrinkage as they unfold in real time. While techniques like electron microscopy provide superior ultrastructural detail and flow cytometry offers high-throughput quantification, LM's capacity for live-cell imaging makes it ideal for kinetic studies and initial morphological assessment. A sophisticated approach often involves using light microscopy for real-time observation and hypothesis generation, followed by more targeted, quantitative techniques like flow cytometry or Western blotting for validation and deeper mechanistic insight. Understanding the strengths and limitations of each method allows researchers to design robust experimental strategies for unraveling the complexities of programmed cell death.
The comparison between electron microscopy (EM) and light microscopy (LM) for apoptosis research hinges on a critical trade-off: the unparalleled spatial resolution of EM versus the dynamic, live-cell capabilities of LM. Electron microscopy has been pivotal in defining the ultrastructural morphology of apoptosis, revealing detailed features like chromatin condensation and apoptotic bodies through techniques such as transmission electron microscopy (TEM) and focused ion beam scanning electron microscopy (FIBSEM) [7] [31]. However, EM is inherently an "end-point" detection method, requiring extensive sample preparation, offering no temporal resolution, and preventing the monitoring of living cells [31] [3]. In contrast, light microscopy, especially when combined with advanced fluorescent probes, enables real-time, non-invasive observation of the biochemical events preceding these morphological changes [3]. This capability for live-cell imaging allows researchers to track the progression of apoptosis within the same cell population over time, from initial initiation signals to final cell dismantling. This guide focuses on the latest fluorescent probes that empower LM to not only match but exceed the functional insights of EM for specific applications in apoptosis research, providing researchers with data on kinetics and cellular localization that are inaccessible through EM alone.
Phosphatidylserine Exposure Probes
The externalization of phosphatidylserine (PS) from the inner to the outer leaflet of the plasma membrane is a hallmark early event of apoptosis. For years, the gold standard for its detection has been Annexin V (AnV), a 35 kDa protein that binds PS in a calcium-dependent manner [32]. However, novel probes are addressing the limitations of AnV.
The table below compares the performance characteristics of traditional Annexin V with a modern fluorogenic alternative, P-IID.
Table 1: Performance Comparison of Phosphatidylserine Detection Probes
| Feature | Annexin V-Fluorophore Conjugates | P-IID Probe |
|---|---|---|
| Binding Mechanism | Protein-based, Ca²⁺-dependent PS binding [32] | Synthetic Zn²⁺-dipicolylamine complex; Intramolecular Indicator Displacement (IID) [33] [32] |
| Signal Type | Always fluorescent; requires wash steps to reduce background [32] | Fluorogenic ("turn-on") upon PS binding [33] [32] |
| Kinetics | Slow binding kinetics [32] | Rapid binding kinetics [33] |
| Key Requirements | Requires Ca²⁺-containing binding buffer [32] | No Ca²⁺ required; works in the absence of Ca²⁺ and at low temperatures (4°C) [32] |
| Best Use Cases | End-point quantification of early apoptosis (flow cytometry) [32] | Real-time, time-lapse imaging of apoptosis; staining without wash steps [33] [32] |
Experimental Protocol: Staining Apoptotic Cells with P-IID for Confocal Microscopy
The following protocol is adapted for using P-IID with HeLa, MCF-7, or HCC1806 cells cultured in DMEM on a glass-bottom dish or chambered slide [32].
- Induction of Apoptosis: Prepare a 10 µM solution of camptothecin in culture medium from a 1 mM stock solution in HEPES buffer with 1% DMSO. Incubate cells for 4 hours at 37°C and 5% CO₂.
- Probe Preparation: Prepare a 500 nM working solution of P-IID in FluoroBrite DMEM or HEPES buffer.
- Staining: Following the 4-hour camptothecin incubation, replace the medium with the 500 nM P-IID working solution. Incubate for 5 minutes at 37°C and 5% CO₂.
- Imaging: Image the cells directly without washing, using a confocal microscope. The fluorogenic signal can be detected using standard FITC/GFP filter sets (excitation ~488 nm, emission ~500-550 nm) [32].
Figure 1: P-IID 'Turn-On' Mechanism. The diagram illustrates the intramolecular indicator displacement (IID) mechanism of the P-IID probe upon binding to externalized phosphatidylserine (PS), resulting in a fluorescent signal.
Caspase Activation Probes
Caspases, a family of cysteine proteases, are the central executioners of apoptosis. Activity-based fluorescent probes for caspases provide a direct functional readout of the cell death process. These probes are typically designed with a caspase-specific cleavage sequence linking a fluorophore to a quencher, or in the case of bioluminescence, a luciferin analog.
Table 2: Comparison of Caspase-Activatable Fluorescent and Bioluminescent Probes
| Probe Name / Target | Mechanism | Key Performance Data | Application Context |
|---|---|---|---|
| Caspase-1 Probe (FPy1) | FRET-based probe using –FLTDG– peptide (derived from GSDMD) [34] | Based on GSDMD-derived –FLTDG– sequence; superior signal-to-background vs. older –YVAD–/–WEHD– probes [34] | Pyroptosis imaging; high-content screening of caspase-1 inhibitors in cells & 3D spheroids [34] |
| Caspase-3/7 Probes (e.g., NucView 488) | Cell-permeable, non-fluorescent substrate cleaved by caspase-3/7 to release DNA dye [3] | Allows real-time visualization of caspase-3/7 activity and nuclear morphology in live cells [3] | Live-cell imaging of apoptosis; compatible with time-lapse microscopy [3] |
| Caspase-8 Probe (Ac-IETD-Amluc) | Bioluminescence probe; Caspase-8 cleaves Ac-IETD to release D-Aminoluciferin (Amluc) [35] | Limit of detection: 0.082 g/L for Caspase-8; 3.7-fold signal increase in pyroptosis cells; enables in vivo tumor imaging [35] | In vivo bioluminescence imaging of apoptosis & pyroptosis; deep-tissue imaging with low background [35] |
Experimental Protocol: Monitoring Caspase-1 Activity with FPy1 in Macrophages
This protocol outlines the use of the FPy1 probe for monitoring NLRP3 inflammasome-mediated caspase-1 activation in primary macrophages [34].
- Cell Preparation and Stimulation: Seed primary macrophages in a black-walled, clear-bottom microplate. Prime the cells with LPS (e.g., 100 ng/mL for 3-4 hours) to activate the NLRP3 inflammasome.
- Probe Incubation: Add the FPy1 probe to the culture medium at the optimized working concentration (e.g., 1-5 µM) and incubate for 30-60 minutes at 37°C.
- Activation and Imaging: To induce pyroptosis, add ATP (e.g., 5 mM) to the cells. Immediately transfer the plate to a high-content imaging system or confocal microscope. Acquire time-lapse images using appropriate filter sets for the rhodamine-based donor (e.g., excitation ~550 nm, emission ~570 nm) [34].
- Data Analysis: The increase in fluorescence intensity over time, resulting from FRET disruption upon caspase-1 cleavage, is quantified and correlates directly with caspase-1 activity.
Figure 2: Apoptosis Signaling Pathways. The diagram illustrates the extrinsic and intrinsic pathways of apoptosis, converging on the activation of executioner caspases-3/7, which are common targets for activity-based probes.
DNA Fragmentation Probes
DNA fragmentation is a late-stage event in apoptosis, resulting in oligonucleosomal fragments. While the TUNEL (TdT dUTP Nick-End Labeling) assay is a established method for detecting DNA breaks, it is typically fixed-cell-based. For live-cell imaging, DNA-binding dyes are the primary tool.
Table 3: Methods for Detecting DNA Fragmentation in Apoptosis
| Method | Principle | Key Performance Data | Application Context |
|---|---|---|---|
| TUNEL Assay | Enzyme (TdT) adds fluorescently-labeled dUTP to 3'-ends of DNA breaks [3] | High specificity for apoptotic cells; requires cell fixation and permeabilization [3] | End-point detection in fixed cells/tissues; considered a gold standard for DNA fragmentation [3] |
| Cell-Free DNA (CFD) Assay | Fluorescent dye (PicoGreen) directly binds double-stranded DNA in plasma/serum [36] | Linear range: 1-1000 ng/ml (R²=0.998); optimal plasma dilution 1:50; sensitive to pre-analytical storage [36] | Non-invasive biomarker for monitoring total cell death (e.g., in cancer patients); no DNA extraction needed [36] |
| Live-Cell DNA Dyes (e.g., Hoechst, DAPI) | Cell-permeable dyes bind minor groove of DNA, showing condensed chromatin in apoptosis [3] | Allows real-time observation of nuclear morphology changes (condensation, fragmentation) [3] | Live-cell imaging; can be combined with other fluorescent probes for multiparametric analysis [3] |
Experimental Protocol: Direct Fluorescence-based Cell-Free DNA Assay
This protocol enables the direct quantification of cell-free DNA (CFD) in plasma without the need for DNA extraction or amplification, useful for monitoring apoptosis in vivo [36].
- Sample Collection and Processing: Collect whole blood in EDTA tubes. Process plasma by centrifugation at 3,000 x g for 10 minutes within 1 hour of collection for optimal stability. Store plasma at -80°C if not used immediately.
- Sample Dilution: Thaw plasma samples on ice. Dilute plasma 1:50 in TE buffer (10 mM Tris-HCl, 1 mM EDTA, pH 7.5) in a black 96-well plate.
- Staining: Prepare a working solution of Quant-iT PicoGreen dsDNA reagent by diluting it 400-fold in TE buffer. Add an equal volume of this working solution to each well containing the diluted plasma sample (e.g., 100 µl sample + 100 µl PicoGreen). Mix gently and incubate for 2-5 minutes at room temperature, protected from light.
- Fluorescence Measurement: Read the fluorescence intensity using a microplate reader with excitation at ~485 nm and emission at ~535 nm.
- Data Analysis: Calculate CFD concentrations by interpolating sample fluorescence against a standard curve generated with known concentrations of salmon sperm DNA (e.g., 0-1000 ng/ml) [36].
The Scientist's Toolkit: Essential Research Reagents
Table 4: Key Reagent Solutions for Fluorescent Apoptosis Detection
| Reagent / Tool | Function in Apoptosis Detection | Example Use Case |
|---|---|---|
| P-IID Probe | Fluorogenic detection of externalized phosphatidylserine (PS) on the cell surface [33] [32] | Real-time, time-lapse imaging of early apoptosis without wash steps [32] |
| Caspase-Specific Probes (e.g., FPy1, NucView 488, Ac-IETD-Amluc) | Target-specific detection of caspase enzyme activity (Caspase-1, -3/7, -8) [34] [3] [35] | Distinguishing between apoptosis and pyroptosis; high-throughput inhibitor screening; in vivo imaging [34] [35] |
| PicoGreen dsDNA Reagent | Quantitative fluorescence detection of double-stranded DNA, including cell-free DNA [36] | Measuring CFD levels in plasma/serum as a non-invasive biomarker of cell death [36] |
| Staurosporine | Broad-spectrum protein kinase inhibitor used to induce intrinsic apoptosis experimentally [3] | A positive control for inducing apoptosis in 2D cell cultures and 3D spheroids [3] |
| Camptothecin | Topoisomerase I inhibitor that induces DNA damage and triggers the intrinsic apoptotic pathway [32] | A positive control for inducing apoptosis in cell lines like HeLa and MCF-7 [32] |
Figure 3: Multi-Parametric Apoptosis Detection Workflow. The diagram shows how different fluorescent probes target specific temporal events in apoptosis, enabling comprehensive analysis via light microscopy from initiation to late stages.
Electron microscopy (EM) remains the gold standard for the definitive identification of apoptotic cell death, providing unparalleled resolution of key ultrastructural features such as chromatin condensation and organelle alterations. While light microscopy and flow cytometry offer high-throughput capabilities for apoptosis screening, they lack the resolution to visualize these definitive morphological hallmarks. This guide objectively compares the performance of transmission electron microscopy (TEM), scanning electron microscopy (SEM), and advanced 3D EM techniques against light microscopy methods, providing researchers and drug development professionals with experimental data and protocols to inform their methodological selection for apoptosis research.
Apoptosis, or programmed cell death, is a critical process in development, tissue homeostasis, and disease pathogenesis, including cancer and neurodegenerative disorders. The term "apoptosis" was originally coined based on specific morphological characteristics observed via electron microscopy [2] [10]. While biochemical and fluorescence-based methods have since been developed, ultrastructural analysis by EM remains the definitive method for confirming apoptotic cell death, as it allows direct visualization of hallmark features at the subcellular level [37] [1]. This guide provides a comparative analysis of EM technologies and their application in visualizing the key ultrastructural events of apoptosis, particularly chromatin condensation and organelle changes, within the broader context of microscopy-based apoptosis research.
Comparative Analysis of Microscopy Techniques for Apoptosis Detection
The following table summarizes the core capabilities of different microscopy techniques used in apoptosis research, highlighting the unique strength of EM in providing definitive ultrastructural confirmation.
Table 1: Technique Comparison for Apoptosis Detection
| Technique | Key Detectable Features | Resolution Limit | Primary Application in Apoptosis Research | Throughput |
|---|---|---|---|---|
| Transmission Electron Microscopy (TEM) | Chromatin condensation, nuclear fragmentation, organelle integrity, mitochondrial fission, apoptotic bodies [2] [1] | ~0.1 nm | Definitive ultrastructural analysis and confirmation of apoptosis; "gold standard" [10] [37] | Low |
| Scanning Electron Microscopy (SEM) | Membrane blebbing, cell shrinkage, apoptotic body formation, surface smoothing [38] [1] | ~0.4 nm | 3D surface morphology and plasma membrane changes | Low |
| 3D Volume EM (e.g., FIB-SEM, SBF-SEM) | All TEM features in 3D, volumetric reconstruction of organelles and condensed chromatin [39] | Varies (z-resolution ~10 nm for FIB-SEM) | 3D ultrastructural analysis of complex cellular architecture | Very Low |
| Light Microscopy (Phase/DIC) | Cell shrinkage, membrane blebbing, apoptotic body formation (as refractile bodies) [3] [37] | ~200 nm | Live-cell imaging and initial, non-specific screening | High |
| Fluorescence Microscopy | Nuclear condensation/fragmentation (via Hoechst), caspase activation, phosphatidylserine externalization (Annexin V) [3] [37] | ~200 nm | Specific, high-throughput screening of biochemical events | High |
Visualizing the Hallmarks of Apoptosis via Electron Microscopy
Electron microscopy provides a definitive diagnosis of apoptosis by revealing a characteristic sequence of subcellular changes that are not fully resolvable by other methods.
Nuclear Changes: Chromatin Condensation and Fragmentation
The most diagnostic feature of apoptosis is the specific pattern of chromatin condensation and nuclear fragmentation. Under TEM, this is observed as:
- Pyknosis: Marked condensation of nuclear chromatin, which appears as dense, electron-dense masses [2] [1].
- Crescent Formation: The condensed chromatin often aggregates at the nuclear periphery, forming a characteristic crescent or half-moon shape against the intact nuclear membrane [2] [37].
- Karyorrhexis: The nucleus breaks up into discrete, membrane-bound apoptotic bodies containing tightly packed chromatin and intact organelles [2] [1]. This is a key distinguishing feature from necrosis, where the nucleus typically swells and lyses rather than fragmenting in an organized manner.
Cytoplasmic and Organelle Alterations
Concurrent with nuclear changes, the cytoplasm undergoes a dramatic reorganization.
- Mitochondrial Changes: While the integrity of most organelles is preserved early in apoptosis, mitochondria often undergo fission and remodeling [40] [1]. A critical pre-apoptotic event is the remodeling of mitochondria-ER contact sites (MAMs), which can be visualized by TEM [40].
- Membrane Blebbing: The cell membrane forms numerous small, surface protrusions known as blebs. SEM is particularly powerful for visualizing this process, showing the surface of a cell becoming convoluted with blebs [38] [37].
- Formation of Autophagic Structures: During the differentiation of certain cells, such as erythroblasts, an increase in autophagic structures like autophagosomes is observed, which are involved in organelle clearance [40].
The following diagram illustrates the key morphological transitions a cell undergoes during apoptosis, as visualized through electron microscopy.
Experimental Protocols for EM-Based Apoptosis Analysis
To achieve the high-quality results shown in the comparative data, standardized protocols for sample preparation and imaging are critical.
Protocol 1: Standard TEM Sample Preparation for Cultured Cells
This protocol is adapted from studies on erythroid differentiation and leukemia cell lines [40] [38].
- Fixation: Harvest cells and pellet by gentle centrifugation. Primary fixation is performed using 2.5% glutaraldehyde in a 0.1 M sodium cacodylate buffer (pH 7.4) for a minimum of 2 hours at 4°C.
- Washing: Wash the cell pellet 3 times in 0.1 M sodium cacodylate buffer, 10 minutes per wash.
- Post-Fixation: Secondary fixation with 1% osmium tetroxide in the same buffer for 1-2 hours at 4°C. This step enhances membrane contrast.
- Dehydration: Dehydrate the sample through a graded series of ethanol or acetone (e.g., 35%, 50%, 75%, 90%, and 100%), with 10-minute intervals for each concentration.
- Embedding: Infiltrate cells with a resin, such as EPON or Spurr's, typically through a resin/acetone mixture before pure resin. Embed in fresh resin and polymerize at 60°C for 48 hours.
- Sectioning and Staining: Use an ultramicrotome to cut 80-100 nm thin sections. Mount sections on grids and stain with uranyl acetate and lead citrate to increase contrast for imaging.
Protocol 2: Scanning Electron Microscopy (SEM) for Surface Morphology
This protocol is used to visualize membrane blebbing and is adapted from work on WEHI-3B leukemia cells [38].
- Seeding and Fixation: Seed cells on polylysine-coated coverslips. After treatment, fix cells with 2.5% glutaraldehyde in 0.1 M sodium cacodylate buffer.
- Dehydration: Dehydrate the samples through a graded ethanol series as described in the TEM protocol.
- Drying and Mounting: Critical point dry the samples to preserve surface structure without collapse. Mount the coverslips onto stubs using conductive adhesive.
- Coating: Sputter-coat the sample with a thin layer (10-20 nm) of gold-palladium to render it conductive.
- Imaging: Observe and image the cells under the SEM, typically at accelerating voltages of 5-15 kV.
Advanced 3D Ultrastructural Analysis
Volume electron microscopy (vEM) techniques extend traditional 2D TEM into the third dimension, allowing for the volumetric reconstruction of apoptotic cells. The main techniques and their trade-offs are summarized below.
Table 2: Comparison of Volume Electron Microscopy (vEM) Techniques
| Technique | Sectioning Method | Key Advantage | Key Limitation | Optimal Use Case in Apoptosis Research |
|---|---|---|---|---|
| FIB-SEM | Focused Ion Beam milling [39] | Superior Z-resolution (can be <10 nm) [39] | Limited volume depth (<1 mm); slow imaging; destructive [39] | High-resolution 3D analysis of organelle contact sites (e.g., MAMs) |
| SBF-SEM | Diamond knife inside SEM [39] | Fully automated; larger volumes than FIB-SEM | Destructive; potential for cutting artifacts; sample charging [39] | Automated acquisition for 3D analysis of multiple cells in a tissue |
| Array Tomography | Ultramicrotome, sections collected on substrate [39] | Non-destructive (sections can be re-imaged); widest section size (~4 mm) [39] | Risk of section loss; complex image alignment [39] | Correlative microscopy; revisiting specific structures of interest |
Research Reagent Solutions for EM Apoptosis Studies
The following table details essential reagents and their specific functions in preparing samples for ultrastructural analysis of apoptosis.
Table 3: Essential Research Reagents for EM Apoptosis Analysis
| Reagent/Chemical | Function in Protocol | Key Application in Apoptosis Research |
|---|---|---|
| Glutaraldehyde | Primary fixative that cross-links proteins, stabilizing cellular structure [38] [1] | Preserves the exact morphology at the moment of fixation (e.g., blebs, condensed chromatin) |
| Osmium Tetroxide | Secondary fixative that binds to lipids, stabilizing membranes and providing contrast [38] [1] | Enhances visibility of membranes (organelles, nuclear envelope) and apoptotic bodies |
| Uranyl Acetate & Lead Citrate | Heavy metal stains that bind to cellular components (e.g., nucleic acids, membranes) [1] | Provides electron density for high-contrast imaging of chromatin and organelles |
| Resin Embedding Medium (e.g., EPON) | Infiltrates and encapsulates the fixed sample, allowing for ultra-thin sectioning [38] [39] | Provides structural support to create sections thin enough for electron beam penetration |
Electron microscopy stands as an indispensable tool in the cell death researcher's arsenal, providing the definitive ultrastructural confirmation of apoptosis that light microscopy and biochemical assays cannot. While lower-resolution methods are invaluable for screening and kinetic studies, TEM remains the "gold standard" for identifying the pathognomonic features of chromatin condensation and karyorrhexis. The choice between 2D TEM, SEM, and advanced 3D vEM techniques should be guided by the specific research question, weighing the need for surface detail, internal ultrastructure, or volumetric data against practical considerations of throughput, cost, and technical complexity. For any study where conclusive morphological evidence of apoptosis is required, EM provides the critical data that underpins robust scientific conclusions.
The study of complex biological processes like apoptosis requires tools that can capture both dynamic cellular events and high-resolution structural details. Correlative Light and Electron Microscopy (CLEM) has emerged as a powerful approach that integrates the complementary strengths of both modalities, enabling researchers to link cellular dynamics with ultrastructural transformation. While light microscopy (LM) excels at visualizing dynamic processes in living cells through fluorescent markers and time-lapse imaging, electron microscopy (EM) provides unparalleled resolution of cellular ultrastructure in fixed samples. The integration of these techniques is particularly valuable in apoptosis research, where dynamic early events lead to definitive morphological endpoints that define this programmed cell death pathway.
CLEM addresses a fundamental limitation in classical electron microscopy: its static nature. As Marshall et al. (2023) note, "A challenge of classical electron microscopy (EM) modalities is the static and limited view they present of dynamic biological processes." [41] By combining precise temporal information from LM with spatial detail from EM, CLEM provides a more comprehensive understanding of biological mechanisms, making it especially suitable for studying the sequential morphological changes that characterize apoptosis.
Technical Comparison: CLEM Versus Standalone Microscopy Approaches
Capability Analysis for Apoptosis Research
Table 1: Comparison of microscopy techniques for apoptosis detection
| Technique | Resolution | Temporal Data | Key Apoptotic Features Detectable | Primary Limitations |
|---|---|---|---|---|
| Light Microscopy (LM) | ~200 nm | Excellent (live-cell capable) | Cell shrinkage, membrane blebbing, caspase activation (with probes) | Limited resolution, potential probe toxicity [42] |
| Electron Microscopy (EM) | ~0.1 nm | None (fixed samples only) | Chromatin condensation, mitochondrial remodeling, apoptotic bodies | Static view only, small sampling area [43] [44] |
| CLEM | LM: ~200 nmEM: ~0.1 nm | Good (correlated dynamics) | All features detectable at appropriate scales | Complex workflow, registration challenges [41] |
Performance Metrics in Experimental Applications
Table 2: Quantitative performance comparison for apoptosis detection
| Technique | Detection Sensitivity | Spatial Context | Multiplexing Capability | Throughput |
|---|---|---|---|---|
| LM-based Methods | High for early events (e.g., phosphatidylserine exposure) [4] | Maintains tissue architecture | Excellent (multiple fluorescent probes) | High |
| EM-based Methods | High for late structural changes [43] | Limited ultrastructural field | Limited (typically 1-2 contrasts) | Low |
| CLEM Approaches | High across process timeline | Comprehensive (cellular to ultrastructural) | Moderate (limited by probe compatibility) | Moderate to low |
Experimental Implementation: CLEM Workflows for Apoptosis Detection
Integrated CLEM Protocol for Apoptosis Analysis
The successful application of CLEM to apoptosis research requires careful experimental design that preserves both dynamic information and structural integrity. The following workflow represents a standardized approach for correlative studies:
Live-Cell Imaging Phase: Culture cells expressing fluorescent markers (e.g., nuclear labels, caspase sensors) and treat with apoptosis-inducing agents. Acquire time-lapse data to capture dynamic apoptotic events such as membrane blebbing, cell shrinkage, and nuclear fragmentation. As demonstrated in transformer-based detection systems, this phase can identify "the location and duration of multiple apoptotic events in full microscopy timelapses." [42]
Correlation and Targeting: Using specialized software, identify regions of interest containing apoptotic cells based on morphological criteria established during live imaging. Create coordinate maps to relocate these specific cells during subsequent EM processing.
Sample Fixation and Preparation: Fix cells with a combination of aldehydes (e.g., 4% paraformaldehyde, possibly with 0.2% glutaraldehyde) to preserve ultrastructure. For DNA fragmentation detection, some protocols employ "a modification of the TdT-mediated dUTP nick end-labeling (TUNEL) technique" on LR White-embedded samples. [45]
EM Processing and Imaging: Process samples through standard EM preparation including post-fixation with osmium tetroxide, dehydration, and resin embedding. Section samples and acquire high-resolution images of the previously identified apoptotic cells.
Image Correlation and Analysis: Align LM and EM datasets using fiduciary markers or pattern recognition software to precisely overlay dynamic information with ultrastructural details.
Technical Variations and Methodological Adaptations
Different research questions require adaptations to the standard CLEM workflow:
For 3D structural analysis: CLEM can be "paired with focused ion beam-scanning EM (FIB-SEM), cryo-EM, transmission EM (TEM), and serial block-face SEM (SBF-SEM)." [41]
For enhanced LM resolution: Super-resolution techniques such as "structured illumination microscopy (SIM), stimulated emission depletion (STED), and total internal reflection fluorescence (TIRF)" can be integrated. [41]
For DNA fragmentation studies: A modified TUNEL technique can be applied to "LR White semithin and consecutive thin sections" for combined histochemical (LM) and ultrastructural (EM) analysis. [45]
Diagram 1: Integrated CLEM workflow for apoptosis analysis
Key Research Reagent Solutions for CLEM Apoptosis Studies
Table 3: Essential reagents and materials for CLEM apoptosis research
| Reagent/Material | Function | Application Example |
|---|---|---|
| Fluorescent Nuclear Markers (e.g., H2B-GFP) | Visualize nuclear morphology and dynamics in live cells | Tracking chromatin condensation and nuclear fragmentation in epithelial cells [42] |
| Caspase Activity Sensors | Detect caspase activation as early apoptotic indicator | FRET-based reporters for initiator and executioner caspases |
| Annexin V Probes | Label phosphatidylserine externalization on plasma membrane | Early apoptosis detection in conjunction with DNA binding dyes [4] [46] |
| Aldehyde Fixatives (paraformaldehyde, glutaraldehyde) | Preserve cellular structure while maintaining fluorescence | Combination fixation (4% paraformaldehyde, 0.2% glutaraldehyde) for LR White embedding [45] |
| LR White Resin | Embedding medium compatible with both histochemistry and EM | Sectioning for combined TUNEL staining and ultrastructural analysis [45] |
| TUNEL Reagents | Label DNA strand breaks characteristic of late apoptosis | Modified TUNEL with streptavidin-conjugated gold for EM detection [45] |
Signaling Pathways in Apoptosis: Connecting Molecular Events to Morphological Changes
The morphological changes observed through CLEM during apoptosis result from the activation of specific biochemical pathways. The intrinsic (mitochondrial) pathway involves mitochondrial outer membrane permeabilization (MOMP), leading to the release of cytochrome c and other pro-apoptotic factors. As Sun et al. (2007) demonstrated using 3D electron microscope tomography, "a remodelling of the inner mitochondrial membrane into many separate vesicular matrix compartments... accompanies release of proteins" during apoptosis. [43] This structural transformation facilitates the release of intermembrane space proteins that activate caspases.
The extrinsic (death receptor) pathway initiates at the plasma membrane through ligand-receptor interactions, leading to caspase activation. Both pathways converge on executioner caspases that mediate the systematic dismantling of cellular structures, including cleavage of nuclear lamins (causing nuclear shrinkage), activation of endonucleases (causing DNA fragmentation), and regulation of ROCK I protein (causing membrane blebbing).
Diagram 2: Apoptosis signaling pathways and structural outcomes
Application Case Study: Mitochondrial Transformation During Apoptosis
A seminal application of CLEM in apoptosis research comes from the work of Sun et al. (2007), who employed correlated three-dimensional light and electron microscopy to reveal the transformation of mitochondria during apoptosis. [43] In this study:
Experimental Protocol: HeLa cells treated with etoposide were first analyzed by fluorescence microscopy to characterize the apoptotic state, followed by electron microscopy and 3D electron microscope tomography of the identical cells.
Key Findings: The research identified "a remodelling of the inner mitochondrial membrane into many separate vesicular matrix compartments that accompanies release of proteins" from the intermembrane and intracristal spaces. [43] This structural reorganization occurred without immediate mitochondrial swelling, which was observed only late in apoptosis after cytochrome c release and loss of mitochondrial membrane potential.
Technical Advantage: The correlated approach enabled researchers to precisely link the functional state of apoptosis (confirmed by fluorescence microscopy) with specific ultrastructural transformations that would be impossible to identify with either technique alone.
This case study exemplifies how CLEM provides unique insights into subcellular events that underlie the apoptotic process, connecting dynamic functional changes with their structural correlates.
Emerging Technologies and Future Directions
The field of correlative microscopy continues to evolve with several promising technological developments:
Deep Learning Integration: Transformer-based deep learning systems like ADeS (Apoptosis Detection System) now demonstrate "classification accuracy above 98% and outperforming state-of-the-art solutions" for detecting apoptosis in live-cell imaging. [42] Such computational approaches can enhance CLEM workflows by automatically identifying rare apoptotic events for subsequent EM analysis.
Advanced Probe Development: Future progress depends on "multimodal probes showing electron density and fluorescence activity" that allow greater integration of LM and EM modalities. [41]
Workflow Automation: Challenges in aligning LM and EM micrographs due to "differences in resolution and sample shrinkage" [41] are being addressed through improved computational alignment algorithms and standardized fiducial markers.
Expanded Applications: CLEM approaches are becoming sensitive enough for applications such as "virus–host cell membrane interactions" and can "localize the distribution of specific proteins or structures within a sample and correlate this information with the ultrastructural details provided by EM." [41]
These technological advances promise to increase the throughput, accuracy, and accessibility of CLEM approaches, further establishing their value in apoptosis research and therapeutic development.
Overcoming Technical Challenges: A Guide to Artifact-Free Apoptosis Imaging
The accurate detection of apoptosis is fundamental to advancing our understanding of cellular biology, disease mechanisms, and the efficacy of therapeutic agents. Within this field, electron microscopy (EM) is historically revered as the "gold-standard" for its unparalleled ability to reveal ultrastructural details, while light microscopy (LM) offers versatility and the capacity for live-cell imaging [10] [3]. However, the integrity of any microscopic analysis is entirely dependent on the quality of sample preparation. It is a critical yet often overlooked reality that the preparation process itself can induce unintended non-apoptotic cell death, such as necrosis, necroptosis, or pyroptosis, thereby compromising experimental results and leading to erroneous conclusions [47] [48]. This guide objectively compares EM and LM for apoptosis research, with a focused examination on the sample preparation pitfalls that can artifactually alter cell death phenotypes.
Morphological Hallmarks: A Guide for Microscopy-Based Identification
The definitive classification of cell death relies on recognizing distinct morphological features. The following table provides a clear comparison to aid in identification.
Table 1: Morphological Hallmarks of Different Cell Death Modalities
| Cell Death Type | Nuclear Changes | Cytoplasmic & Organelle Changes | Plasma Membrane & Inflammatory Response |
|---|---|---|---|
| Apoptosis | Chromatin condensation (pyknosis), nuclear fragmentation (karyorrhexis) [49] [50] | Cell shrinkage, cytoplasmic condensation, dense cytoplasm, organelle preservation (early stages) [49] [50] | Membrane blebbing, formation of apoptotic bodies; silent, non-inflammatory death [49] [51] |
| Necrosis/Necroptosis | Nuclear dehydration (pyknosis) and subsequent disintegration [49] | Cytoplasmic swelling (oncosis), dilation of organelles (e.g., Golgi, mitochondria, ER) [49] [50] | Plasma membrane rupture, spillage of cytoplasmic contents; pro-inflammatory death [49] [50] |
| Pyroptosis | Not typically characterized by classic apoptotic nuclear changes [49] | Cytoplasmic swelling [49] | Rapid plasma membrane rupture, release of pro-inflammatory intracellular contents [49] |
Visualizing Morphological Differences
The diagram below illustrates the key morphological differences between apoptosis, necrosis, and pyroptosis to aid in visual identification.
Comparative Analysis: Electron Microscopy vs. Light Microscopy
The choice between EM and LM involves a trade-off between resolution, functionality, and the risk of introducing artifacts during sample preparation. The following table provides a detailed comparison of these two imaging pillars in the context of cell death research.
Table 2: Objective Comparison of Electron Microscopy and Light Microscopy for Apoptosis Research
| Parameter | Electron Microscopy (EM) | Light Microscopy (LM) |
|---|---|---|
| Resolution | <1 nm (Ultra-structural level) [10] | ~200 nm (Cellular and sub-cellular level) [3] |
| Key Strength | Gold-standard for definitive morphology; reveals organelle-level detail (e.g., mitochondrial conformation) [10] | Live-cell, real-time imaging; high-throughput capability; multiplexing with fluorescent probes [3] [52] |
| Primary Limitation | End-point analysis only; complex, lengthy preparation; high cost [47] [10] | Lower resolution cannot confirm ultrastructural hallmarks alone [47] |
| Sample Preparation Complexity | Very High (Chemical fixation, dehydration, resin embedding, ultrathin sectioning) [47] | Low to Moderate (Viable cells, simple staining, or label-free) [3] [52] |
| Risk of Preparation-Induced Artifacts | High (Shrinkage, membrane distortion, precipitation from improper fixation/buffers) [47] | Low to Moderate (Primarily from cytotoxic stains or non-physiological imaging conditions) [3] [52] |
| Optimal Use Case | Validation: Confirmatory analysis of ambiguous cell death morphology after initial LM screening. | Screening & Dynamics: Initial detection, high-throughput compound screening, and kinetic analysis of cell death. |
| Quantitative Data Output | Morphometric analysis (e.g., organelle counting, membrane integrity) - Manual, low-throughput. | High-content, automated quantification of cell counts, fluorescence intensity, and morphological parameters. |
Critical Pitfalls in Sample Preparation and Mitigation Strategies
The journey from a living cell to a prepared sample is fraught with potential hazards that can induce non-apoptotic death. Understanding these pitfalls is the first step to avoiding them.
Sample Preparation Workflow and Key Risks
The following diagram maps the general workflow for preparing samples for microscopy, highlighting critical points where artifacts can be introduced.
Detailed Pitfalls and Experimental Protocols for Mitigation
Pitfall 1: Chemical and Physical Stress During Cell Handling Cells are highly sensitive to their environment. Common culture manipulations can be a primary source of stress, inducing non-apoptotic death.
- Experimental Data: Studies note that failure to maintain homeostatic conditions during live-cell imaging—such as hypoxia, high temperature, and pH changes—can trigger cell death [3]. Furthermore, the toxicity introduced by fluorescent stains can eventually kill cells, preventing long-term investigation [52].
- Protocol for Mitigation:
- Detachment: Use enzyme-free dissociation buffers or low-concentration, high-purity trypsin for minimal time to preserve membrane integrity.
- Environment: Use stage-top incubators for live-cell imaging to strictly regulate temperature (37°C), CO₂ (5%), and humidity.
- Staining: For long-term studies, prioritize label-free techniques like Quantitative Phase Imaging (QPI) [52] or use vital dyes with low phototoxicity. Always include a vehicle control to account for solvent effects (e.g., DMSO).
Pitfall 2: Improper Fixation Leading to Artifactual Morphology Fixation is meant to "freeze" cellular structures in a life-like state. Poor fixation is a major source of artifacts misinterpreted as pathology.
- Experimental Data: The Nomenclature Committee on Cell Death (NCCD) emphasizes that fixation artifacts can profoundly impact the interpretation of cellular morphology, a cornerstone of cell death classification [47].
- Protocol for Mitigation:
- Choice of Fixative: For LM, 4% formaldehyde (from paraformaldehyde) is standard. For EM, a combination of formaldehyde and glutaraldehyde (e.g., 2.5%) is essential for cross-linking and preserving ultrastructure.
- Technique: Add pre-warmed fixative gently to the culture medium while swirling to ensure rapid and even penetration. Avoid adding fixative to a dry cell monolayer.
- Buffer and Osmolarity: Always use an appropriate physiological buffer (e.g., phosphate or cacodylate buffer) with correct osmolarity (~300 mOsm) to prevent cell swelling or shrinkage.
Pitfall 3: Cytotoxic Effects of Staining and Labeling Reagents The very reagents used to visualize cells can be their demise, particularly in live-cell assays.
- Experimental Data: A 2022 study directly compared stained and unstained HeLa cells and found that cells stained with viability reagents showed significantly lower viability over time compared to unstained cells, confirming the cytotoxic effect of the stains themselves [52].
- Protocol for Mitigation:
- Titration: Always use the lowest effective concentration of dye and the shortest possible incubation time.
- Validation: After staining, wash cells with fresh pre-warmed medium to remove excess, unbound dye.
- Alternative Methods: Implement label-free viability assessment methods, such as QPI coupled with deep learning, which can identify live and dead cells with ~95% accuracy without stains [52].
The Scientist's Toolkit: Essential Reagents and Solutions
Selecting the right tools is critical for reliable apoptosis detection while minimizing artifacts.
Table 3: Research Reagent Solutions for Cell Death Detection
| Reagent / Assay | Function / Target | Key Considerations & Pitfalls |
|---|---|---|
| Annexin V (FITC conjugate) | Binds to phosphatidylserine (PS) exposed on the outer leaflet in early apoptosis [3]. | False positives can occur in necrotic cells with permeable membranes. Requires calcium-containing buffer and propidium iodide (PI) co-staining to exclude late apoptotic/necrotic cells. |
| Propidium Iodide (PI) / DAPI | DNA-binding dyes that stain nuclei when membrane integrity is lost (necrosis/late apoptosis) [10] [3]. | PI is a dead-cell stain. It cannot enter live cells. Phototoxic; limit exposure. Can be used in flow cytometry and fluorescence microscopy. |
| Caspase-3/7 Activity Probes | Fluorogenic substrates cleaved by active executioner caspases, marking apoptotic cells [3]. | A specific marker for apoptosis. However, some types of cell death (e.g., pyroptosis) use other caspases (e.g., caspase-1). Can be used in live-cell assays but may have some cytotoxicity. |
| TUNEL Assay | Labels DNA strand breaks, a hallmark of late-stage apoptosis [10]. | Not specific for apoptosis; can also stain DNA breaks in necrotic cells [10] [48]. Requires careful optimization of proteolytic digestion to avoid over- or under-labeling. |
| Trypan Blue | A vital dye excluded by live cells with intact membranes; dead cells are stained blue [47] [10]. | A quick and easy assay for basic viability counts. However, it is low-throughput and operator-dependent. It only indicates membrane integrity, not the mode of death. |
| Antibody Cocktails (e.g., for Western Blot) | Pre-mixed antibodies against multiple apoptotic markers (e.g., cleaved Caspase-3, PARP) [53]. | Increases detection efficiency and reproducibility for biochemical confirmation. Requires high-quality antibodies and proper loading controls (e.g., β-actin) for quantification. |
| Glutaraldehyde / Formaldehyde | Primary fixatives for EM and LM, respectively. They cross-link proteins to preserve structure. | Glutaraldehyde provides superior ultrastructural fixation for EM but can autofluoresce. Formaldehyde penetrates faster but fixes less robustly. Improper use leads to major artifacts. |
Integrated Workflow for Robust Cell Death Analysis
Given the limitations and pitfalls of any single technique, the most reliable strategy is a multi-modal approach. The Nomenclature Committee on Cell Death (NCCD) strongly emphasizes the importance of performing multiple, methodologically unrelated assays to accurately quantify dying and dead cells [47].
A robust experimental workflow should proceed as follows:
- Initial Screening with LM: Use live-cell, label-free LM (e.g., phase contrast, DIC, or QPI) or fluorescent staining (Annexin V/PI) to monitor cell death kinetics and population-wide responses in a high-throughput manner [3] [52].
- Biochemical Validation: Correlate morphological observations with biochemical assays. Western blot analysis for key markers like cleaved caspase-3 and cleaved PARP can provide definitive evidence of apoptotic pathway activation [53].
- Ultimate Morphological Confirmation with EM: When cells display ambiguous morphology or when a definitive, gold-standard confirmation is required, EM should be employed. Its high resolution can unequivocally distinguish between apoptotic shrinkage, necrotic swelling, and other ultrastructural features, validating the conclusions drawn from other methods [47] [10].
By combining the strengths of LM and EM while rigorously controlling for preparation-induced artifacts, researchers can ensure the highest degree of confidence in their cell death analyses, leading to more accurate data and more impactful scientific discoveries.
In the context of apoptosis research, live-cell imaging via light microscopy (LM) provides an invaluable window into dynamic, real-time cellular events. However, the utility of these observations is often constrained by two major technical challenges: phototoxicity (light-induced cell damage) and photobleaching (the loss of fluorescence signal). These phenomena can not only compromise cell health and viability, leading to aberrant biological conclusions, but also limit the duration and quality of imaging experiments. This guide objectively compares key products and methodologies designed to mitigate these issues, framing the discussion within the broader comparison of LM and electron microscopy (EM) for studying programmed cell death. While EM offers superior resolution for ultrastructural analysis, such as visualizing the cloud-like apoptosome assemblies [5], it is inherently limited to static, endpoint observations. LM remains the only method that enables real-time detection of apoptosis, capturing dynamic processes like cell shrinkage and membrane blebbing as they occur [3] [27]. The following sections provide a data-driven comparison of culture conditions, detection methods, and imaging modalities to help researchers optimize their live-cell apoptosis assays.
Comparative Analysis of Culture Media and Microenvironments
The cellular microenvironment plays a critical role in maintaining cell health under the duress of repeated illumination. A recent systematic investigation quantified the effects of three culturing conditions—extracellular matrix (ECM), culture media, and seeding density—on the long-term health and morphology of human cortical neurons during a 33-day fluorescent imaging paradigm [54] [55].
Table 1: Quantitative Comparison of Culture Conditions for Long-Term Neuron Viability under Imaging
| Condition Category | Specific Condition | Key Performance Findings | Impact on Viability & Organization |
|---|---|---|---|
| Culture Media | Brainphys Imaging (BPI) | Supported neuron viability, outgrowth, and self-organization to a greater extent [54]. | Superior |
| Neurobasal Plus (NB) | Lower support for viability and maturation; combination with human laminin reduced survival [54] [55]. | Inferior | |
| Extracellular Matrix | Human-derived Laminin | Reduced cell survival when combined with NB medium [54]. | Variable (Synergistic) |
| Murine-derived Laminin | Standard performance, outperformed by human laminin only in specific synergistic combinations [54] [55]. | Standard | |
| Seeding Density | High (2 × 10⁵ cells/cm²) | Fostered somata clustering but did not significantly extend viability compared to low density [54]. | Enhanced Organization |
| Low (1 × 10⁵ cells/cm²) | Did not foster clustering and was more vulnerable to pro-apoptotic mediators [54] [55]. | Baseline |
The core finding was a synergistic relationship between the species-specificity of the laminin and the culture media, which was positively mediated by the light-protective, antioxidant compounds found in BPI medium [55]. This highlights that optimizing the microenvironment is a multi-factorial problem, and solutions like BPI medium are designed to actively curtail reactive oxygen species (ROS) production, a key contributor to phototoxicity [55].
Apoptosis Detection Methods: A Workflow and Comparison
A critical step in apoptosis research is choosing a detection method. The choice often involves a trade-off between simplicity, temporal resolution, and molecular specificity. The following workflow outlines the decision path for selecting an appropriate method based on experimental goals.
Figure 1: A workflow for selecting an apoptosis detection method, comparing LM and EM approaches. DIC/PC: Differential Interference Contrast/Phase Contrast.
Table 2: Comparison of Apoptosis Detection Methods and Their Characteristics
| Method | What is Monitored | Time to Complete | Complexity | Real-time Monitoring | Key Advantage |
|---|---|---|---|---|---|
| LM: Transmitted Light | Cell size/morphology (shrinkage, blebbing) [3] | Short (+) | Low (+) | Yes | Label-free; quick and simple [3] |
| LM: Fluorescence | Caspase activation, DNA fragmentation, membrane permeability [3] | Moderate (++) | Moderate (++) | Yes | Molecular specificity and high accuracy [3] |
| Novel Fluorescent Reporter | Caspase-3 activation (fluorescence switch-off) [56] | Short (+) | Low (+) | Yes | High sensitivity & simplicity in live cells [56] |
| AI-Based Nuclear Analysis | Nuclear chromatin texture changes [57] | Moderate (++) | High (+++) | Yes (potentially) | Label-free; detects very early events [57] |
| Electron Microscopy | Ultrstructural morphology, organelle details [5] | Long (+++) | High (+++) | No | Highest resolution for ultrastructure [7] [5] |
| Gel Electrophoresis | DNA fragmentation (laddering) | Moderate (++) | Moderate (++) | No | Classic biochemical confirmation |
As shown, transmitted light LM is the most straightforward and cost-effective method for real-time detection based on morphology [3]. Fluorescence LM provides a versatile platform for tracking specific biochemical events, such as using the NucView 488 kit to monitor caspase-3/7 activity [3]. A novel fluorescent reporter that switches off upon caspase-3 cleavage offers a promising combination of high sensitivity and operational simplicity [56]. For ultrastructural confirmation, such as visualizing the irregular, cloud-like assemblies of the apoptosome formed by Apaf1, EM is unparalleled but restricted to endpoint analysis [5]. Correlative Light and Electron Microscopy (CLEM) bridges this gap, allowing for the targeting of specific dynamic events observed in LM for subsequent high-resolution EM analysis [7] [5].
Advanced Imaging Modalities and AI-Driven Solutions
Beyond sample preparation, the choice of imaging technology itself is paramount. Recent advances in both hardware and software are pushing the boundaries of what is possible in live-cell imaging.
Advanced Light Microscopy Modalities:
- Random Illumination Microscopy (RIM): This super-resolution technique uses speckled illumination and statistical reconstruction to achieve 3D super-resolution. It is noted for its robustness to optical aberrations, low phototoxicity, and compatibility with multicolor live-cell imaging over extended periods, making it suitable for imaging deep inside tissues [58].
- Multiplexing with Deep Learning: An alternative to complex multi-color labeling is a "one-to-many" strategy. This involves staining multiple membrane-bound organelles with a single environment-sensitive dye (e.g., Nile Red) and using its spectral ratiometric readout as an "optical fingerprint." Deep convolutional neural networks (DCNN) can then be trained to segment up to 15 different subcellular structures from the resulting images, dramatically reducing the need for multiple lasers and associated phototoxicity [59].
Artificial Intelligence for Apoptosis Detection: AI is emerging as a powerful tool for detecting subtle, early signs of apoptosis that may be imperceptible to the human eye. One study proposes a Multi-Scale Attention Residual Convolutional Neural Network (MSA-RCNN) that integrates textural features of nuclear chromatin—such as Run-Length Matrix (RLM) and Gray-Level Entropy Matrix (GLEM) parameters—to identify cells in early apoptosis [57]. This approach offers the potential for label-free, automated detection of programmed cell death based on standard microscopic images.
Table 3: Essential Research Reagents and Materials for Live-Cell Apoptosis Imaging
| Item | Function/Application | Example/Note |
|---|---|---|
| BPI Medium | Imaging-optimized culture medium; rich in antioxidants to mitigate ROS-induced phototoxicity [54] [55]. | Brainphys Imaging Medium |
| Laminin Isoforms | ECM coating providing bioactive cues for neuron adherence, maturation, and self-organization [54] [55]. | Human-derived LN511 or murine-derived laminin |
| Caspase Activity Probe | Fluorescent reporter for detecting executioner caspase activation (Caspase-3/7) in live cells [3] [56]. | NucView 488 kit; novel caspase-3 GFP reporter |
| Environment-Sensitive Dye | Stains multiple membrane-bound organelles; emission spectrum shifts with lipid polarity for ratiometric imaging [59]. | Nile Red |
| Apoptosis Inducer | Positive control for inducing intrinsic apoptosis pathway in experiments [3] [5]. | Staurosporine; ABT-737 |
| Caspase Inhibitor | Tool to inhibit apoptosis progression, useful for studying transient events [5]. | QVD-OPh |
Optimizing live-cell imaging for apoptosis research requires a holistic strategy that addresses both the cellular microenvironment and the imaging technology. The experimental data confirms that selecting an imaging-optimized medium like Brainphys can have a more significant impact on long-term neuron viability and network health than adjusting seeding density alone. The choice of detection method should align with experimental priorities: transmitted light LM for simplicity and real-time morphology, fluorescence LM for molecular specificity, and AI-enhanced methods for early, label-free detection. While EM provides the ultimate resolution for endpoint ultrastructural analysis, advanced LM modalities like RIM and deep-learning-powered multiplexing are closing the gap, enabling longer, richer, and more detailed observations of the dynamic process of programmed cell death in living systems.
Electron microscopy (EM) remains an indispensable tool in cell biology, providing unparalleled resolution for visualizing subcellular events such as apoptosis. While light microscopy (LM) offers advantages for live-cell imaging and temporal studies of cell death, EM delivers the ultrastructural detail necessary to confirm apoptotic hallmarks at the nanometer scale. This comparison guide examines the technical landscape of EM methodologies, from initial fixation to final sectioning, with a specific focus on their application in apoptosis research. We objectively evaluate performance parameters across EM modalities and compare them with LM techniques, providing researchers with a practical framework for selecting appropriate imaging strategies based on their experimental needs in drug development and basic research.
The integration of these modalities through correlative light and electron microscopy (CLEM) has emerged as a powerful approach, combining the strengths of both technologies. For apoptosis research specifically, where characteristic morphological changes occur at both microscopic and ultrastructural levels, understanding the capabilities and limitations of each technique is paramount. This guide provides detailed experimental protocols, quantitative performance data, and practical methodologies to navigate the complex tradeoffs between resolution, artifacts, and experimental throughput in cell death studies.
Resolution and Capability Comparison: EM versus LM
Technical Specifications and Imaging Capabilities
Table 1: Comparative analysis of electron microscopy vs. light microscopy for apoptosis research
| Parameter | Transmission EM (TEM) | Scanning EM (SEM) | Correlative Light & EM (CLEM) | Light Microscopy (LM) |
|---|---|---|---|---|
| Resolution | ~0.1 nm (theoretical) | 0.5-5 nm | ~250 nm (LM) to ~0.1 nm (EM) | ~200 nm (diffraction-limited) |
| Effective Resolution for Apoptosis | 1-2 nm (biological samples) | 5-10 nm (surface topography) | Dual-resolution: LM for tracking, EM for structure | 200-500 nm (sufficient for cellular changes) |
| Key Apoptosis Features Visualized | Chromatin condensation, mitochondrial pores, nuclear membrane disruption, apoptotic bodies ultrastructure | Membrane blebbing, surface morphology changes, cell shrinkage | Intracellular NP trafficking, organelle changes, precise localization | Cell shrinkage, membrane blebbing (via DIC/PC), fluorescent markers |
| Sample Preparation Complexity | High (chemical fixation, resin embedding, ultrathin sectioning) | Moderate-High (critical point drying, sputter coating) | Very High (multiple processing steps, registration) | Low-Moderate (may require staining or transfection) |
| Live-Cell Capability | No (fixed samples only) | No (fixed samples only) | Limited (sequential imaging) | Yes (real-time monitoring) |
| Artifact Sources | Fixation defects, staining precipitation, sectioning compression, knife marks | Drying artifacts, charging, metal coating obscurity | Registration errors, fiducial marker interference | Photobleaching, phototoxicity, out-of-focus light |
Quantitative Performance Data in Apoptosis Imaging
Table 2: Performance metrics of imaging techniques for apoptosis detection
| Technique | Detection Accuracy | Time to Result | Multiplexing Capability | Cost | Expertise Required |
|---|---|---|---|---|---|
| TEM | High (direct visualization of ultrastructure) | Days to weeks | Limited (2-3 markers via immunogold) | High | High |
| SEM | Moderate-High (surface features only) | Days | Limited (primarily topographic) | High | High |
| CLEM | Very High (correlated functional/structural) | Weeks | High (multiple fluorescent markers + EM) | Very High | Very High |
| Confocal LM | High (with specific apoptosis markers) | Hours to days | High (3-5 channels typical) | Moderate-High | Moderate |
| Phase Contrast/DIC LM | Moderate (morphological changes only) | Minutes to hours | Low (label-free) | Low-Moderate | Low |
| Flow Cytometry | High (quantitative population data) | Minutes to hours | High (5+ parameters simultaneously) | Moderate | Moderate |
Fixation-Induced Artifacts
Chemical fixation represents the most critical step in EM sample preparation, with improper fixation leading to significant artifacts that can mimic or obscure apoptotic features. The standard dual-fixation approach using glutaraldehyde and osmium tetroxide can introduce several artifact types when suboptimally executed. Prolonged fixation or excessive aldehyde concentrations cause protein over-crosslinking, resulting in brittle tissues that fracture during sectioning, potentially misinterpreted as apoptotic fragmentation [60]. Incomplete fixation leads to extraction of cytoplasmic contents, creating empty spaces that mimic pathological vacuolization. Mitochondrial swelling, a key indicator of early apoptosis, can be artificially induced by hypotonic fixatives or delayed fixation.
Mitigation approaches include using freshly prepared fixatives at physiological pH and osmolarity. Buffered formulations containing 2-2.5% glutaraldehyde followed by 1-2% osmium tetroxide provide optimal preservation for most cell types. For apoptosis studies specifically, rapid fixation is essential to capture transient morphological states without introducing artifacts. Temperature control during fixation (0-4°C) helps reduce post-mortem changes while maintaining structural integrity.
Sectioning and Staining Artifacts
Microtomy generates distinctive artifacts that impact image interpretation. Knife marks appear as parallel scratches across the section surface, while chatter manifests as regular thickness variations creating alternating light and dark bands. Section compression occurs perpendicular to the cutting direction, distorting cellular dimensions. In apoptosis research, where cell and organelle shrinkage are diagnostic features, such distortions can lead to inaccurate quantification. Thick section borders result from improper knife alignment or dull blades, obscuring cellular details [60].
Staining artifacts include precipitate formation from uranyl acetate and lead citrate solutions, appearing as electron-dense granules randomly distributed across the section. These can be mistaken for apoptotic chromatin condensation or microbial contaminants. Inadequate staining produces low-contrast images where apoptotic bodies blend with the background, while excessive staining obscures internal details of organelles. A comparative study of staining protocols demonstrated that low-voltage EM (LVEM) at 25kV provides sufficient contrast with reduced staining requirements, allowing high-quality imaging of sections stained only with 1% uranyl acetate or even completely unstained [61].
Advanced EM Protocols for Apoptosis Research
3D Correlative Light and Electron Microscopy Protocol
The integration of LM and EM through CLEM provides a powerful methodology for apoptosis research, combining dynamic information with ultrastructural context. A recently developed 3D-CLEM workflow enables precise tracking of cellular processes with minimal artifacts [7].
Sample Preparation Protocol:
- Cell Culture and Treatment: Plate cells on gridded glass-bottom dishes. Induce apoptosis using appropriate stimuli (e.g., staurosporine, doxorubicin).
- Live-Cell Imaging: Capture time-lapse sequences using confocal fluorescence microscopy to monitor apoptosis progression with specific markers (e.g., caspase activation, phosphatidylserine exposure).
- Fixation: Fix cells with 4% paraformaldehyde and 0.05% glutaraldehyde in 0.1M sodium cacodylate buffer for 1 hour at 4°C [62].
- Post-fixation and Staining: Treat with 1% osmium tetroxide in cacodylate buffer for 1 hour, followed by en bloc staining with 2% uranyl acetate for 30 minutes.
- Dehydration and Embedding: Dehydrate through graded ethanol series (30%, 50%, 70%, 90%, 100%) and embed in LR White resin.
- Sectioning: Prepare serial ultrathin sections (70-100nm) using an ultramicrotome with diamond knife.
- EM Imaging: Acquire images using focused ion beam scanning electron microscopy (FIBSEM) at appropriate accelerating voltage (5-30kV).
This protocol utilizes lipid droplets as intrinsic fiduciary landmarks rather than external markers, minimizing potential artifacts and improving registration accuracy [7]. The approach has been successfully applied to track nanoparticle uptake and processing in cancer cells, revealing mitochondrial swelling in apoptotic cells and dissolution of internalized particles in endolysosomal compartments.
Optimized CLEM Protocol for Protein Aggregation Studies
An improved CLEM method specifically developed for neurodegenerative research offers enhanced antigen preservation for apoptosis-related protein localization [62]:
Key Modifications for Apoptosis Research:
- Modified Fixation: Reduced glutaraldehyde concentration (0.05%) with 4% paraformaldehyde in 0.1M sodium cacodylate buffer.
- Gentle Dehydration: Ethanol series with progressive lowering of temperature to -30°C.
- LR White Embedding: Infiltration with LR White resin (medium grade) at -30°C followed by UV polymerization for 48 hours.
- Immunogold Labeling: Post-embedding labeling with primary antibodies against apoptosis markers (e.g., caspase-3, Bax) and gold-conjugated secondary antibodies (12nm).
- Serial Section Analysis: Collection of consecutive serial sections for comprehensive 3D reconstruction.
This protocol employs a novel "sandwich method" for simultaneous detection of multiple apoptotic markers through immunofluorescence or immunogold labeling, providing exceptional balance between sensitivity, accuracy, and cost-effectiveness [62].
The Scientist's Toolkit: Essential Research Reagents and Materials
Table 3: Key research reagent solutions for EM apoptosis studies
| Reagent/Material | Function | Application Notes |
|---|---|---|
| Glutaraldehyde (2-3%) | Primary fixative; crosslinks proteins | Maintains ultrastructure but can mask antigenic sites |
| Paraformaldehyde (4%) | Primary fixative; stabilizes proteins | Better antigen preservation than glutaraldehyde alone |
| Osmium Tetroxide (1-2%) | Secondary fixative; stabilizes lipids | Imparts electron density to membranes |
| Uranyl Acetate (1-2%) | En bloc stain; binds DNA, RNA, proteins | Enhances contrast; toxic and radioactive |
| Lead Citrate | Section stain; binds cellular components | High affinity for membranes; prone to precipitate |
| LR White Resin | Embedding medium | Permits immunogold labeling; low viscosity |
| Sodium Cacodylate Buffer | Buffering system | Maintains physiological pH during fixation |
| Diamond Knives | Sectioning | Essential for ultrathin sections (50-100nm) |
| Formvar-Coated Grids | Section support | Provides stable substrate for thin sections |
Visualization of Methodologies and Signaling Pathways
Apoptosis Imaging Pathway Selection
EM Workflow from Fixation to Sectioning
The choice between EM and LM for apoptosis research depends fundamentally on the specific research questions and required information content. EM provides irreplaceable ultrastructural details necessary for definitive identification of apoptotic hallmarks but introduces more potential artifacts and requires extensive sample preparation. LM offers superior temporal resolution and molecular specificity through fluorescent labeling but lacks the resolution to visualize key subcellular events. CLEM methodologies successfully integrate these approaches, though at the cost of increased complexity and specialized instrumentation.
For drug development applications, initial high-throughput screening using LM or flow cytometry followed by detailed EM analysis of promising candidates represents a strategically balanced approach. Technical innovations in low-voltage EM, optimized fixation protocols, and computational image analysis continue to expand capabilities while reducing artifacts. Understanding the relationships between preparation methods and resulting artifacts enables researchers to critically evaluate imaging data and select appropriate methodologies for their specific apoptosis research needs.
This guide provides an objective comparison of Light Microscopy (LM) and Electron Microscopy (EM) for apoptosis research, detailing their respective strengths in rapid screening versus ultrastructural analysis. We present supporting experimental data, detailed protocols, and strategic recommendations to help researchers and drug development professionals select the appropriate imaging technology based on their project goals.
The choice between light microscopy (LM) and electron microscopy (EM) is a critical strategic decision in apoptosis research. LM offers unparalleled speed for live-cell imaging and rapid screening, while EM provides definitive identification through high-resolution ultrastructural detail. This guide objectively compares their performance using recent experimental data, helping researchers optimize their workflow for efficiency and accuracy within the broader context of cell death investigation.
Performance Comparison: LM vs. EM for Apoptosis Analysis
The table below summarizes the core performance characteristics of LM and EM based on current research, highlighting their complementary roles.
Table 1: Performance Comparison of Light Microscopy vs. Electron Microscopy in Apoptosis Research
| Parameter | Light Microscopy (LM) | Electron Microscopy (EM) |
|---|---|---|
| Primary Strength | Speed, live-cell imaging, high-throughput screening | Definitive identification, ultrastructural detail |
| Spatial Resolution | Limited to ~200 nm; sufficient for cellular events like blebbing [3] | Sub-nanometer (e.g., ~0.05 nm for TEM [63]); reveals organelle and molecular assembly details [5] |
| Temporal Resolution | High (real-time to minutes); suitable for time-lapse (2-4 frames/min) [3] | Very Low; processes like fixation and embedding take days [3] |
| Sample Preparation | Minimal; live or fixed cells, often with simple stains [3] | Complex; requires fixation, resin embedding, sectioning; not suitable for live samples [3] |
| Key Apoptotic Features Visualized | Cell shrinkage, membrane blebbing, nuclear fragmentation [3] | Chromatin condensation, ultrastructural details of apoptotic bodies, mitochondrial membrane integrity [64] |
| Quantitative Data Shown | Clinical management concordance vs. digital pathology: 99.95% [65] | Resolves large transient assemblies of Apaf1 (apoptosome) in cells [5] |
| Best Applications | Rapid assessment of cell death, kinetic studies, high-content screening [3] | Defining novel death mechanisms, validating ambiguous LM results, structural studies [5] |
Experimental Protocols and Data
Protocol 1: Real-Time Apoptosis Detection via Light Microscopy
This protocol leverages the speed of LM for kinetic studies of apoptosis in live cells [3].
- 1. Cell Culture and Preparation: Plate cells (e.g., PtK or HeLa cell lines) in glass-bottom dishes with appropriate medium (e.g., EMEM or DMEM with 10% FBS) 24 hours prior to imaging [3].
- 2. Apoptosis Induction: Treat cells with an inducer such as 10 µM Staurosporine (in 1% DMSO) 30 minutes before imaging. Staurosporine triggers intrinsic apoptosis through caspase-dependent and independent pathways [3].
- 3. Microscopy Setup: Use an inverted light microscope (e.g., Nikon Eclipse Ti) equipped with:
- 4. Image Acquisition: Capture single Z-plane time-lapse images at a rate of 2-4 frames per minute. Use shuttered, heat-filtered light to minimize phototoxicity [3].
- 5. Data Analysis: Analyze sequences for the timing and frequency of hallmark apoptotic events: cell shrinkage, cytoplasmic blebbing, and nuclear condensation or fragmentation.
This method provides a straightforward, rapid, and cost-effective way to detect and monitor apoptosis in real-time [3].
Protocol 2: Definitive Ultrastructural Analysis via Electron Microscopy
This protocol uses EM to provide definitive, high-resolution identification of apoptotic structures, as applied in a recent study of the apoptosome [5].
- 1. Sample Fixation: Fix cells (e.g., HeLa cells) promptly after apoptosis induction (e.g., with ABT-737) using a standard glutaraldehyde solution to preserve ultrastructure [5].
- 2. Sample Processing for CLEM:
- For Correlative Light and Electron Microscopy (CLEM), cells expressing a fluorescent tag (e.g., Apaf1-GFP) are first imaged live to identify regions of interest, such as Apaf1 foci [5].
- Cells are then high-pressure frozen and processed for resin embedding or prepared for cryo-sectioning to maintain a near-native state [5].
- 3. Sectioning and Imaging:
- 4. Data Reconstruction and Analysis:
- Tomograms are computationally reconstructed to create 3D models of cellular volumes.
- Analyze structures for defining features. For example, Apaf1 was visualized as "cloud-like, continuous meshwork" structures, confirming the formation of the apoptosome complex within cells [5].
This resource-intensive protocol is the gold standard for visualizing the precise subcellular architecture of apoptosis, uncovering details invisible to LM [5].
Visualizing the Apoptotic Pathway and Strategy Selection
The following diagrams map the core apoptotic pathway and the decision-making process for selecting a microscopy strategy.
Diagram 1: Key Observable Steps in the Apoptotic Pathway. This diagram illustrates the intrinsic apoptotic pathway, highlighting specific stages where Light Microscopy (LM) and Electron Microscopy (EM) provide critical observational data, based on recent research [3] [5].
Diagram 2: Microscopy Selection Strategy. A logical workflow for choosing between Light Microscopy and Electron Microscopy based on specific research goals in apoptosis studies.
Research Reagent Solutions
The table below lists key reagents and their applications in apoptosis imaging, as cited in the experimental protocols.
Table 2: Essential Research Reagents for Apoptosis Imaging
| Reagent / Material | Function / Application | Example Use Case |
|---|---|---|
| Staurosporine | Protein kinase inhibitor; induces intrinsic apoptosis for experimental studies [3]. | Used at 10 µM to trigger apoptosis in live-cell LM imaging [3]. |
| NucView 488 | Fluorescent caspase-3/7 substrate; becomes fluorescent upon cleavage by active caspases [3]. | Real-time visualization of early apoptotic activity in live cells via fluorescence LM [3]. |
| ABT-737 | Bcl-2 inhibitor; induces mitochondrial apoptosis by blocking anti-apoptotic proteins [5]. | Used to trigger cytochrome c release and apoptosome formation in EM studies [5]. |
| Apaf1-GFP/SNAP Tag | Fluorescent protein tag; enables localization of Apaf1 protein in live cells [5]. | Critical for correlative light and electron microscopy (CLEM) to track apoptosome formation [5]. |
| Q-VD-OPh (QVD) | Pan-caspase inhibitor; blocks execution of apoptosis, allowing study of transient events [5]. | Used in conjunction with ABT-737 to observe transient Apaf1 foci assembly/disassembly [5]. |
| MatTek Glass Bottom Dishes | Imaging-optimized culture dishes; provide high optical clarity for high-resolution microscopy [3]. | Standard vessel for live-cell imaging experiments using both LM and CLEM approaches [3] [5]. |
Light and electron microscopy serve distinct, complementary roles in modern apoptosis research. The high speed and live-cell capability of LM make it ideal for rapid screening, kinetic analysis, and initial confirmation of cell death. In contrast, the unparalleled resolution of EM is indispensable for definitive identification of novel structures, detailed mechanistic studies, and validating complex ultrastellular events. By understanding the performance data, available protocols, and strategic selection criteria outlined in this guide, researchers can effectively leverage both technologies to advance their research in cell death and therapeutic development.
Head-to-Head Comparison: Validating Apoptosis with Multimodal Imaging
The study of apoptosis, or programmed cell death, is a cornerstone of biomedical research, with implications for understanding cancer, neurodegenerative diseases, and drug development. The selection of an appropriate imaging technique is pivotal for accurate and efficient detection of this process. Light microscopy (LM) and electron microscopy (EM) represent two fundamental approaches, each with distinct capabilities and limitations. This guide provides a direct, data-driven comparison of these techniques for apoptosis research, focusing on resolution, live-cell capability, throughput, and cost to inform researchers and drug development professionals.
Technical Comparison: Light Microscopy vs. Electron Microscopy
The following table summarizes the core technical specifications and performance of light and electron microscopy in the context of apoptosis research.
Table 1: Direct comparison of light and electron microscopy for apoptosis detection.
| Feature | Light Microscopy (LM) | Electron Microscopy (EM) |
|---|---|---|
| Resolution | ~200-250 nm laterally [66] | Sub-nanometer to low nanometer range (SEM: 3-20 nm; TEM: <0.1 nm) [67] [66] |
| Live-Cell Capability | Yes. Enables real-time observation of apoptosis in living cells [3] [68] [69]. | No. Requires fixed, ultra-thin samples; incompatible with live cells [66]. |
| Throughput | High. Suitable for high-throughput, real-time kinetic assays [68]. | Low. Tedious sample preparation and imaging process; static imaging [67]. |
| Cost | Relatively low cost for basic transmitted light systems [3]. | Very high. New SEM: $70,000-$1M; New TEM: $100,000-$10M [70]. |
| Key Apoptotic Features Visualized | Cell shrinkage, membrane blebbing (via DIC/PC) [3]. Caspase activation, phosphatidylserine exposure, DNA fragmentation (via fluorescence) [3] [68]. | Ultrastructural details: chromatin condensation, nuclear fragmentation, organelle changes, apoptotic bodies [67] [10]. |
| Sample Preparation | Simple; viable for living, fixed, stained, or unstained cells [66]. | Complex, labor-intensive; requires fixation, dehydration, resin embedding, and heavy metal staining [67] [66]. |
| Invasiveness | Low for transmitted light; moderate for fluorescence (due to fluorophores/illumination) [3] [6]. | High. Sample is fixed and not recoverable [3]. |
Experimental Protocols for Apoptosis Detection
Light Microscopy Protocol for Real-Time Apoptosis Detection
This protocol utilizes a fluorescent caspase reporter for high-throughput, kinetic assessment of apoptosis in live cells, suitable for drug screening [68].
Table 2: Key reagents for live-cell apoptosis assays.
| Reagent / Solution | Function in the Assay |
|---|---|
| IncuCyte Caspase-3/7 Reagent | A cell-permeable, non-fluorescent substrate that is cleaved by activated caspase-3/7, releasing a DNA-binding green fluorescent dye [68]. |
| Staurosporine (STS) | A protein kinase inhibitor used as a positive control to reliably induce intrinsic apoptosis in experimental cells [3] [68]. |
| Cell Culture Medium (e.g., DMEM) | Maintains cell viability and health during the live-cell imaging process. |
| Hoechst 33342 | A cell-permeable blue fluorescent dye that stains DNA, used to quantify total cell number and nuclear morphology [68]. |
| Black-sided, Clear-bottom 96-well Plates | Optically ideal plates for high-resolution fluorescence and brightfield imaging in microplate readers or automated systems. |
Workflow Steps:
- Cell Seeding: Seed cells (e.g., HT1080 fibrosarcoma or primary mouse lung fibroblasts) into a 96-well plate at a density of approximately 7,000 cells per well and allow them to adhere for 48 hours [68].
- Treatment & Staining: Treat cells with the apoptotic inducer (e.g., a dose range of Staurosporine) and simultaneously add the IncuCyte Caspase-3/7 Reagent at a final concentration of 5 µM [68].
- Real-Time Data Acquisition:
- Option A (Microplate Reader): Place the plate in a multimode microplate reader. Read fluorescence (Ex/Em: 500/530 nm) immediately (0 hours) and at regular intervals (e.g., 8, 12, 16, 20, 24 hours) post-treatment. This method is cost-effective and provides kinetic data [68].
- Option B (Dedicated Live-Cell System): Place the plate in an system like the IncuCyte S3. Schedule the instrument to automatically capture phase contrast and green fluorescence images from multiple locations per well at frequent intervals (e.g., hourly) for 24+ hours [68].
- Data Analysis: For the microplate reader, plot relative fluorescence units (RFU) over time. For image-based systems, use integrated software to calculate the number of green fluorescent objects (apoptotic cells) per well or the total fluorescent area over time, normalized to the control [68].
Figure 1: Experimental workflow for real-time apoptosis detection using light microscopy and fluorescent caspase reporters.
Electron Microscopy Protocol for Ultrastructural Analysis
This protocol outlines the steps for visualizing the definitive morphological hallmarks of apoptosis at the subcellular level, traditionally considered the "gold-standard" [67] [10].
Workflow Steps:
- Induction & Fixation: Induce apoptosis in cell cultures or tissue samples. Rapidly fix the samples using a buffered glutaraldehyde solution (e.g., 2.5%) to instantly preserve cellular ultrastructure and prevent degradation [67].
- Post-fixation & Staining: Wash the fixed samples and post-fix with a 1% osmium tetroxide solution. This secondary fixation also acts as a "stain" by binding to cellular lipids and membranes, enhancing contrast for EM [67].
- Dehydration & Embedding: Dehydrate the samples through a graded series of ethanol or acetone (e.g., 30%, 50%, 70%, 90%, 100%) to remove all water. Infiltrate and embed the samples in a resin (e.g., Epon or Araldite) which is then polymerized into a hard block [67].
- Sectioning: Use an ultramicrotome to cut ultra-thin sections (typically 50-100 nm thick) from the resin-embedded block. Mount these sections on small copper grids [67].
- Imaging & Analysis: Transfer the grids to the electron microscope. Acquire high-resolution images at various magnifications to identify key apoptotic features, such as chromatin condensation and margination, and compare them to healthy or necrotic cells [67] [10].
Figure 2: Standard workflow for apoptosis analysis using electron microscopy.
Advanced and Emerging Techniques
Correlative Light and Electron Microscopy (CLEM)
CLEM is a powerful advanced technique that bridges the gap between LM and EM. It combines the dynamic, functional information from fluorescence microscopy with the high-resolution structural context of EM [67] [7]. For example, a 3D-CLEM workflow was used to track the uptake of fluorescently labeled inorganic-organic hybrid nanoparticles (IOH-NPs) into cancer cells. Cells were first imaged live with confocal microscopy to locate the nanoparticles, and then the same cells were processed and imaged with FIB-SEM to reveal their precise subcellular localization and processing within endolysosomal compartments [7].
Advanced Light Microscopy and Computational Detection
The field of light microscopy is rapidly evolving with new methods for apoptosis detection.
- Novel Fluorescent Reporters: New biosensors, such as a modified GFP where fluorescence is lost upon caspase-3 cleavage, enable highly sensitive and specific real-time apoptosis reporting with a simplified design [56].
- Deep Learning (DL) and AI: Tools like ADeS (Apoptosis Detection System) use transformer-based deep learning to automatically detect and quantify apoptosis in live-cell imaging data with high accuracy (>98%). This probe-free method can identify apoptotic cells based solely on morphological changes, such as nuclear shrinkage and membrane blebbing, overcoming limitations of fluorescent probes and human annotation bias [69].
The choice between light and electron microscopy for apoptosis research is not a matter of superiority but of application. Electron microscopy remains the definitive method for confirming apoptosis through high-resolution ultrastructural analysis, but its static nature, low throughput, and high cost limit its use for kinetic studies. Light microscopy, particularly with fluorescent reporters and automated systems, is the indispensable tool for dynamic, high-throughput functional analysis in live cells, making it ideal for drug discovery and kinetic studies. Advanced techniques like CLEM and deep-learning-enhanced light microscopy are forging the future by integrating functional and structural data, providing a more comprehensive and powerful toolkit for researchers deciphering the mechanisms of cell death.
The apoptosome is a critical signaling platform in the intrinsic pathway of apoptosis, formed upon the release of cytochrome c from mitochondria. This multi-protein complex, primarily composed of Apoptotic protease-activating factor 1 (Apaf-1), activates procaspase-9, triggering a caspase cascade that leads to controlled cell dismantling [71] [72]. Visualizing this complex is essential for understanding the fundamental mechanisms of programmed cell death. This case study objectively compares two principal imaging methodologies: light microscopy (LM) for observing dynamic Apaf-1 foci in living cells, and electron microscopy (EM) for resolving the high-resolution ultrastructure of the isolated complex. The analysis is framed within the broader context of selecting appropriate imaging techniques for apoptosis research, providing researchers with a data-driven guide for their experimental design.
LM Foci: Visualizing Dynamic Assembly in Living Cells
Recent advances in light microscopy have enabled the visualization of apoptosome formation directly within the cellular environment. This approach captures the dynamic and transient nature of the process.
Key Experimental Findings
- Discovery of Apaf1 Foci: A 2025 study revealed that upon apoptosis induction, Apaf-1 molecules accumulate into multiple, distinct foci within the cell cytoplasm. These foci are large, organelle-sized, cloud-like assemblies [73].
- Dynamic Behavior: The formation of these foci correlates with the onset of apoptosis, and their disassembly is associated with cell survival, indicating a highly regulated process [73].
- Functional Significance: These Apaf-1 foci contain caspase-9 and their formation depends on the expression of procaspase-9. This led to the conclusion that these transient assemblies correspond to the functional apoptosome within cells [73].
Experimental Protocol for LM Foci Imaging
Objective: To visualize the spatiotemporal dynamics of apoptosome formation in living cells.
- Cell Line & Transfection: Use an appropriate cell line (e.g., SKOV-3 human ovarian cancer cells). Transfect cells with a plasmid encoding Apaf-1 fused to a fluorescent tag (e.g., GFP).
- Apoptosis Induction: Treat cells with a relevant apoptotic stimulus (e.g., paclitaxel, a chemotherapeutic agent).
- Live-Cell Imaging: Immediately after induction, place cells on a confocal laser scanning microscope equipped with an environmental chamber (37°C, 5% CO₂). Time-lapse imaging is performed at high temporal resolution (e.g., every few minutes) to monitor foci formation over several hours.
- Data Analysis: The number, size, and intensity of Apaf-1 foci per cell are quantified over time. Co-localization studies with fluorescent markers for mitochondria or caspases can confirm functional composition [73].
The diagram below illustrates the logical pathway from apoptosis induction to the observation of Apaf-1 foci.
Visualizing Apaf-1 Foci via Light Microscopy
EM Ultrastructure: High-Resolution Structural Analysis
Electron microscopy, particularly cryo-EM, has been instrumental in determining the detailed architecture of the apoptosome at near-atomic resolution, providing insights into its assembly and mechanism.
Key Structural Findings
- Heptameric Architecture: The human apoptosome is a wheel-shaped complex with a central hub and seven spokes, exhibiting seven-fold symmetry [74] [71].
- Domain Organization: Each Apaf-1 subunit in the apoptosome has a distinct domain structure:
- CARD (Caspase Activation and Recruitment Domain): Forms a flexible ring above the central hub for procaspase-9 binding [75] [71].
- NOD (Nucleotide-Binding and Oligomerization Domain): Forms the central structural platform, including a nucleotide-binding domain (NBD), helical domain 1 (HD1), and a winged-helix domain (WHD) [71] [72].
- WD40 Repeats: Form a V-shaped regulatory region with two β-propeller domains that bind cytochrome c, stabilizing the complex [74] [71].
- Procaspase-9 Binding: The CARDs of Apaf-1 and procaspase-9 form an acentric, disk-like spiral on the central hub, recruiting an average of 3-5 procaspase-9 molecules per apoptosome [75].
Experimental Protocol for EM Ultrastructure Analysis
Objective: To determine the high-resolution three-dimensional structure of the purified apoptosome.
- Complex Isolation: The apoptosome is assembled in vitro by incubating recombinant Apaf-1 protein with cytochrome c and dATP in a suitable buffer. The complex is then purified using size-exclusion chromatography [74].
- Grid Preparation: A small volume of the purified sample is applied to an EM grid and rapidly frozen in liquid ethane to preserve its native state in a thin layer of vitreous ice (cryo-EM).
- Data Collection: The grid is imaged in a cryo-electron microscope. Thousands of high-magnification, low-dose micrographs (2D projections) of individual apoptosome particles are collected.
- Image Processing and 3D Reconstruction: Computational algorithms are used to classify the 2D particle images, align them, and reconstruct a high-resolution 3D density map.
- Model Building: Existing crystal structures of Apaf-1 domains are docked into the EM density map, and a full atomic model is built and refined [75] [74].
Comparative Analysis: LM Foci vs. EM Ultrastructure
The following tables summarize the quantitative and qualitative differences between the two imaging approaches for apoptosome research.
Table 1: Technical and Performance Comparison
| Parameter | LM Foci Imaging | EM Ultrastructure |
|---|---|---|
| Resolution | ~200-300 nm (Limited by diffraction) | ~3-10 Å (Near-atomic) [75] |
| Context | In living cells (In vivo) | Isolated, purified complex (In vitro) |
| Temporal Data | Real-time dynamics (High) | Static snapshot (None) |
| Key Findings | Transient Apaf-1 foci; correlation with survival/death [73] | Heptameric wheel structure; domain mapping [75] [74] |
| Throughput | Medium to High (Live-cell imaging) | Low (Complex sample prep) |
| Primary Application | Studying spatiotemporal assembly dynamics | Determining atomic-level structure and mechanism |
Table 2: Data Output and Experimental Requirements
| Aspect | LM Foci Imaging | EM Ultrastructure |
|---|---|---|
| Sample Preparation | Fluorescently tagged Apaf-1; live cells | Protein purification; vitrification |
| Key Readouts | Number, size, and kinetics of foci | 3D electron density map; atomic coordinates |
| Data Type | Quantitative kinetics; qualitative localization | Quantitative structural metrics (e.g., distances, angles) |
| Complementary Techniques | Fluorescence Lifetime Imaging (FLIM) [76] | X-ray crystallography; biochemical assays |
| Infrastructure | High-resolution confocal microscope | Cryo-electron microscope; computing cluster |
The workflow below contrasts the fundamental processes of these two imaging techniques.
Contrasting LM and EM Workflows
The Scientist's Toolkit: Essential Research Reagents
Successful visualization of the apoptosome relies on a suite of specialized reagents and tools.
Table 3: Key Reagent Solutions for Apoptosome Research
| Reagent / Tool | Function | Application Context |
|---|---|---|
| Fluorescently-Tagged Apaf-1 (e.g., Apaf-1-GFP) | Enables visualization of protein localization and dynamics in live cells. | LM Foci Imaging [73] |
| Recombinant Apaf-1 Protein | The core building block of the complex for in vitro reconstitution. | EM Ultrastructure Analysis [75] [74] |
| Cytochrome c | Key trigger for apoptosome assembly; binds Apaf-1 WD40 domains. | In vitro assembly for both biochemical and structural studies [71] |
| dATP/ATP | Nucleotide cofactor essential for the conformational change and oligomerization of Apaf-1. | In vitro assembly [71] [72] |
| Caspase-3 Cleavage Reporter (e.g., DEVDG-inserted GFP) | A fluorescent biosensor that loses fluorescence upon cleavage by executioner caspase-3, confirming downstream apoptotic activity. | Functional validation in live cells [56] |
| Mitochondrial Viscosity Probe (e.g., TPA-Mit) | A two-photon fluorescent probe whose lifetime changes with mitochondrial viscosity, an early event in apoptosis. | Early apoptosis detection via Phasor-FLIM [76] |
This case study demonstrates that LM and EM are not competing but complementary techniques for apoptosome visualization. LM provides the "big picture" context of when and where the apoptosome forms in the complex cellular environment, revealing its dynamic and regulated nature [73]. In contrast, EM answers the fundamental structural question of what the apoptosome looks like, providing an atomic-level blueprint that explains how it assembles and functions [75] [74].
For a complete understanding of apoptotic signaling, researchers should consider a correlative approach. The dynamic properties of Apaf-1 foci observed with LM can be directly interpreted through the detailed architectural models generated by EM. For instance, the transient nature of the foci observed in cells [73] aligns with the flexible CARD disk and the various dimerization states of procaspase-9 seen in high-resolution structures [75] [72].
In conclusion, the choice between LM and EM depends entirely on the research question. For studies focused on the cellular regulation and kinetics of apoptosome formation, light microscopy is the superior tool. For mechanistic studies aimed at understanding the precise molecular interactions that drive complex assembly and caspase activation, electron microscopy is indispensable. Together, they provide a powerful, multi-scale toolkit for advancing apoptosis research and drug development.
In biomedical research, particularly in cancer studies and drug development, accurately distinguishing between different forms of cell death is crucial for understanding therapeutic efficacy and mechanisms of action. For decades, electron microscopy (EM) has provided the resolution benchmark for visualizing subcellular morphological changes, while light microscopy has offered greater accessibility and live-cell capabilities. However, both traditional approaches face significant limitations: EM requires extensive sample preparation and fixation, preventing live dynamic studies, while conventional light microscopy often lacks the resolution for detailed morphological analysis or requires staining that perturbs cellular function [11] [21].
Within this context, label-free imaging techniques have emerged as powerful tools that bridge the methodological gap. Among these, Full-Field Optical Coherence Tomography (FF-OCT) represents a particularly advanced platform for three-dimensional morphological analysis of cellular processes without introducing artificial labels or requiring destructive sample preparation. This guide provides a comprehensive comparison of FF-OCT against established microscopy techniques within the specific application of apoptosis research, supported by experimental data and implementation protocols.
Fundamental Operating Principles
Full-Field Optical Coherence Tomography is an interferometric imaging technique that enables label-free visualization of cellular structural changes by detecting light signals scattered from living sample structures within the coherence gate [11]. Unlike conventional OCT, which relies on point-by-point laser scanning, FF-OCT simultaneously illuminates and detects the entire field of view, enabling rapid and scan-free area observations in en face view [11] [20].
The technical implementation typically involves a custom-built time-domain FF-OCT system utilizing a broadband halogen light source (center wavelength: 650 nm, spectral width: 200 nm) to achieve sub-micrometer axial resolution [11] [20]. A Linnik-configured Michelson interferometer is constructed with identical 40× water-immersion objectives (numerical aperture: 0.8) in both reference and sample arms, enabling subcellular-resolution (<1 μm) symmetrical imaging [11] [20]. This configuration allows precise optical sectioning and three-dimensional reconstruction of cellular architecture without physical sectioning.
Comparative Imaging Modalities
Table 1: Comparison of Microscopy Techniques for Apoptosis Research
| Technique | Resolution | Label-Free | Live-Cell Capability | 3D Imaging | Sample Preparation Complexity |
|---|---|---|---|---|---|
| FF-OCT | <1 μm transverse; sub-μm axial | Yes | Yes | Excellent | Low - no staining required |
| Electron Microscopy | <1 nm | Yes | No | Limited (with FIB-SEM) | High - fixation, sectioning required |
| Holographic Tomography | ~200-300 nm lateral | Yes | Yes | Excellent | Low - no staining required |
| Conventional Light Microscopy | ~200 nm | Possible (phase contrast/DIC) | Yes | Moderate | Low to moderate |
| Confocal Fluorescence | ~200 nm | No | Yes | Excellent | High - staining required |
Table 2: Key Morphological Features Distinguishable by Imaging Technique
| Cell Death Process | Key Morphological Features | FF-OCT Detection | EM Detection | Light Microscopy Detection |
|---|---|---|---|---|
| Apoptosis | Cell shrinkage, membrane blebbing, chromatin condensation | Excellent | Excellent | Good (with staining) |
| Necrosis | Cellular swelling, membrane rupture, organelle disintegration | Excellent | Excellent | Moderate |
| Autophagy | Formation of autophagic vacuoles, cytoplasmic condensation | Good | Excellent | Limited without staining |
| Pyroptosis | Plasma membrane rupture, pore formation, cell swelling | Good | Excellent | Limited without staining |
Experimental Implementation: FF-OCT for Apoptosis Detection
Sample Preparation Protocols
For apoptosis imaging using FF-OCT, HeLa cells (human cervical cancer cells) are cultured as a monolayer in Dulbecco's Modified Eagle's Medium (DMEM) under standard conditions (5% CO₂ at 37°C) [11] [20]. Two primary induction methods are employed:
Apoptosis Induction: Doxorubicin is added to culture medium at a final concentration of 5 μmol/L. Doxorubicin is an anthracycline chemotherapeutic agent that induces apoptosis in rapidly proliferating cancer cells by intercalating into cellular DNA or inhibiting DNA replication via Topoisomerase II inhibition, thereby causing double-strand breaks [11] [20].
Necrosis Induction: Experimental groups are treated with 99% ethanol under the same incubation conditions. Ethanol causes nonspecific and rapid cellular damage at high concentrations, inducing abnormal cell death (necrosis) through membrane integrity disruption and protein denaturation [11] [20].
FF-OCT imaging is initiated immediately after drug administration and performed continuously at 20-minute intervals to monitor and analyze morphological changes for up to 180 minutes [11].
FF-OCT System Configuration
The custom-built time-domain FF-OCT system employs several specialized components optimized for single-cell imaging [11] [20]:
- Light Source: Broadband halogen lamp (OSL2, center wavelength: 650 nm, spectral width: 200 nm, Thorlabs)
- Detector: CCD camera (CCD-1020, 1024 × 1024 pixels, 12 bits, 20 fps, VDS Vosskühler GmbH)
- Phase Modulation: Piezoelectric actuator (PAZ005, 20 nm resolution, Thorlabs) attached to reference mirror
- Objectives: Identical 40× water-immersion objectives (LUMPLFLN40XW, NA: 0.8, WD: 3.3 mm, Olympus)
The system generates en face (x-y) cross-sectional images through arithmetic processing of temporally phase-shifted interference images to remove DC components, isolating sample reflection information [11]. Acquired tomographic images are stacked in z-stack format using a precise motorized sample stage for 3D reconstruction and analysis.
3D Reconstruction and Analysis Methods
The continuous cross-sectional data obtained with the FF-OCT system enables 3D visualization of cellular internal structures and quantitative morphological analysis of cell surfaces [11] [20]. The depth of maximum intensity, defined as the z-position at which the reflected intensity is greatest in each A-scan (pixel-level z-axis signal), is identified as the cell surface. These maximum intensity positions are mapped across all pixels in the 2D xy-plane to generate a 3D point cloud. Spline interpolation is then applied to reconstruct a smooth topographic surface, allowing detailed visualization of cell surface morphology and time-lapse morphometric measurements in single cell structures [11].
Figure 1: FF-OCT Experimental Workflow for Cell Death Analysis
Comparative Experimental Data: FF-OCT Versus Established Techniques
Morphological Differentiation Capabilities
Research demonstrates that FF-OCT effectively distinguishes between apoptosis and necrosis through characteristic morphological patterns [11] [20] [12]:
Apoptotic Cells: Exhibit echinoid spine formation, cell contraction, membrane blebbing, and filopodia reorganization. These changes occur progressively over the observation period, reflecting the programmed nature of apoptotic death.
Necrotic Cells: Display rapid membrane rupture, intracellular content leakage, and abrupt loss of adhesion structures. The changes are more immediate and disruptive compared to the organized process of apoptosis.
These dynamic events are visualized using high-resolution tomography and three-dimensional surface topography mapping, providing quantitative data on morphological changes throughout cell death progression [11].
Resolution and Imaging Capability Comparison
Table 3: Quantitative Performance Comparison of Imaging Techniques
| Performance Metric | FF-OCT | Electron Microscopy | Holographic Tomography | Confocal Microscopy |
|---|---|---|---|---|
| Axial Resolution | <1 μm | <10 nm | ~100-200 nm | ~500-700 nm |
| Lateral Resolution | <1 μm | <1 nm | ~200-300 nm | ~200 nm |
| Imaging Depth | ~1-2 mm | <1 μm | ~100 μm | ~100-200 μm |
| Temporal Resolution | Seconds-minutes | Days | Seconds-minutes | Seconds |
| Label-Free | Yes | Yes | Yes | No |
Integration With Complementary Techniques
FF-OCT can be integrated with complementary imaging approaches to enhance its analytical capabilities. The platform can generate en face 2D interference images similar to interference reflection microscopy (IRM) by adjusting the coherence gate position [11] [20]. When the coherence gate is aligned near the culture substrate or the bottom of the cell, interference arises from reflections at the cell-substrate interface. This configuration enables visualization of focal adhesion dynamics and changes in the cell-substrate interface with nanoscale sensitivity [11].
Similar label-free approaches, such as holographic tomography (HT), have also demonstrated capability in characterizing cell death states by capturing precise three-dimensional refractive index morphologies of cells and directly analyzing cellular parameters like area, height, volume, and nucleus/cytoplasm ratio within the 3D cellular model [77].
Research Reagent Solutions and Essential Materials
Table 4: Essential Research Reagents and Materials for FF-OCT Apoptosis Studies
| Item | Specification | Function/Application | Example Source/Model |
|---|---|---|---|
| Cell Line | HeLa cells (human cervical cancer) | Model system for apoptosis/necrosis studies | Korean Cell Line Bank (KCLB-10002) |
| Culture Medium | Dulbecco's Modified Eagle's Medium (DMEM) | Cell maintenance and growth | Standard commercial suppliers |
| Apoptosis Inducer | Doxorubicin hydrochloride | Chemical induction of apoptosis (5 μmol/L working concentration) | Sigma-Aldrich/MilliporeSigma |
| Necrosis Inducer | Ethanol (99%) | Chemical induction of necrosis | Standard commercial suppliers |
| FF-OCT Light Source | Broadband halogen lamp | Illumination for interferometry | OSL2 (Thorlabs) |
| Detection Camera | CCD camera | Image capture | CCD-1020 (VDS Vosskühler GmbH) |
| Objective Lenses | 40× water-immersion | High-resolution imaging | LUMPLFLN40XW (Olympus) |
| Piezoelectric Actuator | High-precision | Phase shifting for interferometry | PAZ005 (Thorlabs) |
Signaling Pathways and Morphological Correlations
Understanding the relationship between molecular signaling events and morphological changes is essential for accurate interpretation of FF-OCT data in cell death research.
Figure 2: Cell Death Signaling Pathways and Morphological Outcomes
The apoptotic process involves two primary signaling pathways that converge on characteristic morphological changes detectable by FF-OCT [21]:
Extrinsic Pathway: Triggered when ligands produced by natural killer cells or macrophages attach to death receptors (Tumor Necrosis Factor receptor 1, or Toll-like receptors) present on the cell surface, recruiting intracellular adaptor proteins that aggregate procaspase molecules to initiate a proteolytic cascade [21].
Intrinsic Pathway: Activated when cells encounter oxidative stress, viral infection, or DNA damage, leading to mitochondrial release of cytochrome c into cytosol. Cytochrome c binds and activates adaptor protein (APAF1), which recruits procaspase-9 forming the apoptosome [21].
Both pathways activate executioner caspases that mediate the structural breakdown of the cell, resulting in the morphological hallmarks detectable by FF-OCT: cell shrinkage, membrane blebbing, and eventual cellular fragmentation [11] [21].
In contrast, necrosis typically results from direct cellular damage that bypasses these programmed pathways, leading to immediate membrane rupture and content release without the organized structural changes characteristic of apoptosis [11] [21].
FF-OCT represents a significant advancement in label-free imaging technology, occupying a unique position between conventional light microscopy and electron microscopy for apoptosis research. While it cannot match the nanometer-scale resolution of EM, FF-OCT provides sufficient resolution to identify key morphological markers of different cell death pathways while maintaining live-cell capability and minimal sample perturbation.
The technique's capacity for long-term time-lapse imaging of unlabeled cells makes it particularly valuable for drug discovery and toxicology studies, where realistic assessment of cellular responses without artificial markers is essential. Furthermore, the quantitative 3D data provided by FF-OCT surface topography mapping offers objective metrics for comparing therapeutic efficacy and cellular responses across different experimental conditions.
For researchers designing cell death studies, FF-OCT serves as an ideal bridge technique—providing higher resolution and 3D capability than conventional light microscopy while maintaining the live-cell compatibility that EM sacrifices. Its incorporation into multidisciplinary imaging workflows, complemented by targeted molecular techniques for specific pathway validation, offers a powerful approach for comprehensive analysis of cell death mechanisms in biomedical research.
In the field of apoptosis research, the choice of imaging methodology is far from trivial. The complex, multi-stage process of programmed cell death presents unique challenges for detection and quantification, with techniques ranging from conventional light microscopy to advanced electron microscopy each offering distinct advantages and limitations. This guide provides a comparative analysis of electron and light microscopy techniques, demonstrating why a multimodal validation strategy is indispensable for producing robust, high-impact research findings. By synthesizing current experimental data and methodologies, we aim to equip researchers with the framework needed to implement comprehensive imaging validation protocols in their apoptosis studies.
Performance Comparison: Electron Microscopy vs. Light Microscopy
The selection of an appropriate imaging technique requires careful consideration of resolution, applications, and limitations. The table below provides a detailed comparison of key microscopy methods used in apoptosis research.
Table 1: Performance comparison of microscopy techniques for apoptosis detection
| Technique | Best Resolution | Key Apoptosis Applications | Key Advantages | Main Limitations |
|---|---|---|---|---|
| Transmission Electron Microscopy (TEM) | <1 nm [10] | Gold standard for morphological changes; Distinguishes apoptosis from necrosis [10] | Highest resolution; Visualizes ultrastructural details (chromatin condensation, organelle changes) [10] | Requires sample fixation (not live cell); Time-consuming; Expensive; Limited sampling [10] [3] |
| Focused Ion Beam SEM (FIB-SEM) | 5 nm (3D) [78] | 3D reconstruction of subcellular structures; Nanoparticle uptake and processing [7] [78] | 3D structural information; Correlative approaches with light microscopy [7] | Complex sample preparation; Instrument cost; Not for live cells [7] |
| Immunoelectron Microscopy (IEM) | 0.5-10 nm [78] | Protein localization at subcellular scale; Spatial distribution of apoptosis markers [78] | Molecular specificity with EM resolution; Precise spatial localization of biomarkers [78] | Antigen preservation challenges; Technical complexity; Resource-intensive [78] |
| Full-Field OCT (FF-OCT) | ~1 μm [12] [11] | Label-free visualization of apoptosis morphology; 3D surface topography [12] [11] | Label-free; Non-invasive; Real-time monitoring; 3D capability [12] [11] | Lower resolution than EM; Limited molecular specificity without labeling [11] |
| Fluorescence Microscopy | ~200 nm [28] | Live-cell apoptosis tracking; Caspase activation; Membrane integrity [3] [28] | Live-cell imaging; Molecular specificity; Real-time kinetics [3] [79] | Photobleaching; Phototoxicity; Limited resolution [28] |
| Flow Cytometry | N/A (population data) | Quantitative viability; Apoptosis staging; High-throughput screening [28] | High-throughput; Multiparametric analysis; Statistical power [28] | No spatial information; Requires single-cell suspension [28] |
Experimental Protocols for Apoptosis Detection
3D Correlative Light and Electron Microscopy (CLEM) Workflow
This advanced protocol enables precise correlation between functional and structural information in apoptosis studies [7].
Sample Preparation
- Culture murine H8N8 breast cancer cells and treat with apoptosis-inducing agents or nanoparticles
- For CLEM, use fluorescently labeled probes (e.g., caspase sensors) compatible with both FM and EM
- Fix cells with paraformaldehyde (2-4%) and glutaraldehyde (0.1-2.5%) mixture for 30-120 minutes [78]
Correlative Imaging
- Acquire confocal fluorescence microscopy images to identify apoptotic cells and map regions of interest
- Process samples for EM: post-fix in 1% osmium tetroxide, dehydrate in ethanol series, embed in epoxy resin
- Use intrinsic cellular features (e.g., lipid droplets) as fiduciary landmarks for correlation [7]
- Section samples (70-100 nm) and collect serial sections for TEM or FIB-SEM imaging
- Reconstruct 3D volumes from serial sections or FIB-SEM data stacks [7]
Data Analysis
- Correlate fluorescent signals (e.g., caspase activation) with ultrastructural features (e.g., chromatin condensation, membrane blebbing)
- Quantify morphological parameters (e.g., mitochondrial swelling, endolysosomal volume changes) [7]
Full-Field Optical Coherence Tomography for Label-Free Apoptosis Monitoring
This protocol enables non-invasive, label-free detection of apoptotic morphological changes [12] [11].
Cell Preparation and Treatment
- Culture HeLa cells in glass-bottom dishes for high-resolution imaging
- Induce apoptosis with 5 μmol/L doxorubicin for intrinsic pathway activation
- Alternatively, induce necrosis with high-concentration ethanol (e.g., 99%) for comparative studies [11]
FF-OCT Imaging
- Use custom-built time-domain FF-OCT system with Linnik interferometer configuration
- Employ broadband halogen light source (center wavelength: 650 nm, spectral width: 200 nm)
- Utilize 40× water-immersion objectives (NA: 0.8) for subcellular resolution
- Acquire en face (x-y) cross-sectional images at multiple z-positions
- Perform time-lapse imaging at 20-minute intervals for up to 180 minutes [11]
Image Processing and Analysis
- Reconstruct 3D cellular topography from z-stack data
- Quantify morphological parameters: cell volume, surface roughness, membrane blebbing dynamics
- Generate interference reflection microscopy (IRM)-like images to visualize cell-substrate adhesion changes [12] [11]
Immunoelectron Microscopy for Apoptosis Marker Localization
This protocol provides nanoscale localization of apoptosis-related proteins [78].
Sample Preparation for IEM
- Fix samples with 2-4% paraformaldehyde with 0.01-0.1% glutaraldehyde for optimal antigen preservation
- For pre-embedding labeling: permeabilize with 0.1% saponin or Triton X-100 before antibody incubation
- For post-embedding labeling: embed in LR White or Lowicryl resin at low temperatures (-35°C)
Immunolabeling
- Incubate with primary antibodies against apoptosis markers (e.g., caspase-3, Bax, cytochrome c)
- Use colloidal gold-conjugated secondary antibodies (5-15 nm particle size)
- Enhance contrast with uranyl acetate and lead citrate staining
Imaging and Analysis
- Acquire TEM images at appropriate magnifications (5,000-50,000×)
- Quantify gold particle distribution across cellular compartments
- Perform statistical analysis of marker localization patterns [78]
Apoptosis Signaling Pathways and Detection Methods
The following diagram illustrates the key apoptosis pathways and corresponding detection methodologies, highlighting how different microscopy techniques target specific stages of the process.
Diagram 1: Apoptosis pathways and detection methodologies. This diagram illustrates the relationship between key apoptosis pathways and the microscopy techniques most suitable for detecting specific stages of the process.
Multimodal Validation Workflow
The following diagram presents an integrated multimodal workflow for comprehensive apoptosis validation, combining the strengths of multiple imaging techniques.
Diagram 2: Multimodal validation workflow for apoptosis research. This diagram outlines a sequential approach combining complementary techniques for comprehensive apoptosis analysis.
Essential Research Reagent Solutions
The table below catalogues essential reagents and their applications in apoptosis detection methodologies.
Table 2: Essential research reagents for apoptosis detection
| Reagent/Category | Function/Application | Compatible Techniques |
|---|---|---|
| Caspase-3/7 Substrates (NucView 488) | Fluorogenic caspase substrates for early apoptosis detection | Fluorescence microscopy, Flow cytometry [3] |
| Annexin V Conjugates | Binds phosphatidylserine exposed during apoptosis | Fluorescence microscopy, Flow cytometry [3] [28] |
| DNA Binding Dyes (Hoechst, DAPI, PI) | Nuclear staining; distinguishes apoptotic chromatin condensation | Fluorescence microscopy, Flow cytometry [10] [3] |
| Colloidal Gold Antibodies (5-15 nm) | Immunoelectron microscopy for protein localization | TEM, IEM, CLEM [78] |
| Aldehyde Fixatives (PFA, Glutaraldehyde) | Tissue fixation preserving structure and antigenicity | EM, IEM, Light microscopy [78] |
| Lowicryl Resins (K4M/HM20) | Low-temperature embedding for antigen preservation | IEM, Immuno-EM [78] |
| Biosensors (GFP-DEVD-ssGluc) | Caspase-3 activation reporter for real-time monitoring | Bioluminescence imaging, Blood monitoring [79] |
| TUNEL Assay Reagents | Detects DNA fragmentation in late apoptosis | Fluorescence microscopy, Flow cytometry [10] [3] |
Quantitative Performance Metrics
The table below compares quantitative performance metrics across key apoptosis detection methods, based on experimental data from recent studies.
Table 3: Quantitative performance metrics of apoptosis detection techniques
| Technique | Viability Assessment Accuracy | Temporal Resolution | Spatial Resolution | Multiplexing Capability | Throughput |
|---|---|---|---|---|---|
| Flow Cytometry | 94-97% (control) to 0.2-0.7% (high cytotoxicity) [28] | Minutes to hours (endpoint) | N/A (population average) | High (4+ parameters) | High (10,000+ cells/sec) [28] |
| Fluorescence Microscopy | >97% (control) to 9-10% (high cytotoxicity) [28] | Seconds to minutes (live-cell) | ~200 nm [28] | Moderate (3-4 channels) | Low to moderate [28] |
| Electron Microscopy | Morphological assessment only [10] | Days (fixed samples) | <1 nm (TEM), 5 nm (FIB-SEM 3D) [10] [78] | Low (2-3 with IEM) | Very low [10] |
| Full-Field OCT | Label-free morphological assessment [12] | Minutes (live-cell) | ~1 μm [12] | Low (label-free) | Moderate [11] |
| CLEM | Combined functional/structural assessment [7] | Days (correlative workflow) | FM: ~200 nm, EM: <10 nm [7] | High (multimodal) | Low [7] |
The establishment of a gold standard in apoptosis research necessitates moving beyond single-technique approaches toward comprehensive multimodal validation. As demonstrated through the comparative data and methodologies presented, electron microscopy provides unparalleled resolution for ultrastructural analysis, while light microscopy offers invaluable capabilities for live-cell imaging and dynamic process monitoring. The most robust research outcomes emerge from strategic integration of these complementary approaches, leveraging the strengths of each technique while mitigating their individual limitations. For researchers and drug development professionals, adopting this multimodal validation framework ensures more reproducible, clinically relevant findings that can withstand the rigorous scrutiny required for high-impact publications and regulatory approval.
Conclusion
Light and electron microscopy are not competing but profoundly complementary techniques for apoptosis research. Light microscopy is indispensable for live-cell assays, providing dynamic, real-time data on the progression of cell death. In contrast, electron microscopy offers unparalleled resolution for definitive confirmation and ultrastructural analysis of key events like apoptosome formation. The future of apoptosis imaging lies in sophisticated integration, such as Correlative Light and Electron Microscopy (CLEM), which bridges spatial and temporal scales. For researchers in drug development and cancer biology, a strategic combination of these methods, alongside emerging label-free technologies like FF-OCT, will be crucial for unlocking deeper mechanistic insights and accelerating the development of novel therapeutics that target cell death pathways.
References
- 1. Chapter One Analyzing Morphological and Ultrastructural ... [https://www.sciencedirect.com/science/article/abs/pii/S0076687908014018]
- 2. Morphological and cytochemical determination of cell ... [https://pmc.ncbi.nlm.nih.gov/articles/PMC2137940/]
- 3. Light Microscopy as a Tool to Detect Apoptosis and Other ... [https://pmc.ncbi.nlm.nih.gov/articles/PMC12051451/]
- 4. Comparison of several techniques for the detection ... [https://pmc.ncbi.nlm.nih.gov/articles/PMC6495494/]
- 5. Large transient assemblies of Apaf1 constitute the ... [https://www.nature.com/articles/s41467-025-64478-9]
- 6. Evaluating cell viability assessment techniques: a comparative ... [https://biomedical-engineering-online.biomedcentral.com/articles/10.1186/s12938-025-01452-y]
- 7. 3D correlative light and electron microscopy reveals the ... [https://www.sciencedirect.com/science/article/pii/S1549963425000735]
- 8. The Comparison of Apoptosis Anti ... [https://hamidiyemedj.com/articles/the-comparison-of-apoptosis-anti-apoptosis-and-autophagy-markers-in-epicardial-tissue-in-patients-with-coronary-artery-disease-and-in-patients-have-valvular-disease-hocm-ascending-aortic-aneurysm-without-coronary-artery-disease/hamidiyemedj.galenos.2023.21033]
- 9. Light Microscopy as a Tool to Detect Apoptosis and Other Cellular Changes and Damage · Volume 36(1); 2025 Apr [https://jbt.pubpub.org/pub/4n84h3kc/release/1]
- 10. Research review Screening and Detection of Apoptosis [https://www.sciencedirect.com/science/article/abs/pii/S0022480406004008]
- 11. High-Resolution Imaging of Morphological Changes ... [https://www.mdpi.com/2079-6374/15/8/522]
- 12. High-Resolution Imaging of Morphological Changes ... [https://pubmed.ncbi.nlm.nih.gov/40862983/]
- 13. Fast, three-dimensional, live-cell super-resolution imaging ... [https://www.nature.com/articles/s41566-025-01638-9]
- 14. Dose-efficient cryo-electron microscopy for thick samples ... [https://www.nature.com/articles/s41592-025-02834-9]
- 15. Five takeaways from 'In situ structural biology: expanding ... [https://www.embl.org/about/info/course-and-conference-office/2025/05/five-takeaways-from-in-situ-structural-biology-expanding-the-toolbox-for-structural-cell-biology/]
- 16. Breaking the resolution limit in light microscopy [https://pubmed.ncbi.nlm.nih.gov/23931521/]
- 17. The Diffraction Barrier in Optical Microscopy [https://www.microscopyu.com/techniques/super-resolution/the-diffraction-barrier-in-optical-microscopy]
- 18. Resolution and contrast in the electron microscope [https://pubmed.ncbi.nlm.nih.gov/7143434/]
- 19. Cell volume changes during apoptosis monitored in real ... [https://www.sciencedirect.com/science/article/abs/pii/S104784771200086X]
- 20. High-Resolution Imaging of Morphological Changes ... [https://pmc.ncbi.nlm.nih.gov/articles/PMC12384366/]
- 21. Programmed cell death detection methods: a systematic ... [https://link.springer.com/article/10.1007/s10495-022-01735-y]
- 22. Quantitative Phase Imaging: Recent Advances and Expanding ... [https://pmc.ncbi.nlm.nih.gov/articles/PMC10112851/]
- 23. Diversity and complexity of cell death: a historical review [https://www.nature.com/articles/s12276-023-01078-x]
- 24. Multi-parametric imaging of cell heterogeneity in apoptosis ... [https://www.sciencedirect.com/science/article/abs/pii/S1046202316302055]
- 25. Measuring apoptosis by microscopy and flow cytometry [https://pubmed.ncbi.nlm.nih.gov/23403105/]
- 26. Apoptosis Assays | Thermo Fisher Scientific - US [https://www.thermofisher.com/us/en/home/life-science/cell-analysis/cell-viability-and-regulation/apoptosis.html]
- 27. Light Microscopy as a Tool to Detect Apoptosis and Other ... [https://pubmed.ncbi.nlm.nih.gov/40329982/]
- 28. Evaluating cell viability assessment techniques [https://pmc.ncbi.nlm.nih.gov/articles/PMC12492793/]
- 29. Apoptosis antibodies: Tools for cell death detection [https://www.abcam.com/en-us/knowledge-center/antibodies/apoptosis-antibodies]
- 30. Apoptotic Membrane Blebbing Is Regulated by Myosin ... [https://pmc.ncbi.nlm.nih.gov/articles/PMC2140178/]
- 31. of Detection : A review of conventional and novel... apoptosis [https://pubs.rsc.org/en/content/articlehtml/2010/ay/c0ay00247j]
- 32. Detection of cell-surface phosphatidylserine using the ... [https://www.sciencedirect.com/science/article/abs/pii/S0076687920301609]
- 33. A Fluorogenic Probe for Cell Surface Phosphatidylserine ... [https://pubmed.ncbi.nlm.nih.gov/30548909/]
- 34. Design and optimization of caspase-1-responsive fluorescent ... [https://pmc.ncbi.nlm.nih.gov/articles/PMC12598616/]
- 35. Caspase 8-activated bioluminescence probe for in vivo ... [https://www.sciencedirect.com/science/article/abs/pii/S0956566325008802]
- 36. Verification of performance of a direct fluorescent assay ... [https://pmc.ncbi.nlm.nih.gov/articles/PMC8243239/]
- 37. Morphological assessment of apoptosis [https://www.sciencedirect.com/science/article/abs/pii/S1046202307002150]
- 38. Ultrastructure Microscopic Characterization of Apoptosis in ... [https://pmc.ncbi.nlm.nih.gov/articles/PMC11700348/]
- 39. What Are The Main 3D Electron Microscopy Techniques? - Blog [https://blog.delmic.com/what-are-the-main-3d-electron-microscopy-techniques]
- 40. Transmission Electron Microscopy to Follow Ultrastructural ... [https://pmc.ncbi.nlm.nih.gov/articles/PMC8864112/]
- 41. light-electron microscopy: integrating Correlative to dynamics structure [https://colab.ws/articles/10.1016%2Fj.tibs.2023.05.003]
- 42. Transformer-based spatial–temporal detection of apoptotic ... [https://elifesciences.org/articles/90502]
- 43. Correlated three-dimensional light and electron reveals... microscopy [https://pubmed.ncbi.nlm.nih.gov/17721514/]
- 44. (PDF) Apoptosis in Human Epidermis: A Postmortem Study by Light ... [https://www.academia.edu/31175884/Apoptosis_in_Human_Epidermis_A_Postmortem_Study_by_Light_and_Electron_Microscopy]
- 45. Detection of fragmented DNA in apoptotic cells embedded ... [https://pubmed.ncbi.nlm.nih.gov/10082758/]
- 46. Comparison of Several Techniques for the Detection ... [https://www.creative-bioarray.com/support/comparison-of-several-techniques-for-the-detection-of-apoptotic-cells.htm]
- 47. Guidelines for the use and interpretation of assays ... [https://pmc.ncbi.nlm.nih.gov/articles/PMC2757140/]
- 48. Guidelines for Regulated Cell Death Assays: A Systematic ... [https://www.frontiersin.org/journals/cell-and-developmental-biology/articles/10.3389/fcell.2021.634690/full]
- 49. Programmed cell death detection methods - PubMed Central [https://pmc.ncbi.nlm.nih.gov/articles/PMC9308588/]
- 50. Apoptosis: A Comprehensive Overview of Signaling ... [https://www.mdpi.com/2073-4409/13/22/1838]
- 51. Tailoring of apoptotic bodies for diagnostic and therapeutic ... [https://pmc.ncbi.nlm.nih.gov/articles/PMC11367938/]
- 52. Live-dead assay on unlabeled cells using phase imaging ... [https://www.nature.com/articles/s41467-022-28214-x]
- 53. Apoptosis western blot guide [https://www.abcam.com/en-us/knowledge-center/western-blot/western-blot-analysis-of-apoptosis]
- 54. Optimizing the in vitro neuronal microenvironment to ... [https://pubmed.ncbi.nlm.nih.gov/40999471/]
- 55. Optimizing the in vitro neuronal microenvironment to mitigate ... [https://stemcellres.biomedcentral.com/articles/10.1186/s13287-025-04591-0]
- 56. "Reading cell death with light: Real-time visualization of ... [https://www.eurekalert.org/news-releases/1096590]
- 57. Advanced concept for identifying chemico-biological ... [https://www.sciencedirect.com/science/article/abs/pii/S0010482525015392]
- 58. Super-resolved live-cell imaging using random illumination ... [https://www.sciencedirect.com/science/article/pii/S2667237521000096]
- 59. Fast segmentation and multiplexing imaging of organelles ... [https://www.nature.com/articles/s41467-025-57877-5]
- 60. Mastering the art of sectioning: a comprehensive guide to ... [https://www.frontiersin.org/journals/veterinary-science/articles/10.3389/fvets.2025.1635706/full]
- 61. Low Voltage Electron Microscopy: Staining Biological Thin ... [https://delongamerica.com/application-note-lvem-biological-thin-section-staining-flexibility]
- 62. A Step-By-Step Protocol for Correlative Light and Electron ... [https://pmc.ncbi.nlm.nih.gov/articles/PMC12336855/]
- 63. Extreme microscopy to the attosecond and beyond [https://spie.org/news/photonics-focus/mayjune-2025/capturing-ultrafast-phenomena]
- 64. Apoptosis and Beyond: Cytometry in Studies of ... [https://pmc.ncbi.nlm.nih.gov/articles/PMC3263828/]
- 65. Scientific summary - NCBI - NIH [https://www.ncbi.nlm.nih.gov/books/NBK616155/]
- 66. Where the tiny becomes mighty: light vs electron microscopy [https://abberior.rocks/knowledge-base/where-the-tiny-becomes-mighty-light-vs-electron-microscopy/]
- 67. Advancing Nanomedicine Through Electron Microscopy [https://pmc.ncbi.nlm.nih.gov/articles/PMC11899938/]
- 68. An accessible and high-throughput strategy of continuously ... [https://pmc.ncbi.nlm.nih.gov/articles/PMC6397776/]
- 69. Transformer-based spatial-temporal detection of apoptotic ... [https://elifesciences.org/reviewed-preprints/90502]
- 70. Electron Microscope Price, including Cost of 50 Different ... [https://www.labx.com/resources/electron-microscope-price-including-cost-of-50-different-models/425]
- 71. Apoptosome [https://en.wikipedia.org/wiki/Apoptosome]
- 72. New insights into apoptosome structure and function - PMC [https://pmc.ncbi.nlm.nih.gov/articles/PMC6030056/]
- 73. Large transient assemblies of Apaf1 constitute the ... [https://pubmed.ncbi.nlm.nih.gov/41136486/]
- 74. A Structure of the Human Apoptosome at 12.8 Å Resolution ... [https://www.sciencedirect.com/science/article/pii/S0969212605003497]
- 75. A near atomic structure of the active human apoptosome [https://pubmed.ncbi.nlm.nih.gov/27697150/]
- 76. Investigation of apoptosis based on fluorescence lifetime ... [https://pmc.ncbi.nlm.nih.gov/articles/PMC9044426/]
- 77. Label-Free Three-Dimensional Morphological ... [https://www.mdpi.com/1424-8220/24/11/3435]
- 78. Immunoelectron microscopy: a comprehensive guide from ... [https://pmc.ncbi.nlm.nih.gov/articles/PMC12420552/]
- 79. Multimodal In Vivo Imaging and Blood Monitoring of ... [https://pmc.ncbi.nlm.nih.gov/articles/PMC3129810/]