H&E Staining for Apoptosis Detection: A Comprehensive Protocol and Research Guide
This article provides a comprehensive guide for researchers and drug development professionals on utilizing Hematoxylin and Eosin (H&E) staining for apoptosis detection.
H&E Staining for Apoptosis Detection: A Comprehensive Protocol and Research Guide
Abstract
This article provides a comprehensive guide for researchers and drug development professionals on utilizing Hematoxylin and Eosin (H&E) staining for apoptosis detection. It covers the foundational morphological hallmarks of programmed cell death visible in H&E-stained tissues, detailed step-by-step protocols, and advanced computational methods like the CSGO pipeline for whole-cell segmentation. The content addresses common troubleshooting scenarios and pitfalls in interpretation, while offering a rigorous comparison with specialized techniques such as TUNEL, methyl green-pyronin staining, and fluorescent reporters. By synthesizing traditional histology with emerging AI-driven analysis, this resource serves as a vital reference for validating apoptosis in both basic research and clinical pathology contexts.
Understanding Apoptosis: Core Morphological Hallmarks in H&E-Stained Tissues
Apoptosis, or programmed cell death, is a fundamental biological process essential for development and maintaining health in multicellular organisms [1]. This process is characterized by a series of biochemical events that lead to characteristic cell changes and death. Unlike traumatic cell death (necrosis), apoptosis is a highly regulated and controlled process that confers advantages during an organism's lifecycle [2].
The process of apoptosis follows a predictable pattern of morphological changes: cells shrink, condense, and display bulging protrusions (blebbing) on their surface [3]. The cytoskeleton collapses, the nuclear envelope disassembles, and nuclear DNA fragments into pieces [1]. Crucially, apoptotic cells are neatly packaged into small bits that neighboring cells or specialized immune cells called phagocytes can consume, allowing organic components to be recycled without triggering a damaging inflammatory response [2] [1].
Molecular Mechanisms of Apoptosis
The Caspase Cascade
The execution of apoptosis is primarily mediated by a family of proteases called caspases (cysteine-dependent aspartate-specific proteases), which exist in cells as inactive precursors known as procaspases [1]. These molecular "scissors" are activated through a proteolytic cascade that amplifies the death signal throughout the cell [1] [3].
Once activated, caspases cleave specific cellular proteins, including:
- Nuclear lamins, causing irreversible breakdown of the nuclear lamina
- Proteins that inhibit DNA-degrading enzymes, freeing DNases to cut up nuclear DNA
- Structural proteins, leading to cell shrinkage and membrane blebbing [1]
Key Signaling Pathways
Apoptosis can be initiated through two principal pathways:
Death Receptor Pathway (Extrinsic): Triggered by extracellular signals binding to death receptors on the cell surface. For example, when Fas ligand binds to Fas receptors, the clustered receptors recruit intracellular adaptor proteins that aggregate and activate initiator procaspase-8 molecules [1].
Mitochondrial Pathway (Intrinsic): Activated by cellular stress or damage, leading to the release of cytochrome c from mitochondria. Cytochrome c binds to the adaptor protein Apaf-1, triggering the activation of initiator caspases [1]. The intrinsic pathway is tightly regulated by the Bcl-2 family of proteins [4] [1].
The following diagram illustrates the core molecular pathways of apoptosis:
Key Regulatory Proteins
The apoptotic process is tightly controlled by several protein families:
Bcl-2 Family Proteins: These intracellular proteins regulate the mitochondrial pathway. Some members (Bcl-2, Bcl-xL) inhibit apoptosis, while others (Bax, Bak, Bad) promote cell death [1]. The balance between pro-apoptotic and anti-apoptotic Bcl-2 family members determines cellular fate [4].
IAP Proteins: Inhibitor of Apoptosis proteins block caspase activity, preventing unnecessary cell death. Some viruses produce IAP proteins to prevent infected cells from dying before viral replication is complete [1].
p53 Protein: This tumor suppressor protein activates genes that promote apoptosis in response to DNA damage, helping prevent uncontrolled cell division that could lead to cancer [2] [3].
Hematoxylin and Eosin Staining for Apoptosis Detection
H&E Staining Fundamentals
The Hematoxylin and Eosin (H&E) staining protocol remains the gold standard for routine histological assessment of cellular and tissue structure, including apoptosis detection [5]. This century-old technique provides exceptional nuclear and cytoplasmic contrast that reveals characteristic apoptotic morphology under light microscopy.
Hematoxylin, extracted from the logwood tree Haematoxylum campechianum, stains nuclear components blue [5]. The actual staining molecule is hematein, produced by oxidation of hematoxylin, which forms complexes with mordants like aluminum salts to bind anionic tissue components, particularly chromatin [5].
Eosin Y, the most commonly used counterstain, distinguishes cytoplasmic elements pink, with varying shades for different connective tissue fibers [5]. The addition of acetic acid sharpens eosin staining, while phloxine can enhance red tones for richer morphological detail [5].
Comprehensive H&E Staining Protocol
The following table outlines the standardized H&E staining procedure for apoptosis detection:
Table 1: Comprehensive H&E Staining Protocol for Apoptosis Detection
| Step | Reagent | Duration | Purpose | Key Considerations |
|---|---|---|---|---|
| Dewaxing | Xylene | 2 minutes × 2 changes | Remove paraffin from tissue sections | Complete removal essential for stain penetration |
| Hydration | 100% Ethanol | 2 minutes × 2 changes | Prepare sections for aqueous staining | Ensure sequential concentration steps |
| Hydration | 95% Ethanol | 2 minutes | Transition to aqueous environment | Critical for stain uniformity |
| Rinsing | Distilled Water | 2 minutes | Remove residual alcohol | Prepares for nuclear staining |
| Nuclear Staining | Hematoxylin | 3 minutes | Stain nuclear chromatin | Timing varies by hematoxylin type |
| Rinsing | Running Water | 1 minute | Remove excess stain | Prevents background staining |
| Differentiation | Acid Solution | 1 minute | Remove excess nuclear stain | Critical for nuclear detail |
| Rinsing | Distilled Water | 1 minute | Stop differentiation | Prevents over-differentiation |
| Bluing | Scott's Tap Water/Ammonia | 1 minute | Convert red to blue nuclear stain | Enhances nuclear contrast |
| Rinsing | Distilled Water | 1 minute | Remove bluing agent | Prepares for counterstain |
| Counterstaining | Eosin Y | 45 seconds | Stain cytoplasmic elements | Timing critical for contrast |
| Dehydration | 95% Ethanol | 1 minute | Begin dehydration | Prevents stain leaching |
| Dehydration | 100% Ethanol | 1 minute × 2 changes | Complete dehydration | Essential for clearing |
| Clearing | Xylene | 2 minutes × 2 changes | Replace ethanol with xylene | Enables permanent mounting |
| Mounting | Mounting Medium + Coverslip | Permanent | Preserve stained section | Avoid air bubbles |
Morphological Identification of Apoptotic Cells in H&E Stains
In H&E-stained tissue sections, apoptotic cells display characteristic morphological features:
- Nuclear condensation: Shrunken, densely stained (hyperchromatic), fragmented nuclei
- Cell shrinkage: Reduced cytoplasmic volume compared to neighboring cells
- Membrane blebbing: Bulging protrusions from the cell surface
- Formation of apoptotic bodies: Small, membrane-bound fragments containing nuclear material
These morphological hallmarks allow researchers to identify and quantify apoptotic events in tissue contexts, providing crucial information about cell turnover, tissue homeostasis, and pathological processes [3].
Advanced Apoptosis Detection Methods
Flow Cytometry with Annexin V/Propidium Iodide
The Annexin V binding assay represents a sophisticated approach for detecting early apoptotic events. This method capitalizes on the externalization of phosphatidylserine (PS) from the inner to outer leaflet of the plasma membrane during early apoptosis [6] [7]. Annexin V, a calcium-dependent phospholipid-binding protein, has high affinity for exposed PS, enabling detection of apoptotic cells before loss of membrane integrity [8].
Propidium iodide (PI) incorporation assesses plasma membrane integrity, distinguishing early apoptotic cells (Annexin V+/PI-) from late apoptotic or necrotic cells (Annexin V+/PI+) [8]. The experimental workflow for this assay is illustrated below:
TUNEL Assay for DNA Fragmentation
The TUNEL (TdT dUTP Nick-End Labeling) assay detects DNA fragmentation, a hallmark of late apoptosis. This method uses the enzyme terminal deoxynucleotidyl transferase (TdT) to label free 3'-OH ends of DNA fragments with modified nucleotides, allowing visualization of cells undergoing apoptotic DNA degradation [7].
Caspase Activity Assays
Activation of executioner caspases (particularly caspase-3) represents a committed step in apoptosis. Detection methods include:
- Fluorescent substrates that emit signal upon cleavage
- Antibody-based detection of activated caspase fragments
- Western blot analysis of caspase cleavage products
Research Reagent Solutions for Apoptosis Studies
Table 2: Essential Research Reagents for Apoptosis Detection
| Reagent Category | Specific Examples | Primary Function | Application Notes |
|---|---|---|---|
| H&E Staining Components | Mayer's Hematoxylin, Harris Hematoxylin, Eosin Y | Nuclear and cytoplasmic staining for morphological assessment | Harris hematoxylin provides clear nuclear detail; differentiation critical for specificity [5] |
| Flow Cytometry Reagents | Annexin V conjugates (FITC, PE, APC), Propidium Iodide, 7-AAD | Detection of phosphatidylserine exposure and membrane integrity | Calcium-dependent binding; requires calcium-containing buffers [6] [8] |
| DNA Fragmentation Assays | TUNEL assay kits, DNA laddering reagents | Detection of oligonucleosomal DNA cleavage | Terminal deoxynucleotidyl transferase (TdT) dependent; specific for late apoptosis [7] |
| Caspase Activity Detectors | Fluorogenic caspase substrates, caspase antibodies, caspase inhibitors | Measurement of caspase activation and activity | Specific substrates available for different caspases (3, 8, 9) |
| Mitochondrial Probes | JC-1, TMRM, MitoTracker dyes | Assessment of mitochondrial membrane potential (ΔΨm) | JC-1 exhibits potential-dependent emission shift from green to red [4] |
| Protein Detection | Antibodies to Bcl-2 family proteins, p53, cytochrome c | Analysis of apoptotic regulator expression and localization | Western blot, immunohistochemistry, and flow cytometry applications [4] |
| Viability Indicators | Trypan blue, Calcein AM, Fixable Viability Dyes | Discrimination of live vs. dead cells | Fixable dyes permit subsequent antibody staining [6] |
Quantitative Analysis and Market Applications
Apoptosis Assay Market Landscape
The growing importance of apoptosis research is reflected in the expanding market for apoptosis detection technologies. Current market analysis reveals significant growth driven by increasing research in oncology, neurodegenerative diseases, and drug development:
Table 3: Apoptosis Testing Market Analysis and Projections
| Market Segment | 2024/2025 Value | 2034 Projection | CAGR | Key Drivers |
|---|---|---|---|---|
| North America Apoptosis Assay Market | USD 2.7 billion (2024) | USD 6.1 billion | 8.4% | Chronic disease prevalence, personalized medicine, technological advances [9] |
| Global Apoptosis Testing Market | USD 3,524 million (2025) | USD 5,850.6 million | 5.2% | Drug development R&D, cancer research, toxicology testing [10] |
| Market Leader | Thermo Fisher Scientific (26.5% share) | - | - | Comprehensive portfolio including reagents, kits, flow cytometry systems [9] |
| Product Segment (Consumables) | USD 1.5 billion (2024) | USD 3.4 billion | 8.5% | Demand for reproducible, high-quality reagents and assay kits [9] |
| Instrument Segment | USD 1.2 billion (2024) | USD 2.7 billion | 8.3% | Adoption of automated imaging platforms and AI integration [9] |
Key Market Trends and Applications
The apoptosis testing market is undergoing rapid transformation influenced by several key trends:
Technological Advancements: Sophisticated platforms including high-throughput flow cytometry, fluorescence imaging, and luminescence-based assays are becoming standard tools in research laboratories [9]. These technologies enable detection of early apoptotic signals with improved sensitivity and reliability.
Personalized Medicine Applications: Apoptosis assays are increasingly used to assess how tumor cells respond to targeted therapies, enabling treatment customization based on individual patient profiles [9]. This approach allows clinicians to modify therapies for optimal effectiveness and minimal side effects.
Drug Discovery and Development: Pharmaceutical companies utilize apoptosis testing extensively in preclinical screening to evaluate compound efficacy and toxicity [10]. These assays provide critical data for regulatory submissions and clinical trial design.
AI Integration: Artificial intelligence is reshaping apoptosis detection through automated gating, real-time image processing, and predictive analytics, significantly improving assay accuracy and laboratory efficiency [9].
Apoptosis represents a critical biological process with far-reaching implications for basic research and clinical applications. The morphological assessment enabled by H&E staining provides a foundational approach for identifying apoptotic cells in tissue contexts, while advanced techniques like Annexin V flow cytometry offer sophisticated quantification of apoptotic dynamics.
The continued refinement of apoptosis detection methodologies, coupled with growing understanding of apoptotic regulatory mechanisms, promises to accelerate drug discovery and therapeutic development across multiple disease domains. As the field evolves, integration of artificial intelligence, high-content screening, and multiplexed assay platforms will further enhance our ability to precisely monitor and manipulate cell death pathways for therapeutic benefit.
The expanding apoptosis testing market reflects the central importance of programmed cell death in biomedical research, with applications spanning from basic mechanism discovery to clinical diagnostics and therapeutic monitoring.
Within the field of cell death research, the hematoxylin and eosin (H&E) staining method remains a fundamental and indispensable tool for the initial morphological assessment of apoptosis. Despite the availability of sophisticated biochemical and molecular techniques, H&E staining provides an accessible, cost-effective, and information-rich first line of analysis for identifying regulated cell death in tissues [11] [12]. This application note details the critical morphological features of apoptosis—cell shrinkage, cytoplasmic condensation, and pyknosis—as revealed through H&E staining, providing researchers and drug development professionals with detailed protocols and analytical frameworks for accurate detection and interpretation within the context of a standard H&E staining protocol.
Core Morphological Features of Apoptosis in H&E
The identification of apoptosis via H&E staining relies on the recognition of distinct, sequential alterations in cellular and nuclear architecture. These features are a direct consequence of the biochemical events of programmed cell death and are consistently observable under light microscopy.
Cell Shrinkage and Cytoplasmic Condensation
The initial phase of apoptosis involves a reduction in cell volume and compaction of the cytoplasm.
- Morphological Appearance: The affected cell becomes noticeably smaller and more rounded than its healthy neighbors, losing its characteristic contacts with the surrounding tissue architecture [13].
- Cytoplasmic Staining: The cytoplasm, stained pinkish-red by eosin, becomes intensely eosinophilic (darker pink) due to increased packing of cellular components and loss of water [12] [13]. This heightened cytoplasmic condensation is a key diagnostic clue.
Nuclear Changes: Pyknosis, Karyorrhexis, and Karyolysis
Nuclear disintegration is the most characteristic feature of apoptosis and progresses through three classic stages, with pyknosis being the most readily identifiable in H&E sections.
- Pyknosis: This stage is defined by nuclear condensation. The nucleus shrinks, and the chromatin aggregates into a small, dense, homogeneous, and deeply basophilic (blue-purple) mass [14] [13]. The nuclear outline may become irregular.
- Karyorrhexis: Following pyknosis, the pyknotic nucleus undergoes fragmentation. The single, dense mass breaks up into multiple discrete, dark basophilic fragments [13].
- Karyolysis: In this final stage, the nuclear fragments undergo complete dissolution and fade from view [13].
Formation of Apoptotic Bodies
A hallmark of apoptosis is the packaging of the shrunken cell's contents, including the pyknotic or karyorrhectic nuclear fragments and condensed cytoplasm, into membrane-bound vesicles known as apoptotic bodies. These structures are subsequently phagocytosed and degraded by neighboring cells or macrophages, a process that typically occurs without eliciting a significant inflammatory response [13].
Quantitative Analysis of Morphological Features
The table below summarizes the key morphological features and their diagnostic significance for apoptosis detection in H&E-stained sections.
Table 1: Key Morphological Features of Apoptosis in H&E-Stained Sections
| Morphological Feature | Description in H&E Stain | Diagnostic Significance |
|---|---|---|
| Cell Shrinkage | Reduction in overall cell volume; cell appears smaller and rounded [13]. | Early indicator of apoptosis; distinguishes from necrotic cell swelling. |
| Cytoplasmic Condensation | Increased intensity of eosin staining (darker pink); denser appearance [12] [13]. | Reflects dehydration and compaction of cellular contents. |
| Pyknosis | Nuclear shrinkage and condensation into a single, small, dense, dark blue/purple mass [14] [13]. | A primary and easily recognizable hallmark of apoptotic nuclei. |
| Karyorrhexis | Fragmentation of the pyknotic nucleus into multiple, discrete, dark blue particles [13]. | Represents the progression of nuclear disintegration. |
| Apoptotic Bodies | Membrane-bound vesicles containing pyknotic nuclear material and/or condensed cytoplasm [13]. | Pathognomonic feature of apoptosis; indicates clean, regulated cell disposal. |
Quantitative data further reinforces the validity of these morphological observations. For instance, a 2023 study investigating oligodendrocyte loss in multiple sclerosis documented a statistically significant reduction in nuclear size (pyknosis) in remaining oligodendrocytes both in vitro under metabolic stress and in situ within MS lesions, providing a measurable correlate to the qualitative description [14]. Furthermore, a 2024 study on irreversible electroporation demonstrated a biphasic regulation of apoptosis in gastric tissue, where the level of apoptosis, confirmed by caspase-3 immunohistochemistry, peaked at a specific electrical energy (200 V / 1000 V/cm) before decreasing at higher intensities. This underscores that morphological apoptosis has a quantifiable relationship with the intensity of the apoptotic stimulus [15].
Table 2: Quantitative Relationships in Apoptosis from Recent Studies
| Study Context | Quantitative Finding | Measurement Technique | Implication for H&E Morphology |
|---|---|---|---|
| Oligodendrocyte Loss in MS [14] | Significant reduction in nuclear size of oligodendrocytes. | Morphometric analysis of nuclear area. | Pyknosis is a quantifiable metric in H&E images. |
| Gastric Irreversible Electroporation [15] | Apoptosis levels peaked at 200 V (1000 V/cm), then decreased at 300V and 400V. | Semi-quantitative IHC for activated caspase-3. | Morphological apoptosis in H&E has a non-linear relationship with stimulus intensity. |
Experimental Protocols for H&E-Based Apoptosis Assessment
Standard H&E Staining Protocol for Apoptosis Detection
The following detailed protocol is essential for producing high-quality H&E stains that allow for reliable identification of apoptotic features [11].
- Tissue Fixation: Immerse tissue samples in 10% neutral buffered formalin for 6-24 hours, depending on tissue size, to preserve morphology and prevent autolysis [11].
- Dehydration & Clearing: Process fixed tissues through a graded series of ethanol (70%, 80%, 90%, 95%, and 100%) to remove water. Follow with immersion in xylene to clear the alcohol from the tissue [11].
- Paraffin Embedding & Sectioning: Infiltrate tissue with molten paraffin and embed in a block. Section using a microtome to obtain thin slices (typically 4-5 μm thick) and mount on glass slides [11].
- Deparaffinization and Rehydration: Prior to staining, departaffinize sections in xylene and rehydrate through a descending series of ethanol (100%, 95%, 80%) to water [11].
- Hematoxylin Staining: Immerse slides in Mayer's or Harris's Hematoxylin solution for 5-10 minutes to stain cell nuclei. Rinse in tap water [11].
- Differentiation & Bluing: Briefly dip slides in acid-alcohol (1% HCl in 70% ethanol) to remove excess hematoxylin. Rinse and then immerse in a weak alkaline solution (e.g., ammonia water or Scott's tap water) to turn the nuclear stain a permanent blue color ("bluing") [11].
- Eosin Counterstain: Immerse slides in Eosin Y solution for 1-5 minutes to stain the cytoplasm and extracellular matrix. Rinse briefly in water to remove excess stain [11].
- Dehydration, Clearing, and Mounting: Rapidly dehydrate sections through ascending alcohols (95%, 100%), clear in xylene, and mount under a coverslip with a synthetic resinous mounting medium [11].
Workflow for Morphological Analysis of Apoptosis
The following diagram illustrates the integrated experimental workflow from tissue preparation to microscopic evaluation for apoptosis detection.
Correlative Immunohistochemistry for Apoptosis
While H&E staining identifies morphology, correlative confirmation with specific biochemical markers is often employed. A common protocol is detailed below [11] [15].
- Antigen Retrieval: After deparaffinization and rehydration, perform heat-induced epitope retrieval (HIER) by heating slides in a citrate or EDTA buffer (pH 6.0 or 9.0) at 95-100°C for 10-20 minutes [11].
- Protein Blocking: Incubate tissue sections with a protein-blocking buffer (e.g., serum, BSA) for 30-60 minutes at room temperature to prevent non-specific antibody binding [11].
- Primary Antibody Incubation: Apply diluted primary antibody (e.g., anti-cleaved caspase-3 for apoptosis) to the sections and incubate for 1 hour at room temperature or overnight at 4°C [15].
- Secondary Antibody Incubation: Apply an enzyme-conjugated (e.g., HRP) secondary antibody for 30-60 minutes at room temperature [11].
- Visualization: Incubate slides with a chromogenic substrate (e.g., DAB) which produces a brown precipitate at the antigen site. Counterstain lightly with hematoxylin to visualize nuclei [11] [15].
- Analysis: Correlate the presence of DAB-positive (brown) cells with the characteristic pyknotic, shrunken morphology in adjacent H&E-stained serial sections.
Integrated Signaling in Apoptosis
The morphological features observed in H&E-stained sections are the end result of a complex interplay of biochemical signaling pathways. The following diagram maps the relationship between key apoptotic pathways and their morphological outcomes.
The Scientist's Toolkit: Essential Research Reagents
The table below lists key reagents and their specific functions in the study of apoptosis, as cited in recent literature.
Table 3: Key Research Reagents for Apoptosis Studies
| Reagent / Assay | Function / Target | Application Example |
|---|---|---|
| Cleaved Caspase-3 IHC [15] | Detects activated executive caspase; biochemical hallmark of apoptosis. | Semi-quantitative assessment of apoptosis levels in gastric tissue post-IRE [15]. |
| TUNEL Assay [15] | Labels DNA fragmentation, a late-stage event in apoptosis. | Used alongside caspase-3 IHC to confirm apoptosis; showed continued increase with higher voltages [15]. |
| Annexin V/PE Assay [16] | Binds to phosphatidylserine externalized on the outer leaflet of the plasma membrane in early apoptosis. | Flow cytometry analysis to quantify early and late apoptotic HeLa and DU145 cells treated with Quinalizarin [16]. |
| LC3 Antibody [14] | Marker for autophagosomes; used to monitor autophagy. | Immunofluorescence showed increased LC3 expression in oligodendrocytes in MS lesions, indicating stalled autophagy [14]. |
| Quinalizarin [16] | An anthraquinone that induces apoptosis and autophagy in cancer cells. | Used to trigger caspase-3/7 dependent apoptosis in cervical (HeLa) and prostate (DU145) cancer cell lines [16]. |
| Chloroquine [16] | Autophagy inhibitor that blocks autophagosome-lysosome fusion. | Pre-incubation with chloroquine potentiated Quinalizarin's cytotoxic effect, confirming interplay between death pathways [16]. |
Apoptosis, or programmed cell death, is a fundamental process for maintaining tissue homeostasis, characterized by a series of distinct morphological changes [17]. The formation of apoptotic bodies (ApoBDs) is a hallmark event in the final stage of apoptosis, during which the cell dismantles itself into small, membrane-bound vesicles [18]. These bodies are then efficiently cleared by phagocytes, preventing inflammatory responses and collateral damage to surrounding tissues [17]. Within the context of hematoxylin and eosin (H&E) staining research, the accurate identification of ApoBDs via their classic morphological features—specifically, nuclear fragmentation and membrane blebbing—is crucial for diagnosing apoptosis in tissue samples and for fundamental cell death research. This application note details the protocols and analytical frameworks for their reliable detection.
Core Morphological Hallmarks of Apoptosis
The progression of apoptosis is defined by specific, sequential structural alterations. The following table summarizes the key morphological hallmarks observable via microscopy, which are vital for distinguishing apoptosis from other forms of cell death like necroptosis or pyroptosis [17].
Table 1: Key Morphological Hallmarks of Apoptosis
| Morphological Feature | Description | Distinguishing Value |
|---|---|---|
| Cell Shrinkage & Condensation | Reduction in cell volume and increased cytoplasmic density. | An early event that distinguishes it from necrotic cell swelling. |
| Nuclear Fragmentation | Chromatin condensation and disintegration of the nucleus into discrete fragments. | A definitive hallmark; visualized by DNA-binding stains like Hoechst 33342 [19]. |
| Membrane Blebbing | Formation of dynamic, outward protrusions of the plasma membrane. | Driven by actomyosin contraction; leads to the formation of ApoBDs [18]. |
| Formation of Apoptotic Bodies | The cell fragments into multiple, tightly membrane-bound vesicles. | The final morphological stage, containing cytosol and/or condensed nuclear material. |
| Phosphatidylserine (PtdSer) Exposure | Translocation of PtdSer from the inner to the outer membrane leaflet. | An "eat-me" signal for phagocytes; detectable by Annexin V binding [20] [21]. |
Quantitative Analysis of Apoptotic Body Formation
Recent high-resolution microscopy studies have provided quantitative insights into the process of ApoBD formation. Research on a newly described mechanism, the 'FOotprint Of Death' (FOOD), reveals how adherent cells generate large, substrate-bound extracellular vesicles during apoptosis [22].
Table 2: Quantitative Characteristics of FOOD-Derived Apoptotic Bodies (F-ApoEVs)
| Parameter | Quantitative Measurement | Experimental Context |
|---|---|---|
| Median Number of F-ApoEVs per Cell | ~40 vesicles | Generated within 4 hours post-apoptosis induction in Mouse Embryonic Fibroblasts (MEFs) [22]. |
| Diameter of F-ApoEVs | ~2 μm | Consistent with the size range of large apoptotic bodies [22]. |
| FOOD Branch Thickness | ~1.5 μm | Measured in MEFs; indicates thin, sheet-like membrane structures [22]. |
| Occupied Area by FOOD | ~193.7 μm² | The surface area on the substrate marked by the membranous footprint [22]. |
| Frequency of FOOD Formation | ~80-99% of apoptotic cells | Observed across diverse cell types and apoptotic stimuli [22]. |
Experimental Protocols for Detection
A multi-technique approach is recommended for robust identification of apoptotic bodies. The protocols below outline key methods for detecting the hallmark features described.
Protocol for Nuclear Staining with Hoechst 33342
This protocol is used to visualize nuclear condensation and fragmentation, key indicators of apoptosis [19].
- Prepare Stock Solution: Dissolve Hoechst 33342 trihydrochloride in deionized water to create a 10 mg/mL (16.23 mM) stock solution. Sonicate if necessary to dissolve and store at ≤ -20°C.
- Prepare Staining Solution: Dilute the stock solution 1:2000 in phosphate-buffered saline (PBS) to create a working solution.
- Stain Cells: Remove culture medium from cells grown on a microscopy-suitable vessel. Add sufficient staining solution to cover the cells.
- Incubate: Incubate for 5–10 minutes at room temperature, protected from light.
- Wash and Image: Remove the staining solution and wash cells three times with PBS. Image the cells using a fluorescence microscope with a DAPI filter set (Excitation/Emission: ~350/461 nm).
Safety Note: Hoechst 33342 is a known mutagen. Handle with care using appropriate personal protective equipment.
Protocol for Annexin V / Propidium Iodide (PI) Staining by Flow Cytometry
This protocol distinguishes viable, early apoptotic, late apoptotic, and necrotic cells by detecting phosphatidylserine exposure and membrane integrity [20] [6].
- Prepare Buffers: Prepare 1X binding buffer by diluting 10X binding buffer with distilled water. Ensure buffers are free of EDTA or other calcium chelators, as Annexin V binding is calcium-dependent.
- Harvest and Wash Cells: Harvest cells and wash once with PBS, then once with 1X binding buffer.
- Stain with Annexin V Conjugate: Resuspend cell pellet at 1-5 x 10⁶ cells/mL in 1X binding buffer. Add 5 µL of fluorochrome-conjugated Annexin V to 100 µL of cell suspension. Incubate for 10-15 minutes at room temperature in the dark.
- Wash and Add PI: Add 2 mL of 1X binding buffer and centrifuge. Discard supernatant and resuspend the pellet in 200 µL of 1X binding buffer.
- Add Viability Stain: Add 5 µL of Propidium Iodide (PI) Staining Solution. Do not wash after adding PI.
- Analyze by Flow Cytometry: Analyze samples immediately (within 4 hours) using flow cytometry. PI must remain in the buffer during acquisition.
Workflow for Integrated Apoptosis Analysis
The following diagram illustrates a consolidated experimental workflow for identifying apoptotic bodies, combining the key protocols and their associated readouts.
Biochemical Signaling Pathways in Apoptosis
Apoptotic body formation is the culmination of tightly regulated biochemical pathways. The core intrinsic and extrinsic pathways converge to activate the executioner caspases that mediate cellular dismantling.
The Scientist's Toolkit: Essential Reagents and Kits
The following table catalogs key reagents and kits essential for conducting apoptosis assays focused on ApoBD identification.
Table 3: Key Research Reagent Solutions for Apoptosis Detection
| Reagent / Kit | Primary Function | Application in Apoptosis Detection |
|---|---|---|
| Hoechst 33342 | Cell-permeant nucleic acid stain that binds dsDNA. | Fluorescently labels nuclear DNA to visualize chromatin condensation and nuclear fragmentation in fixed or live cells [19]. |
| Annexin V Conjugates | Calcium-dependent protein binding to externalized Phosphatidylserine (PtdSer). | Flags early apoptotic cells by detecting PtdSer on the outer membrane leaflet. Used in flow cytometry and microscopy [20] [6]. |
| Propidium Iodide (PI) | Cell-impermeant DNA intercalator. | Distinguishes late apoptotic/necrotic cells (PI-positive) from early apoptotic cells (PI-negative) due to loss of membrane integrity [20]. |
| Annexin V Apoptosis Detection Kits | Integrated kits containing Annexin V conjugates, binding buffer, and viability dyes. | Provide a complete, optimized solution for reliable detection and quantification of apoptotic cells via flow cytometry [23] [6]. |
| Caspase Antibodies | Antibodies targeting active (cleaved) forms of caspases. | Enable detection of caspase activation (e.g., Caspase-3) via flow cytometry or Western blot, confirming the engagement of apoptotic pathways [4]. |
| BH3 Mimetics (e.g., ABT-737) | Small molecules that inhibit anti-apoptotic Bcl-2 proteins. | Used to experimentally induce the intrinsic apoptotic pathway in research models [22]. |
Discussion and Research Context
The precise identification of apoptotic bodies through nuclear fragmentation and membrane blebbing remains a cornerstone of apoptosis research. While H&E staining provides an initial morphological assessment in tissue sections, the protocols detailed herein allow for precise quantification and mechanistic insight. The discovery of alternative biogenesis pathways, such as the FOOD mechanism, underscores that the formation of apoptotic vesicles is a highly coordinated and regulated process, not merely a random disintegration [22]. Furthermore, ApoBDs are now recognized not as inert debris but as "bioactive treasure" capable of mediating intercellular communication, influencing processes from immunomodulation to tissue regeneration and disease progression [18]. This evolving understanding highlights the importance of accurate detection methodologies, which are critical for advancing research in cancer biology, neurodegenerative diseases, and the development of novel therapeutics.
Contrasting Apoptosis with Necrosis and Pyroptosis in H&E Specimens
Hematoxylin and eosin (H&E) staining remains a foundational technique in histology for visualizing cellular and tissue structure. Within the context of apoptosis detection research, this protocol details the methodology for distinguishing between three functionally distinct modes of cell death—apoptosis, necrosis, and pyroptosis—in H&E-stained specimens. We provide a comparative analysis of their unique morphological hallmarks, outline a standardized H&E staining protocol, and present supplementary techniques for definitive identification. This application note serves as a essential guide for researchers and drug development professionals in accurately characterizing cell death pathways in experimental and pathological contexts.
Cell death is a fundamental biological process, and its precise characterization is crucial in biomedical research, particularly in oncology and neurobiology. Among the various forms of regulated cell death, apoptosis, pyroptosis, and necroptosis represent distinct pathways with unique molecular mechanisms and functional consequences [24] [25]. Although advanced biochemical techniques exist for their detection, light microscopic evaluation of H&E-stained tissues remains a primary, cost-effective, and accessible first step for their identification and differentiation [26] [5].
The historical definitions of these pathways are rooted in morphology. Apoptosis was first described in 1972 by Kerr et al. as a controlled process of "shrinkage necrosis" with specific structural changes [27] [24]. In contrast, necrosis was long considered an unregulated, accidental process resulting from severe injury [24]. Pyroptosis, a term coined in 2001, is a pro-inflammatory lytic cell death that shares some features with both apoptosis and necrosis but is molecularly distinct [13]. This document leverages the consistent and well-understood H&E staining protocol to provide a systematic framework for differentiating these critical cell death modalities based on their classic histological presentations.
Morphological Hallmarks in H&E Specimens
The following table summarizes the key morphological features of apoptosis, necrosis, and pyroptosis as visualized under light microscopy with H&E staining.
Table 1: Morphological Characteristics of Cell Death Types in H&E Specimens
| Feature | Apoptosis | Necrosis (Unregulated) | Pyroptosis |
|---|---|---|---|
| Cell Size | Shrinkage (cell shrinkage) [27] | Swelling (oncosis) [17] | Swelling [25] |
| Cytoplasm | Condensed, deeply eosinophilic (pink) [26] | Vacuolation, eventual rupture [17] | Rupture, release of pro-inflammatory contents [17] [25] |
| Nucleus | Pyknosis (condensation), karyorrhexis (fragmentation), karyolysis (dissolution) [27] [17] | Pyknosis and karyorrhexis [17] | Condensation and fragmentation prior to lysis [17] |
| Membrane Integrity | Maintained until late stages; formation of membrane-bound apoptotic bodies [27] [24] | Lost; release of cellular contents [24] | Lost via gasdermin pore formation; release of IL-1β and IL-18 [28] [25] |
| Inflammatory Response | Minimal (non-immunogenic) [17] | Significant (pro-inflammatory) [24] | Significant (pro-inflammatory) [17] [25] |
| Key H&E Identifiers | Round, dense, eosinophilic cytoplasm; small, dark, fragmented nuclei; apoptotic bodies [26] [27] | Loss of tissue architecture; swollen cells with pale, vacuolated cytoplasm; pyknotic nuclei [24] | Less defined in standard H&E; requires correlation with molecular markers for confirmation |
Visualizing the Pathways
The diagram below illustrates the core signaling pathways and key morphological outcomes for apoptosis, pyroptosis, and necroptosis.
Standard H&E Staining Protocol for Cell Death Analysis
A consistent H&E protocol is paramount for reliable morphological assessment. The following is a standard regressive staining protocol suitable for detecting cell death features [5].
Table 2: Standard H&E Staining Protocol for Paraffin-Embedded Sections
| Step | Reagent | Time | Purpose & Notes |
|---|---|---|---|
| 1. Deparaffinization | Xylene | 2 x 2 minutes | Removes paraffin wax |
| 2. Rehydration | 100% Ethanol | 2 x 2 minutes | Hydrates tissue for aqueous stains |
| 95% Ethanol | 2 minutes | ||
| 3. Rinse | Tap or Distilled Water | 2 minutes | |
| 4. Nuclear Staining | Hematoxylin (e.g., Harris) | 3-8 minutes | Stains nucleic acids blue/black. Time is concentration-dependent. |
| 5. Rinse | Running Tap Water | 1 minute | Removes excess stain |
| 6. Differentiation | Acid Alcohol (e.g., 1% HCl) | A few seconds | Removes excess hematoxylin from cytoplasm. Check microscopically. |
| 7. Bluing | Scott's Tap Water / Ammonia Water | 1 minute | Alkalinity converts hematein to blue color |
| 8. Rinse | Tap Water | 1 minute | |
| 9. Counterstain | Eosin Y | 30 seconds - 2 minutes | Stains cytoplasm and ECM pink |
| 10. Dehydration | 95% Ethanol | 1 minute | Prepares tissue for clearing |
| 100% Ethanol | 2 x 1 minute | ||
| 11. Clearing | Xylene | 2 x 2 minutes | Replaces alcohol with xylene for mounting |
| 12. Mounting | Mounting Medium & Coverslip | - | Preserves tissue for microscopy |
Best Practices and Troubleshooting:
- Hematoxylin Choice: Mayer's hematoxylin is a progressive stain that requires no differentiation, while Harris hematoxylin (alcohol-based) provides clear nuclear detail but requires careful differentiation with a mild acid [5].
- Differentiation: This is a critical step for nuclear clarity. Over-differentiation will result in pale nuclei, while under-differentiation causes high background staining [5].
- Bluing: Inadequate bluing will result in red/purple nuclei instead of the desired blue-black. Ensure the bluing solution is slightly basic [5].
The Scientist's Toolkit: Key Reagents for Cell Death Research
Beyond H&E staining, definitive characterization of cell death pathways often requires specific reagents and functional assays.
Table 3: Essential Research Reagents for Cell Death Detection
| Reagent / Assay | Function / Target | Application in Cell Death Detection |
|---|---|---|
| Annexin V-FLUOS Conjugate [29] [8] | Binds to phosphatidylserine (PS) exposed on the outer leaflet of the plasma membrane. | Detection of early-stage apoptosis (PS exposure). Used in conjunction with viability dyes. |
| Propidium Iodide (PI) [29] [8] | A DNA intercalating dye that is impermeant to live and early apoptotic cells. | Distinguishes late apoptotic/necrotic cells (PI-positive) from early apoptotic cells (PI-negative). |
| Z-VAD-FMK [28] | A pan-caspase inhibitor. | Used to inhibit apoptosis and other caspase-dependent pathways (e.g., pyroptosis in some contexts) to confirm mechanism. |
| Crystal Violet Staining [13] | Binds to proteins and DNA in adherent cells. | A simple spectrophotometric method to assess cell viability and growth, useful for high-throughput screening of compound cytotoxicity. |
| Lactate Dehydrogenase (LDH) Release Assay [13] | Measures LDH enzyme released upon plasma membrane damage. | Quantifies lytic cell death, such as necrosis, pyroptosis, and secondary necrosis. |
| Antibodies against Cleaved Caspase-3 | Detects the active form of executioner caspase-3. | A specific marker for ongoing apoptosis. |
| Antibodies against Cleaved GSDMD [28] | Detects the active N-terminal fragment of Gasdermin D. | A specific marker for pyroptosis execution. |
Annexin V/PI Flow Cytometry Protocol
The Annexin V/Propidium Iodide assay is a gold-standard method for quantifying apoptosis and distinguishing it from necrosis [29] [8].
Procedure:
- Harvest Cells: Collect both supernatant (containing detached cells) and trypsinize adherent cells. Combine and wash cells with PBS [8].
- Staining: Resuspend ~2x10⁶ cells in 400 µL of PBS. Add 100 µL of incubation buffer containing 2 µL of Annexin V-FLUOS conjugate (1 mg/mL) and 2 µL of PI (1 mg/mL). Incubate for 15-30 minutes at room temperature in the dark [8].
- Analysis: Analyze by flow cytometry without washing. Use single-stained controls (Annexin V only, PI only) and an unstained control to set up compensation and gating [29] [8].
Data Interpretation:
- Viable Cells: Annexin V⁻ / PI⁻
- Early Apoptotic Cells: Annexin V⁺ / PI⁻
- Late Apoptotic/Necrotic Cells: Annexin V⁺ / PI⁺
Experimental Workflow for Integrated Cell Death Analysis
A comprehensive analysis of cell death in research involves correlating morphology with specific biochemical markers.
While H&E staining is an indispensable tool for the initial morphological screening of cell death, it has limitations. The transition between late apoptosis and secondary necrosis can be difficult to discern, and pyroptosis may not always present with uniquely identifiable features in standard H&E sections [17]. Therefore, the H&E-based identification should be considered a hypothesis, to be confirmed with more specific biochemical or immunohistochemical techniques outlined in this document.
The field of cell death research continues to evolve, with novel forms like ferroptosis, cuproptosis, and PANoptosis—a complex inflammatory death pathway with overlapping features of apoptosis, pyroptosis, and necroptosis—being increasingly characterized [24] [25]. Researchers should be aware that the classical pathways described here are not always mutually exclusive.
In conclusion, this application note provides a structured framework for using H&E staining as a core technique within a broader research thesis on apoptosis detection. By combining the traditional power of histology with modern biochemical assays, researchers can achieve a robust and accurate characterization of cell death pathways, which is fundamental for understanding disease mechanisms and evaluating the efficacy of therapeutic interventions.
The Biological Significance of Apoptosis in Homeostasis and Disease
Apoptosis, or programmed cell death, is a fundamental biological process essential for the life of multicellular organisms [30]. It contributes significantly to embryonic development, tissue homeostasis, and the removal of damaged or infected cells [30] [31]. This regulated cell death pathway is evolutionarily conserved and meticulously controlled by proteases known as caspases, which ensure the orderly dismantling of cellular components in a manner that is typically immunologically silent [30]. Dysregulation of apoptosis is a hallmark of numerous diseases; its inhibition can promote cancer development, while its inappropriate activation is associated with neurodegenerative conditions [30]. This article explores the molecular mechanisms of apoptosis, its role in health and disease, and provides detailed protocols for its detection, with a specific focus on applications within hematoxylin and eosin (H&E) staining-based research.
Molecular Mechanisms of Apoptosis
Apoptosis proceeds via two principal pathways: the extrinsic (death receptor) pathway and the intrinsic (mitochondrial) pathway [30] [31]. Both converge on the activation of executioner caspases that orchestrate the characteristic morphological changes of apoptosis, including cell shrinkage, chromatin condensation, nuclear fragmentation, and formation of apoptotic bodies [31].
Core Apoptotic Pathways
The table below summarizes the key features of the intrinsic and extrinsic apoptotic pathways.
Table 1: Characteristics of Major Apoptotic Pathways
| Feature | Intrinsic Pathway | Extrinsic Pathway |
|---|---|---|
| Initiation | Intracellular stresses (e.g., DNA damage, ER stress) [31] | Ligation of death receptors (e.g., Fas, TNFR) by extracellular ligands [31] |
| Key Regulators | BCL-2 protein family (pro- and anti-apoptotic), Mitochondrial outer membrane permeabilization (MOMP) [30] [31] | Death receptors, FADD, Caspase-8 [31] |
| Central Molecular Event | MOMP and release of cytochrome c [31] | Formation of the Death-Inducing Signaling Complex (DISC) [31] |
| Apoptosome Formation | Cytochrome c + APAF1 + Caspase-9 → Apoptosome [31] | Not Applicable |
| Initiator Caspase | Caspase-9 [31] | Caspase-8 [31] |
| Executioner Caspases | Caspase-3 and Caspase-7 [31] | Caspase-3 and Caspase-7 [31] |
Apoptosis Signaling Pathway Diagram
The following diagram illustrates the interplay between the intrinsic and extrinsic apoptosis pathways and their convergence on a common execution phase.
Apoptosis Detection Methods and Protocols
While H&E staining provides a foundational view of tissue architecture and can reveal late apoptotic morphology like cell shrinkage and pyknosis, specific detection of apoptosis requires more targeted techniques. The following section details key methodologies.
Quantitative Analysis of Apoptosis via Flow Cytometry
This protocol uses annexin V and propidium iodide (PI) to distinguish viable, early apoptotic, and late apoptotic/necrotic cells by flow cytometry [20] [32]. Annexin V binds to phosphatidylserine exposed on the outer leaflet of the plasma membrane during early apoptosis, while PI is a DNA-binding dye that only permeates cells with compromised membrane integrity (late apoptosis/necrosis) [20].
Table 2: Key Reagents for Annexin V/PI Apoptosis Assay
| Reagent/Material | Function/Description |
|---|---|
| Fluorescent Annexin V | Binds to externalized phosphatidylserine, a marker of early apoptosis [32]. |
| Propidium Iodide (PI) | Viability dye; labels DNA in cells with permeable membranes (late apoptotic/necrotic cells) [32]. |
| Calcium-containing Buffer (e.g., PBS/HBSS) | Essential for the calcium-dependent binding of annexin V to phosphatidylserine [32]. |
| Cell Dissociation Agent (e.g., trypsin) | For detaching adherent cells gently to preserve membrane integrity [32]. |
| Benchtop Centrifuge | For pelleting cells during washing and staining steps. |
| Flow Cytometer | Instrument for quantitative analysis of fluorescently labeled cell populations. |
Experimental Workflow:
- Cell Preparation: For adherent cells, gently detach using a trypsin-based dissociation agent, then inactivate with serum-containing medium. For suspension cells, proceed directly. Pellet cells (300 × g, 5 min) and resuspend in calcium-containing PBS or HBSS. Avoid EDTA-based buffers as they chelate calcium [32].
- Staining Setup: Count cells and aliquot ~1 million cells per condition into separate tubes: unstained control, annexin V only, PI only, and annexin V + PI [32].
- Annexin V Staining: Add the fluorescent annexin V probe to the appropriate tubes and incubate for 15 minutes at room temperature in the dark [32].
- Propidium Iodide Staining: Add PI to the appropriate tubes and incubate for 5-20 minutes at room temperature in the dark. Do not wash the cells after adding PI to avoid removing the dye from dead cells [32].
- Flow Cytometric Analysis: Analyze the cells immediately on a flow cytometer. Use the unstained and single-stained controls to set up compensation and gating [20] [32].
Data Interpretation:
- Annexin V-negative / PI-negative: Viable, healthy cells.
- Annexin V-positive / PI-negative: Early apoptotic cells.
- Annexin V-positive / PI-positive: Late apoptotic or necrotic cells.
Cross-Modality Prediction of Apoptosis Biomarkers from H&E Stains
H&E staining is a cornerstone of pathologic analysis but has limited specificity for identifying apoptotic cells. A novel deep learning framework, HistoStainAlign, has been developed to predict immunohistochemistry (IHC) staining patterns—which can include specific apoptotic biomarkers—directly from H&E-stained whole slide images (WSIs) [33]. This approach can serve as a powerful prescreening tool in apoptosis research.
Protocol Concept: Computational Prediction of IHC from H&E
- Slide Preparation and Digitization: Generate standard H&E-stained slides from tissue samples. In parallel, prepare IHC-stained slides for specific apoptotic markers (e.g., cleaved caspase-3). Digitize both H&E and IHC slides using a whole slide scanner to create paired datasets [33].
- Model Training: Train the HistoStainAlign model using the paired H&E and IHC image embeddings. The model integrates these embeddings through a contrastive training strategy, learning to capture the complementary features across the two staining modalities without requiring precise patch-level annotations or rigid tissue registration [33].
- Prediction and Validation: Input new H&E WSIs into the trained model. The model outputs a prediction of the corresponding IHC stain pattern. Validate the predictions against actual IHC stains from the same or serial sections to assess accuracy using metrics like the F1 score [33].
Application: This method can predict IHC biomarkers like P53 or Ki-67 from routine H&E images, potentially identifying regions of altered cell death and proliferation, thus streamlining the analysis of apoptosis in large-scale tissue studies [33].
Advanced Imaging Techniques for Apoptosis Detection
AI-Based Classification Using Phase-Contrast Images This protocol uses artificial intelligence (AI) to classify apoptotic cells from label-free phase-contrast images, enabling non-invasive, long-term observation [34].
- Induction and Staining: Induce apoptosis in cells (e.g., K562 leukemic cells using gamma-secretase inhibitors). Use fluorescent stains (e.g., SYBR Green for DNA and FITC-VAD-FMK for caspase activity) to definitively identify apoptotic cells based on DNA fragmentation and caspase activation [34].
- Image Acquisition: Capture paired images of the same fields using both phase-contrast and fluorescence microscopy [34].
- AI Model Training: Manually crop images to create a dataset of single-cell images. Train AI models (e.g., Lobe or ResNet50) using the phase-contrast images as input and the fluorescence-based classifications (e.g., caspase-negative/no DNA fragmentation, caspase-positive, caspase-positive/DNA fragmentation-positive) as the ground-truth labels [34].
- Classification: The trained AI model can then classify new phase-contrast images of living cells into apoptotic stages based on subtle morphological changes learned during training, such as alterations in refractive indices [34].
Full-Field Optical Coherence Tomography (FF-OCT) FF-OCT is a high-resolution, label-free technique for visualizing 3D morphological changes during apoptosis [35].
- Sample Preparation: Culture cells (e.g., HeLa cells) and induce apoptosis with an agent like doxorubicin [35].
- Image Acquisition: Use a custom-built time-domain FF-OCT system to monitor morphological alterations at the single-cell level. Initiate imaging immediately after drug administration and capture images continuously at set intervals (e.g., every 20 minutes) [35].
- Analysis: Visualize and analyze characteristic apoptotic features, such as echinoid spine formation, cell contraction, membrane blebbing, and filopodia reorganization, which are distinct from the rapid membrane rupture seen in necrosis [35].
Quantitative Comparison of Apoptosis Assays
Selecting the appropriate apoptosis detection assay is critical and depends on the research context. The table below compares several common and emerging techniques.
Table 3: Comparison of Apoptosis Detection Methodologies
| Method | Principle | Key Readout | Advantages | Limitations |
|---|---|---|---|---|
| Annexin V/PI Flow Cytometry [32] | Annexin V binding to PS; PI DNA intercalation in dead cells. | Quantitative population data (early/late apoptosis). | Quantitative, distinguishes stages of death. | Requires cell suspension; does not reveal spatial context. |
| H&E Staining | Uptake of hematoxylin and eosin dyes by tissue components. | Morphology (cell shrinkage, pyknosis, karyorrhexis). | Routine, low cost, provides tissue context. | Lacks molecular specificity; mainly detects late apoptosis. |
| AI from H&E (HistoStainAlign) [33] | Deep learning predicts IHC biomarkers from H&E images. | Computational prediction of protein expression (e.g., P53). | Leverages existing H&E slides; high-throughput potential. | Predictive model; requires validation against gold-standard IHC. |
| AI from Phase-Contrast [34] | AI classifies apoptosis based on label-free morphology. | Classification of live vs. apoptotic cells. | Label-free, non-invasive, allows live-cell tracking. | Requires initial fluorescent staining for model training. |
| Bodipy-FL-Cystine (BFC) Assay [36] | Measures cystine uptake via xCT antiporter as a stress response. | Glutathione-redox status via flow cytometry. | Potential marker for early stress/apoptosis. | Less direct measure; mechanism linked to oxidative stress. |
| Full-Field OCT [35] | Label-free interferometric imaging of cellular structures. | High-resolution 3D morphology and surface topography. | Label-free, non-invasive, high-resolution 3D data. | Specialized, expensive equipment; complex data analysis. |
The Scientist's Toolkit: Essential Reagents for Apoptosis Research
The following table catalogs key reagents and their applications in the study of apoptosis.
Table 4: Research Reagent Solutions for Apoptosis Studies
| Reagent Category | Specific Examples | Research Application |
|---|---|---|
| Fluorescent Probes & Dyes | Annexin V conjugates (e.g., FITC, APC) [20] [32] | Flow cytometric detection of phosphatidylserine exposure (early apoptosis). |
| Propidium Iodide (PI) [32] | Flow cytometric viability dye to identify late apoptotic/necrotic cells. | |
| NucView 488 Caspase Substrate [37] | Fluorescent detection of activated caspase-3/7 activity. | |
| SYBR Green / CaspACE (FITC-VAD-FMK) [34] | Fluorescent staining for DNA fragmentation and caspase activity, respectively. | |
| Bodipy-FL-Cystine (BFC) [36] | Flow cytometric measurement of cystine uptake as an indicator of cellular stress and early apoptosis. | |
| Key Protein Targets | Caspases (Caspase-3, -8, -9) [31] | Central executioners and initiators of apoptotic pathways; detected via IHC or western blot. |
| BCL-2 Protein Family [30] | Regulators of mitochondrial apoptosis; targets for therapeutic intervention. | |
| Phosphatidylserine [32] | "Eat-me" signal on the outer leaflet of the plasma membrane in apoptotic cells. | |
| Induction & Inhibition Tools | Doxorubicin [35] | Chemotherapeutic agent used to induce intrinsic apoptosis in experimental models. |
| Gamma-Secretase Inhibitors (GSIs) [34] | Used to induce apoptosis in specific cell lines like K562 leukemic cells. | |
| Sulfasalazine [36] | Inhibitor of the xCT cystine/glutamate antiporter; used to probe mechanisms of cystine uptake. |
Mastering the H&E Protocol: From Staining to AI-Powered Analysis for Apoptosis
Hematoxylin and Eosin (H&E) staining is the principal tissue stain used in histology and the gold standard for medical diagnosis worldwide [5] [38]. This technique provides a clear overview of cellular structure and tissue architecture, allowing for the detailed examination of tissue morphology in both research and clinical diagnostics [39] [40]. For researchers investigating apoptosis detection, a thorough understanding of the H&E protocol is foundational, as it enables the initial morphological identification of apoptotic cells based on characteristic features such as cell shrinkage, chromatin condensation, and formation of apoptotic bodies [26].
The following application note provides a detailed, step-by-step guide to the standard H&E staining protocol for paraffin-embedded tissue sections, with specific considerations for apoptosis research.
Materials and Reagents
Table 1: Essential Reagents for H&E Staining Protocol
| Reagent Category | Specific Examples | Function in Staining Process |
|---|---|---|
| Nuclear Stain | Harris Hematoxylin, Mayer's Hematoxylin, Gill's Hematoxylin [5] | Stains cell nuclei a purplish-blue by binding to DNA [40] [38] |
| Cytoplasmic Stain | Eosin Y, Eosin with Phloxine B [5] [39] | Stains cytoplasm and extracellular matrix pink/red [40] [38] |
| Differentiator | Acid Alcohol (1% HCl in 70% Ethanol) [39] | Removes excess hematoxylin from the cytoplasm [5] |
| Bluing Agent | Scott's Tap Water, Ammonia Water, or other weak base [5] [39] | Converts initial red nuclear stain to a stable blue color [5] |
| Dehydration Reagents | Ethanol (70%, 95%, 100%), Xylene [39] | Removes water and clears tissue for microscopy |
Standard H&E Staining Protocol: A Step-by-Step Guide
The following protocol details the regressive staining method, where hematoxylin is over-stained and then selectively removed via differentiation to achieve precise nuclear detail [5]. All steps are performed at room temperature.
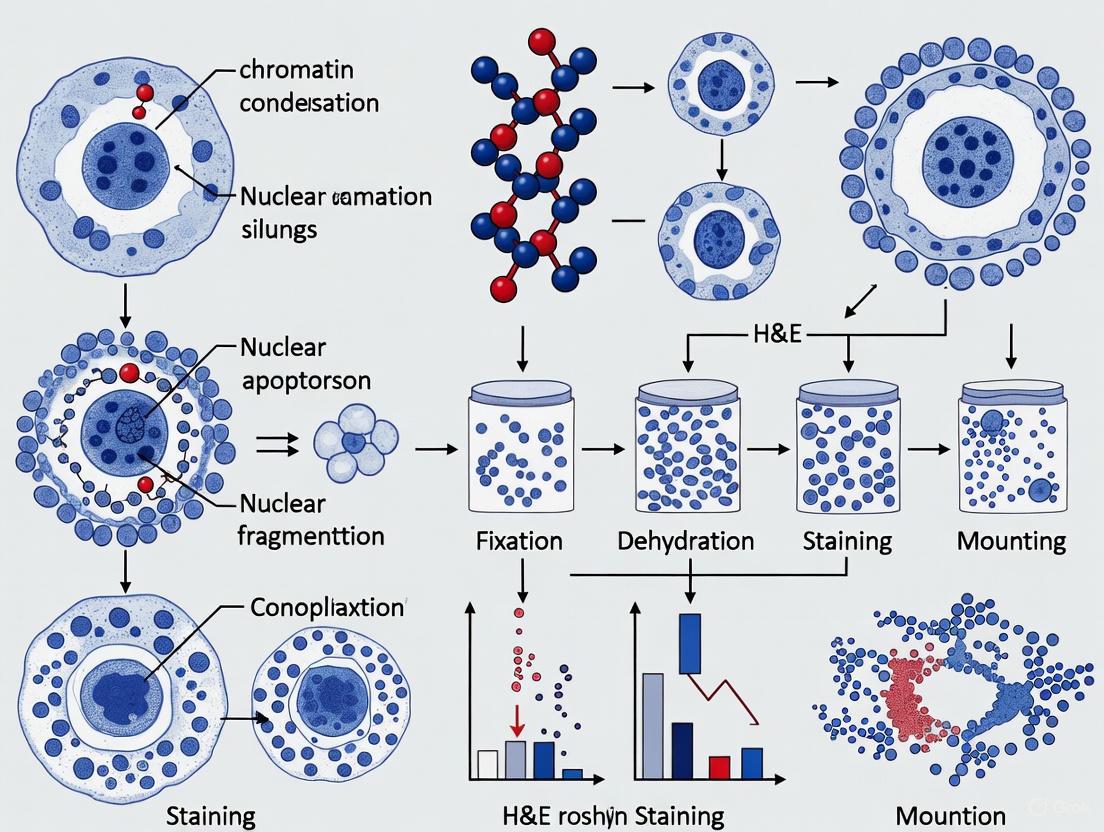
The following diagram illustrates the complete H&E staining workflow from deparaffinization to mounting:
Detailed Procedural Steps
Deparaffinization: Pass slides through two changes of xylene for 2 minutes each to completely remove paraffin wax [5] [39].
Rehydration: Hydrate the tissue by passing slides through a graded ethanol series:
Nuclear Staining with Hematoxylin: Immerse slides in Hematoxylin (e.g., Harris Hematoxylin) for 2-3 minutes [5] [39]. The duration may be adjusted based on the specific hematoxylin formulation and desired staining intensity.
Rinsing: Rinse slides in running tap water for 1-2 minutes to remove excess stain [39].
Differentiation: Briefly dip slides (approximately 5-10 dips) in Acid Alcohol (1% Hydrochloric Acid in 70% Ethanol) [39]. This critical step removes excess hematoxylin from the cytoplasm. Note: Over-differentiation will remove too much nuclear stain.
Bluing: Immerse slides in a bluing solution, such as Scott's Tap Water (composed of Sodium Hydrogen Carbonate and Magnesium Sulphate), for 30 seconds to 2 minutes [39]. This alkaline solution converts the initial red color of the nuclei to a permanent blue.
Rinsing: Rinse slides in tap water for 30 seconds [39].
Cytoplasmic Counterstaining with Eosin: Immerse slides in Eosin Y solution for 30-45 seconds [5] [39]. Staining time should be adjusted based on the eosin formulation and the age of the solution.
Rinsing: Rinse slides briefly in tap water to remove surface eosin [39].
Dehydration: Dehydrate the tissue by passing slides through a graded ethanol series:
Clearing: Pass slides through two changes of xylene for 2-5 minutes each to ensure complete dehydration and clearing for optimal microscopy [5] [39].
Mounting: Coverslip slides using a resinous mounting medium (e.g., DPX) [39].
H&E Staining for Apoptosis Detection
Identification of Apoptotic Cells
In apoptosis research, H&E staining serves as an initial, cost-effective method for identifying programmed cell death based on distinct morphological characteristics [26]. Under light microscopy, apoptotic cells display:
- Cell shrinkage and loss of cell-cell contacts
- Cytoplasmic condensation and deep eosinophilia (intense pink staining)
- Nuclear changes including pyknosis (condensation), karyorrhexis (fragmentation), and formation of round, crescentic, or irregular nuclei [26]
Table 2: Technical Comparison of Apoptosis Detection Methods
| Method | Principle | Key Advantages | Key Limitations |
|---|---|---|---|
| H&E Staining | Morphological assessment of cellular and nuclear changes [26] | Simple, cost-effective, provides tissue context [26] | Can underestimate apoptosis rate; requires expertise [26] [41] |
| Methyl Green-Pyronin (MGP) | Methyl green binds DNA (green); Pyronin binds RNA (red) [26] | Easier distinction of apoptotic cells; cost-effective [26] | Less common; requires specific staining protocol |
| TUNEL Assay | Labels DNA strand breaks [41] | High specificity for DNA fragmentation [41] | Potential for false positives; more expensive and time-consuming [41] |
Limitations and Complementary Techniques
While H&E staining allows for the morphological identification of apoptosis, studies have shown that using this method alone may underestimate the true apoptotic rate by two to threefold compared to more specific techniques [41]. For conclusive apoptosis quantification in research, H&E findings should be confirmed with complementary techniques such as Methyl Green-Pyronin staining, which provides clearer contrast for apoptotic bodies, or TUNEL assay for specific detection of DNA fragmentation [26] [41].
Quality Control and Troubleshooting
Quantitative Stain Assessment
Maintaining consistent H&E staining is critical for reproducible research, particularly in digital pathology and automated analysis. Recent advancements enable quantitative quality control using stain assessment slides with biopolymer films that provide an absolute quantification of stain uptake, overcoming the variability inherent in biological control tissues [42]. Key parameters for quality control include:
- Hematoxylin-to-Eosin Ratio: International studies suggest an optimal optical density ratio between 0.94 and 0.99 for diagnostic quality [43].
- Color Stability: Quantitative analysis shows that 60% of laboratories produce stains with color differences imperceptible under normal observation [43].
Troubleshooting Common Issues
- Over-stained Hematoxylin: Increase differentiation time in acid alcohol or decrease hematoxylin staining time.
- Under-stained Nuclei: Decrease differentiation time or increase hematoxylin staining time.
- Over-stained Eosin: Decrease eosin staining time or add a brief dip in acid alcohol after eosin.
- Under-stained Eosin: Increase eosin staining time or check eosin pH (may require acetic acid addition) [5].
The standard H&E staining protocol remains an indispensable tool in histology, providing a robust and informative method for visualizing tissue architecture and cellular morphology. For researchers focused on apoptosis, H&E staining offers an accessible entry point for identifying characteristic morphological changes associated with programmed cell death. However, investigators should be aware of its limitations for quantification and employ complementary techniques for definitive apoptosis confirmation and measurement. Through careful adherence to protocol details and implementation of quality control measures, researchers can ensure consistent, high-quality H&E staining results that form a reliable foundation for their apoptosis detection research.
Hematoxylin and eosin (H&E) staining serves as the cornerstone of pathological analysis, providing a critical foundation for visualizing cellular morphology and tissue architecture in cancer diagnosis and research. Within the context of apoptosis detection, the precision of this classic stain becomes paramount. A meticulously optimized H&E protocol allows researchers and pathologists to distinguish the subtle yet distinctive morphological hallmarks of apoptotic cells, including cell shrinkage, chromatin condensation, and the formation of apoptotic bodies [44]. The depth of hematoxylin nuclear staining and the clarity of eosin-based cytoplasmic differentiation are not merely aesthetic concerns; they are fundamental to accurately identifying and interpreting these cellular events. This application note details a refined, quantitative approach to H&E staining, ensuring the protocol is optimally configured for apoptosis research within drug development and oncological studies.
The Critical Role of H&E in Apoptosis Research
Apoptosis, a programmed cell death, is characterized by a specific sequence of morphological changes. The cell's nucleus undergoes pyknosis, where chromatin condenses and becomes hyperbasophilic, followed by karyorrhexis, the fragmentation of the nucleus [44]. Subsequently, the entire cell shrinks and breaks into discrete apoptotic bodies, which are phagocytosed by neighboring cells without inciting an inflammatory response. These morphological features are the primary basis for identifying apoptosis via light microscopy.
The H&E stain is uniquely positioned to highlight these changes. The alum-haematoxylin binds to DNA in the nucleus, staining condensed chromatin a deep blue-purple, making pyknotic nuclei and nuclear fragments strikingly visible [39] [5]. Conversely, eosin stains the cytoplasm and other proteins, providing contrast and revealing overall cell shape and size. Proper eosin differentiation is crucial for visualizing cell shrinkage and the formation of membrane-bound apoptotic bodies against the extracellular matrix [45]. Therefore, optimizing the intensity of hematoxylin and the differentiation of eosin is essential for making these critical apoptotic features unmistakably clear, providing an accessible and reliable first-pass assay for screening anti-cancer compounds that induce cell death [46] [47] [48].
Optimized H&E Staining Protocol for Apoptosis Detection
The following regressive staining protocol is designed for manual processing and has been optimized to produce high-contrast slides ideal for identifying apoptotic figures. The key to success lies in the precise control of staining and differentiation times.
Table 1: Optimized H&E Staining Protocol for Apoptosis Detection
| Step | Reagent | Time | Key Considerations for Apoptosis Detection |
|---|---|---|---|
| 1 | Deparaffinization (Xylene) | 2 x 2 minutes | Complete removal of paraffin is essential for uniform stain penetration. |
| 2 | Hydration (100%, 95% Ethanol) | 2 minutes each | Ensures tissue is properly hydrated for aqueous-based stains. |
| 3 | Rinse in Tap Water | 2 minutes | - |
| 4 | Nuclear Staining (Harris's Haematoxylin) | 3 minutes | Critical step. Stains condensed chromatin in apoptotic nuclei. |
| 5 | Rinse in Running Tap Water | 1 minute | Removes excess surface haematoxylin. |
| 6 | Differentiation (0.3% Acid Alcohol) | ~30 seconds | Most critical step. Visually monitor until nuclei are sharp and background is clear. |
| 7 | Rinse in Tap Water | 1 minute | Stops the differentiation process. |
| 8 | Bluing (Scott's Tap Water Substitute) | 1 minute | Converts haematoxylin to blue; enhances nuclear contrast. |
| 9 | Rinse in Tap Water | 1 minute | - |
| 10 | Counterstain (Eosin Y with Phloxine) | 45 seconds | Highlights cytoplasm; aids in visualizing cell borders and apoptotic bodies. |
| 11 | Dehydration (95%, 100% Ethanol) | 1-2 minutes each | Rapid dehydration preserves eosin staining. |
| 12 | Clearing (Xylene) | 2 x 2 minutes | Renders tissue transparent for mounting. |
| 13 | Coverslipping with DPX | - | Use a resinous mounting medium for permanence. |
Protocol Notes & Troubleshooting
- Hematoxylin Intensity: The recommended 3 minutes in Harris's Haematoxylin is a baseline. Over-staining can obscure nuclear detail, while under-staining may fail to highlight condensed chromatin. If cytoplasm remains blue after bluing, repeat the differentiation and bluing steps [39] [45].
- Differentiation End-Point: The goal of acid alcohol differentiation is to achieve a state where nuclei are sharply defined and the background is nearly colorless. This step must be monitored carefully, as over-differentiation will strip too much haematoxylin from the nuclei of interest, including apoptotic ones [45].
- Eosin Differentiation: Eosin is highly soluble in water. After counterstaining, ensure dehydration in ethanol is rapid to prevent the washout of eosin, which would reduce the contrast between cytoplasm and the extracellular matrix, making apoptotic bodies harder to distinguish [45].
Quantitative Assessment of Stain Quality
For research purposes, particularly when preparing slides for digital pathology or automated analysis, moving from qualitative to quantitative assessment of staining is advantageous. Traditional quality control relies on subjective observation, but novel methods using stain assessment slides with a biopolymer film allow for absolute quantification of stain uptake via spectrophotometry [49].
Table 2: Quantitative Stain Uptake Measurement
| Parameter | Measurement Method | Application in Quality Control | Benefit for Apoptosis Research |
|---|---|---|---|
| Haematoxylin Uptake | Spectrophotometer absorbance (380-740 nm) | Quantifies intra- and inter-batch staining variation. | Ensures consistent and intense nuclear staining for reliable identification of pyknotic nuclei. |
| Eosin Uptake | Spectrophotometer absorbance (380-740 nm) | Standardizes cytoplasmic counterstain intensity. | Maintains optimal contrast to clearly delineate cell boundaries and apoptotic bodies. |
| Linearity with Time | Absorbance vs. Stain Duration (r-value ~0.99) [49] | Validates staining protocol performance. | Provides a metric for protocol optimization and reproducibility across experiments. |
This quantitative approach facilitates rigorous quality assurance, ensuring that staining conditions remain optimal over time and across different instruments, which is critical for longitudinal studies or multi-center trials focused on quantifying apoptosis [49].
The Scientist's Toolkit: Essential Reagents for H&E Staining
A successful H&E stain relies on the quality and consistency of its components. The following table details key reagents and their specific functions in the staining process.
Table 3: Research Reagent Solutions for H&E Staining
| Reagent | Function in Staining Protocol | Key Considerations |
|---|---|---|
| Harris's Haematoxylin | Alum-based haematoxylin for nuclear staining. | Provides clear nuclear detail. Can be used for regressive staining. Best differentiated with a mild acid [5]. |
| Eosin Y with Phloxine | Cytoplasmic counterstain. | Eosin Y stains cytoplasm pink; Phloxine enhances red tones, making erythrocytes and other eosinophilic structures stand out [39]. |
| Acid Alcohol (0.3% HCl) | Selective differentiation of haematoxylin. | Removes excess haematoxylin from cytoplasm and connective tissue. The duration must be carefully controlled [39] [45]. |
| Scott's Tap Water Substitute | Bluing agent. | Alkaline solution converts soluble red haematin to insoluble blue, finalizing the nuclear stain [39]. |
| DPX Mountant | Resinous mounting medium. | Provides a permanent seal for slides, preserving the stained sample for long-term storage [39]. |
Connecting Staining to Biology: The Apoptotic Pathway
Optimized H&E staining allows for the visual detection of apoptosis's morphological endpoints. The diagram below illustrates the underlying intrinsic apoptotic pathway that leads to these cellular changes, connecting the molecular biology with the visible pathology.
This intrinsic pathway is often targeted by novel anti-cancer therapies. For instance, studies on ovarian cancer have shown that Fe₃O₄-based nanocomposites can induce apoptosis via the CytC/caspase-3 pathway, an event that would be confirmed in tissue sections using the optimized H&E protocol described herein [47]. Similarly, research into hydrogen gas therapy for ovarian cancer found that it promoted tumor cell apoptosis, a conclusion supported by H&E staining of tumor tissues in animal models [48].
The reliable detection of apoptosis in tissue sections is a critical endpoint in many biomedical research programs, especially in oncology and drug discovery. While advanced techniques exist, H&E staining remains a fundamental, cost-effective, and information-rich method. The protocol and quality control measures outlined in this application note provide researchers with a robust framework for generating highly consistent and interpretable H&E slides. By meticulously optimizing hematoxylin intensity and eosin differentiation, scientists can ensure that the subtle morphological signatures of apoptosis are rendered with maximum clarity, providing a solid histological foundation for their research conclusions.
This application note provides detailed protocols for configuring light microscopy systems and selecting appropriate magnifications for apoptosis detection research utilizing hematoxylin and eosin (H&E) staining. Proper microscope setup is fundamental to accurately identifying and analyzing the subtle morphological changes characteristic of apoptotic cells, such as cell shrinkage, chromatin condensation, and formation of apoptotic bodies. This guidance is framed within the context of a broader thesis on H&E staining protocol optimization for apoptosis detection, providing researchers, scientists, and drug development professionals with standardized methodologies to enhance the reliability and reproducibility of their cellular death assays.
Theoretical Foundations of Microscope Resolution
The ability to resolve fine cellular details, such as condensed chromatin in apoptotic cells, is governed by the physical principles of light microscopy. Resolution, defined as the minimum distance between two distinct points that can be distinguished as separate entities, is intrinsically linked to the numerical aperture (NA) of the microscope's optical components and the wavelength of light used for imaging [50].
Key Mathematical Models for Resolution
Several mathematical models describe the theoretical limits of microscope resolution, each with specific applications in histological analysis.
Table 1: Resolution Formulas for Light Microscopy
| Formula Name | Equation | Application Context | Key Variables |
|---|---|---|---|
| Abbe's Diffraction Limit (Lateral) | ( d = \lambda / (2NA) ) | Fundamental limit for XY resolution; ideal for theoretical calculations. [50] | ( d )=resolution, ( \lambda )=wavelength, NA=Numerical Aperture |
| Abbe's Diffraction Limit (Axial) | ( d = 2\lambda / (NA)^2 ) | Estimates resolution along the Z-axis (depth of focus). [50] | As above |
| Rayleigh Criterion | ( R = 1.22\lambda / (NA{obj} + NA{cond}) ) | Defines when two points are "just resolved"; incorporates condenser NA. [50] | ( NA{obj} )=Objective NA, ( NA{cond} )=Condenser NA |
| Full Width at Half Maximum (FWHM) | ( R_{FWHM} = 0.51\lambda / (NA) ) | Practical resolution parameter derived from point spread function measurement. [50] | As above |
For typical apoptosis research using visible light (e.g., green light at 514 nm) and a high-NA oil immersion objective (NA 1.45), the theoretical lateral resolution limit is approximately 177 nm [50]. This level of detail is sufficient to observe major nuclear morphological changes but may not resolve the finest chromatin fragments without super-resolution techniques.
Figure 1: Key factors determining microscope resolution for apoptosis detection. Higher NA and shorter wavelengths enable visualization of finer apoptotic features like chromatin condensation.
Microscope Selection and Configuration for Apoptosis Research
Selecting the appropriate microscope type and configuring it correctly is critical for successful apoptosis detection in H&E-stained tissues.
Microscope Types for Histological Analysis
Table 2: Microscope Types for Apoptosis Detection Research
| Microscope Type | Typical Magnification Range | Key Features for Apoptosis Research | Best Use Cases |
|---|---|---|---|
| Compound Microscope | 40x - 1000x | High-resolution optics, multiple contrast techniques (phase contrast, DIC), binocular/trinocular heads. [51] | High-magnification analysis of nuclear morphology in thin tissue sections. |
| Digital Microscope | Varies with camera sensor | Direct image capture, real-time sharing, software-based measurement and analysis. [51] | Quantitative analysis, documentation, and collaborative review of apoptotic cells. |
| Stereo Microscope | 10x - 50x | 3D visualization, long working distance, wide field of view. [51] | Gross specimen examination and dissection prior to slide preparation. |
Illumination and Contrast Techniques
Proper illumination is essential for visualizing the subtle color and texture changes in H&E-stained apoptotic cells [52].
- Brightfield Illumination: The standard technique for H&E-stained specimens. It requires optimal adjustment of the condenser aperture and field diaphragm for maximum contrast of stained cellular components [52].
- Köhler Illumination: This precise alignment method must be performed to ensure even specimen illumination, maximum resolution, and minimal glare. The protocol involves focusing the specimen, closing the field diaphragm, centering and focusing the condenser, then reopening the diaphragm [50].
- Phase Contrast & DIC: These techniques can be applied to visualize apoptotic cells in unstained live samples, revealing cell shrinkage and membrane blebbing without fixation or staining [52].
Magnification Guidelines for Apoptosis Detection in H&E-Stained Tissues
Selecting appropriate magnification is a strategic decision that balances the need for cellular detail with field of view context.
Table 3: Magnification Guidelines for Apoptosis Detection
| Magnification Range | Objective Lens Type | Observable Apoptotic Features | Research Application |
|---|---|---|---|
| 100x - 200x | 10x - 20x | Initial identification of potential apoptotic foci and overall tissue architecture. [51] [26] | Rapid screening of tissue sections to locate regions of interest. |
| 400x | 40x (High NA dry) | Clear visualization of individual apoptotic cells: cell shrinkage, nuclear condensation, and apoptotic bodies. [26] | Routine identification and counting of apoptotic cells in H&E-stained sections. |
| 630x - 1000x | 63x - 100x (Oil immersion) | Fine structural details: precise nuclear morphology, chromatin fragmentation patterns. [50] [51] | Detailed morphological analysis and high-resolution imaging for publication. |
Higher magnification is not always better; it reduces the field of view and depth of field. The optimal approach is to begin with lower magnification to locate areas of interest, then move to higher magnifications for detailed analysis of specific cells [51] [52].
Figure 2: Systematic workflow for magnification selection in apoptotic cell analysis, progressing from tissue screening to detailed confirmation.
Detailed Experimental Protocol: Apoptosis Detection via H&E Staining and Light Microscopy
Sample Preparation and Staining
This protocol assumes tissue fixation and processing have been completed.
- Sectioning: Cut formalin-fixed, paraffin-embedded (FFPE) tissues into 4-μm thick sections using a microtome [26]. Float sections on a warm water bath (40-45°C) to minimize wrinkles.
- Deparaffinization and Rehydration:
- Xylene I: 10 minutes
- Xylene II: 10 minutes
- 100% Ethanol I: 5 minutes
- 100% Ethanol II: 5 minutes
- 95% Ethanol: 5 minutes
- 70% Ethanol: 5 minutes
- Distilled water: 5 minutes
- Hematoxylin Staining:
- Immerse sections in Mayer's Hematoxylin for 5-8 minutes [26].
- Rinse in running tap water for 5-10 minutes until sections "blue."
- Differentiate briefly in 1% acid alcohol (1% HCl in 70% ethanol) for a few seconds, then rinse again in tap water.
- Eosin Counterstaining:
- Stain in Eosin Y solution for 1-3 minutes [26].
- Dehydrate quickly through:
- 95% Ethanol: 30 seconds
- 100% Ethanol I: 30 seconds
- 100% Ethanol II: 30 seconds
- Clear in xylene I and II, 5 minutes each.
- Mounting: Coverslip using a permanent mounting medium such as DPX.
Microscopy Setup and Imaging for Apoptosis Quantification
- Microscope Preparation: Perform Köhler illumination alignment on a clean, unstained area of the slide to optimize light path.
- Low-Power Screening: Using a 10x objective, systematically scan the entire tissue section to identify regions with high apoptotic activity, often appearing as areas with increased basophilic (blue) staining or disrupted architecture.
- High-Power Analysis:
- Switch to a 40x objective (NA ≥ 0.65) or 63x oil immersion objective (NA ≥ 1.25) for detailed analysis.
- Identify apoptotic cells based on key morphological criteria [26]:
- Cell Shrinkage: Reduced cell size compared to neighboring cells.
- Cytoplasmic Condensation: Intensely eosinophilic (pink) cytoplasm.
- Nuclear Changes: Chromatin condensation (pyknosis), nuclear fragmentation (karyorrhexis), or formation of crescentic nuclei.
- Apoptotic Bodies: Membrane-bound cellular fragments containing condensed nuclear material.
- Image Capture: Use a calibrated digital microscope camera to capture representative images from at least 10 random, non-overlapping fields per sample at 400x magnification [26].
- Quantification: Calculate the Apoptotic Index (AI) using the formula: AI = (Number of Apoptotic Cells / Total Number of Cells Counted) × 100 [26].
The Scientist's Toolkit: Essential Reagents and Materials
Table 4: Key Research Reagent Solutions for H&E-based Apoptosis Detection
| Item | Function/Application | Example/Notes |
|---|---|---|
| Formalin (10% Neutral Buffered) | Tissue fixation to preserve morphology and prevent degradation. [26] | Standard fixative; over-fixation can mask antigenic sites. |
| Hematoxylin Stain | Basophilic dye that stains nucleic acids (DNA/RNA) blue-black. [26] | Highlights condensed chromatin in apoptotic nuclei. |
| Eosin Y Stain | Eosinophilic dye that stains cytoplasmic proteins and connective tissue pink. [26] | Reveals cytoplasmic condensation in apoptotic cells. |
| Methyl Green-Pyronin (MGP) Stain | Histochemical alternative; stains DNA green, RNA red for easier apoptotic cell identification. [26] | Provides superior contrast for apoptotic bodies compared to H&E. |
| Cleaved Caspase-3 Antibody | Immunohistochemical marker for detecting early apoptosis execution phase. [53] | Used for confirmatory staining; specific but not exclusive to apoptosis. |
| γH2AX Antibody | Marker for DNA double-strand breaks, often associated with late apoptosis. [53] | Can be combined with cleaved Caspase-3 in multiplex assays to confirm apoptotic DNA damage. |
| Terminal Deoxynucleotidyl Transferase dUTP Nick End-Labeling (TUNEL) Kit | Fluorescent method to label DNA strand breaks characteristic of apoptosis. [54] | Highly sensitive but can also detect non-apoptotic DNA fragmentation. |
Correct light microscope setup and informed magnification selection are foundational to accurate apoptosis detection in H&E-stained tissues. By adhering to the resolution principles, configuration protocols, and magnification guidelines detailed in this document, researchers can reliably identify and quantify the distinct morphological hallmarks of apoptotic cell death. This standardized approach ensures the generation of high-quality, reproducible data crucial for advancing research in cell biology, pathology, and drug development.
Within the context of apoptosis detection research, hematoxylin and eosin (H&E) staining serves as a foundational histological technique for visualizing cellular morphology in tissue sections. The systematic screening of these stained sections enables researchers to identify characteristic apoptotic features, such as cell shrinkage, chromatin condensation, and the formation of apoptotic bodies. This application note provides detailed methodologies and quantitative frameworks for the methodical examination of tissue sections, specifically tailored for apoptosis detection in research and drug development contexts.
Systematic Screening Methodology for Apoptosis
Microscopy and Initial Assessment
Begin screening at low magnification (×100) to identify areas of interest and assess overall tissue architecture. Progress to higher magnifications (×400) for detailed cellular analysis. For apoptosis detection, focus on regions with inflammatory infiltrates or morphological alterations, as these areas often exhibit elevated apoptotic activity [26].
Identification of Apoptotic Morphological Features
Apoptotic cells demonstrate distinctive morphological characteristics that must be systematically identified [26] [41]:
- Cell Shrinkage: Reduced cell size with increased cell density
- Cytoplasmic Changes: Condensed, deeply eosinophilic cytoplasm
- Nuclear Alterations: Pyknotic nuclei appearing round, crescentic, or irregularly shaped
- Membrane Blebbing: Formation of bulges or blebs on the cell surface
- Apoptotic Bodies: Small, membrane-bound fragments containing condensed chromatin
Table 1: Morphological Features of Apoptosis in H&E-Stained Sections
| Feature | Appearance in H&E | Diagnostic Significance |
|---|---|---|
| Cell Shrinkage | Small, dense cells | Early apoptosis indicator |
| Cytoplasmic Condensation | Deep eosinophilia | Increased protein density |
| Nuclear Pyknosis | Small, dark nuclei | Chromatin condensation |
| Karyorrhexis | Nuclear fragmentation | Intermediate stage |
| Apoptotic Bodies | Membrane-bound fragments | Late stage apoptosis |
Quantitative Assessment and Apoptotic Index
The apoptotic index (AI) provides a quantitative measure of apoptosis within a tissue sample. Calculate AI by counting apoptotic cells in multiple random fields (minimum 10 fields) and expressing the result as a percentage of total cells counted [26]:
AI = (Number of apoptotic cells / Total number of cells counted) × 100
Research indicates that H&E staining may underestimate apoptosis by 2- to 3-fold compared to specialized detection methods, necessitating careful validation and potential complementary techniques [41].
Experimental Protocols for Apoptosis Detection
H&E Staining Protocol for Optimal Apoptosis Visualization
The following detailed protocol ensures consistent, high-quality staining for apoptosis detection research [45]:
Reagent Formulations [45]:
- Lillie Mayer's Haematoxylin: Haematoxylin (2g), Aluminium ammonium sulphate (200g), Sodium iodate (4g), Acetic acid (80ml), Glycerol (1200ml), Distilled water (2800ml)
- Acid Alcohol (0.3%): Hydrochloric acid (12ml) in 70% ethanol (4000ml)
- Scott's Tap Water Substitute: Sodium hydrogen carbonate (10g), Magnesium sulphate (100g), Distilled water (5L)
- Eosin/Phloxine Solution: 1% Eosin Y (400ml), 1% aqueous Phloxine (40ml), 95% alcohol (3100ml), Glacial acetic acid (16ml)
Staining Procedure [45]:
- Deparaffinization and Hydration: Process sections through xylene and graded alcohols to distilled water
- Nuclear Staining: Immerse in Mayer's haematoxylin for 4-10 minutes based on tissue type and fixation
- Rinsing: Wash in running tap water to remove excess stain
- Differentiation: Treat with 0.3% acid alcohol until nuclei are clearly defined against a near-colorless background
- Blueing: Place in Scott's tap water substitute for 1-2 minutes to achieve proper nuclear color
- Counterstaining: Stain with eosin/phloxine solution for 2 minutes
- Rinsing: Briefly wash in tap water to remove excess eosin
- Dehydration and Mounting: Process through graded alcohols, xylene, and mount with synthetic resin
Technical Considerations [45]:
- Differentiation requires experience to determine the correct endpoint
- Acidic fixatives enhance eosinophilic staining
- Nuclear staining intensity varies with fixation time and tissue type
- Renal biopsies and decalcified tissues require extended haematoxylin staining
Apoptotic Cell Counting and Validation Protocol
Systematic Counting Methodology [26]:
- Scan entire tissue section at low magnification (×100) to identify representative regions
- Select 10 random fields at higher magnification (×400) for detailed analysis
- Count a minimum of 1000 cells per sample to ensure statistical reliability
- Identify apoptotic cells based on established morphological criteria
- Calculate apoptotic index as described in section 1.3
Validation Measures [41]:
- Compare H&E findings with complementary staining methods (e.g., methyl green-pyronin, TUNEL)
- Have counts verified by multiple independent observers
- Utilize digital imaging systems for reproducible quantification
Quantitative Data and Staining Comparisons
Apoptotic Indices in Physiological and Pathological States
Research demonstrates significant variations in apoptotic indices across tissue types and disease states. The following table summarizes key quantitative findings from apoptosis detection studies:
Table 2: Comparative Apoptotic Indices Across Tissue Conditions
| Tissue Condition | Apoptotic Index (AI) Range | Staining Method | Reference |
|---|---|---|---|
| Healthy Gingiva | Lower AI | H&E | [26] |
| Chronic Periodontitis | Significantly Higher AI | H&E | [26] |
| Chronic Periodontitis | Further Increased AI | Methyl Green-Pyronin | [26] |
| Colorectal Adenocarcinoma | Variable AI | Optimized TUNEL | [41] |
Method Comparison for Apoptosis Detection
Table 3: Technical Comparison of Apoptosis Detection Methods
| Method | Principle | Advantages | Limitations |
|---|---|---|---|
| H&E Staining | Morphological assessment | Cost-effective, widely available, familiar to researchers | May underestimate apoptosis by 2-3 fold [41] |
| Methyl Green-Pyronin | Differential nucleic acid staining | Enhanced visualization of apoptotic cells | Less familiar protocol, requires additional optimization [26] |
| TUNEL | DNA fragmentation detection | High sensitivity for DNA breaks | Technical artifacts, false positives, expensive [41] |
| FLIM with H&E | Fluorescence lifetime of eosin | Provides quantitative data, enhances diagnostic accuracy | Specialized equipment required [55] |
The Scientist's Toolkit: Essential Research Reagents and Materials
Table 4: Key Research Reagent Solutions for Apoptosis Detection Studies
| Reagent/Material | Function | Application Notes |
|---|---|---|
| Mayer's Haematoxylin | Nuclear staining | Aluminum mordant provides precise nuclear detail essential for identifying apoptotic chromatin patterns |
| Eosin Y with Phloxine | Cytoplasmic counterstain | Enhances contrast for identifying cytoplasmic condensation in apoptotic cells |
| Acid Alcohol | Differentiation | Critical for controlling staining intensity and achieving optimal nuclear-cytoplasmic contrast |
| Scott's Tap Water | Blueing agent | Converts hematein to blue color for optimal nuclear visualization |
| Neutral Buffered Formalin | Tissue fixation | Optimal fixation preserves morphological features essential for accurate apoptosis identification |
| Methyl Green-Pyronin | Alternative stain | Provides superior apoptotic cell discrimination when combined with H&E screening [26] |
| Proteinase K | Antigen retrieval | Required for TUNEL assay optimization but can introduce artifacts if not carefully controlled [41] |
Advanced Techniques and Integration Approaches
Complementary Staining Methods
For enhanced apoptosis detection, consider integrating H&E screening with methyl green-pyronin (MGP) staining. Research demonstrates that MGP provides superior discrimination of apoptotic cells, with dense methyl green-staining of pyknotic nuclei and dense red pyronin staining in the cytoplasm [26]. This combination approach allows for verification of apoptotic counts identified through standard H&E screening.
Quality Control and Standardization
Implement rigorous quality control measures to ensure staining consistency:
- Stain Assessment Slides: Utilize quantitative biopolymer film slides to standardize H&E staining intensity across experiments [49]
- Digital Color Analysis: Employ color deconvolution algorithms to quantify hematoxylin and eosin intensity ratios [43]
- Control Tissues: Include both positive and negative control tissues in each staining batch to validate apoptotic detection sensitivity
Emerging Technologies
Recent advances in fluorescence lifetime imaging microscopy (FLIM) with H&E staining provide quantitative signatures for apoptosis detection, particularly in oncology research. This approach leverages the fluorescence properties of eosin to generate quantitative data while maintaining familiar H&E morphology [55]. Additionally, computational approaches using deep learning frameworks show promise in predicting immunohistochemical biomarkers directly from H&E-stained whole slide images, potentially enhancing the informational yield from standard H&E sections [33].
Troubleshooting and Technical Considerations
Common Pitfalls in Apoptosis Identification
- Over-differentiation: Excessive acid alcohol treatment can diminish nuclear details essential for identifying early apoptotic changes [45]
- Fixation Artifacts: Incomplete or delayed fixation can produce morphological alterations that mimic or obscure apoptotic features [41]
- Necrosis Confusion: Distinguishing apoptosis from necrosis requires careful attention to morphological details—apoptosis shows cell shrinkage and organized fragmentation, while necrosis demonstrates cell swelling and disordered disintegration [41]
Optimization Strategies
- Stain Validation: Regularly compare H&E findings with established apoptosis detection methods to verify sensitivity and specificity [26]
- Observer Training: Conduct inter-observer concordance assessments to maintain consistent apoptotic identification criteria across research personnel [43]
- Protocol Standardization: Establish and document specific staining protocols tailored to your tissue type and research objectives to ensure reproducible results [45]
This systematic approach to tissue section screening provides researchers with a comprehensive framework for apoptosis detection using H&E staining. By implementing these standardized protocols and quantitative assessment methods, scientists can generate reliable, reproducible data for apoptosis research and drug development applications.
Accurate whole-cell segmentation is a foundational step in quantitative analysis of the tumor microenvironment, particularly in apoptosis detection research using hematoxylin and eosin (H&E)-stained tissues. The CSGO (Cell Segmentation with Globally Optimized boundaries) pipeline represents a significant advancement in deep learning-based segmentation, specifically tailored for H&E-stained whole-slide images. This pipeline integrates nuclei and membrane segmentation algorithms followed by postprocessing using an energy-based watershed method, enabling robust whole-cell segmentation across diverse tissue types and cancer subtypes [56] [57]. For apoptosis research, precise cell boundary delineation allows researchers to accurately quantify morphological changes associated with programmed cell death, providing crucial insights into cancer progression and treatment response.
The CSGO pipeline was extensively validated on five external datasets comprising liver, lung, and oral disease cases. The quantitative evaluation demonstrated CSGO's superior performance over Cellpose, the state-of-the-art method, across most tested datasets as measured by F1 score at an Intersection over Union (IoU) threshold of 0.5 [56].
Table 1: Performance Comparison of CSGO vs. Cellpose Across Tissue Types
| Tissue Type | CSGO F1 Score | Cellpose F1 Score | Performance Advantage |
|---|---|---|---|
| Liver Tissue 1 | 0.53 | 0.36 | +0.17 |
| Liver Tissue 2 | 0.49 | 0.31 | +0.18 |
| Lung Tissue | 0.45 | 0.28 | +0.17 |
| Oral Disease 1 | 0.41 | 0.25 | +0.16 |
| Oral Disease 2 | 0.37 | 0.21 | +0.16 |
The performance advantage of CSGO is particularly notable in tissues with significant variations in individual cell sizes, a common challenge in apoptosis research where dying cells exhibit diverse morphological characteristics [56] [57].
CSGO Framework and Methodology
Architectural Components
The CSGO framework integrates two complementary deep learning approaches with optimized post-processing:
HD-YOLO for Nuclei Segmentation: Adapted from the You Only Look Once (YOLO) object detection algorithm, this component provides precise nuclei localization, which is crucial for initiating the cell segmentation process [56] [57].
U-Net for Membrane Detection: This convolutional neural network architecture is trained to detect cell membranes with various intensities, addressing the challenge of variable staining quality in H&E preparations [56] [57].
Energy-Based Watershed Method: This postprocessing algorithm integrates the nuclei and membrane detection outputs to generate globally optimized whole-cell boundaries, effectively separating adjacent cells and accurately delineating complex cellular structures [56].
Experimental Protocol for Membrane Detection Model Training
The membrane detection component of CSGO was trained using the following detailed methodology:
Training Dataset: The model was trained on a dataset of 7 hepatocellular carcinomas and 11 normal liver tissue patches, providing diversity in tissue architecture and cellular morphology [56].
Model Architecture: U-Net architecture was implemented, which is particularly effective for biomedical image segmentation due to its encoder-decoder structure with skip connections [56].
Training Procedure: The model was trained to detect cell membranes across varying staining intensities, enhancing robustness to preparation variability [56].
Validation Approach: Performance was extensively evaluated on 5 external datasets including liver, lung, and oral disease cases, demonstrating cross-tissue applicability [56].
Computational Implementation
System Requirements and Setup
Table 2: Essential Research Reagent Solutions and Computational Resources
| Resource Type | Specification | Function/Purpose |
|---|---|---|
| Pretrained Weights | epoch_190.pt (UNet) | Provides pre-trained membrane detection model [57] |
| HD-Yolo Weights | Separate download (large file) | Provides pre-trained nuclei detection model [57] |
| Computational Framework | PyTorch | Deep learning framework for model execution [57] |
| GPU Support | CUDA-compatible GPU recommended | Accelerates computation for whole-slide image processing [57] |
| Input Data | H&E-stained Whole Slide Images | Standard H&E-stained tissue sections for analysis [56] |
Execution Protocol
Implementation requires specific command-line arguments for proper execution:
Essential parameters include:
--data_path: Input H&E whole-slide image filename [57]--yolo_path: Path to HD-Yolo model weights (torch jit model) [57]--unet_path: Path to U-Net model weights (torch jit model) [57]--zoom_for_mppand--mpp_for_zoom: Microscope-specific resolution conversion parameters (standard 40x at 0.25mpp) [57]--cell_size: Default cell diameter measured in pixels [57]
Workflow Integration for Apoptosis Research
Computational Environment Setup
Immunohistochemistry (IHC) is a cornerstone of modern pathologic analysis, providing essential insights for cancer diagnosis, subtyping, and treatment planning by detecting specific proteins within tissue samples [33]. Despite its clinical value, IHC staining presents significant limitations: it is costly, time-consuming, resource-intensive, and requires specialized expertise [33] [58]. These challenges are particularly acute in drug development and apoptosis detection research, where rapid, cost-effective biomarker screening is essential for accelerating therapeutic discovery.
Cross-modality learning represents a transformative approach in computational pathology, enabling the prediction of IHC biomarkers directly from routinely collected hematoxylin and eosin (H&E)-stained whole slide images (WSIs) [33] [59]. This paradigm shift leverages the fact that H&E staining is a fundamental, cost-effective cornerstone of pathologic analysis that offers reliable visualization of cellular morphology and tissue architecture [33]. By extracting molecular information from standard H&E images, researchers can potentially bypass the need for additional IHC staining in certain scenarios, streamlining workflows and preserving precious tissue samples.
This Application Note focuses on HistoStainAlign, a novel deep learning framework that exemplifies the potential of cross-modality learning for predicting IHC staining patterns directly from H&E WSIs [33] [59]. We provide a comprehensive technical overview, performance validation data, and detailed protocols to facilitate implementation of this approach in biomedical research and drug development settings, with particular relevance to apoptosis detection studies where biomarkers like P53 and Ki-67 play crucial roles.
Technical Framework & Mechanism of Action
Core Architecture
HistoStainAlign employs a sophisticated deep learning framework designed to bridge the modality gap between H&E and IHC staining patterns. The system integrates paired H&E and IHC embeddings through a specialized contrastive training strategy that captures complementary features across staining modalities without requiring patch-level annotations or rigorous tissue registration [33] [59]. This approach fundamentally differs from traditional virtual staining methods that attempt to generate pixel-to-pixel translations of IHC images from H&E inputs.
The framework utilizes a dual-encoder architecture that processes both H&E and IHC whole-slide images, learning a shared embedding space where semantically similar tissue regions from different modalities are positioned proximally [59]. The contrastive learning objective maximizes agreement between corresponding H&E-IHC patch pairs while minimizing agreement between non-corresponding pairs, enabling the model to learn robust feature representations that transcend staining techniques.
Key Algorithmic Innovations
Registration-Free Training: Unlike conventional approaches that require precise alignment between H&E and IHC tissue sections, HistoStainAlign's contrastive framework learns from weakly paired slides, accommodating natural variations in tissue cutting and mounting [33].
Multi-Scale Feature Integration: The model processes WSIs at multiple magnification levels, capturing both cellular-level details and broader tissue architecture patterns essential for accurate biomarker prediction [59].
Cross-Modality Embedding Alignment: Through contrastive learning, the model develops a unified feature space where morphological patterns in H&E images are mapped to their corresponding protein expression patterns in IHC [33] [59].
The following diagram illustrates the core contrastive learning workflow of HistoStainAlign:
Performance Validation & Benchmarking
Quantitative Performance Metrics
HistoStainAlign has been rigorously validated on gastrointestinal and lung tissue whole-slide images using three clinically significant IHC biomarkers: P53, programmed death ligand-1 (PD-L1), and Ki-67 [33] [59]. The model demonstrated robust performance across all three biomarkers, with the following quantitative results:
Table 1: HistoStainAlign Performance on Key IHC Biomarkers
| Biomarker | Tissue Types | Weighted F1 Score | 95% Confidence Interval | Clinical Relevance |
|---|---|---|---|---|
| P53 | Gastrointestinal, Lung | 0.735 | 0.670 - 0.799 | Mutation status, apoptosis regulation |
| PD-L1 | Gastrointestinal, Lung | 0.830 | 0.772 - 0.886 | Immunotherapy response prediction |
| Ki-67 | Gastrointestinal, Lung | 0.723 | 0.607 - 0.836 | Cell proliferation, apoptosis balance |
Comparative analyses demonstrate that HistoStainAlign outperforms baseline models without contrastive learning components, highlighting the critical importance of its cross-modality alignment strategy [33]. Embedding space visualizations confirm that the model successfully clusters tissues with similar molecular characteristics despite morphological variations, capturing meaningful biological relationships [59].
Clinical Validation & Concordance
In independent validation studies focusing on gastrointestinal cancers, deep learning-based IHC prediction models achieved impressive diagnostic accuracy, further supporting the clinical viability of this approach [58]. A multi-reader multi-case (MRMC) study involving pathologists comparing AI-generated IHC with conventional IHC demonstrated substantial concordance across multiple biomarkers:
Table 2: Clinical Concordance Between AI-IHC and Conventional IHC
| Biomarker | Concordance Rate | AUC | Accuracy | Clinical Application Context |
|---|---|---|---|---|
| P40 | 96.67% - 100% | 0.90-0.96 | 83.04-90.81% | Squamous vs. adenocarcinoma differentiation |
| Pan-CK | 96.67% - 100% | 0.90-0.96 | 83.04-90.81% | Epithelial origin confirmation |
| Desmin | 96.67% - 100% | 0.90-0.96 | 83.04-90.81% | Submucosal invasion assessment |
| P53 | 70.00% | 0.90-0.96 | 83.04-90.81% | Mutation status evaluation |
| Ki-67 | ICC: 0.415 (P=0.015) | 0.90-0.96 | 83.04-90.81% | Proliferation index quantification |
For Ki-67, the AI-generated proliferation index showed variability of 17.35% ±16.2% compared to conventional IHC, with an intraclass correlation coefficient (ICC) of 0.415 (P=0.015) [58]. This moderate correlation highlights both the promise and current limitations of virtual proliferation index assessment, suggesting that while the technology can reliably identify high vs. low proliferation cases, precise quantitative agreement remains challenging.
Experimental Protocols
Whole Slide Image Preparation Protocol
Proper WSI preparation is fundamental for successful cross-modality prediction. The following protocol outlines the critical steps for sample processing and digitization:
Tissue Processing and Sectioning
- Fix tissue samples in 10% neutral buffered formalin for 6-72 hours depending on tissue size
- Process through graded ethanol series (70%, 80%, 95%, 100%) for dehydration
- Clear in xylene and embed in paraffin blocks
- Section at 4-5μm thickness using a rotary microtome
- Float sections in water bath at 40-45°C and mount on charged glass slides
- Dry slides at 60°C for 30-60 minutes
H&E Staining Protocol
- Deparaffinize slides in xylene (3 changes, 3 minutes each)
- Rehydrate through graded ethanol series (100%, 95%, 80%, 70%) - 1 minute each
- Rinse in distilled water for 1 minute
- Stain in Harris hematoxylin for 3-8 minutes (optimize based on tissue type)
- Rinse in running tap water for 1 minute
- Differentiate in 0.5% acid alcohol for 5-10 seconds
- Rinse in running tap water for 1 minute
- Blue in Scott's tap water substitute for 1 minute
- Rinse in running tap water for 1 minute
- Counterstain in eosin Y solution for 1-3 minutes
- Dehydrate through graded ethanol series (70%, 80%, 95%, 100%) - 30 seconds each
- Clear in xylene (3 changes, 2 minutes each)
- Coverslip using permanent mounting medium
Whole Slide Image Digitization
- Use high-resolution slide scanners (KF-PRO-020 or Pannoramic 250 Flash Scanner recommended)
- Scan at 20× or 40× magnification with consistent lighting conditions
- Save in pyramidal file formats (SVS, TIFF) for efficient multi-resolution analysis
- Implement quality control checks for focus, illumination uniformity, and color consistency
HistoStainAlign Implementation Protocol
Implementation of the cross-modality prediction framework involves both data preprocessing and model configuration:
Data Preprocessing Pipeline
- Tile Extraction: Segment WSIs into non-overlapping 512×512 pixel tiles at 20× magnification [58]
- Stain Normalization: Apply Vahadane method with iterative luminosity standardization to minimize inter-slide color variability [58]
- Quality Filtering: Exclude tiles with significant artifacts, folding, or excessive background
- Data Partitioning: Ensure patient-level separation between training, validation, and test sets
Model Configuration
- Utilize ResNet-50 backbone pretrained on ImageNet or histopathology-specific foundation models [58] [60]
- Implement Mean Teacher semi-supervised learning framework for improved generalization [58]
- Configure contrastive loss with temperature scaling to optimize embedding space separation
- Set initial learning rate of 0.001 with cosine decay scheduling
- Train with batch size of 32-64 depending on available GPU memory
Inference and Interpretation
- Process entire WSIs through trained model to generate tile-level predictions
- Aggregate tile predictions using attention-weighted pooling [61]
- Generate prediction confidence scores for clinical decision support
- Create spatial heatmaps to visualize intratumoral heterogeneity
The following workflow diagram illustrates the complete experimental pipeline from sample preparation to biomarker prediction:
The Scientist's Toolkit: Essential Research Reagents & Materials
Successful implementation of cross-modality prediction requires specific reagents, equipment, and computational resources. The following table details essential components for establishing this technology in a research setting:
Table 3: Essential Research Reagents and Solutions for Cross-Modality Prediction
| Category | Item | Specifications | Application Purpose |
|---|---|---|---|
| Histology Reagents | Hematoxylin Solution | Harris or Mayer's formulation | Nuclear staining in H&E protocol |
| Eosin Y Solution | 0.5-1.0% in aqueous or alcoholic solution | Cytoplasmic staining in H&E protocol | |
| Ethanol Series | 70%, 80%, 95%, 100% concentrations | Tissue dehydration and rehydration | |
| Xylene | Histological grade | Clearing agent for paraffin removal | |
| Mounting Medium | Permanent synthetic resin | Slide preservation and coverslipping | |
| IHC Antibodies | P53 Antibody | DO-7 clone recommended | IHC ground truth for model training |
| PD-L1 Antibody | 22C3 pharmDx kit | IHC ground truth for immunotherapy biomarkers | |
| Ki-67 Antibody | MIB-1 clone recommended | IHC ground truth for proliferation assessment | |
| Digital Pathology | Slide Scanner | KF-PRO-020 or Pannoramic 250 Flash | Whole slide image digitization |
| Image Storage | Network-attached storage with RAID | Secure WSI archiving and retrieval | |
| Computational Resources | GPU Workstation | NVIDIA RTX A6000 or equivalent | Model training and inference |
| Deep Learning Framework | PyTorch or TensorFlow | Model implementation and customization | |
| Whole Slide Analysis Software | QuPath, HALO, or custom solutions | WSI preprocessing and annotation |
Applications in Apoptosis Detection Research
The integration of cross-modality prediction into apoptosis detection research offers significant opportunities for accelerating biomarker discovery and validation. Specifically, this approach enables:
Large-Scale Retrospective Studies: By leveraging archival H&E samples, researchers can investigate apoptosis-related biomarkers across thousands of cases without requiring additional tissue sections or IHC staining [60]. This is particularly valuable for rare cancer subtypes or longitudinal studies where tissue availability is limited.
Spatial Heterogeneity Analysis: HistoStainAlign-generated predictions maintain spatial information, allowing researchers to map intratumoral variations in apoptosis-related protein expression and correlate these patterns with morphological features in the H&E images [61].
Accelerated Therapeutic Development: In drug development pipelines, rapid assessment of apoptosis biomarkers (e.g., P53, Ki-67) from standard H&E images can streamline compound evaluation and prioritization, particularly in high-throughput screening contexts [62].
Resource-Constrained Settings: The approach demonstrates particular value in laboratories with limited budgets or technical capabilities for comprehensive IHC testing, enabling broader access to molecular profiling [33] [58].
Cross-modality prediction of IHC biomarkers from H&E images represents a paradigm shift in computational pathology, with HistoStainAlign exemplifying the potential of contrastive learning approaches to bridge morphological and molecular analyses. The robust performance demonstrated across multiple biomarkers and tissue types, combined with detailed experimental protocols provided in this Application Note, establishes a foundation for widespread adoption of this technology in biomedical research and drug development.
For apoptosis detection research specifically, this approach offers unprecedented opportunities to extract molecular insights from routine H&E staining, enabling large-scale biomarker studies, spatial heterogeneity analyses, and accelerated therapeutic development. As the field advances, integration of additional data modalities and refinement of prediction accuracy for quantitative biomarkers will further enhance the utility of this transformative technology.
Troubleshooting H&E for Apoptosis: Overcoming Pitfalls and Interpretation Challenges
Within the context of hematoxylin and eosin (H&E) staining protocol research, accurately identifying apoptotic cells is fundamental for studies ranging from cancer drug development to understanding disease pathogenesis. However, the interpretation of H&E-stained tissues is frequently complicated by processing artifacts—such as tissue shrinkage, knife marks, and fixation-induced hypereosinophilia—that can mimic the morphological features of true apoptosis. This application note provides a detailed guide, complete with protocols and data analysis techniques, to help researchers reliably differentiate genuine apoptotic cell death from artifacts introduced during tissue preparation, thereby improving the validity of experimental findings.
Morphological Criteria for Differentiation
The definitive identification of apoptosis relies on recognizing a constellation of specific nuclear and cytoplasmic changes. The table below contrasts the key features of true apoptosis against common processing artifacts.
Table 1: Morphological Differentiation of True Apoptosis and Common Artifacts in H&E-Stained Sections
| Feature | True Apoptosis | Processing Damage (Artifacts) |
|---|---|---|
| Nuclear Changes | Chromatin condensation (pyknosis), nuclear fragmentation (karyorrhexis). Sharply defined, round/crescentic pyknotic nuclei [26]. | Smudged or faded chromatin, irregular shrinkage, often spread unevenly across the tissue section. |
| Cytoplasmic Changes | Condensation, deep eosinophilia (pink), formation of membrane-bound apoptotic bodies [26]. | Vacuolization, uneven staining, retraction artifacts at cell boundaries, diffuse hypereosinophilia. |
| Cellular Distribution | Typically single, scattered cells or small clusters within viable tissue [26]. | Often appears in large, contiguous zones, aligned in rows (e.g., along knife marks) or at tissue edges. |
| Tissue Context | Presence of an inflammatory infiltrate or is within a pathophysiological context (e.g., diseased tissue) [26]. | Located near folding, cutting edges, or poorly fixed areas, lacking a biological context. |
| Cellular Membrane | Intact, forming discrete, rounded apoptotic bodies. | Disrupted or indistinct, not forming discrete, membrane-bound bodies. |
Quantitative Comparison of Detection Methods
While H&E is the cornerstone of histological analysis, several techniques can be employed to confirm apoptosis. The choice of method involves a trade-off between cost, complexity, and specificity.
Table 2: Comparison of Methods for Apoptosis Detection in Tissue Sections
| Method | Principle | Key Advantage | Key Disadvantage | Suitability for Differentiation |
|---|---|---|---|---|
| H&E Staining | Morphological assessment of nuclear and cytoplasmic changes. | Low cost, widely available, standard for histology [26]. | Subjective; difficult to distinguish artifacts in suboptimal samples [26]. | Moderate (requires high expertise) |
| Methyl Green-Pyronin (MGP) | Methyl green binds DNA (green), Pyronin binds RNA (red). | Cost-effective; clear visualization of pyknotic nuclei (green) and cytoplasmic RNA (red) [26]. | Less common protocol; not a direct marker of apoptosis. | High (improved nuclear clarity) |
| TUNEL Assay | Labels DNA strand breaks in situ. | High specificity for DNA fragmentation. | Time-consuming, expensive, can label necrotic cells [26]. | High (confirms biochemical hallmark) |
| Immunohistochemistry (IHC) | Detects activated caspases (e.g., caspase-3). | High specificity for apoptosis pathway. | Costly, requires specific antibodies and optimization [54]. | High (confirms biochemical hallmark) |
| Live-Cell Imaging (FRET/ QPI) | Real-time detection of caspase activity (FRET) or mass distribution changes (QPI). | Provides dynamic, kinetic data on cell death [63] [64]. | Requires specialized equipment and cell lines, not for fixed tissue [63]. | Very High (direct observation of process) |
Supporting Data: A study comparing H&E and MGP for detecting apoptosis in gingival epithelium found that apoptotic cells were "easily distinguishable" in MGP-stained sections, with a statistically significant improvement in identification compared to H&E (P < 0.05) [26]. Furthermore, real-time imaging methods using FRET-based caspase probes can definitively discriminate apoptosis from primary necrosis by visualizing caspase activation and tracking mitochondrial integrity at the single-cell level [63].
Detailed Experimental Protocols
Protocol: Enhanced Detection of Apoptotic Cells using Methyl Green-Pyronin (MGP)
This protocol provides a cost-effective method for improving the visualization of apoptotic cells in paraffin-embedded tissue sections [26].
I. Sample Preparation
- Fix tissue samples in 4% neutral buffered formalin for 24-48 hours.
- Process and embed tissue in paraffin using standard histological procedures.
- Section tissues at 4 µm thickness using a microtome and mount on poly-L-lysine-coated slides.
II. Staining Procedure
- Dewaxing and Hydration:
- Deparaffinize sections in xylene, 2 changes, 2 minutes each.
- Rehydrate through a graded ethanol series: 100% ethanol (2 minutes), 100% ethanol (2 minutes), 95% ethanol (2 minutes).
- Rinse briefly in distilled water.
- Methyl Green-Pyronin Staining:
- Stain in Methyl Green-Pyronin working solution for 10-20 minutes at room temperature.
- Rinse rapidly in distilled water.
- Blot sections gently with filter paper to remove excess water.
- Dehydration and Mounting:
- Dehydrate rapidly through two changes of n-butanol (about 30 seconds each).
- Clear in xylene, 2 changes, 2 minutes each.
- Coverslip using a synthetic mounting medium.
III. Analysis and Interpretation
- Examine slides under a light microscope.
- Apoptotic cells are identified by dense methyl green-staining of pyknotic nuclei and dense red pyronin staining in the condensed cytoplasm [26].
- Calculate the Apoptotic Index (AI) by counting apoptotic cells in 10 random fields at 100x magnification, evaluating a total of 1000 cells. AI = (Number of apoptotic cells / Total number of cells counted) × 100 [26].
Protocol: Validation of Apoptosis via TUNEL Assay
This protocol details the use of the TUNEL method to confirm apoptosis by detecting DNA fragmentation [54].
I. Sample Preparation
- Prepare paraffin-embedded sections as described in Protocol 4.1, steps I.1-I.3.
- Dewax and rehydrate as per the standard protocol (see Protocol 4.1, II.1).
- Perform proteinase K digestion (e.g., 20 µg/mL for 15-30 minutes at room temperature) to expose DNA, as per the kit manufacturer's instructions.
- Rinse slides with PBS.
II. Labeling and Detection
- Follow the manufacturer's instructions for the commercial ApopTag Peroxidase in situ Apoptosis Detection kit or equivalent.
- Incubate sections with the TdT (Terminal deoxynucleotidyl transferase) enzyme to label DNA breaks with digoxigenin-labeled nucleotides.
- Apply an anti-digoxigenin antibody conjugate (e.g., peroxidase conjugate).
- Visualize using a peroxidase substrate, such as 3,3'-diaminobenzidine (DAB), which produces a brown precipitate.
- Counterstain lightly with Harris hematoxylin [54].
III. Analysis and Interpretation
- Cells with brown-stained nuclei are considered TUNEL-positive (apoptotic).
- Calculate the Apoptotic Index as: (Number of TUNEL-positive cells / Total number of cells counted) × 100 [54].
Visual Workflows for Decision-Making and Analysis
The following diagrams provide a logical pathway for differentiating cell death and a conceptual overview of a key advanced detection technique.
Diagram 1: A diagnostic pathway to guide the morphological differentiation of true apoptosis from processing artifacts in H&E-stained tissue.
Diagram 2: Conceptual workflow for a real-time, live-cell imaging assay that uses a FRET-based caspase sensor and a mitochondrial fluorescent protein (Mito-DsRed) to definitively discriminate apoptosis from necrosis [63].
The Scientist's Toolkit: Key Research Reagents
The following table lists essential reagents and their specific functions in the protocols described for apoptosis detection and validation.
Table 3: Essential Reagents for Apoptosis Detection and Validation
| Reagent / Kit | Function / Principle | Application Context |
|---|---|---|
| Hematoxylin | Nuclear stain; binds to DNA/RNA, illustrating nuclear detail [5]. | Standard H&E staining for initial morphological screening. |
| Eosin Y | Cytoplasmic counterstain; binds to proteins, staining cytoplasm pink [5]. | Standard H&E staining for initial morphological screening. |
| Methyl Green-Pyronin (MGP) | Histochemical stain; Methyl green binds DNA (green nuclei), Pyronin binds RNA (red cytoplasm) [26]. | Enhanced visualization of apoptotic cells with pyknotic nuclei. |
| ApopTag Peroxidase Kit | TUNEL assay; enzymatically labels DNA strand breaks with digoxigenin for detection [54]. | Confirmatory specific detection of DNA fragmentation in apoptosis. |
| 3,3'-Diaminobenzidine (DAB) | Chromogen; produces a brown, insoluble precipitate when oxidized by peroxidase [54]. | Visualizing positive staining in IHC and TUNEL assays. |
| Anti-Caspase-3 Antibody | Primary antibody for IHC; detects activated (cleaved) caspase-3. | Confirmatory specific detection of caspase activation in apoptosis. |
| FRET Caspase Sensor (e.g., DEVD) | Genetically encoded probe; cleavage by caspases causes loss of FRET, visualized as a fluorescence ratio change [63]. | Real-time, live-cell imaging of caspase activity. |
| CellEvent Caspase-3/7 reagent | Fluorescent probe; becomes fluorescent upon activation by caspase-3/7. | Live-cell fluorescence imaging of caspase activation. |
Optimizing Fixation and Sectioning to Preserve Morphological Integrity
The accurate detection of apoptotic cells in tissue sections is a cornerstone of research in areas ranging from oncology to toxicology. For many laboratories, hematoxylin and eosin (H&E) staining remains the primary method for initial morphological assessment due to its accessibility, cost-effectiveness, and ability to provide full cellular context [26] [65]. However, the reliability of apoptosis identification is profoundly dependent on the initial steps of tissue fixation and processing, which, if suboptimal, can introduce artifacts that mimic or obscure true apoptotic morphology [41]. This application note provides detailed protocols for optimizing fixation and sectioning to preserve morphological integrity, specifically within the context of apoptosis detection for research and drug development.
The Critical Role of Morphology in Apoptosis Detection
Identifying Apoptosis by H&E Staining
Apoptotic cells identified on H&E-stained sections exhibit specific morphological features that distinguish them from both viable cells and those undergoing other forms of cell death like necrosis. According to the International Harmonization of Nomenclature and Diagnostic Criteria (INHAND), the key characteristics of apoptosis include cytoplasmic condensation, cell shrinkage, and nuclear condensation and fragmentation into round to crescentic, pyknotic bodies [65] [26]. Critically, apoptotic cells typically occur as single, non-contiguous cells or small clusters scattered within a tissue [65]. In contrast, necrosis involves cell swelling, rupture of organelles and the plasma membrane, and a concomitant inflammatory response [65].
Table 1: Key Morphological Features of Apoptosis and Necrosis in H&E-Stained Sections
| Feature | Apoptosis | Necrosis |
|---|---|---|
| Cell Size | Shrinkage | Swelling |
| Plasma Membrane | Intact until late stages | Disrupted |
| Nucleus | Chromatin condensation, nuclear fragmentation (pyknosis, karyorrhexis) | Karyolysis (dissolution) |
| Cellular Context | Single cells or small clusters | Contiguous zones of cells |
| Inflammation | Absent | Typically present |
| Cytoplasm | Deep eosinophilia (condensation) | Vacuolization, loss of structure |
Technical Pitfalls and the Need for Optimization
While H&E staining is a fundamental tool, studies have shown that using morphological criteria alone on suboptimal sections may underestimate the apoptotic rate by two- to three-fold [41]. A major challenge is that improper or delayed fixation can itself induce autolytic changes that resemble apoptosis or can create artificial DNA strand breaks, leading to false-positive results in subsequent confirmatory assays like TUNEL (Terminal deoxynucleotidyl transferase dUTP nick end labeling) [41]. Furthermore, over-fixation can mask antigenic sites, while under-fixation fails to preserve architecture, making accurate morphological assessment difficult. Therefore, optimized fixation and sectioning are not merely preparatory steps but are critical to the validity of the final analysis.
Optimized Protocols for Fixation and Sectioning
Tissue Fixation Protocol
The goal of fixation is to preserve tissue morphology and prevent degradation as rapidly as possible after collection.
Materials:
- Neutral Buffered Formalin (NBF): 10% is the standard fixative for most tissues intended for H&E and apoptosis analysis [26] [41].
- Specimen Containers: Appropriately sized, sealable, and chemically resistant.
- Cold Isotonic Saline: For brief rinsing, if needed.
Method:
- Dissection and Trimming: Harvest the tissue specimen with minimal mechanical manipulation or crushing. Trim to a thickness not exceeding 4-5 mm to ensure rapid and uniform penetration of fixative [41].
- Immersion Fixation: Immediately immerse the tissue in a volume of NBF that is at least 10 times the tissue volume. Agitate gently to ensure full contact.
- Fixation Duration: Fix at room temperature for 24-48 hours. Prolonged fixation (exceeding 48-72 hours) can harden tissues and negatively impact molecular studies and staining.
- Post-fixation Handling: After fixation, rinse tissues briefly in buffer or a graded alcohol series to remove excess formalin before proceeding to processing or storage.
Technical Points:
- Ischemia Time: Minimize the time between tissue devitalization and immersion in fixative (ideally less than 30 minutes) to prevent artifactual changes [41].
- Fixation for Specific Tissues: Tissues with high lipid content (e.g., brain) or dense structure (e.g., bone) may require specialized fixatives or protocols.
Tissue Processing, Embedding, and Sectioning Protocol
This process dehydrates the fixed tissue, clears it, and infiltrates it with paraffin wax to support thin sectioning.
Materials:
- Graded Ethanol Series: 70%, 95%, and 100% ethanol.
- Clearing Agent: Xylene or xylene-substitute.
- Paraffin Wax: High-quality, histologically-tested embedding medium.
- Microtome
- Charged or Coated Microslides
Method:
- Dehydration: Process tissues through a graded series of ethanol to remove water.
- 70% Ethanol: 60-90 minutes
- 95% Ethanol: 60-90 minutes
- 100% Ethanol I: 60 minutes
- 100% Ethanol II: 60 minutes
- Clearing: Process tissues through xylene to remove alcohol and prepare for wax infiltration.
- Xylene I: 60 minutes
- Xylene II: 60 minutes
- Wax Infiltration: Infiltrate tissues with molten paraffin wax in an oven (~60°C).
- Paraffin I: 60-90 minutes
- Paraffin II: 60-90 minutes
- Embedding: Orient the tissue in a mold filled with fresh molten paraffin and allow it to solidify on a cold plate. Correct orientation is crucial for obtaining representative sections.
- Sectioning: Cut serial sections of 4-5 µm thickness using a sharp, clean microtome blade [26] [45].
- Floating and Mounting: Float the ribbons of sections on a warm water bath (40-45°C) to remove wrinkles, then pick them up onto charged microslides.
- Drying: Dry slides upright in an oven at 37-40°C overnight or use a slide warmer to ensure tissue adhesion.
Technical Points:
- Section Thickness: Thicker sections (>5µm) can cause overlapping cells, making it difficult to identify individual apoptotic bodies, while thinner sections (<3µm) may not capture entire apoptotic cells.
- RNA Preservation: If subsequent RNA analysis from specific cells is planned (e.g., via Laser Capture Microdissection), protocols require optimization, including the use of RNase inhibitors and rapid dehydration to preserve RNA integrity [66].
The following workflow diagram summarizes the optimized steps from tissue collection to a stained slide ready for analysis.
Hematoxylin and Eosin Staining Protocol for Apoptosis Assessment
A consistent H&E staining protocol is essential for reliable inter-laboratory and inter-study comparisons. The following protocol, adapted from established methods, is optimized for highlighting nuclear detail [45].
Materials:
- Lillie-Mayer's Alum Haematoxylin [45]
- Acid Alcohol (0.3% HCl in 70% Ethanol) [45]
- Scott's Tap Water Substitute (or alkaline water) [45]
- Alcohlic Eosin Y with Phloxine [45]
- Graded Ethanol Series (70%, 95%, 100%)
- Xylene
- Mounting Medium
Staining Method:
- Dewax and Hydrate: Deparaffinize slides in xylene (2 changes, 3 mins each) and rehydrate through a graded ethanol series (100%, 95%, 70%) to distilled water.
- Stain Nuclei: Stain in Lillie-Mayer's Haematoxylin for 4-10 minutes (adjust based on tissue and fixative) [45].
- Rinse: Rinse in running tap water to remove excess stain.
- Differentiate: Dip slides in 0.3% Acid Alcohol briefly (seconds to a few dips) until the background is nearly colorless. This is a critical step requiring experience [45].
- Rinse: Rinse in running tap water.
- Blueing: Place in Scott's Tap Water Substitute or running alkaline tap water for 1-2 minutes to convert the haematin to its blue color [45].
- Rinse: Rinse in tap water.
- Counterstain: Stain in Eosin/Phloxine solution for 2 minutes [45].
- Rinse: Rinse briefly in tap water to remove surface eosin.
- Dehydrate and Clear: Rapidly dehydrate through graded ethanols (70%, 95%, 100%), clear in xylene (2 changes).
- Mount: Coverslip using a permanent mounting medium.
Table 2: Troubleshooting H&E Staining for Optimal Apoptosis Detection
| Problem | Possible Cause | Solution |
|---|---|---|
| Poor Nuclear Staining | Over-differentiation in acid alcohol, acidic decalcifying fluids, under-fixation | Reduce acid alcohol time; check fixation; use alternative decalcifier; increase hematoxylin time [45]. |
| Excessive Background Stain | Under-differentiation, insufficient rinsing after eosin | Increase acid alcohol differentiation time; ensure adequate rinsing [45]. |
| Difficulty Identifying Apoptotic Bodies | Overly thick sections, poor fixation, faint staining | Ensure 4-5µm section thickness; optimize fixation protocol; adjust staining intensity. |
| Artifactual Shrinkage/Clear Spaces | Improper processing (too rapid dehydration/clearing) | Adjust processing schedule to be more gradual. |
The Scientist's Toolkit: Research Reagent Solutions
Table 3: Essential Materials for Apoptosis Morphology Studies
| Reagent/Material | Function | Application Note |
|---|---|---|
| 10% Neutral Buffered Formalin (NBF) | Cross-linking fixative that preserves tissue architecture. | Standard fixative; fixation time of 24-48 hours is critical for morphology and biomolecule preservation [26] [41]. |
| Lillie-Mayer's Alum Haematoxylin | Stains nucleic acids in the nucleus blue. | An oxidized, ready-to-use formulation providing consistent nuclear staining [45]. |
| Eosin Y with Phloxine | Counterstain that acidophilic components (cytoplasm, collagen) in shades of pink/red. | Eosin stains general cytoplasm, while phloxine enhances red staining intensity, aiding cell detail [45]. |
| Methyl Green-Pyronin (MGP) Stain | Histochemical stain; Methyl green (DNA-green), Pyronin (RNA-red). | Provides easier distinction of apoptotic cells (dense green pyknotic nuclei, dense red cytoplasm) compared to H&E [26]. |
| Proteinase K | Proteolytic enzyme for antigen retrieval. | Used in TUNEL assays; concentration and time must be meticulously optimized to avoid artifactual DNA breaks [41]. |
| Charged Microslides | Glass slides with a permanent positive charge. | Ensures strong adhesion of tissue sections during staining procedures, preventing tissue loss. |
The fidelity of apoptosis detection in research and preclinical drug development is inextricably linked to the quality of tissue preparation. By implementing the optimized protocols for fixation, sectioning, and H&E staining detailed in this application note, scientists can significantly enhance the preservation of morphological integrity. This rigorous foundation not only allows for more accurate identification of apoptotic cells based on established morphological criteria but also increases the reliability of downstream confirmatory techniques, thereby strengthening the overall validity of experimental findings.
Resolving Challenges in Dense Tissue and Inflammatory Environments
Hematoxylin and eosin (H&E) staining remains the cornerstone of pathological diagnosis, enabling visualization of cellular morphology and tissue architecture critical for apoptosis detection research. However, dense cellular tissues and inflammatory microenvironments present significant challenges for consistent staining and accurate interpretation. These tissues often exhibit variable cellularity, extracellular matrix density, and inflammatory infiltrates that impede uniform dye penetration and binding, potentially obscuring critical apoptotic morphologies such as cell shrinkage, chromatin condensation, and apoptotic body formation. This application note provides validated protocols and analytical frameworks to overcome these barriers, ensuring reliable apoptosis detection in complex tissue contexts for research and drug development applications.
Quantitative Staining Assessment in Pathological Tissues
Standardized quantification of H&E staining is essential for validating staining quality, particularly when analyzing apoptotic indices in challenging tissues. Research demonstrates that quantitative assessment can distinguish subtle morphological differences with high sensitivity and specificity, as shown in comparative studies of endometrioma versus ovarian carcinoma tissues.
Table 1: Flow Cytometric Analysis of Apoptotic and Cell Cycle Markers in Tissue Samples
| Parameter | Endometrioma Group | Ovarian Carcinoma Group | Statistical Significance | Biological Interpretation |
|---|---|---|---|---|
| Annexin V Apoptotic Index | Statistically significantly lower [67] | Statistically significantly higher [67] | p < 0.05 | Reduced apoptosis in endometriosis |
| G0/G1 Phase Cell Ratio | Higher [67] | Lower [67] | p < 0.05 | Increased quiescent cell population |
| G2/M Stage Cell Ratio | Statistically significantly lower [67] | Statistically significantly higher [67] | p < 0.05 | Reduced mitotic activity |
| S-Phase Fraction | Statistically significantly lower [67] | Statistically significantly higher [67] | p < 0.05 | Reduced DNA synthesis |
| Proliferative Index | Statistically significantly lower [67] | Statistically significantly higher [67] | p < 0.05 | Decreased overall proliferation |
| Aneuploidy Cell Ratio | Statistically significantly lower [67] | Statistically significantly higher [67] | p < 0.05 | Reduced chromosomal abnormalities |
| Diagnostic Cutoff Value | Cases below 16.05% apoptotic index [67] | Cases above 16.05% apoptotic index [67] | 94.3% sensitivity, 80% specificity [67] | Flow cytometric differentiation potential |
The annexin V apoptotic index shows particular utility as a differential diagnostic marker, with a cutoff value of 16.05% demonstrating high sensitivity (94.3%) and specificity (80%) for distinguishing endometrioma from ovarian carcinoma [67]. This quantitative approach enables researchers to standardize apoptosis assessment across variable tissue densities.
Optimized H&E Staining Protocol for Challenging Tissues
The following protocol has been optimized for dense and inflamed tissues where standard staining often yields suboptimal results due to impeded dye penetration and non-specific background.
Materials and Reagents
Table 2: Essential Research Reagent Solutions for H&E Staining
| Reagent/Category | Specific Examples & Specifications | Function in Protocol | Considerations for Dense/Inflammatory Tissues |
|---|---|---|---|
| Hematoxylin | Harris Alum Hematoxylin, Mayer's Hematoxylin [68] [69] | Nuclear staining: binds to basophilic structures (DNA/RNA) | Increased concentration or time may be needed for dense cellular areas |
| Eosin | Alcoholic Eosin, Eosin Y 1% aqueous [68] [69] | Cytoplasmic staining: binds to eosinophilic proteins (cytoplasm, collagen) | Alcoholic versions improve penetration in dense matrices |
| Differentiation Solution | 1% Acid Alcohol (70% alcohol + HCl) [68] | Removes excess hematoxylin non-specifically bound to tissue | Critical for reducing background in inflamed tissues with high cellularity |
| Bluing Agent | 0.2% Ammonia Water, 0.3% Lithium Carbonate [68] [69] | Alkalinization to convert hematoxylin to blue color | Enhances nuclear contrast in inflammatory infiltrates |
| Dehydration Series | Ethanol series (80%, 95%, 100%), Xylene [68] | Tissue dehydration and clearing | Proper execution essential for dense tissue morphology preservation |
| Mounting Medium | Xylene-based medium [68], DPX mountant [42] | Permanent preservation of stained sections | Ensures optical clarity for high-resolution imaging |
Step-by-Step Protocol
Slide Preparation:
- Deparaffinization and Hydration:
Nuclear Staining:
Differentiation (Critical Step):
- Dip slides in 1% acid alcohol for two quick dips to decolorize [68]
- For inflamed tissues: Limit to 1-2 dips maximum to prevent over-differentiation while reducing background
Bluing:
Cytoplasmic Counterstaining:
Final Dehydration and Clearing:
Mounting:
- Mount coverslips with xylene-based medium [68]
Quality Control and Stain Quantification
Implement quantitative quality control using stain assessment slides with biopolymer films that provide objective measurement of stain uptake [42]. These slides demonstrate linear increases in stain uptake with duration for both hematoxylin (r=0.99) and eosin (r=0.99), comparable to human liver tissue samples [42]. Regular use enables standardization across experiments and operators, particularly valuable for multi-center drug development studies.
Advanced Techniques for Apoptosis Detection in Complex Environments
Integrated Detection Methodologies
While H&E staining reveals characteristic apoptotic morphology (cell shrinkage, nuclear condensation), combining it with complementary techniques enhances detection specificity in dense and inflamed tissues:
Annexin V Staining: Detects phosphatidylserine externalization on cell surfaces using flow cytometry. In ovarian tissue studies, annexin V shows positive correlation with G2/M cell ratio and S-phase fraction while demonstrating negative correlation with G0/G1 levels [67].
TUNEL Assay: Identifies DNA fragmentation in apoptotic cells. Successfully applied in liver transplantation research to demonstrate hyperbaric oxygen therapy's antiapoptotic effects, reducing apoptotic indices in cold-stored tissues [54].
Caspase Immunohistochemistry: Detects activation of executioner caspases (3, 6, 7) central to apoptotic pathways [17].
Troubleshooting Workflow for Suboptimal Staining
The following workflow addresses common challenges in dense and inflamed tissue staining:
Research Applications and Experimental Workflows
The integration of optimized H&E staining with apoptosis detection methodologies enables robust analysis across diverse research contexts, from cancer biology to transplantation research.
Optimized H&E staining protocols, combined with rigorous quality control and complementary apoptosis detection methods, provide researchers with powerful tools for investigating cell death mechanisms in biologically complex tissues. The standardized approaches detailed in this application note address the specific challenges of dense and inflammatory microenvironments, enabling more reproducible and quantifiable apoptosis research. For drug development professionals, these methodologies offer enhanced capability to evaluate therapeutic efficacy and mechanism of action across diverse tissue contexts, from solid tumors to inflammatory diseases.
The detection of programmed cell death, or apoptosis, is a critical component of research in oncology, toxicology, and drug development. For decades, the hematoxylin and eosin (H&E) staining protocol has served as the foundational technique in histopathology for visualizing cellular and tissue structure. Hematoxylin stains nuclear components blue, revealing chromatin patterns and nuclear detail, while eosin counterstains cytoplasmic and extracellular elements pink, providing contrast and architectural context [5]. This staining method offers a reliable, cost-effective, and technically straightforward approach for initial tissue assessment, allowing pathologists and researchers to observe basic morphological changes associated with cell death [26].
Within the context of apoptosis detection, H&E staining targets the late morphological manifestations of the cell death process. When functioning optimally, it enables the identification of characteristic features such as cell shrinkage, cytoplasmic condensation, nuclear fragmentation (karyorrhexis), and the formation of apoptotic bodies [26] [65]. These hallmarks represent the final, irreversible stages of the apoptotic cascade. Consequently, H&E staining has been traditionally regarded as a "gold standard" for validating new apoptosis detection techniques, as it confirms the presence of these definitive structural alterations [70]. Its enduring role in the histology laboratory provides an essential baseline against which more specific molecular methods are often compared. However, this reliance on late-stage morphological changes also forms the basis of its significant limitations, particularly for researchers and drug development professionals requiring high sensitivity and early detection capabilities.
Key Limitations of H&E Staining in Apoptosis Research
Despite its widespread use, H&E staining possesses several intrinsic limitations that can impede accurate and early detection of apoptosis, especially in sophisticated research and drug development settings.
Inability to Detect Early Apoptotic Events
The most significant drawback of H&E staining is its incapacity to identify cells in the initial phases of apoptosis. The staining protocol relies entirely on visible structural disintegration, which occurs only after the execution of complex biochemical pathways. Early biochemical events, such as phosphatidylserine externalization, caspase activation, and initial DNA fragmentation, are completely invisible under standard H&E examination [70]. By the time a cell displays the characteristic condensed cytoplasm and pyknotic nucleus visible with H&E, it has already progressed to a late stage of the death program. This creates a substantial detection lag, limiting the technique's utility for studies focused on the early initiation of cell death or the kinetics of apoptotic progression.
Low Sensitivity and High Potential for Underestimation
Comparative studies have consistently demonstrated that H&E staining suffers from low sensitivity, leading to a significant underestimation of the true apoptotic rate. Research indicates that quantification based solely on H&E morphology may underestimate apoptosis by two-fold to three-fold compared to more specific methods like immunohistochemistry for active caspase-3 or TUNEL assays [70] [41]. This low sensitivity stems from the brief window of time in which a cell displays the classic morphological changes before it is phagocytosed or shed. Furthermore, apoptotic cells can be rapidly cleared from a tissue site, making them easy to miss in a static H&E section.
Subjectivity and Challenges in Differentiation
The identification of apoptotic cells via H&E staining is highly subjective and prone to inter-observer variability. Distinguishing a truly apoptotic cell from a necrotic cell, a mitotic figure, or an artifact requires significant expertise [65] [71]. Necrosis, characterized by cell swelling and inflammation, can sometimes present with overlapping features, such as pyknosis, making definitive diagnosis challenging [65] [17]. This lack of specificity can introduce substantial inconsistency and bias into experimental data, particularly in multi-center trials or studies involving multiple pathologists. The problem is compounded in tissues with high cellular density or inherent hyperchromasia, where subtle nuclear changes are easily overlooked.
Table 1: Key Limitations of H&E Staining for Apoptosis Detection
| Limitation | Technical Basis | Impact on Research Data |
|---|---|---|
| Late-Stage Detection | Relies on late morphological changes (e.g., karyorrhexis); early biochemical events (e.g., caspase activation) are invisible. | Misses early apoptotic events; provides inaccurate data on the kinetics and initiation of cell death. |
| Low Sensitivity | The morphological window is brief; cells are quickly cleared. | Leads to a 2-3 fold underestimation of the Apoptotic Index (AI); fails to detect low levels of apoptosis. |
| Subjectivity & Poor Specificity | Difficulty in distinguishing apoptosis from necrosis, mitosis, or cellular artifacts based on morphology alone. | Introduces inter-observer variability and bias; reduces reproducibility and reliability of quantitative data. |
| Lack of Molecular Specificity | Cannot identify specific protein biomarkers (e.g., cleaved caspases, phosphorylated proteins). | Unable to elucidate the specific apoptotic pathway (intrinsic vs. extrinsic) activated by an experimental drug or toxin. |
The following diagram illustrates the detection timeline of apoptosis, highlighting the "blind spot" of H&E staining during the critical early phases of the process.
Figure 1: The Apoptosis Detection Timeline. H&E staining is only capable of identifying cells in the late stages of apoptosis, creating a significant "blind spot" for early biochemical events that can be detected by other methods like IHC or TUNEL.
Superior Detection Methods: Protocols and Applications
To overcome the constraints of H&E staining, researchers routinely employ more specific and sensitive techniques. The table below provides a comparative overview of these advanced methods, which can be used to complement or surpass H&E-based analysis.
Table 2: Comparison of Advanced Apoptosis Detection Methods
| Method | Principle / Target | Key Advantage | Key Disadvantage |
|---|---|---|---|
| Immunohistochemistry (IHC) | Antibody-based detection of specific apoptotic biomarkers (e.g., active caspase-3, cleaved PARP). | High specificity; identifies biochemical events before morphological changes; pathway-specific. | Requires specific, validated antibodies; optimization can be time-consuming; cost. |
| TUNEL Assay | Labels DNA strand breaks (3'-OH ends) via terminal transferase (TdT). | Detects mid-to-late stage apoptosis; widely used; can be very sensitive. | Prone to false positives from necrosis or DNA repair; highly dependent on fixation and protocol optimization [71] [41]. |
| Methyl Green-Pyronin (MGP) | Histochemical stain: Methyl green (DNA, green) and Pyronin (RNA, red). | Cost-effective; clearer visualization of apoptotic cells (dense green nuclei, red cytoplasm) vs. H&E [26]. | Less specific than IHC; not a biomarker-specific method. |
| In Situ Oligo Ligation (ISOL) | Ligates oligonucleotides to double-stranded DNA breaks with 5' overhangs. | Higher specificity for apoptosis-associated DNA breaks than TUNEL; less labeling of necrotic cells. | Less commonly used; requires specialized reagents. |
Detailed Protocol: Immunohistochemistry for Active Caspase-3
The detection of active caspase-3 is a highly specific method for identifying cells committed to apoptosis, as this protease is a key "executioner" caspase in the pathway [70].
Materials:
- Primary Antibody: Rabbit monoclonal anti-active caspase-3 antibody
- Detection System: HRP-labeled polymer conjugated to secondary anti-rabbit antibodies
- Antigen Retrieval Buffer: Citrate buffer (10mM, pH 6.0)
- Chromogen: 3,3'-Diaminobenzidine (DAB)
- Counterstain: Mayer's Hematoxylin
- Blocking Solution: Normal goat serum and hydrogen peroxide-methanol
Methodology:
- Dewaxing and Rehydration: Deparaffinize formalin-fixed, paraffin-embedded (FFPE) tissue sections (4-5 µm) through xylene and a graded ethanol series to distilled water [5].
- Antigen Retrieval: Perform heat-induced epitope retrieval by microwaving slides in citrate buffer (pH 6.0) for 9-20 minutes. Allow slides to cool in the buffer.
- Endogenous Peroxidase Blocking: Incubate sections with 3% hydrogen peroxide in methanol for 15 minutes at room temperature to quench endogenous peroxidase activity [71].
- Protein Blocking: Incubate with a protein block (e.g., 10% normal goat serum) for 10-20 minutes to reduce non-specific background staining.
- Primary Antibody Incubation: Apply the anti-active caspase-3 antibody at the predetermined optimal dilution. Incubate in a humidified chamber for 60 minutes at room temperature or overnight at 4°C.
- Polymer Detection: Apply the HRP-labeled polymer secondary reagent for 30 minutes at room temperature.
- Chromogen Development: Visualize the signal by incubating with DAB substrate for 5-10 minutes, monitoring development under a microscope.
- Counterstaining and Mounting: Counterstain lightly with Mayer's Hematoxylin, blue the sections, dehydrate through graded alcohols, clear in xylene, and mount with a synthetic resin [71] [5].
Interpretation: Cells undergoing apoptosis will display a brown, granular DAB precipitate indicative of active caspase-3, localized in the cytoplasm. The nuclei will be stained blue with hematoxylin. The Apoptotic Index (AI) is calculated as: (Number of caspase-3 positive cells / Total number of cells counted) × 100.
Detailed Protocol: Methyl Green-Pyronin (MGP) Staining
MGP is a histochemical stain that provides a more cost-effective and clearer alternative to H&E for morphological identification of apoptosis [26].
Materials:
- Methyl Green Solution: Aqueous, pre-purified to remove methyl violet.
- Pyronin Y Solution: Aqueous.
- Working MGP Stain: Prepared as per manufacturer's specifications (e.g., Sigma-Aldrich).
Methodology:
- Section Preparation: Dewax and hydrate FFPE tissue sections to distilled water as described in the H&E protocol [26] [5].
- Staining: Immerse slides in working MGP stain for a predetermined time (e.g., 10-30 minutes).
- Rinsing: Rinse briefly in distilled water.
- Differentiation and Bluing: Differentiate in absolute acetone briefly, then transfer through acetone/xylene mixtures before clearing in pure xylene.
- Mounting: Coverslip using a permanent mounting medium.
Interpretation:
- Non-apoptotic Cell Nuclei: Light green-blue.
- Apoptotic Cell Nuclei: Dense, dark green due to chromatin condensation and pyknosis.
- Cytoplasm and Nucleoli: Pink-red due to Pyronin binding to RNA [26].
The high contrast provided by MGP makes apoptotic cells more readily distinguishable from viable cells compared to H&E, improving the accuracy and confidence of morphological identification and counting.
The Scientist's Toolkit: Essential Research Reagent Solutions
Successful apoptosis detection relies on a suite of specific reagents and tools. The following table details key solutions for the protocols featured in this note.
Table 3: Research Reagent Solutions for Apoptosis Detection
| Reagent / Kit | Function / Principle | Application Context |
|---|---|---|
| Anti-active Caspase-3 IHC Antibody | Binds specifically to the cleaved, active form of caspase-3, a central executioner protease in apoptosis. | Specific and reliable detection of mid-stage apoptotic cells via IHC; superior to H&E for early commitment detection. |
| Apoptag Plus Peroxidase Kit (TUNEL) | Utilizes Terminal deoxynucleotidyl Transferase (TdT) to label DNA strand breaks for peroxidase-based detection. | In situ detection of apoptotic DNA fragmentation; requires careful optimization of proteinase K concentration to minimize false positives [41]. |
| Methyl Green-Pyronin (MGP) Stain | Differentiates nucleic acids: DNA (green) and RNA (red). | A cost-effective histochemical stain that provides clearer visualization of apoptotic nuclei compared to standard H&E [26]. |
| Proteinase K | A serine protease used for antigen retrieval by digesting proteins and unmasking epitopes in FFPE tissues. | Critical pre-treatment step for TUNEL and some IHC protocols; concentration and time must be optimized (e.g., 25 µg/mL for 20 min) [41]. |
| Mayer's Hematoxylin | A progressive alum hematoxylin used as a nuclear counterstain. | Provides contrast in IHC and special stains; does not require differentiation, making it simple and consistent to use [5]. |
Integrated Workflow for Robust Apoptosis Analysis
To achieve the most accurate and comprehensive analysis of apoptosis in research, an integrated approach that combines H&E staining with more specific techniques is highly recommended. The following diagram outlines a logical workflow for such an analysis.
Figure 2: A recommended workflow for apoptosis analysis in research. This integrated approach uses H&E for initial screening but leverages specific methods like IHC or TUNEL for confirmation and deeper investigation, mitigating the limitations of H&E alone.
This workflow begins with a standard H&E stain to provide an overview of tissue architecture and to identify obvious, late-stage apoptotic figures. If the research question involves quantifying high levels of clear-cut apoptosis, this may be sufficient. However, if the goal is to investigate subtle, early, or low-frequency events, the workflow directs the researcher to select a more appropriate method. The choice between IHC and DNA break detection (like TUNEL) depends on the need for pathway specificity. IHC for a marker like active caspase-3 provides mechanistic insight, while TUNEL offers broader detection of cells with DNA fragmentation. The final step involves correlating findings from all techniques to build a robust and conclusive dataset.
H&E staining remains an indispensable first step in histopathological examination, providing valuable contextual information about tissue morphology. However, its role in modern apoptosis research is necessarily limited. Its fundamental constraints—inability to detect early biochemical events, low sensitivity leading to significant underestimation, and a lack of molecular specificity—render it inadequate as a standalone technique for rigorous scientific investigation. For researchers and drug development professionals, reliance on H&E alone risks generating incomplete or misleading data on the efficacy of therapeutic agents designed to modulate cell death pathways.
A prudent and effective strategy involves using H&E as an initial screening tool, followed by confirmation and detailed analysis with more specific methods such as immunohistochemistry for active caspase-3 or, where appropriate, optimized TUNEL or MGP staining. This multi-modal approach leverages the strengths of each technique while mitigating their individual weaknesses, ensuring a comprehensive, accurate, and quantifiable assessment of apoptosis that is essential for robust and reproducible research outcomes.
In the context of apoptosis detection research, consistent and reproducible Hematoxylin and Eosin (H&E) staining is not merely desirable—it is scientifically essential. Staining variation is widely observed in practice, both within and between laboratories, posing a significant challenge for quantitative histological analysis [42]. While the human visual system can compensate for some stain variation, the growth of digital imaging and artificial intelligence in pathology has magnified the impact of this variation [42]. For researchers investigating subtle morphological features of apoptosis—such as cytoplasmic condensation, chromatin condensation, and apoptotic body formation—stain consistency directly impacts the reliability and validity of their findings. Professional guidelines emphasize the need to maintain stain quality, yet routine quantitative assessment of H&E staining has historically been unachievable [42]. This application note establishes a comprehensive quality control framework to address this challenge, providing researchers with standardized methodologies for ensuring stain consistency in apoptosis studies.
Quantitative Stain Assessment Methodologies
Digital Image Analysis for Objective Quantification
The transition from subjective assessment to quantitative measurement represents the cornerstone of modern staining quality control. Digital pathology enables objective quantification of stain through color analysis, which can augment traditional expert assessment [43]. One validated approach involves utilizing image analysis by optical density (OD) to evaluate changes in H&E staining quality. This method tracks staining intensity in both nuclear and cytoplasmic components across multiple tissue types, providing quantitative data on stain performance over time and with reagent usage [72]. Studies using this approach have demonstrated a measurable decrease in eosin stain intensity by OD with reagent overuse, with variation in degree by tissue type and reagent vendor [72].
International studies have employed color deconvolution and color difference determination (ΔE) to quantitatively analyze stain variation across hundreds of laboratories. This hybrid analysis combining expert assessment with objective data has revealed that approximately 60% of laboratories produce stains within a color difference (ΔE) of 2 from the mean, which is considered only perceptible through close observation [43]. While correlation between H&E intensity and expert assessor scores has proven complex, the H&E intensity ratio indicates a trend with assessor score, suggesting an optimal stain relationship exists and should be investigated further [43].
Novel Quantitative Controls: Stain Assessment Slides
Beyond digital analysis of tissue sections, innovative control materials have been developed for absolute quantification of H&E staining in the laboratory environment. Stain assessment slides comprise a biopolymer film applied to standard pathology glass slides, creating a highly stain-receptive surface due to its hydrophilicity and porous structure [42]. This methodology offers significant advantages for apoptosis research, where subtle staining variations could impact the identification of characteristic nuclear changes.
Research characterization of these stain assessment slides has demonstrated:
- Linear stain uptake with increasing duration of H&E staining (r = 0.99)
- Linearly comparable staining to human liver tissue samples (r values 0.98–0.99)
- Effective quantification of intra- and inter-instrument variation across multiple time points [42]
Table 1: Quantitative Methods for H&E Stain Quality Assessment
| Method | Principle | Applications | Key Advantages |
|---|---|---|---|
| Optical Density (OD) Measurement | Measures light absorption by stain at specific wavelengths | Tracking reagent performance over time; quantifying intensity variation | Objective, reproducible; compatible with automated analysis |
| Color Deconvolution & ΔE Analysis | Separates H&E components digitally; calculates color difference from reference | Inter-laboratory standardization; quality assurance programs | Detects subtle variations imperceptible to human eye |
| Stain Assessment Slides | Biopolymer film with consistent staining properties | Instrument performance monitoring; daily quality control | Not affected by tissue heterogeneity; provides absolute quantification |
Core H&E Staining Protocol for Apoptosis Research
Standardized Staining Procedure
A consistent, well-documented staining protocol forms the foundation for reproducible apoptosis detection. The following regressive H&E staining protocol provides an excellent balance of nuclear and cytoplasmic detail necessary for identifying apoptotic cells [5]:
- Dewaxing: Xylene (2 changes, 2 minutes each)
- Rehydration: 100% ethanol (2 changes, 2 minutes each) → 95% ethanol (2 minutes) → water wash (2 minutes)
- Nuclear Staining: Hematoxylin (3 minutes)
- Rinsing: Running tap water (1 minute)
- Differentiation: Mild acid differentiator (1 minute)
- Rinsing: Running tap water (1 minute)
- Bluing: Bluing solution (1 minute)
- Rinsing: Running tap water (1 minute)
- Cytoplasmic Staining: Eosin Y (45 seconds)
- Dehydration: 95% ethanol (1 minute) → 100% ethanol (2 changes, 1 minute each)
- Clearing: Xylene (2 changes, 2 minutes each)
- Coverslipping with compatible mounting medium [5]
This workflow can be visualized as follows:
Research Reagent Solutions
The selection and management of staining reagents directly impact result consistency. The following table details essential materials and their functions specific to apoptosis research:
Table 2: Key Research Reagent Solutions for H&E Staining in Apoptosis Studies
| Reagent | Function | Research-Specific Considerations |
|---|---|---|
| Hematoxylin (Mayer's, Harris, or Gill's) | Nuclear staining; highlights chromatin patterns | Critical for visualizing apoptotic nuclear condensation (pyknosis) and fragmentation (karyorrhexis) |
| Eosin Y | Cytoplasmic counterstain; demonstrates cell shrinkage | Enhances visualization of cytoplasmic condensation in apoptotic cells |
| Differentiator (acid alcohol) | Selective removal of excess hematoxylin | Over-differentiation may obscure early apoptotic nuclear changes |
| Bluing Solution | Converts hematoxylin from red to blue | Alkaline pH (e.g., Scott's Tap Water) required for proper nuclear color |
| Ethanol Gradients | Dehydration and preparation for eosin | Concentration affects eosin uptake and intensity |
| Xylene or Substitutes | Clearing agent for tissue transparency | Inadequate clearing compromises microscopic resolution of apoptotic bodies |
Quality Control Implementation Framework
Routine Monitoring and Troubleshooting
Implementing a systematic quality control program requires both preventive measures and responsive troubleshooting. Regular monitoring should include:
- Daily control slides: Process control tissue alongside experimental samples
- Reagent tracking: Log number of slides stained and expiration dates for all reagents
- Instrument calibration: Regular maintenance of automated stainers
- Digital monitoring: Periodic OD measurements to establish baselines and detect drift
Common staining challenges in apoptosis research and their solutions include:
- Weak hematoxylin staining: Can result from inadequate staining time, excessive differentiation, or exhausted hematoxylin; compromises nuclear detail critical for apoptosis identification [73] [74]
- Excessive eosin staining: May obscure nuclear details; caused by prolonged eosin time or dye concentration due to evaporation [73]
- Inconsistent staining across slides: Often related to inadequate deparaffinization, variable section thickness, or water contamination in alcohols [74]
Stain Validation for Apoptosis Detection
For apoptosis research specifically, stain validation should include:
- Comparison with established apoptosis markers: Correlate H&E morphology with TUNEL, caspase staining, or methyl green-pyronin in serial sections [26]
- Inter-observer consistency: Establish concordance between multiple researchers identifying apoptotic cells
- Tissue-specific optimization: Adjust protocols for different tissue types as apoptosis morphology varies by cell type
Research indicates that while H&E remains the gold standard for general morphological assessment, methyl green-pyronin staining may provide enhanced detection of apoptotic cells in some research contexts due to its specific nucleic acid staining properties [26].
Specialized Protocol for Apoptosis Detection
Enhanced Staining for Apoptotic Morphology
Detection of apoptotic cells via H&E relies on identifying characteristic morphological features: cell shrinkage, chromatin condensation (pyknosis), nuclear fragmentation (karyorrhexis), and formation of membrane-bound apoptotic bodies [41] [26]. The following protocol modifications enhance these features:
- Extended hematoxylin time: Increase to 5-7 minutes for enhanced nuclear contrast (adjust differentiation accordingly)
- Controlled differentiation: Use milder acid (e.g., acetic acid) for more precise control over nuclear staining
- Reduced eosin timing: 30 seconds to prevent overmasking of nuclear detail while maintaining cytoplasmic contrast
Complementary Staining for Apoptosis Confirmation
While H&E remains fundamental, research contexts often benefit from correlation with specialized stains and methods:
- Methyl Green-Pyronin (MGP): Provides distinct staining of DNA (green) and RNA (red), potentially enhancing apoptotic cell identification compared to H&E alone [26]
- TUNEL Assay: Directly labels DNA fragmentation but requires careful optimization and validation against H&E morphology to minimize false positives [41]
The pathway for integrating these methods can be visualized as:
Implementing rigorous quality control practices for H&E staining is particularly crucial in apoptosis research, where subtle morphological features form the basis of quantitative assessment. By adopting the quantitative assessment methods, standardized protocols, and reagent management practices outlined in this application note, researchers can achieve the staining consistency necessary for reliable, reproducible apoptosis detection and quantification. As digital pathology and artificial intelligence applications continue to grow in preclinical research, establishing these robust quality control foundations becomes increasingly imperative for scientific rigor and translational validity.
Beyond H&E: Validating Findings with Specialized Apoptosis Detection Methods
Apoptosis, or programmed cell death, is a genetically regulated process essential for tissue homeostasis, development, and the pathogenesis of various diseases. The accurate detection of apoptotic cells is therefore crucial in both research and diagnostic settings. While numerous techniques exist, they largely fall into two categories: those identifying morphological characteristics and those detecting biochemical hallmarks of apoptosis. This application note provides a detailed comparison of three established histological methods—Hematoxylin and Eosin (H&E) staining, the TUNEL assay, and Methyl Green-Pyronin (MGP) staining—framed within the context of apoptosis detection research. We evaluate these techniques based on their fundamental principles, sensitivity, specificity, and practical applicability, providing structured protocols and data to guide researchers and drug development professionals in selecting the optimal method for their specific needs.
The following diagram outlines the core biochemical events of apoptosis and the corresponding detection points for each method discussed in this note.
Methodologies and Principles
Hematoxylin and Eosin (H&E) Staining
H&E staining is the cornerstone of histological examination, providing a comprehensive view of cellular and tissue structure. Its application in apoptosis research relies on the identification of characteristic morphological changes in dying cells. The hematoxylin component, which stains nucleic acids, reveals nuclear condensation (pyknosis) and fragmentation (karyorrhexis), while eosin, which stains cytoplasmic proteins, highlights cytoplasmic eosinophilia and cell shrinkage. This stain demonstrates a broad range of cytoplasmic, nuclear, and extracellular matrix features, making it the preferred choice for routine diagnosis by pathologists [5]. However, the detection of apoptosis with H&E requires significant expertise, as these morphological features can be subtle and open to subjective interpretation. Furthermore, H&E staining is considered less sensitive for detecting early apoptotic events compared to methods that specifically label biochemical markers [26].
Detailed H&E Staining Protocol for Apoptosis Research
The following protocol is a standard regressive H&E staining procedure suitable for paraffin-embedded tissue sections, ensuring clear nuclear and cytoplasmic detail [5].
Dewaxing and Hydration:
- Xylene: 2 minutes
- Xylene: 2 minutes
- 100% ethanol: 2 minutes
- 100% ethanol: 2 minutes
- 95% ethanol: 2 minutes
- Rinse in distilled water: 2 minutes
Nuclear Staining:
- Hematoxylin: 3 minutes
- Rinse in running tap water: 1 minute
Differentiation and Bluing:
- Differentiator (mild acid): 1 minute
- Rinse in water: 1 minute
- Bluing reagent (e.g., Scott's Tap Water): 1 minute
- Rinse in water: 1 minute
Cytoplasmic Staining:
- 95% ethanol: 1 minute
- Eosin: 45 seconds
Dehydration and Clearing:
- 95% ethanol: 1 minute
- 100% ethanol: 1 minute
- 100% ethanol: 1 minute
- Xylene: 2 minutes
- Xylene: 2 minutes
Mounting:
- Coverslip using a permanent mounting medium.
Troubleshooting Note: The balance between hematoxylin and eosin is critical. Overstaining with hematoxylin can create the illusion of understained eosin, and vice versa. When optimizing, adjust the timing of only one component at a time [5].
TUNEL Assay
The Terminal deoxynucleotidyl transferase dUTP Nick End Labeling (TUNEL) assay is the most widely used method for the in situ detection of DNA fragmentation, a hallmark biochemical event of late-stage apoptosis [75] [76]. The principle relies on the enzyme Terminal deoxynucleotidyl Transferase (TdT), which catalyzes the attachment of modified deoxynucleotides (dUTP) to the 3'-hydroxyl termini of fragmented DNA. These incorporated nucleotides are tagged with a label (e.g., a fluorophore or hapten) for detection. Modern kits, such as the Click-iT TUNEL assay, utilize advanced chemistry like bio-orthogonal click reactions, which offer improved sensitivity and speed due to the smaller size of the detection azide compared to an antibody, allowing for better tissue penetration [75]. A survey of recent literature indicates that 50% of published TUNEL data uses dUTP directly conjugated to FITC, while other popular methods employ biotin-dUTP or BrdU-based detection [76].
Detailed TUNEL Assay Protocol for Cells on Coverslips
This protocol, adapted from manufacturer instructions, is optimized for adherent cells and can be completed within several hours [75].
Cell Fixation and Permeabilization:
- Wash coverslips once with 1X PBS.
- Fix cells with 4% paraformaldehyde in PBS for 15 minutes at room temperature (RT).
- Remove fixative and permeabilize cells with 0.25% Triton X-100 in PBS for 20 minutes at RT.
- Wash twice with deionized water.
Positive Control Preparation (Optional):
- Treat control coverslips with DNase I solution (e.g., 100 µL per coverslip) for 30 minutes at RT to intentionally generate DNA strand breaks.
- Wash once with deionized water.
TdT Labeling Reaction:
- Prepare the TUNEL reaction mixture according to kit specifications. For a typical 55 µL reaction:
- Labeling Solution: 25 µL
- Dilution Buffer: 25 µL
- TdT Enzyme: 5 µL
- Incubate coverslips with the reaction mixture for 2 hours at 37°C in a humidified chamber, protected from light.
- Prepare the TUNEL reaction mixture according to kit specifications. For a typical 55 µL reaction:
Detection and Washing:
- Wash the coverslips three times with 1X PBS or PBST for 10 minutes each.
Counterstaining and Mounting:
- Counterstain nuclei with Hoechst 33342 (or DAPI) according to manufacturer's instructions.
- Mount coverslips onto slides using an antifade mounting medium.
Visualization: Analyze slides using fluorescence or confocal microscopy. TUNEL-positive (apoptotic) nuclei will fluoresce with the specific color of the conjugated dye (e.g., green for FITC, red for TMR).
Methyl Green-Pyronin (MGP) Staining
Methyl Green-Pyronin staining is a histochemical technique that provides a simple and cost-effective method for detecting apoptotic cells by leveraging specific nucleic acid interactions [26]. Methyl green binds selectively to double-stranded DNA, staining nuclei a bluish-green, while pyronin Y is specific for single-stranded RNA and single-stranded regions of DNA, staining the nucleoli and rough endoplasmic reticulum red. In apoptotic cells, nuclear DNA undergoes condensation and fragmentation, which alters its staining properties. The pyknotic, fragmented nuclei of apoptotic cells exhibit dense, intense staining with methyl green, and the cytoplasm may also show dense red pyronin staining, making them easily distinguishable from surrounding healthy cells under light microscopy [26]. This distinct color contrast offers an advantage over H&E for specifically identifying apoptotic bodies.
Detailed Methyl Green-Pyronin (MGP) Staining Protocol
The following procedure is performed on deparaffinized and rehydrated tissue sections [26].
Staining:
- Immerse the slides in a working Methyl Green-Pyronin solution for a duration optimized for the specific batch of stain (typically 10-30 minutes).
Rinsing and Differentiation:
- Rinse the slides briefly in distilled water.
- Differentiate by blotting the slides with clean, absorbent paper.
Dehydration and Clearing:
- Rapidly dehydrate the sections through a series of absolute acetone (2 changes), followed by acetone-xylene (1:1 mixture), and finally two changes of pure xylene. Each step should be brief (a few seconds each).
Mounting:
- Coverslip using a synthetic resin-based mounting medium.
Interpretation: Under light microscopy, normal nuclei appear green, nucleoli and cytoplasm appear red/pink, and apoptotic cells are characterized by intensely stained, dense green pyknotic nuclei.
Comparative Analysis
Technical and Performance Comparison
The choice between H&E, TUNEL, and MGP staining depends heavily on the research question, required sensitivity, available resources, and technical expertise. The following table provides a direct comparison of their key characteristics, synthesizing data from the provided search results.
Table 1: Technical Comparison of Apoptosis Detection Methods
| Feature | H&E Staining | TUNEL Assay | Methyl Green-Pyronin (MGP) |
|---|---|---|---|
| Detection Principle | Morphological changes (pyknosis, karyorrhexis) [26] | Biochemical DNA fragmentation (3'-OH ends) [75] [76] | Histochemical; altered nucleic acid staining [26] |
| Primary Application | Routine histology, initial pathology assessment [5] | Specific, sensitive detection of apoptosis in research [75] [77] | Cost-effective apoptosis detection in basic labs [26] |
| Sensitivity | Low to Moderate (subjective) | High [75] | Moderate to High [26] |
| Specificity for Apoptosis | Low (cannot differentiate from necrosis early on) | High, but can label some necrotic cells [76] | Moderate (based on distinct morphology) [26] |
| Complexity & Time | Simple and fast (~30-45 min protocol) [5] | Complex, multi-step; ~2.5-3 hours [75] | Simple and fast (comparable to H&E) [26] |
| Cost | Low | High (commercial kits) [26] | Low [26] |
| Key Advantage | Provides overall tissue architecture context | Objective, high-sensitivity quantification | Clear visual distinction of apoptotic bodies at low cost |
| Key Disadvantage | Subjective, low sensitivity for early apoptosis | Expensive, requires specific equipment (fluorescence microscope) | Less widely used and validated than TUNEL |
Performance and Efficacy Data
Empirical studies directly comparing these methods provide valuable insights into their relative performance. A 2016 study investigating apoptosis in gingival epithelium offers quantitative data comparing H&E and MGP, while other sources provide context for the performance of the TUNEL assay.
Table 2: Comparative Performance Data from Experimental Studies
| Method & Context | Key Finding / Apoptotic Index (AI) | Reference |
|---|---|---|
| MGP vs. H&E (Gingival Epithelium) | Apoptotic cells were "easily distinguishable" in MGP stains compared to H&E. The difference in clarity was statistically significant (P < 0.05). | [26] |
| TUNEL Assay (HeLa Cells) | The Click-iT TUNEL assay (using alkyne-dUTP) detected a higher percentage of apoptotic cells under identical conditions compared to a traditional fluorescein-dUTP assay. | [75] |
| TUNEL Scoring (NEC Rat Model) | The TUNEL-based apoptosis score was significantly higher (p < 0.001) in both preterm and full-term NEC groups compared to their respective control groups. | [78] |
The following workflow diagram integrates these three methods into a cohesive strategic approach for apoptosis detection in research.
The Scientist's Toolkit: Essential Research Reagents
Successful execution of these apoptosis detection assays requires specific reagents and kits. The following table details essential materials, their functions, and examples from commercial sources as identified in the search results.
Table 3: Key Research Reagent Solutions for Apoptosis Detection
| Reagent / Kit | Primary Function | Example Product / Component |
|---|---|---|
| Alum Hematoxylins (e.g., Harris, Gill's) | Nuclear staining; demonstrates chromatin patterns and pyknosis in apoptosis [5]. | Harris Hematoxylin (alcohol-based), Gill's Hematoxylin (water/ethylene glycol-based) [5]. |
| Eosin Y | Cytoplasmic counterstain; highlights eosinophilia in apoptotic cytoplasm [5]. | Eosin Y, sometimes supplemented with Phloxine for enhanced reds [5]. |
| Click-iT TUNEL Assay | Sensitive detection of DNA fragmentation via click chemistry; uses alkyne-modified dUTP and Alexa Fluor azides [75]. | Components include TdT reaction buffer, EdUTP nucleotide mix, recombinant TdT, Click-iT reaction buffer with azide [75]. |
| In Situ Cell Death Detection Kit | Fluorescent (e.g., TMR red) end-labeling of DNA strand breaks for TUNEL assay. | From Roche; includes TUNEL dilution buffer, enzyme solution, and labeling solution [77]. |
| Methyl Green-Pyronin Stain | Histochemical differentiation of DNA (green) and RNA (red); highlights condensed DNA in apoptotic bodies [26]. | Available as prepared stain or separate components from suppliers like Sigma-Aldrich [26]. |
| rTdT Enzyme | The core enzyme for catalyzing the addition of modified nucleotides to DNA breaks in TUNEL assay. | Recombinant Terminal Deoxynucleotidyl Transferase (rTdT) [79]. |
| DNase I | Used to generate intentional DNA strand breaks in positive control samples for TUNEL assay validation [75]. | Component provided in many TUNEL kits (e.g., Component G in Click-iT kit) [75]. |
In the landscape of apoptosis detection, H&E staining, the TUNEL assay, and Methyl Green-Pyronin staining each occupy a distinct and valuable niche. H&E remains the foundational tool for initial morphological assessment, providing irreplaceable context of tissue architecture. For studies demanding high sensitivity, specificity, and objective quantification of apoptotic cells, the TUNEL assay is the unequivocal gold standard. However, the search results and comparative data confirm that Methyl Green-Pyronin staining presents a compelling, cost-effective alternative for laboratories where resources are limited, offering superior visualization of apoptotic bodies compared to H&E without the need for complex instrumentation [26]. The optimal methodological choice is not a matter of identifying a single superior technique, but rather of aligning the strengths of each method with the specific goals, constraints, and context of the research or diagnostic inquiry.
Hematoxylin and Eosin (H&E) staining serves as the foundational technique for histological analysis, including the detection of apoptotic cells in research on cancer and drug development. While valued for its simplicity and cost-effectiveness, H&E staining possesses inherent limitations in sensitivity and specificity for definitively identifying programmed cell death. Relying solely on morphological assessment via H&E can lead to a significant underestimation of the apoptotic index, with studies suggesting it may miss over half of actual apoptotic events [41]. This application note provides a structured comparison of apoptosis detection methods and details protocols for H&E and essential confirmatory techniques, guiding researchers in selecting the appropriate methodology to ensure data accuracy and reliability.
Quantitative Comparison of Apoptosis Detection Methods
The table below summarizes the key characteristics, including relative sensitivity and specificity, of common techniques used for apoptosis detection.
- Table 1: Comparison of Apoptosis Detection Methodologies
| Method | Principle | Relative Sensitivity | Relative Specificity | Key Advantages | Key Limitations & Technical Pitfalls |
|---|---|---|---|---|---|
| H&E Staining | Morphological assessment of cell shrinkage, chromatin condensation, and karyorrhexis [26]. | Low (may underestimate by 2-3 fold [41]) | Moderate | Cost-effective; simple; provides tissue context [26]. | Subjective; difficult to distinguish from necrosis; requires experienced observer. |
| Methyl Green-Pyronin (MGP) | Histochemical stain: Methyl green binds DNA (green), Pyronin binds RNA (red) [26]. | Moderate | Moderate | Cost-effective; clearer visualization of apoptotic bodies vs. H&E [26]. | Less specific than TUNEL; not a confirmatory technique. |
| TUNEL (TdT dUTP Nick-End Labeling) | Enzymatic labeling of DNA strand breaks [41]. | High | Variable (Low if unoptimized) | Detects mid-late stage apoptosis; can be quantified [41]. | High false positives if unoptimized (e.g., from necrosis, fixation artifacts) [41]. |
| Virtual H&E Staining (AI) | Image-to-image translation of unstained tissues to H&E-like images using GAN models [80]. | Data Emerging | Data Emerging | Avoids hazardous chemicals; faster; preserves native tissue [80]. | Novel method; diagnostic equivalence still under validation [80]. |
Detailed Experimental Protocols
Protocol: H&E Staining for General Morphology and Apoptosis Screening
This standard protocol is used for initial tissue assessment and can hint at apoptotic cells based on morphology [5].
- Table 2: Research Reagent Solutions for H&E Staining
| Reagent / Solution | Function / Explanation |
|---|---|
| Harris Hematoxylin | An alum-based nuclear stain that complexes with DNA, staining nuclei blue [5]. |
| Eosin Y | An acidic cytoplasmic stain that binds proteins, staining cytoplasm and extracellular matrix pink [5]. |
| Acid Alcohol Differentiator | Selectively removes excess hematoxylin from the cytoplasm by breaking metal-dye complexes [5]. |
| Scott's Tap Water / Bluing Solution | A mildly alkaline solution that converts the red hematein-metal complex to a stable blue color [5]. |
| Ethanol Series (100%, 95%, 70%) | Used for dehydration (increasing concentrations) and rehydration (decreasing concentrations) of tissue sections. |
| Xylene | An organic clearing agent that renders dehydrated tissue transparent for mounting. |
Procedure:
- Dewaxing and Rehydration: Deparaffinize tissue sections (4 µm thick) in xylene (2 changes, 2 minutes each). Rehydrate through a descending ethanol series (100%, 100%, 95%, 2 minutes each) and rinse in distilled water [5].
- Nuclear Staining (Hematoxylin): Immerse slides in Harris hematoxylin for 3 minutes [5].
- Washing: Rinse slides gently under running tap water for 1 minute [5].
- Differentiation: Dip slides in acid alcohol (1% HCl in 70% ethanol) for 1-5 seconds to remove non-specific nuclear stain [5].
- Bluing: Immerse slides in a bluing solution (e.g., Scott's Tap Water) for 1 minute to achieve blue nuclear staining. Rinse with distilled water [5].
- Cytoplasmic Staining (Eosin): Stain slides in Eosin Y solution for 45 seconds to 2 minutes [5].
- Dehydration and Clearing: Dehydrate rapidly through an ascending ethanol series (95%, 100%, 100%, 1 minute each). Clear in xylene (2 changes, 2 minutes each) [5].
- Mounting: Coverslip using a permanent mounting medium [5].
Protocol: Methyl Green-Pyronin (MGP) Staining for Enhanced Apoptosis Visualization
MGP provides clearer distinction of apoptotic cells, with dense methyl green-staining of pyknotic nuclei and dense red pyronin staining in the cytoplasm, offering a cost-effective enhancement over H&E [26].
Procedure:
- Prepare Staining Solution: The MGP working solution contains methyl green (specific for DNA, staining nuclei green) and pyronin (specific for RNA, staining nucleoli and cytoplasm red) [26].
- Staining: After deparaffinization and rehydration, stain tissue sections with the MGP solution.
- Visualization and Analysis: Examine under light microscopy at 100x magnification. Apoptotic cells are identified by condensed, intensely green-stained (methyl green) pyknotic nuclei and dense red (pyronin) cytoplasmic staining [26].
Protocol: Confirmatory TUNEL Assay with Optimization Steps
The TUNEL assay is a highly sensitive confirmatory technique. This optimized protocol, based on the Apoptag Plus Peroxidase kit, is critical to minimize false positives, a common pitfall of commercial kits [41].
- Table 3: Key Research Reagents for Optimized TUNEL Assay
| Reagent / Solution | Function / Explanation |
|---|---|
| Proteinase K | Enzyme for antigen retrieval; concentration and time are critical for sensitivity and specificity [41]. |
| Terminal Deoxynucleotidyl Transferase (Tdt) Enzyme | Catalyzes the addition of labeled nucleotides to exposed 3'-OH ends of fragmented DNA [41]. |
| Anti-Digoxigenin Peroxidase Conjugate | Antibody that binds to digoxigenin-labeled nucleotides for enzymatic detection. |
| Diaminobenzidine (DAB) Substrate | Chromogen that produces an insoluble brown precipitate upon reaction with peroxidase. |
| Methyl Green Counterstain | Provides a light green nuclear counterstain for histological context [41]. |
Optimized Procedure [41]:
- Deparaffinization and Rehydration: Process slides through xylene and a graded ethanol series to distilled water.
- Quenching: Incubate slides in 3% hydrogen peroxide in methanol to quench endogenous peroxidase activity.
- Proteinase K Digestion (Critical Optimization Step): Treat slides with 25 µg/mL Proteinase K at 37°C for 20 minutes. Rinse.
- Equilibration: Apply equilibration buffer for 5 minutes.
- Tdt Enzyme Incubation (Critical Optimization Step): Prepare the Tdt reaction mix by diluting the Tdt enzyme 1:3.9 in reaction buffer. Apply to tissues and incubate in a humidified chamber at 37°C for 1 hour.
- Stop and Wash: Apply stop/wash buffer for 15 minutes.
- Conjugate Incubation (Critical Optimization Step): Apply anti-digoxigenin peroxidase conjugate and incubate at 37°C for 30 minutes.
- Detection: Develop with DAB substrate (1:20 dilution) for approximately 5-10 minutes. Monitor under a microscope.
- Counterstaining and Mounting: Counterstain lightly with methyl green, dehydrate, clear, and mount.
Visual Workflows for Method Selection and Staining Processes
The following diagrams outline the logical decision pathway for method selection and the key steps in the staining protocols.
- Figure 1: Method Selection Workflow
- Figure 2: H&E Staining Protocol
H&E staining remains an indispensable first step for apoptosis screening, providing valuable tissue context. However, its limitations in sensitivity necessitate a strategic approach to confirmation. For enhanced yet cost-effective morphological assessment, MGP staining is a valuable intermediate step. For definitive, high-sensitivity detection and quantification, particularly in critical drug development research, an optimized TUNEL assay is the recommended confirmatory technique. Researchers must be aware of the technical pitfalls, such as fixation artifacts and necrosis, that can compromise TUNEL specificity and adhere to rigorous optimization and validation protocols. The emerging field of virtual staining holds future promise for streamlining workflows, but currently requires further validation before replacing physical staining methods for primary apoptosis diagnosis.
The study of apoptosis is fundamental to cancer biology, neurodegenerative disease research, and drug discovery. While hematoxylin and eosin (H&E) staining provides a cornerstone for pathological analysis by revealing cellular morphology and tissue architecture, it offers only a static snapshot of cell death [33]. The emergence of fluorescent reporter systems for real-time caspase-3 detection addresses this critical limitation, enabling researchers to visualize the dynamics of apoptosis as it unfolds. Caspase-3, a key executioner protease, is pivotal in the execution phase of apoptosis, cleaving numerous cellular substrates to orchestrate the controlled dismantling of the cell [81] [82]. This Application Note details the implementation of a stable fluorescent reporter platform that provides high spatiotemporal resolution of caspase-3/-7 activity, bridging the gap between traditional endpoint histological analysis and dynamic functional assessment.
A Novel Reporter System for Real-Time Caspase Dynamics
Reporter Design and Mechanism of Action
The core of this innovative platform is a lentiviral-delivered, genetically encoded biosensor based on a split-green fluorescent protein (ZipGFP) architecture, co-expressed with a constitutive mCherry marker for cell presence [83].
- Split-GFP Mechanism: The GFP molecule is split into two fragments—β-strands 1–10 and the eleventh β-strand—tethered by a flexible linker containing a caspase-3/-7-specific DEVD cleavage motif [83].
- Fluorescence Activation: In the absence of caspase activity, the forced proximity of the β-strands prevents proper folding and chromophore maturation, resulting in minimal background fluorescence. Upon caspase-3/-7 activation during apoptosis, cleavage at the DEVD site separates the β-strands, allowing spontaneous refolding into the native GFP structure, which leads to efficient chromophore formation and a rapid, irreversible increase in GFP fluorescence [83].
- mCherry Co-Expression: The stable expression of mCherry serves as a marker for successful transduction and normalizes for cell presence, though its long half-life makes it unsuitable for real-time viability assessment following acute cell death [83].
This system provides a significant advantage over traditional antibody-based caspase detection methods, such as immunofluorescence, which require cell fixation and offer only a single time point measurement [84].
Experimental Validation of the Reporter System
The specificity and functionality of this caspase-3/-7 reporter have been rigorously validated across multiple dimensions:
- Pharmacological Induction and Inhibition: Treatment with apoptosis-inducing agents like carfilzomib or oxaliplatin triggered a robust, time-dependent increase in GFP fluorescence. This signal was effectively abrogated by co-treatment with the pan-caspase inhibitor Z-VAD-FMK, confirming the caspase-dependent nature of the reporter activation [83].
- Specificity for Caspase-3/-7: In caspase-3 deficient MCF-7 cells, treatment with carfilzomib still induced a significant GFP signal, demonstrating that caspase-7-mediated DEVD cleavage is sufficient for reporter activation and confirming specificity for these executioner caspases [83].
- Correlation with Apoptotic Markers: Western blot analysis confirmed the presence of cleaved PARP and cleaved caspase-3 in treated cells, while flow cytometric Annexin V/PI staining validated the induction of apoptosis, showing strong correlation with the fluorescent reporter signal [83].
Table 1: Key Characteristics of the Fluorescent Reporter System
| Feature | Description | Experimental Validation |
|---|---|---|
| Detection Target | Caspase-3 and Caspase-7 activity | Activated by carfilzomib; signal suppressed by Z-VAD-FMK [83] |
| Reporter Mechanism | Split-ZipGFP with DEVD cleavage motif | Fluorescence reconstitution upon caspase cleavage [83] |
| Signal Properties | Irreversible, time-accumulating, high signal-to-noise | Minimal background fluorescence; persistent signal post-activation [83] |
| Multiplexing Capability | Constitutive mCherry expression for cell presence | Serves as normalization control for cell number [83] |
| Model System Compatibility | 2D cultures, 3D spheroids, patient-derived organoids | Validated in HUVEC spheroids and PDAC organoids [83] |
Detailed Experimental Protocols
Protocol A: Generating Stable Reporter Cell Lines and 2D Live-Cell Imaging
This protocol enables real-time tracking of caspase dynamics in adherent cell cultures.
Materials (Research Reagent Solutions)
- Caspase-3/-7 Reporter Lentiviral Construct (ZipGFP-DEVD-mCherry)
- Target cells (e.g., HEK293, Hep G2, MiaPaCa-2)
- Appropriate cell culture medium and supplements
- Polybrene (for lentiviral transduction enhancement)
- Puromycin or other appropriate selection antibiotic
- Apoptosis-inducing agent (e.g., Carfilzomib, Staurosporine, Oxaliplatin)
- Pan-caspase inhibitor (e.g., Z-VAD-FMK) as control
- Live-cell imaging-compatible culture vessels (e.g., 96-well plates)
- Confocal or live-cell fluorescence microscope with environmental control (37°C, 5% CO₂)
Procedure
- Cell Culture: Seed target cells in standard growth medium and incubate until 50-70% confluent.
- Viral Transduction: Incubate cells with the reporter lentivirus in the presence of 8 µg/mL Polybrene for 24 hours.
- Selection: Replace medium with fresh culture medium containing puromycin (concentration to be determined based on cell line kill curve) to select for stably transduced cells. Maintain selection pressure for at least 1 week.
- Experimental Seeding: Seed stable reporter cells into a 96-well imaging plate at a density of 40,000 cells/well in complete medium. Incubate overnight at 37°C, 5% CO₂ [82].
- Treatment: Treat cells with the apoptotic inducer (e.g., Staurosporine, 0.1-1 µM) or vehicle control (DMSO). For inhibition controls, pre-treat with 20 µM Z-VAD-FMK for 1 hour prior to apoptotic inducer [83].
- Live-Cell Imaging:
- Place the culture plate in a live-cell imaging system maintaining 37°C and 5% CO₂.
- Acquire images for both GFP (caspase activity) and mCherry (cell presence) channels every 1-2 hours for 48-120 hours.
- Use a 10x or 20x objective for sufficient spatial resolution and field of view.
- Image and Data Analysis:
- Quantify the GFP and mCherry fluorescence intensity per well or per cell using image analysis software.
- Calculate the GFP/mCherry ratio to normalize for cell presence.
- Generate kinetic curves of caspase activation.
Protocol B: 3D Spheroid and Organoid Imaging
This protocol adapts the reporter system for more physiologically relevant 3D models.
Materials
- Stable caspase-3/-7 reporter cells (generated per Protocol A)
- Cultrex Basement Membrane Extract or Matrigel
- Appropriate organoid culture medium
- 3D imaging-compatible plates (e.g., glass-bottom plates)
Procedure
- 3D Model Generation:
- For spheroids: Embed reporter cells in Cultrex at a density of 5,000-10,000 cells/50 µL droplet. Plate droplets in a pre-warmed plate and allow to solidify for 30 minutes at 37°C before overlaying with culture medium [83].
- For patient-derived organoids (PDOs): Mix dissociated organoid cells with Cultrex and plate as above.
- Treatment and Imaging:
- After 3-5 days of growth, treat spheroids/organoids with apoptotic inducer added to the overlay medium.
- Image using a confocal microscope equipped with environmental control to obtain z-stacks through the 3D structure at regular intervals (e.g., every 4-6 hours).
- Ensure exposure settings are optimized to avoid signal saturation in the core of the structure.
Table 2: Quantitative Data from Reporter System Validation
| Experimental Parameter | Result / Measurement | Context / Conditions |
|---|---|---|
| Reporter Activation Time | Progressive increase over 80-120 hours | Post-treatment with carfilzomib or oxaliplatin [83] |
| Inhibition Efficiency | Signal abrogation | Co-treatment with Z-VAD-FMK [83] |
| Caspase-7 Specificity | Significant GFP signal in MCF-7 cells (caspase-3 null) | Carfilzomib treatment [83] |
| Expression Across Cell Lines | High: HEK293, Hep G2, RT4. Low: MCF7 | Baseline Caspase 3 levels via AlphaLISA [82] |
| Staurosporine EC₅₀ | Dose-dependent caspase-3 cleavage | HeLa cells, 4-hour treatment [82] |
Advanced Applications in Cell Death Research
Investigating Apoptosis-Induced Proliferation (AIP)
This reporter platform enables the study of AIP, a compensatory process where apoptotic cells stimulate the proliferation of neighboring surviving cells—a key mechanism in tumor repopulation after therapy [83].
- Method: After inducing apoptosis in a subset of reporter cells, track the GFP-negative (surviving) cell population using the constitutive mCherry signal or a proliferation dye (e.g., CFSE). Correlate the spatial and temporal patterns of caspase activation with subsequent proliferation events in nearby cells via live-cell imaging [83].
- Outcome: Enables dynamic assessment of AIP, providing insights into therapy resistance and tumor recurrence mechanisms.
Detecting Immunogenic Cell Death (ICD)
The system can be integrated with endpoint assays to investigate ICD, an immunostimulatory form of cell death crucial for effective anticancer immunity.
- Method: Following live-cell imaging of caspase activation, fix the cells and perform flow cytometry or immunostaining for surface-exposed calreticulin (CALR), a key "eat-me" signal and definitive marker of ICD [83] [84].
- Outcome: Correlates caspase-3/-7 activation dynamics with immunogenic potential, identifying conditions that favor ICD over immunologically silent apoptosis.
The Scientist's Toolkit: Essential Research Reagents
Table 3: Key Reagent Solutions for Caspase-3 Detection Studies
| Reagent / Assay | Function / Application | Key Features |
|---|---|---|
| ZipGFP-DEVD Caspase-3/-7 Reporter | Real-time, live-cell imaging of caspase activity | Split-GFP design; low background; irreversible activation; compatible with 2D & 3D models [83] |
| AlphaLISA SureFire Ultra Caspase-3 Kit | Quantitative, high-throughput detection of total caspase-3 in lysates | No-wash, bead-based immunoassay; homogenous format; suitable for 384-well plates [82] |
| Anti-Caspase Antibodies (e.g., ab32351) | Immunofluorescence and Western blot detection | Specific for caspase targets (e.g., active caspase-3); requires fixed samples or lysates [84] |
| Fluorogenic Caspase Substrates (e.g., DEVD-AFC) | Spectrophotometric or fluorometric activity assay | Provides kinetic data on enzymatic activity; requires cell lysis [81] |
| Annexin V / Propidium Iodide | Flow cytometry analysis of apoptosis | Distinguishes early apoptotic (Annexin V+/PI-) from late apoptotic/necrotic (Annexin V+/PI+) cells [83] |
Signaling Pathways and Workflows
Caspase Activation Pathways in Apoptosis
Experimental Workflow for Real-Time Caspase Detection
Fluorescent reporter systems for real-time caspase-3 detection represent a significant advancement over static histological methods like H&E staining. The ZipGFP-based platform provides unprecedented ability to dynamically track apoptosis in live cells, 3D spheroids, and patient-derived organoids, revealing the kinetic and spatial heterogeneity of cell death. This enables sophisticated investigations into phenomena like apoptosis-induced proliferation and immunogenic cell death, offering researchers a powerful tool to dissect cell death mechanisms, evaluate novel therapeutics, and ultimately bridge the gap between morphological assessment and functional dynamic analysis.
In the field of cell death research, particularly in apoptosis detection using hematoxylin and eosin (H&E) staining, a significant challenge persists: bridging the gap between quantitative single-cell data and spatial morphological context. Flow cytometry provides robust, quantitative data on cell viability and subpopulation distributions but lacks the spatial information crucial for understanding tissue microenvironments. Conversely, traditional histopathology, including H&E staining, offers exquisite morphological detail and spatial localization but often lacks the quantitative rigor required for precise comparative analyses [85] [26]. This application note details a integrated methodology that correlates morphological assessment with quantitative flow cytometry data, providing researchers with a comprehensive framework for apoptosis detection and validation. The protocol is particularly valuable for drug development professionals requiring rigorous validation of therapeutic effects on cellular viability and death pathways within tissue contexts.
Background
The Critical Role of Apoptosis Detection in Research and Therapy
Apoptosis, or programmed cell death, is a critical process in tissue homeostasis, development, and the pathogenesis of numerous diseases. Disturbances in apoptotic regulation are associated with conditions ranging from chronic inflammatory diseases like periodontitis [26] to cancer and neurodegenerative disorders. In drug development, accurately quantifying apoptosis is essential for evaluating the efficacy and mechanisms of therapeutic agents. H&E staining has long served as a fundamental histological method for identifying apoptotic cells based on classic morphological features, including cell shrinkage, chromatin condensation (pyknosis), and the formation of apoptotic bodies [26]. However, quantification using H&E alone can be subjective and lacks the quantitative precision often required for rigorous scientific analysis.
Limitations of Single-Method Approaches
While H&E staining provides a morphological gold standard, its limitations for precise quantification are well-documented. Studies comparing H&E with specialized stains like methyl green-pyronin (MGP) have demonstrated that apoptotic cells can be more easily distinguishable with histochemical methods that provide chromatic differentiation beyond H&E's capabilities [26]. Flow cytometry, though excellent for quantitative analysis of cell populations, requires single-cell suspensions, which destroys the tissue architecture and spatial relationships between cells. This disconnect necessitates an integrated approach where both quantitative and spatial data can be generated from the same tissue specimen, enabling direct correlation and validation between methodologies [85].
Integrated Experimental Workflow
The following integrated workflow enables researchers to obtain both quantitative flow cytometry data and correlative morphological information from the same biological specimen.
The diagram below illustrates the parallel processing pathway for tissue samples, enabling direct correlation between morphological and flow cytometry data.
Sample Preparation and Division
Tissue Procurement and Division:
- Obtain mucosal pinch biopsies (2-4 mm) during routine procedures [85].
- Using a sterile scalpel on a chilled glass plate, immediately divide each sample into two portions:
- Part A (for pathology assessment): Place in pre-labeled tube for fixation
- Part B (for flow cytometry): Place in pre-labeled tube with sterile buffer
- Critical Step: Prevent sample mismatches by using two pre-labeled tubes (A/B) with identical identification [85].
Rationale: This division strategy ensures that both analytical methods are applied to tissue from the same anatomical location and physiological state, enabling valid cross-correlation of results.
Detailed Methodologies
Pathology Assessment Protocol
Fixation and Processing:
- Immediately fix Part A samples in 10% neutral buffered formalin for 24 hours at room temperature.
- Process through graded ethanol series (70%, 80%, 95%, 100%) for dehydration.
- Clear in xylene and embed in paraffin (FFPE) following standard protocols [85].
Sectioning and H&E Staining:
- Cut serial 3-4 μm sections using a microtome.
- For H&E staining:
- Deparaffinize sections in xylene (2 changes, 5 minutes each)
- Rehydrate through graded ethanols (100%, 95%, 80%, 70%) to distilled water
- Stain in Harris hematoxylin for 8 minutes
- Rinse in running tap water for 5 minutes
- Differentiate in 1% acid alcohol for 30 seconds
- Rinse in running tap water for 1 minute
- Stain in eosin Y solution for 3 minutes
- Dehydrate through graded ethanols, clear in xylene, and mount [26]
Apoptotic Cell Identification and Quantification:
- Examine H&E stained sections under light microscopy at ×400 magnification.
- Identify apoptotic cells based on established morphological criteria:
- Cell shrinkage and condensation
- Deep eosinophilia of the cytoplasm
- Pyknotic, round to crescentic or irregular nucleus [26]
- Count positive cells in 10 non-overlapping high-power fields (HPFs) by two blinded pathologists.
- Calculate Apoptotic Index (AI) as: (Number of apoptotic cells / Total number of non-apoptotic cells) × 100% [26]
Flow Cytometry Viability Assessment
Sample Preparation for Flow Cytometry:
- Place Part B tissue in 150 μL PBS buffer.
- Dissociate using a scalpel and gentle pipetting (20-30 times) to liberate infiltrating leukocytes.
- Allow tissue remnants to settle by gravity for 60 seconds.
- Carefully transfer supernatant to a fresh tube.
- Pass through a CellTrics filter (or analogous 40-70 μm filter) to obtain a single-cell suspension [85].
- Critical Consideration: Use gentle mechanical dissociation without enzymes to preserve surface epitopes and minimize tissue-compartment bias [85].
Viability Staining Protocol: Table 1: Viability Stain Selection Guide
| Viability Stain | Mechanism of Action | Compatibility | Excitation/Emission | Best Use Cases |
|---|---|---|---|---|
| Propidium Iodide (PI) | Intercalates into dsDNA/dsRNA of membrane-compromised cells | Surface staining only | 535/617 nm | Basic viability exclusion |
| 7-AAD | Preferentially intercalates into dsDNA of dead cells | Surface staining only | 546/647 nm | Improved DNA specificity |
| Fixable Viability Dyes (FVDs) | Covalently cross-link to proteins in dead cells | Surface & intracellular staining | Multiple laser options | Complex panels requiring fixation |
Standard Staining with Fixable Viability Dyes (Recommended):
- Wash cells twice in azide-free and protein-free PBS.
- Resuspend cells at 1-10 × 10^6/mL in azide-free and serum/protein-free PBS.
- Add 1 μL of FVD per 1 mL of cells and vortex immediately.
- Incubate for 30 minutes at 2-8°C protected from light.
- Wash cells 1-2 times with Flow Cytometry Staining Buffer.
- Continue with surface or intracellular antibody staining as required [86].
Alternative Staining with 7-AAD:
- After staining cells for surface antigens, wash cells 1-2 times with Flow Cytometry Staining Buffer.
- Resuspend cells in an appropriate volume of Flow Cytometry Staining Buffer.
- Add 5 μL of 7-AAD Staining Solution per 100 μL of cells.
- Incubate for 5-15 minutes on ice or at room temperature.
- Critical: Do not wash cells after addition of 7-AAD - dye must remain in buffer during acquisition [86].
Flow Cytometry Acquisition and Analysis
Instrument Setup and Acquisition:
- Use a flow cytometer with standard filters appropriate for your fluorochrome panel.
- Perform daily quality control and instrument calibration.
- Apply compensation using single-stain controls.
- Acquire a minimum of 50,000 total events and ≥5,000 events in your population of interest whenever yield permits [85].
Gating Strategy for Viability Analysis:
- Initial Gating: Use forward scatter (FSC) vs. side scatter (SSC) to identify the main cell population and exclude debris.
- Singlet Selection: Apply FSC-area vs. FSC-height to exclude cell doublets and aggregates.
- Viability Gating: Gate on viability dye-negative population to select live cells for further analysis.
- Cell Type Identification: Use lineage-specific markers (e.g., CD45 for leukocytes) to identify your target population [87].
Data Interpretation:
- Represent data using histograms for single-parameter analysis (e.g., viability dye intensity) or scatter plots for multi-parameter analysis.
- Calculate the percentage of viable cells within specific populations of interest.
- For apoptosis-specific analysis, consider combining viability staining with Annexin V or caspase activity probes [13].
Data Integration and Correlation
Comparative Analysis Framework
The power of this integrated approach emerges when data from both methodologies are directly compared and correlated.
Table 2: Methodological Comparison for Apoptosis Detection
| Parameter | H&E Staining (Morphological) | Flow Cytometry (Quantitative) | Integrated Advantage |
|---|---|---|---|
| Apoptosis Detection Basis | Cellular morphology (shrinkage, pyknosis) | Membrane integrity, biochemical markers | Cross-validation of apoptotic identity |
| Spatial Context | Preserved tissue architecture | Lost in single-cell suspension | Correlation of location with function |
| Quantification | Semi-quantitative (Apoptotic Index) | Highly quantitative (% of population) | Statistical robustness with contextual validation |
| Throughput | Lower (manual counting) | Higher (automated acquisition) | Complementary speed and depth |
| Multiplexing Capacity | Limited (sequential staining) | High (multi-color panels) | Comprehensive population characterization |
Data Correlation Techniques
- Direct Comparison: Compare the apoptotic index from H&E staining with the percentage of non-viable or apoptotic cells from flow cytometry.
- Spatial-Quantitative Mapping: Correlate regions of high apoptotic incidence in tissue sections with quantitative shifts in cell population distributions in flow cytometry data.
- Statistical Analysis: Perform correlation analysis (e.g., Pearson correlation) between H&E-based apoptotic indices and flow cytometry-based viability percentages to validate concordance between methods [85].
A pilot study implementing this approach demonstrated high concordance between flow cytometry and pathology assessment for immune cell quantification in intestinal biopsies, validating the feasibility of this integrated workflow [85].
Research Reagent Solutions
Table 3: Essential Materials for Integrated Apoptosis Analysis
| Category | Specific Reagents/Equipment | Function/Purpose | Example Products |
|---|---|---|---|
| Tissue Processing | CellTrics filters | Removal of tissue remnants for single-cell suspension | Sysmex Cat.no. 04-004-2323 [85] |
| Viability Stains | Fixable Viability Dyes (FVDs) | Discrimination of live/dead cells, compatible with fixation | Invitrogen eFluor series [86] |
| Viability Stains | 7-AAD | DNA intercalation for dead cell identification | BD Pharmingen Cat.no. 00-6993 [86] |
| Flow Cytometry Antibodies | CD45-APC, CD3-PE, CD4-FITC, CD8-PerCP | Immune cell phenotyping and population identification | BD Biosciences [85] |
| Histology Stains | Hematoxylin & Eosin | Morphological assessment and apoptotic cell identification | Standard laboratory suppliers [26] |
| Instrumentation | Flow Cytometer | Quantitative single-cell analysis | BD FACSCalibur or equivalent [85] |
Technical Considerations and Troubleshooting
Optimization Guidelines
Sample Quality Control:
- Confirm tissue quality on H&E sections before flow cytometry analysis.
- Exclude samples with obvious submucosa/muscularis to ensure comparability between techniques [85].
- Record exact tissue segment and processing details for both portions.
Viability Staining Optimization:
- Titrate viability dyes for optimal signal-to-noise ratio with your specific cell type.
- For samples with <5% dead cells, consider creating a compensation control by heat-killing a small aliquot of cells (65°C for 1 minute) [86].
- When using 7-AAD or PI, analyze samples within 4 hours due to adverse effects on cell viability with prolonged dye exposure [86].
Data Analysis Considerations:
- Be aware that enzymatic dissociation protocols can affect cell type proportions and viability measurements [85].
- For flow cytometry data interpretation, include appropriate controls (isotype controls, FMO controls) to ensure accurate gating [87].
- When comparing H&E and flow data, acknowledge that different aspects of apoptosis are being measured (morphology vs. membrane integrity).
This application note presents a robust framework for correlating morphological features from H&E staining with quantitative viability data from flow cytometry. This integrated approach enables researchers in both basic research and drug development to leverage the complementary strengths of these techniques, providing both spatial context and quantitative rigor for apoptosis detection. The detailed protocols and methodological considerations outlined here facilitate implementation of this correlative approach, enhancing the validity and comprehensiveness of cell death assessment in experimental and clinical contexts.
Within toxicologic pathology and oncologic research, the accurate quantification of programmed cell death, or apoptosis, serves as a critical biomarker for understanding tissue homeostasis, developmental biology, and drug efficacy. The apoptotic index (AI), defined as the percentage of apoptotic cells within a total cell population, provides a crucial quantitative measure for these assessments [88]. For decades, hematoxylin and eosin (H&E) staining has formed the cornerstone of pathological analysis, offering reliable visualization of cellular morphology and tissue architecture through a simple yet powerful contrast: hematoxylin stains nuclear components blue, while eosin counterstains cytoplasmic and connective tissue elements pink [5] [33].
This application note explores how traditional H&E staining protocols serve as a fundamental bridge to advanced molecular detection methods in apoptosis research. While H&E staining allows pathologists to identify classic apoptotic morphology—including cytoplasmic condensation, nuclear fragmentation, and formation of apoptotic bodies—emerging evidence suggests that relying solely on H&E morphology may underestimate the true apoptotic rate by two-fold to three-fold [41] [70]. This technical gap has driven the development of complementary methodologies that retain H&E as a morphological gold standard while incorporating molecular specificity for enhanced accuracy in apoptotic index calculation. The following sections provide a comprehensive framework for integrating these approaches, with detailed protocols, comparative analyses, and practical tools for researchers and drug development professionals.
Core Concepts: Apoptosis Morphology and Detection Principles
Morphological Hallmarks of Apoptosis in H&E-Stained Sections
Apoptotic cells display distinctive morphological features that can be identified in H&E-stained tissue sections through careful microscopic examination. According to the International Harmonization of Nomenclature and Diagnostic Criteria (INHAND) guidelines, these key characteristics include cytoplasmic and nuclear condensation, visible as a compaction of nuclear chromatin into dense, uniform masses often aligned on the inner side of the nuclear membrane; nuclear fragmentation, involving convolution and fragmentation of the nuclear membrane without karyorrhexis or rupture; and cellular fragmentation with formation of membrane-bound apoptotic bodies [65] [88]. Apoptotic cells typically appear as single, noncontiguous cells or small clusters scattered within a tissue section, maintaining plasma membrane integrity until late in the process, which prevents release of cellular components and subsequent inflammation [65].
The INHAND guidelines specifically distinguish apoptosis from necrosis, noting that while they represent different pathways with distinct mechanisms, they share a similar biochemical network described as the "apoptosis-necrosis continuum" [65]. This distinction is crucial for accurate apoptotic index calculation, as the two processes can overlap under certain conditions, such as decreased availability of caspases and intracellular ATP, which may convert an ongoing apoptotic process into a necrotic one [65].
Calculation of the Apoptotic Index
The apoptotic index represents a quantitative measure of apoptosis within a tissue sample, calculated as the ratio of apoptotic cells to the total number of cells assessed, expressed as a percentage [88]. The standard formula for this calculation is:
AI = (Σ number of apoptotic cells / Σ number of total cells) × 100 [88]
For consistent and accurate AI determination, researchers should establish strict inclusion criteria requiring the simultaneous presence of at least three typical morphological characteristics: cell retraction and loss of adhesion between cells and basal membrane; cytoplasmic and nuclear condensation; nuclear fragmentation; and cellular fragmentation with apoptotic body formation [88].
Methodological Approaches: From H&E to Molecular Assays
Standard H&E Staining Protocol for Apoptosis Assessment
A consistent, high-quality H&E staining procedure is fundamental to accurate morphological identification of apoptotic cells. The following regressive staining protocol ensures proper nuclear and cytoplasmic differentiation:
Sample Preparation:
- Begin with formalin-fixed, paraffin-embedded tissue sections cut at 4μm thickness [41].
- Place slides in a 60°C oven for 20 minutes to melt paraffin [68].
Deparaffinization and Hydration:
- Immerse slides in three changes of xylene, 5 minutes each [68].
- Hydrate through graded ethanols: two changes of 100% ethanol (3 minutes each), 95% ethanol (3 minutes), and 80% ethanol (5 minutes) [68].
- Rinse slides in tap water for 5 minutes to complete hydration [68].
Nuclear Staining with Hematoxylin:
- Stain with Harris hematoxylin solution for 5 minutes [68].
- Rinse in running tap water to remove excess stain [68].
Differentiation and Bluing:
- Differentiate in 1% acid alcohol (70% alcohol with concentrated hydrochloric acid) for two quick dips to decolorize [68].
- Rinse in tap water [68].
- Place in 0.2% ammonia water (bluing solution) twice to restore blue nuclear stain [68].
- Rinse in running tap water for 5 minutes [68].
Cytoplasmic Counterstaining with Eosin:
- Dehydrate in 80% ethanol for 1 minute [68].
- Counterstain with eosin Y working solution for 45-60 seconds [68].
- Rinse briefly in 95% ethanol to remove excess eosin [68].
Final Dehydration, Clearing, and Mounting:
- Complete dehydration through two changes of 100% ethanol (1-2 minutes each) [68].
- Clear in two changes of xylene (2 minutes each) [68].
- Coverslip using a xylene-based mounting medium [68].
Molecular Methods for Apoptosis Detection
While H&E staining provides foundational morphological information, several molecular techniques offer enhanced specificity for detecting earlier apoptotic events:
TUNEL Assay: The Terminal Deoxynucleotidyl Transferase dUTP Nick End Labeling (TUNEL) method detects DNA fragmentation, one of the earliest hallmarks of apoptosis. The technique works by adding labelled nucleotides to the free 3'-hydroxyl ends of DNA breaks through catalysis by terminal deoxynucleotidyl transferase (TdT) [70]. The labeled nucleotides are then detected by immunoperoxidase techniques. Optimization is crucial, as the accuracy of TUNEL depends greatly on tissue fixation, pretreatment, and TdT concentration [41]. Overlong fixation may cause false negatives, while excessive pretreatment yields false positives [70].
Immunohistochemistry (IHC) for Apoptotic Markers: IHC detects specific proteins involved in the apoptotic process. Key targets include active caspase-3, a central protease in the apoptosis execution phase; the M30 neoepitope of cleaved cytokeratin 18, present in epithelial tissues early during apoptosis; and p53, a transcription factor that activates apoptosis in response to cellular stress [70]. Antibody selection depends on the apoptotic stage of interest and tissue type, as early markers disappear in late stages while late markers are absent at onset [70].
Annexin V Assays: This method detects phosphatidylserine externalization, an early event in apoptosis where this membrane phospholipid translocates from the inner to outer leaflet of the plasma membrane. Annexin V conjugates bind with high affinity to exposed phosphatidylserine, allowing detection before loss of membrane integrity [70]. However, necrotic cells may cause false positives due to membrane compromise [70].
Emerging Imaging Technologies: Advanced techniques like multispectral imaging flow cytometry enable quantitative apoptosis measurement based on nuclear condensation, nuclear fragmentation, and membrane blebbing through automated image analysis of large cell populations [89]. Similarly, 18F-ML-10 PET/CT imaging provides a non-invasive method for detecting apoptotic activity in vivo by targeting apoptosis-associated membrane alterations [90].
Integrated Workflow for Apoptotic Index Calculation
The diagram below illustrates a comprehensive workflow that integrates H&E staining with molecular methods for robust apoptotic index calculation:
This integrated approach leverages the strengths of each methodology: H&E provides essential morphological context, molecular methods enhance sensitivity and specificity, and digital quantification ensures objectivity and reproducibility in the final apoptotic index calculation.
Comparative Analysis of Apoptosis Detection Methods
Table 1: Technical comparison of major apoptosis detection methodologies
| Method | Detection Principle | Key Advantages | Key Limitations | Optimal Use Case |
|---|---|---|---|---|
| H&E Morphology | Nuclear condensation and fragmentation on H&E-stained sections [70] | Inexpensive, readily available, provides tissue context [70] | Underestimates apoptosis by 2-3 fold, subjective, misses early stages [41] [70] | Initial screening, validation of other methods, archival tissue studies |
| TUNEL Assay | Detection of DNA strand breaks by labeling 3' ends with TdT enzyme [41] [70] | Detects early apoptosis, widely used, commercial kits available [70] | False positives from necrosis or DNA repair, fixation-sensitive [41] [70] | Early apoptosis detection in optimally fixed tissues |
| Caspase IHC | Immunodetection of activated caspases (e.g., caspase-3) [70] | Specific to apoptosis execution phase, various commercial antibodies | May miss caspase-independent pathways, inflammatory cell background [70] | Confirming engagement of classical apoptotic pathways |
| Annexin V Assay | Binding to externalized phosphatidylserine [70] | Detects early apoptosis before membrane breakdown | False positives from necrotic membranes, requires fresh tissue [70] | Flow cytometry or fresh frozen sections for early apoptosis |
| Multispectral Imaging Flow Cytometry | Automated morphological analysis of nuclear and membrane changes [89] | Quantitative, high-throughput, combines morphology with statistics [89] | Requires specialized equipment, complex data analysis [89] | High-content screening for drug development |
Advanced Technical Protocols
Optimized TUNEL Assay Protocol for Apoptotic Index Calculation
Based on optimization studies comparing commercial kits, the following protocol provides reliable TUNEL staining for apoptotic index calculation when combined with H&E morphological validation:
Reagents and Equipment:
- Apoptag Plus Peroxidase In Situ Apoptosis Detection Kit (or equivalent) [41]
- Proteinase K (25μg/mL in PBS) [41]
- Phosphate buffered saline (PBS)
- Hydrogen peroxide-methanol solution
- Methyl green counterstain [41]
- Humidified chamber at 37°C
Procedure:
- Section Preparation and Deparaffinization:
Quenching and Proteolytic Digestion:
TUNEL Reaction:
Detection and Visualization:
Critical Optimization Steps:
- Proteinase K concentration and incubation time are crucial: test ranges of 5-30μg/mL for 5-20 minutes for each new tissue type [41].
- Reduce TdT concentration to half the recommended level to decrease background staining [41].
- Increase anti-digoxigenin peroxidase incubation temperature to 37°C for enhanced sensitivity and specificity [41].
- Use methyl green instead of hematoxylin for better compatibility with digital imaging systems [41].
Digital Quantification of Apoptotic Index
For objective, reproducible apoptotic index calculation, implement the following digital quantification protocol:
Equipment and Software:
- Bacus Laboratories Incorporated Slide Scanner (BLISS) or equivalent whole slide imaging system [41]
- WebSlide Browser program or similar image analysis software [41]
- Computer workstation with adequate processing power
Procedure:
- Slide Scanning:
Cell Counting and Analysis:
- Count all apoptotic bodies (DAB-positive in TUNEL or IHC-stained sections) across all captured images [41].
- Determine total intact carcinoma cells by counting methyl green-counterstained cells in a random collection of 10% of captured images [41].
- Extrapolate total cell count across the entire scanned area [41].
Apoptotic Index Calculation:
Quality Control Measures:
- Have multiple observers evaluate equivocal staining cases through networked WebSlide Browser access [41].
- Simultaneously review immunohistochemical positivity and surrounding cell histology to reduce false positives/negatives [41].
- Establish inter-observer concordance rates through blinded re-evaluation of a subset of cases.
Table 2: Essential research reagent solutions for apoptosis detection studies
| Reagent/Category | Specific Examples | Primary Function | Application Notes |
|---|---|---|---|
| Hematoxylin Formulations | Harris Hematoxylin, Mayer's Hematoxylin, Gill's Hematoxylin [5] | Nuclear staining through binding to nucleic acids | Harris provides clear nuclear detail; Mayer's used without differentiation for special stains [5] |
| Eosin Formulations | Eosin Y, Eosin with Phloxine, EA50, EA65 [5] | Cytoplasmic counterstain | Eosin Y most common; add phloxine for enhanced reds; EA mixtures for cytology [5] |
| Apoptosis Detection Kits | Apoptag Plus Peroxidase Kit, In Situ Cell Death Detection Kit [41] | Detect DNA fragmentation in apoptotic cells | Apoptag shows better reproducibility after optimization; sensitive to fixation conditions [41] |
| IHC Antibodies | Anti-active Caspase-3, M30 (cleaved CK18), Anti-Bax, Anti-p53 [70] | Detect specific apoptotic proteins | Caspase-3 for execution phase; M30 limited to epithelial tissues; p53 for stress-induced apoptosis [70] |
| Digital Analysis Tools | BLISS System, WebSlide Browser, Image Pro-Plus [41] [88] | Quantitative morphometric analysis | BLISS eliminates field selection bias; allows simultaneous review by multiple observers [41] |
Technical Considerations and Troubleshooting
Preanalytical Variables Affecting Apoptosis Detection
Multiple preanalytical factors significantly impact the accuracy of apoptotic index calculation across all methodologies:
Fixation Issues:
- Delayed or Incomplete Fixation: Can produce autolytic changes mimicking apoptosis and cause false-positive TUNEL staining [41].
- Over-fixation: May mask antigenic sites for IHC and reduce TUNEL sensitivity through excessive protein-DNA crosslinking [41] [70].
- Optimal Practice: Standardize fixation in 10% neutral buffered formalin for 24-48 hours based on tissue thickness [41].
Tissue Processing and Sectioning:
- Processing Artifacts: Incomplete dehydration or clearing can compromise tissue morphology and stain quality.
- Section Thickness: Variations affect cell counting; standardize at 4-5μm for consistent results [41].
- Solution: Implement controlled processing schedules and verify section quality before staining.
Method-Specific Troubleshooting Guidelines
Table 3: Troubleshooting common issues in apoptosis detection methods
| Problem | Potential Causes | Solutions |
|---|---|---|
| High background in TUNEL | Excessive proteinase K concentration or incubation time [41] | Titrate proteinase K (5-30μg/mL), reduce incubation time (5-20min) [41] |
| Weak or no TUNEL signal | Inadequate proteinase K digestion, over-fixation [41] [70] | Increase proteinase K concentration or time, extend retrieval conditions [41] |
| False positive TUNEL | Necrotic cells, DNA repair intermediates [70] | Include morphological validation, optimize TdT concentration [41] |
| Poor H&E nuclear detail | Over-differentiation, exhausted hematoxylin, inadequate bluing | Reduce acid alcohol time, refresh hematoxylin, ensure proper bluing step [5] [68] |
| Inconsistent AI between observers | Subjective morphological criteria, sampling variation | Implement digital quantification, standardize counting criteria, train multiple observers [41] [88] |
The calculation of apoptotic index represents a critical quantitative bridge between traditional H&E morphology and modern molecular detection methods. While H&E staining remains the foundational approach for identifying characteristic apoptotic morphology in tissue sections, its limitations necessitate complementary molecular techniques for comprehensive apoptosis assessment. The integrated workflow presented in this application note—combining optimized H&E staining with validated TUNEL assays, targeted IHC, and digital quantification—provides a robust framework for accurate apoptotic index calculation that leverages the strengths of each approach.
Emerging technologies continue to enhance our ability to quantify apoptosis in both research and clinical contexts. Multispectral imaging flow cytometry couples the quantitative advantage of flow cytometry with the accuracy of morphology-based algorithms [89], while advanced PET/CT imaging with apoptosis-specific radiotracers like 18F-ML-10 enables non-invasive visualization of apoptotic activity in vivo [90]. Computational approaches using deep learning frameworks now demonstrate potential for predicting IHC staining patterns directly from H&E whole slide images [33], offering the possibility of reduced costs and workflow efficiencies while maintaining diagnostic insights.
For researchers and drug development professionals, the recommendations and protocols provided herein offer a practical pathway for implementing rigorous apoptotic index calculation that aligns with international nomenclature and diagnostic criteria [65]. By adopting these integrated methodologies and maintaining morphological validation as a gold standard, the scientific community can advance both basic understanding of cell death mechanisms and translational applications in therapeutic development.
This application note provides a detailed validation framework for utilizing hematoxylin and eosin (H&E) staining in apoptosis detection across diverse disease models. We demonstrate that this classic histological method, when properly optimized and quantified, serves as a reliable, cost-effective, and accessible technique for identifying programmed cell death in tissue sections. The protocols and data presented herein establish H&E staining as a fundamental tool for researchers and drug development professionals investigating cell death mechanisms in disease pathogenesis and therapeutic interventions.
Apoptosis, or programmed cell death, is a critically regulated process essential for tissue homeostasis, development, and the elimination of damaged cells. Its dysregulation is a hallmark of numerous pathologies, including cancer, neurodegenerative disorders, and the disease models central to this study: periodontitis and organ transplantation [91] [92]. While numerous advanced techniques exist for apoptosis detection, many require specialized equipment and reagents, making them less accessible in resource-limited settings [93]. The terminal deoxynucleotidyl transferase dUTP nick end labeling (TUNEL) assay, for instance, while sensitive, is known to produce high background and false-positive staining, complicating quantification [94].
H&E staining, the most ubiquitous method in histology, provides a compelling alternative. It allows for the visualization of classic apoptotic morphological features, including cell shrinkage, chromatin condensation (pyknosis), chromatin margination, and the formation of membrane-bound apoptotic bodies [91] [93]. This application note validates H&E staining for apoptosis detection through a structured case study, providing detailed protocols, quantitative data, and analytical workflows to standardize its application in biomedical research.
Validation Data from Disease Models
The utility of H&E staining for apoptosis detection was quantified in a viral infection model and its detection efficiency was compared against established biochemical methods.
Table 1: Quantitative Apoptosis Detection in Rubella-Infected Vero Cell Cultures
| Detection Method | Multiplicity of Infection (MOI) | % Apoptotic Cells (Day 3 p.i.) | % Apoptotic Cells (Day 4 p.i.) | % Apoptotic Cells (Day 5 p.i.) |
|---|---|---|---|---|
| H&E Staining [93] | 10 | 26% | 45% | 47% |
| TUNEL Assay [93] | 10 | 0.8% | 1.2% | 1.2% |
| H&E Staining with Caspase Inhibitor (z-VAD-fmk) [93] | 10 | Significantly Reduced | Significantly Reduced | Significantly Reduced |
p.i. = post-infection
The data in Table 1 reveals a critical finding: H&E staining detected a substantially higher proportion of apoptotic cells compared to the TUNEL assay. This suggests that H&E is effective at identifying early stages of apoptosis, characterized by nuclear condensation and cellular contraction while the cell is still attached to the monolayer. In contrast, the TUNEL assay, which requires extensive DNA fragmentation, may only detect cells in later stages of apoptosis that are about to detach [93]. The significant reduction in H&E-detectable apoptosis upon addition of the caspase inhibitor z-VAD-fmk confirms that the morphological changes observed are specific to the apoptotic pathway [93].
Detailed H&E Staining Protocol for Apoptosis Detection
The following is a standardized protocol for H&E staining of formalin-fixed, paraffin-embedded (FFPE) tissue sections, optimized for the visualization of apoptotic morphology [5] [95] [96].
Materials and Reagents
The Scientist's Toolkit: Essential Reagents for H&E Staining
| Item | Function / Explanation |
|---|---|
| Mayer's Hematoxylin [95] [96] | An alum-based hematoxylin solution used for progressive nuclear staining. It provides clear nuclear detail and is less likely to overstain. |
| Eosin Y Solution [95] [96] | An acidic counterstain that colors the cytoplasm and extracellular matrix in shades of pink, providing contrast to the blue-purple nuclei. |
| Ethanol Series (100%, 95%, 70%) [95] [96] | Used for dehydrating sections after staining and rehydrating them prior to staining. |
| Xylene [95] [96] | An organic solvent used for clearing paraffin from sections and after dehydration for mounting. |
| Bluing Agent (e.g., Scott's Tap Water, weak ammonia solution) [5] | A slightly basic solution that converts the red hematoxylin-nuclear complex to a stable blue-purple color. |
| Acid Differentiator (e.g., 1% acid alcohol) [5] | A mild acid solution used to selectively remove excess hematoxylin from the cytoplasm and connective tissue. |
| Resinous Mounting Medium [95] | Used to permanently preserve the stained section under a coverslip. |
Step-by-Step Procedure
Deparaffinization and Rehydration:
Nuclear Staining with Hematoxylin:
Cytoplasmic Counterstaining with Eosin:
Dehydration, Clearing, and Mounting:
Apoptotic Morphology Assessment
When examining H&E-stained sections under a light microscope, researchers should identify the following key morphological features of apoptosis [91] [93]:
- Cell Shrinkage: Apoptotic cells appear smaller and denser than their healthy neighbors.
- Chromatin Condensation: Nuclear chromatin becomes densely packed (pyknosis) or aggregates along the inner nuclear membrane (chromatin margination).
- Nuclear Fragmentation: The nucleus breaks into discrete fragments.
- Apoptotic Body Formation: The cell buds off to form membrane-bound vesicles containing cytoplasm, organelles, and nuclear debris.
Integrated Apoptosis Signaling and Detection Workflow
To accurately interpret H&E staining results, it is essential to understand the biochemical context of apoptosis. The following diagram and table integrate the molecular pathways with the detectable morphological features.
Table 2: Correlation of Apoptosis Stages with Detection Methods
| Stage | Key Biochemical/Molecular Events | Morphological Features (H&E) | Complementary Detection Assays |
|---|---|---|---|
| Early | Activation of initiator caspases; Phosphatidylserine externalization; Loss of mitochondrial membrane potential [91] [92] [97]. | Cell shrinkage; Increased eosinophilia of cytoplasm [91]. | Annexin V staining; JC-1 assay for ΔΨm; Caspase activation assays [92] [97]. |
| Mid | Executioner caspase activation (Caspase-3); Protein cleavage (e.g., PARP); Endonuclease activation [91] [92]. | Chromatin condensation (pyknosis); Chromatin margination [91] [93]. | H&E Staining; Immunostaining for Cleaved Caspase-3 [92]. |
| Late | Extensive DNA fragmentation into oligonucleosomes [91]. | Nuclear fragmentation; Apoptotic body formation [91] [93]. | H&E Staining; TUNEL Assay; DNA Gel Electrophoresis (DNA laddering) [91] [93]. |
This application note establishes a validated framework for using H&E staining as a primary method for apoptosis detection in disease models. The quantitative data demonstrates that H&E is exceptionally effective at identifying early-to-mid-stage apoptotic cells based on classic morphological criteria, a point where other methods like the TUNEL assay may be less sensitive [93]. The integration of H&E within a broader analytical workflow, complemented by specific biochemical assays, provides a robust and comprehensive strategy for cell death analysis.
For researchers in periodontitis, organ transplantation, and beyond, the protocols outlined here offer a reproducible, cost-effective, and accessible pathway to generate high-quality, quantifiable apoptosis data. The ability to concurrently assess tissue architecture and pathological context makes H&E an indispensable tool in the researcher's arsenal, bridging the gap between classic histopathology and modern molecular biology.
Conclusion
H&E staining remains a foundational, cost-effective, and highly accessible method for the initial morphological identification of apoptosis, providing an essential first step in cell death analysis. Its true power is unlocked when used as part of a validation framework, where its findings are confirmed and enriched by specialized techniques like TUNEL, flow cytometry, and novel fluorescent reporters. The integration of emerging technologies, particularly deep learning pipelines for whole-cell segmentation and cross-modality prediction, is poised to transform H&E-based analysis, offering unprecedented quantitative precision and predictive capabilities. For researchers and clinicians, this synergistic approach paves the way for more accurate diagnostic criteria, refined therapeutic monitoring, and deeper insights into the role of apoptosis in human disease, ultimately advancing the frontiers of personalized medicine and drug development.
References
- 1. Programmed Cell Death (Apoptosis) - NCBI - NIH [https://www.ncbi.nlm.nih.gov/books/NBK26873/]
- 2. Apoptosis (Programmed Cell Death) [https://my.clevelandclinic.org/health/articles/apoptosis]
- 3. What Is Apoptosis? [https://www.mskcc.org/news/what-apoptosis]
- 4. Investigating apoptosis in peripheral blood mononuclear cells ... [https://pmc.ncbi.nlm.nih.gov/articles/PMC12577001/]
- 5. H&E Staining Overview: A Guide to Best Practices [https://www.leicabiosystems.com/us/knowledge-pathway/he-staining-overview-a-guide-to-best-practices/]
- 6. Annexin V Staining Protocol for Flow Cytometry [https://www.thermofisher.com/us/en/home/references/protocols/cell-and-tissue-analysis/protocols/annexin-v-staining-flow-cytometry.html]
- 7. Apoptosis Protocols [https://health.usf.edu/medicine/corefacilities/flowcytometry/methods-apoptosis]
- 8. Protocol for Apoptosis Assay by Flow Cytometry Using ... [https://pmc.ncbi.nlm.nih.gov/articles/PMC4943750/]
- 9. North America Apoptosis Assay Market Trends 2025–2034 [https://www.gminsights.com/industry-analysis/north-america-apoptosis-assay-market]
- 10. Apoptosis Testing Market Size, Demand & Forecast 2025- ... [https://www.futuremarketinsights.com/reports/apoptosis-testing-market]
- 11. H&E and IHC Staining - 组织病理学染色解释 [https://www.mymab.com.my/zh/histopathology-staining-explained-he-and-ihc-staining/]
- 12. H&E染色:揭示细胞细节,助力病理诊断|文献速递 [https://blog.csdn.net/qq_45404805/article/details/142850266]
- 13. Guidelines for Regulated Cell Death Assays: A Systematic ... [https://www.frontiersin.org/journals/cell-and-developmental-biology/articles/10.3389/fcell.2021.634690/full]
- 14. Mechanisms of metabolic stress induced cell death of human ... [https://pmc.ncbi.nlm.nih.gov/articles/PMC10320974/]
- 15. Biphasic Regulation of Apoptosis Following Gastric ... [https://www.mdpi.com/2072-6694/16/7/1389]
- 16. Quinalizarin induces autophagy, apoptosis and mitotic ... [https://www.nature.com/articles/s41598-025-89847-8]
- 17. Programmed cell death detection methods: a systematic ... [https://link.springer.com/article/10.1007/s10495-022-01735-y]
- 18. Apoptotic bodies: bioactive treasure left behind by the ... [https://pmc.ncbi.nlm.nih.gov/articles/PMC10337089/]
- 19. Hoechst 33342 Protocol for Imaging [https://www.thermofisher.com/us/en/home/references/protocols/cell-and-tissue-analysis/protocols/hoechst-33342-imaging-protocol.html]
- 20. Flow cytometry-based quantitative analysis of cellular ... [https://www.sciencedirect.com/science/article/pii/S2405844024096968]
- 21. Electronic detection of apoptotic cells on a microchip [https://www.sciencedirect.com/science/article/abs/pii/S0956566324007565]
- 22. The formation of the 'footprint of death' as a mechanism for ... [https://www.nature.com/articles/s41467-025-64206-3]
- 23. Apoptosis Assay Market Size Report, 2025 – 2034 [https://www.gminsights.com/industry-analysis/apoptosis-assay-market]
- 24. Diversity and complexity of cell death: a historical review [https://www.nature.com/articles/s12276-023-01078-x]
- 25. A comparative study of apoptosis, pyroptosis, necroptosis, and ... [https://journals.plos.org/plosone/article?id=10.1371/journal.pone.0299577]
- 26. Histochemical detection and comparison of apoptotic cells ... [https://pmc.ncbi.nlm.nih.gov/articles/PMC4976550/]
- 27. Apoptosis, Pyroptosis, and Necrosis: Mechanistic Description ... [https://pmc.ncbi.nlm.nih.gov/articles/PMC1087413/]
- 28. Promoting the transition from pyroptosis to apoptosis in ... [https://pmc.ncbi.nlm.nih.gov/articles/PMC11809013/]
- 29. Apoptosis Assay Protocol | Technical Note 244 [https://www.denovix.com/tn-244-denovix-apoptosis-assay-protocol/]
- 30. Molecular Cell Biology of Apoptosis in Health and Disease [https://pubmed.ncbi.nlm.nih.gov/41004078/]
- 31. Regulated cell death pathways and their roles in ... [https://www.nature.com/articles/s12276-023-01069-y]
- 32. Experimental protocol to study cell viability and apoptosis [https://www.ptglab.com/support/flow-cytometry-protocol/experimental-protocol-to-study-cell-viability-and-apoptosis/?srsltid=AfmBOooX5LvUKjuo39QMIAcHdptj3Uc9K-4T7F3wVtEsw_hsTkbqBmx1]
- 33. Regular article Cross-Modality Learning for Predicting ... [https://www.sciencedirect.com/science/article/pii/S0002944025003414]
- 34. AI-based Apoptosis Cell Classification Using Phase ... [https://ar.iiarjournals.org/content/44/3/935]
- 35. High-Resolution Imaging of Morphological Changes ... [https://pmc.ncbi.nlm.nih.gov/articles/PMC12384366/]
- 36. Comparison of cell-based assays to quantify treatment ... [https://www.nature.com/articles/s41598-018-34696-x]
- 37. Comparative Evaluation of Cytotoxic and Apoptotic Effects of ... [https://pmc.ncbi.nlm.nih.gov/articles/PMC12029500/]
- 38. H&E stain [https://en.wikipedia.org/wiki/H%26E_stain]
- 39. Haematoxylin and Eosin (H&E) staining of paraffin sections [https://www.protocols.io/view/haematoxylin-and-eosin-h-amp-e-staining-of-paraffi-d5sj86cn.html]
- 40. Understanding Hematoxylin and Eosin (H&E) Staining [https://www.ihisto.io/post/understanding-hematoxylin-and-eosin-h-e-staining-a-comprehensive-guide]
- 41. Identifying and Quantifying Apoptosis: Navigating ... [https://www.nature.com/articles/3880776]
- 42. Quantitative assessment of H&E staining for pathology - PMC [https://pmc.ncbi.nlm.nih.gov/articles/PMC10885446/]
- 43. An international study of stain variability in histopathology ... [https://www.sciencedirect.com/science/article/pii/S2153353925000057]
- 44. Programmed cell death detection methods - PubMed Central [https://pmc.ncbi.nlm.nih.gov/articles/PMC9308588/]
- 45. Hematoxylin and Eosin (H&E) Staining Protocol [https://ihcworld.com/2024/01/25/hematoxylin-and-eosin-he-staining-protocol/]
- 46. Exploring the Potential of Chaihu-Danggui Tang in Breast ... [https://pubmed.ncbi.nlm.nih.gov/40370757/]
- 47. Apoptosis-induced treatment for ovarian cancer from self ... [https://www.sciencedirect.com/science/article/pii/S0927775724009312]
- 48. Research on the inhibitory effect of hydrogen gas on ovarian ... [https://eurjmedres.biomedcentral.com/articles/10.1186/s40001-025-03111-3]
- 49. Quantitative assessment of H&E staining for pathology [https://diagnosticpathology.biomedcentral.com/articles/10.1186/s13000-024-01461-w]
- 50. Microscope Resolution: Concepts, Factors and Calculation [https://www.leica-microsystems.com/science-lab/life-science/microscope-resolution-concepts-factors-and-calculation/]
- 51. An In-Depth Guide to Learning About Different Types of ... [https://detercoonline.com/2025/08/12/an-in-depth-guide-to-learning-about-different-types-of-microscopes-and-choosing-the-right-microscope-for-your-application/]
- 52. Key Factors in Research Microscope Selection [https://precipoint.com/en/digital-microscopy/key-factors-in-research-microscope-selection]
- 53. Development of a quantitative pharmacodynamic assay for ... [https://www.oncotarget.com/article/24936/text/]
- 54. FULL TEXT [https://www.ectrx.org/detail/current/2025/23/5/0/371/society.php]
- 55. Fluorescence lifetime imaging microscopy approach ... [https://pubmed.ncbi.nlm.nih.gov/40799248/]
- 56. Cell Segmentation With Globally Optimized Boundaries (CSGO) [https://pubmed.ncbi.nlm.nih.gov/39528162/]
- 57. QBRC/CSGO: Cell Segmentation with Globally Optimized ... [https://github.com/QBRC/CSGO]
- 58. Development and clinical validation of deep learning ... [https://pmc.ncbi.nlm.nih.gov/articles/PMC12211442/]
- 59. Cross-Modality Learning for Predicting IHC Biomarkers ... [https://arxiv.org/abs/2506.15853]
- 60. Machine learning enabled prediction of digital biomarkers ... [https://www.medrxiv.org/content/10.1101/2024.01.06.24300926v2.full-text]
- 61. Deep Learning-Based Prediction of Molecular Tumor ... [https://pmc.ncbi.nlm.nih.gov/articles/PMC9784641/]
- 62. H&E to IHC virtual staining methods in breast cancer [https://pmc.ncbi.nlm.nih.gov/articles/PMC12222792/]
- 63. A quantitative real-time approach for discriminating ... [https://pmc.ncbi.nlm.nih.gov/articles/PMC5253725/]
- 64. The Quantitative-Phase Dynamics of Apoptosis and Lytic ... [https://www.nature.com/articles/s41598-020-58474-w]
- 65. Recommendations from the INHAND Apoptosis/Necrosis ... [https://pmc.ncbi.nlm.nih.gov/articles/PMC4785073/]
- 66. Optimized protocol to preserve RNA integrity for laser ... [https://www.sciencedirect.com/science/article/pii/S2666910225000493]
- 67. Altered Apoptosis in Endometriosis Compared with ... [https://pmc.ncbi.nlm.nih.gov/articles/PMC12654119/]
- 68. UMN TMCs - Histology H&E Staining Protocol [https://www.protocols.io/view/umn-tmcs-histology-h-amp-e-staining-protocol-hfrmb3m47.html]
- 69. Optimizing Re-staining Techniques for the Restoration of ... [https://pmc.ncbi.nlm.nih.gov/articles/PMC11577553/]
- 70. Detecting Cell Apoptosis on Tissue Slides [https://bitesizebio.com/34739/cell-apoptosis-on-tissue-slides/]
- 71. Epithelial apoptosis in mechanistically distinct methods of ... [https://pmc.ncbi.nlm.nih.gov/articles/PMC1850436/]
- 72. Utilizing image analysis by optical density to evaluate ... [https://pubmed.ncbi.nlm.nih.gov/40548479/]
- 73. Staining Methods in Frozen Section: Best Lab Practices [https://health.ucdavis.edu/blog/lab-best-practice/staining-methods-in-frozen-section-best-lab-practices/2020/03]
- 74. Troubleshooting Guidance for Hematoxylin and Eosin Stain [https://www.labce.com/troubleshooting_hematoxylin_eosin_stain.aspx?srsltid=AfmBOorPNmQ-D-CP_36sKSWb0WPwHVZkk-xh_Nq7yc-c9gafYcNA23vd]
- 75. Click-iT TUNEL Alexa Fluor Imaging Assay Protocol [https://www.thermofisher.com/us/en/home/references/protocols/cell-and-tissue-analysis/apoptosis-protocol/tunel-protocols/click-it-tunel-alexa-fluor-imaging-assay-protocol.html]
- 76. TUNEL staining [https://www.abcam.com/en-us/technical-resources/guides/cell-health-guide/tunel-staining-or-tunel-assay]
- 77. Protocol to study cell death using TUNEL assay in ... [https://pmc.ncbi.nlm.nih.gov/articles/PMC8808282/]
- 78. Comparison of necrotizing enterocolitis (NEC) [https://pmc.ncbi.nlm.nih.gov/articles/PMC12267699/]
- 79. DeadEnd™ Fluorometric TUNEL System Protocol [https://www.promega.com/resources/protocols/technical-bulletins/0/deadend-fluorometric-tunel-system-protocol/]
- 80. Dual contrastive learning based image-to- ... [https://www.nature.com/articles/s41598-024-52833-7]
- 81. A Comprehensive Exploration of Caspase Detection Methods [https://pmc.ncbi.nlm.nih.gov/articles/PMC11121653/]
- 82. AlphaLISA SureFire Ultra Human Total Caspase-3 ... [https://www.revvity.com/product/alpha-sf-ultra-caspase3-total-hv-alsu-tcasp3-a-hv]
- 83. Integrated real-time imaging of executioner caspase dynamics... [https://www.nature.com/articles/s41420-025-02662-y?error=cookies_not_supported&code=997d5d12-8110-4bfe-afc4-0e9db0552642]
- 84. for Protocol of detection using immunofluorescence | Abcam caspases [https://www.abcam.com/en-us/technical-resources/protocols/immunofluorescence-protocol-to-detect-caspases]
- 85. A Paired Flow Cytometry–Pathology Assessment for ... [https://www.mdpi.com/2409-9279/8/5/122]
- 86. BestProtocols: Viability Staining Protocol for Flow Cytometry [https://www.thermofisher.com/us/en/home/references/protocols/cell-and-tissue-analysis/protocols/viability-staining-flow-cytometry.html]
- 87. How to Interpret Flow Cytometry Data [https://www.fortislife.com/resources/antibody-resources/how-to-interpret-flow-cytometry-data]
- 88. Obtaining the apoptotic index (AI) and immunohistochemistry [https://bio-protocol.org/exchange/minidetail?id=6948511&type=30]
- 89. Quantitative image based apoptotic index measurement ... [https://pubmed.ncbi.nlm.nih.gov/18543109/]
- 90. Using 18F-ML-10 PET/CT imaging to detect ... [https://pubmed.ncbi.nlm.nih.gov/41081121/]
- 91. Apoptosis detection: a purpose-dependent approach ... [https://pmc.ncbi.nlm.nih.gov/articles/PMC8208110/]
- 92. Seven Assays to Detect Apoptosis - CST Blog [https://blog.cellsignal.com/blog.cellsignal.com/cell-process-seven-assays-to-detect-apoptosis]
- 93. of rubella-virus-induced Detection in Vero cell cultures with... apoptosis [https://pubmed.ncbi.nlm.nih.gov/12600000/]
- 94. Article Identifying and Quantifying Apoptosis [https://www.sciencedirect.com/science/article/pii/S0893395222050360]
- 95. Lung Section Staining and Microscopy [https://en.bio-protocol.org/en/bpdetail?id=2286&type=0]
- 96. Techniques. Protocols . hematoxylin . Atlas of plant and... and eosin [https://mmegias.webs.uvigo.es/02-english/6-tecnicas/protocolos/p-tincion-h-e.php]
- 97. Apoptosis Detection: Methods, Assays & Analysis ... [https://www.revvity.com/ask/apoptosis]