Integrating Morphological and Molecular Apoptosis Detection: A Comprehensive Guide for Enhanced Research and Drug Development
This article provides a comprehensive framework for researchers, scientists, and drug development professionals on the integrated use of morphological and molecular methods for apoptosis detection.
Integrating Morphological and Molecular Apoptosis Detection: A Comprehensive Guide for Enhanced Research and Drug Development
Abstract
This article provides a comprehensive framework for researchers, scientists, and drug development professionals on the integrated use of morphological and molecular methods for apoptosis detection. It covers the foundational principles of apoptotic hallmarks, details practical methodologies from microscopy to molecular probes, addresses common challenges and optimization strategies in complex models like 3D cultures, and offers a comparative analysis for method validation. By synthesizing insights from cutting-edge and conventional techniques, this guide aims to empower more accurate, reliable, and physiologically relevant assessment of programmed cell death in both basic research and therapeutic development.
Decoding the Hallmarks: Understanding Apoptosis Morphology and Molecular Pathways
Apoptosis, or programmed cell death, is a fundamental biological process characterized by a sequence of highly specific morphological changes. First systematically described in 1972, these morphological hallmarks remain the gold standard for identifying and distinguishing apoptotic cell death from other forms of cell death such as necrosis [1]. This precise morphological pattern occurs in a controlled, energy-dependent manner and results from the activation of cascading molecular pathways, primarily the caspase protease family [2] [1]. Understanding this link between cellular structure and biochemical activity is crucial for researchers and drug development professionals aiming to accurately detect and quantify apoptosis in experimental and therapeutic contexts. This guide provides a comparative analysis of the key morphological features of apoptosis and the experimental methodologies used to visualize them.
Morphological Hallmarks of Apoptosis
The journey of a cell through apoptosis follows a stereotypic sequence of structural alterations, which are detailed in the table below. These features are consistent across different cell types and apoptotic stimuli, providing a reliable framework for identification.
Table 1: Key Morphological Features of Apoptosis at a Glance
| Morphological Feature | Description | Microscopy Method for Detection |
|---|---|---|
| Cell Shrinkage | Reduction in cell volume and density due to water loss and condensation of cytoplasm [2] [3]. | Light Microscopy (DIC/Phase) [4] |
| Chromatin Condensation | Aggregation of nuclear chromatin into dense, crescent-shaped masses beneath the nuclear envelope [2] [3]. | Fluorescence Microscopy (Hoechst/DAPI) [3] |
| Nuclear Fragmentation | Breakdown of the nucleus into discrete, smaller fragments (pyknotic bodies) [2]. | Fluorescence Microscopy (Hoechst/DAPI) [3] |
| Plasma Membrane Blebbing | Formation of dynamic, outward protrusions of the cell membrane [3]. | Scanning Electron Microscopy (SEM) [3] |
| Formation of Apoptotic Bodies | Cell fragmentation into small, membrane-bound vesicles containing intact organelles and nuclear fragments [5] [2]. | Transmission Electron Microscopy (TEM) [3] |
| Phosphatidylserine Externalization | Translocation of the phospholipid phosphatidylserine from the inner to the outer leaflet of the plasma membrane [6]. | Fluorescence Microscopy (Annexin V staining) [4] |
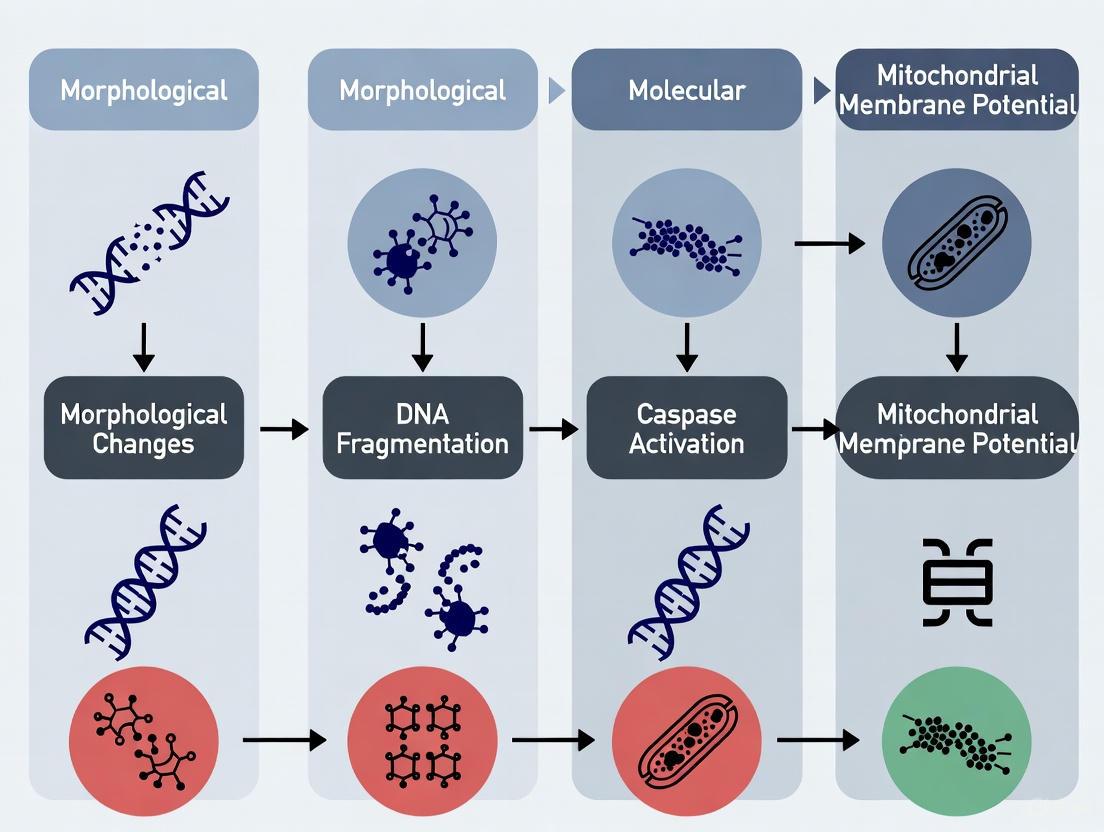
These features stand in stark contrast to those of necrosis, which is characterized by cell swelling, rupture of the plasma membrane, and disorganized organelle breakdown, often triggering an inflammatory response [5] [2]. The following diagram summarizes the sequential relationship between these key morphological events during apoptosis.
Molecular Pathways and Their Morphological Outcomes
The distinct morphology of apoptosis is the direct result of the activation of two main molecular pathways: the intrinsic (mitochondrial) and extrinsic (death receptor) pathways. Both converge on the activation of executioner caspases, which systematically dismantle the cell by cleaving hundreds of cellular substrates [1].
- Cleavage of ROCK1 kinase leads to the reorganization of the actin cytoskeleton, causing membrane blebbing [1].
- Cleavage of iCAD releases CAD (caspase-activated DNase), leading to DNA fragmentation [1].
- Cleavage of Acinus contributes to chromatin condensation [1].
- Cleavage of lamin proteins disrupts the nuclear envelope, facilitating nuclear breakdown [3].
- Activation of the scramblase Xkr8 and inactivation of flippase ATP11 lead to phosphatidylserine (PS) externalization, an "eat-me" signal for phagocytes [1].
The following diagram illustrates these two primary pathways and their connection to the cell's morphological demise.
Experimental Protocols for Morphological Assessment
Accurate assessment of apoptosis relies on robust experimental protocols that visualize these characteristic changes. The table below compares common methods used for morphological analysis.
Table 2: Comparison of Apoptosis Detection Methods
| Method | What is Monitored | Time to Complete | Complexity | Real-time Monitoring | Key Readout |
|---|---|---|---|---|---|
| Light Microscopy (DIC/PC) | Cell size/morphology, membrane blebbing, apoptotic bodies [4] | + (Fast) | + (Low) | Yes [4] | Direct visualization of live cell morphology |
| Fluorescence Microscopy | Nuclear morphology, DNA fragmentation, PS exposure, caspase activation [4] | ++ (Moderate) | ++ (Moderate) | Yes [4] | Chromatin condensation, fragmented nuclei |
| Transmission Electron Microscopy (TEM) | Internal cell structure, organelle integrity, nuclear details [7] [3] | +++ (Slow) | +++ (High) | No [8] | Ultrastructural details (e.g., mitochondrial cristae) |
| Flow Cytometry | Cell size, granularity, PS exposure, DNA content, mitochondrial membrane potential [4] | ++ (Moderate) | +++ (High) | No | Quantitative analysis of large cell populations |
| Gel Electrophoresis | DNA fragmentation (ladder pattern) [4] | ++ (Moderate) | ++ (Moderate) | No | Characteristic oligonucleosomal DNA ladder |
Detailed Protocol: Light and Fluorescence Microscopy for Apoptosis Detection
This protocol combines transmitted light and fluorescence imaging to provide a comprehensive morphological and biochemical profile of apoptotic cells [4] [3].
1. Cell Preparation and Induction
- Culture cells (e.g., HeLa or PtK cell lines) on glass-bottom dishes in appropriate medium (e.g., DMEM or EMEM with 10% FBS) at 37°C and 5% CO₂ [4].
- To induce apoptosis, treat cells with 1-10 µM Staurosporine (a protein kinase inhibitor) or other inducers like 5 µM Doxorubicin for varying time periods (30 minutes to several hours) [4] [8] [9].
2. Staining Procedures
- For Nuclear Morphology: Incubate cells with 1-5 µg/mL of a cell-permeable DNA dye like Hoechst 33342 or DAPI for 15-30 minutes at 37°C [3]. These dyes preferentially bind to DNA and allow visualization of chromatin condensation and nuclear fragmentation.
- For Caspase Activation: Use a fluorescent caspase substrate, such as NucView 488, which is non-fluorescent until cleaved by caspase-3/7, resulting in nuclear staining [4].
- For Phosphatidylserine Exposure: Stain cells with fluorescently conjugated Annexin V in a calcium-containing buffer, followed by analysis via microscopy or flow cytometry [4].
3. Image Acquisition and Analysis
- Transmitted Light Imaging: Use Differential Interference Contrast (DIC) or Phase Contrast microscopy to visualize overall cellular morphology, including cell shrinkage, membrane blebbing, and apoptotic body formation [4].
- Fluorescence Imaging: Capture images using appropriate filter sets for the fluorescent dyes used. Apoptotic nuclei will appear brighter and show condensed, fragmented chromatin compared to the diffuse staining of healthy nuclei [3].
- Image Analysis: Quantify apoptosis by counting cells with characteristic morphological changes (condensed/fragmented nuclei, blebbed membranes) relative to the total number of cells.
The Scientist's Toolkit: Key Reagents for Apoptosis Research
The following reagents are essential for designing experiments to study apoptotic morphology.
Table 3: Essential Research Reagents for Apoptosis Detection
| Reagent / Assay | Function / Target | Key Application |
|---|---|---|
| Hoechst 33342 / DAPI | Cell-permeable DNA-binding fluorescent dyes [3] | Visualization of nuclear chromatin condensation and fragmentation by fluorescence microscopy [3]. |
| Annexin V (FITC conjugates) | Binds to phosphatidylserine (PS) exposed on the outer membrane leaflet [4] | Detection of early-stage apoptosis via flow cytometry or fluorescence microscopy [4]. |
| NucView 488 Caspase-3/7 Substrate | Fluorogenic substrate cleaved by active executioner caspases [4] | Real-time live-cell imaging of caspase activation during apoptosis [4]. |
| TUNEL Assay Kit | Labels 3'-OH ends of fragmented DNA using terminal deoxynucleotidyl transferase (TdT) [4] | Detection of DNA strand breaks, a late-stage apoptotic event, in fixed cells or tissues. |
| Staurosporine | Broad-spectrum protein kinase inhibitor [4] | A common and potent chemical inducer of intrinsic apoptosis in experimental settings [4]. |
| Propidium Iodide (PI) | Membrane-impermeant DNA dye that stains cells with compromised membranes [3] | Distinguishing late apoptosis/necrosis from early apoptosis (Annexin V+/PI-). |
| Anti-Cleaved Caspase-3 Antibody | Antibody specifically recognizing the active, cleaved form of caspase-3 [6] | Immunohistochemical or Western Blot confirmation of executioner caspase activation. |
The defining morphological features of apoptosis—from initial cell shrinkage to the formation of apoptotic bodies—provide an unambiguous and reliable signature of this programmed cell death pathway. While advanced molecular techniques continue to emerge, morphological assessment remains a cornerstone for validating apoptotic events, as it represents the functional outcome of activated death pathways. The integration of classical morphological techniques, such as light and electron microscopy, with modern fluorescent probes for molecular markers like activated caspases and externalized phosphatidylserine, offers the most powerful approach for researchers. This multi-parametric strategy ensures accurate identification and quantification of apoptosis, which is paramount for advancing our understanding of cell biology, disease mechanisms, and the development of novel therapeutics.
Programmed cell death, or apoptosis, is a genetically regulated process essential for development, tissue homeostasis, and disease prevention. This complex cellular program is executed by a conserved set of molecular players, primarily caspases, Bcl-2 family proteins, and specific nucleases that mediate DNA fragmentation. These components form an integrated network that ensures the controlled disassembly of cells without eliciting inflammatory responses. In cancer research and drug development, understanding these key executors is paramount, as malignant cells often develop resistance to apoptosis through mutations in these very pathways. A comprehensive understanding of these molecular mechanisms provides the foundation for targeted therapies that can overcome such resistance. This guide objectively compares the performance and characteristics of these core apoptotic executors, providing researchers with a framework for selecting appropriate detection methodologies and interpreting experimental data across different biological contexts.
Core Molecular Machinery of Apoptosis
Caspase Proteases: The Apoptotic Executioners
Caspases are a family of cysteine proteases that cleave their substrates at specific aspartic acid residues, serving as central regulators and effectors of programmed cell death pathways [10]. These enzymes are synthesized as inactive zymogens (pro-caspases) and undergo proteolytic activation in a cascade fashion, culminating in the controlled dismantling of cellular structures. Caspases are broadly categorized into initiator caspases (including caspases-2, -8, -9, and -10) that initiate the death signal, and effector caspases (including caspases-3, -6, and -7) that execute the death program by cleaving hundreds of cellular substrates [10] [6].
The morphological hallmarks of apoptosis, including cell shrinkage, membrane blebbing, and nuclear fragmentation, are directly mediated by caspase activity. For instance, caspase-3, the primary executioner caspase, cleaves key structural proteins such as lamin proteins to destabilize the nuclear envelope and gelsolin to disrupt the cytoskeleton [10]. Caspase-3 also cleaves the inhibitor of caspase-activated DNase (ICAD), thereby activating CAD which is responsible for internucleosomal DNA fragmentation [11]. Beyond apoptosis, certain caspases also regulate other forms of programmed cell death; caspase-1, -4, -5, and -11 cleave gasdermin D to initiate pyroptosis, while caspase-8 can inhibit necroptosis by cleaving key necroptosis mediators like RIPK1 and RIPK3 [10].
Table 1: Key Caspases in Programmed Cell Death Pathways
| Caspase | Primary Role/Type | Key Functions/Substrates | Activation Pathway/Context |
|---|---|---|---|
| Caspase-8 | Initiator | Activates caspase-3; cleaves BID; cleaves GSDMC; inhibits necroptosis by cleaving RIPK1/RIPK3 | Extrinsic apoptosis; Molecular switch between apoptosis, necroptosis, and pyroptosis [10] |
| Caspase-9 | Initiator | Cleaves and activates caspases-3 and -7; inhibits necroptosis by cleaving RIPK1 | Intrinsic (mitochondrial) apoptosis [10] |
| Caspase-3 | Effector | Cleaves PARP (disrupting DNA repair), lamin proteins (nuclear envelope destabilization), and GSDME (pyroptosis induction); activates CAD leading to DNA fragmentation | Downstream of both intrinsic and extrinsic pathways; primary executioner [10] [6] |
| Caspase-7 | Effector | Cleaves PARP; suppresses pyroptosis via non-canonical cleavage of GSDMD and GSDMB | Downstream of initiator caspases; executioner [10] |
| Caspase-1 | Inflammatory | Processes pro-inflammatory cytokines (IL-1β); cleaves GSDMD to trigger pyroptosis | Inflammasome activation; pyroptosis [10] |
Bcl-2 Family Proteins: Gatekeepers of Mitochondrial Apoptosis
The Bcl-2 family of proteins constitutes a critical regulatory checkpoint in the intrinsic apoptotic pathway, governing mitochondrial outer membrane permeabilization (MOMP), which represents a point of no commitment to cell death [6]. This protein family is characterized by the presence of Bcl-2 homology (BH) domains and is structurally and functionally divided into three main groups: (1) Anti-apoptotic members (e.g., Bcl-2, Bcl-xL) that preserve mitochondrial integrity, typically containing four BH domains; (2) Pro-apoptotic effectors (e.g., Bax, Bak) that directly mediate MOMP; and (3) BH3-only proteins (e.g., Bid, Bad, Bim) that sense cellular stress and initiate the apoptotic cascade by neutralizing anti-apoptotic members or directly activating effectors [12].
The functional equilibrium between these opposing factions determines cellular fate. In healthy cells, anti-apoptotic proteins like Bcl-2 bind and restrain pro-apoptotic effectors such as Bax and Bak. Upon apoptotic stimulation, BH3-only proteins are activated through transcriptional upregulation or post-translational modification, subsequently displacing the effectors from their anti-apoptotic counterparts. Freed Bax and Bak then oligomerize and integrate into the mitochondrial outer membrane, forming pores that facilitate the release of cytochrome c and other pro-apoptotic factors into the cytosol [6] [12]. Cytochrome c then complexes with Apaf-1 and procaspase-9 to form the apoptosome, which activates caspase-9 and initiates the caspase cascade [6].
Table 2: Key Bcl-2 Family Proteins and Their Functions
| Protein | Class | Key Functions/Mechanisms | Regulation/Interactions |
|---|---|---|---|
| Bcl-2 | Anti-apoptotic | Binds and inhibits pro-apoptotic Bax/Bak; maintains mitochondrial membrane integrity | Inhibited by BH3-only proteins (e.g., Bid, Bad); cleaved and inactivated by caspases [13] |
| Bcl-xL | Anti-apoptotic | Suppresses apoptosis by sequestering pro-apoptotic proteins; similar mechanism to Bcl-2 | Cleaved by caspases to generate a pro-apoptotic fragment; regulated by BH3-only proteins [13] |
| Bax | Pro-apoptotic Effector | Upon activation, translocates to mitochondria and oligomerizes to form pores in outer membrane, releasing cytochrome c | Activated by BH3-only proteins (e.g., tBid); inhibited by direct binding to Bcl-2/Bcl-xL [12] |
| Bak | Pro-apoptotic Effector | Similar pore-forming function as Bax; resides on mitochondrial membrane | Activated by BH3-only proteins; inhibited by Bcl-2/Bcl-xL [12] |
| Bid | BH3-only | Connects extrinsic and intrinsic pathways; cleaved by caspase-8 to generate active tBid, which activates Bax/Bak | Activated by caspase-8 cleavage; transcriptional regulation [10] |
DNA Fragmentation Machinery: The Point of No Return
The systematic degradation of nuclear DNA into discrete fragments is a biochemical hallmark of apoptosis and represents an irreversible commitment to cell death. This process is primarily mediated by the Caspase-Activated DNase (CAD), also known as DFF40 (DNA Fragmentation Factor 40) [14]. In healthy cells, CAD exists in an inactive complex with its inhibitor, ICAD (Inhibitor of CAD). During apoptosis, effector caspases, particularly caspase-3, cleave ICAD, thereby liberating and activating CAD [14]. Activated CAD then translocates to the nucleus and cleaves DNA at internucleosomal regions, generating the characteristic DNA ladder fragments in multiples of approximately 180-200 base pairs when separated by agarose gel electrophoresis.
An alternative caspase-independent DNA fragmentation pathway involves Apoptosis-Inducing Factor (AIF), a flavoprotein normally confined to the mitochondrial intermembrane space [14]. Upon apoptotic stimuli, AIF is released from mitochondria and translocates to the nucleus, where it collaborates with other factors such as cyclophilin A and ENDOG to trigger large-scale DNA fragmentation (~50 kbp) [14]. This pathway becomes particularly relevant in scenarios where caspase activation is impaired, offering a complementary mechanism to ensure cell death.
Comparative Analysis of Key Executors
The coordinated action of caspases, Bcl-2 proteins, and DNA fragmentation factors ensures the efficient and clean removal of cells. The following table provides a comparative analysis of their roles, regulatory mechanisms, and experimental detection.
Table 3: Comparative Analysis of Key Apoptotic Executors
| Parameter | Caspases | Bcl-2 Family Proteins | DNA Fragmentation Factors |
|---|---|---|---|
| Primary Function | Proteolytic cleavage of cellular substrates; coordination of dismantling process | Regulation of mitochondrial membrane permeability; decision-making checkpoint | Nuclear DNA degradation; irreversible commitment to death |
| Key Molecular Targets/Effectors | PARP, lamins, ICAD, gelsolin, gasdermins | Mitochondrial outer membrane; cytochrome c release | Chromosomal DNA; internucleosomal regions |
| Regulatory Mechanisms | Zymogen activation cascade; inhibition by IAPs | Protein-protein interactions (BH3 domain binding); phosphorylation; proteolytic cleavage | Inhibition by ICAD; subcellular localization (AIF) |
| Detection Methods | Cleavage assays (Western blot); fluorogenic substrates; activity probes | Western blot; immunoprecipitation; BH3 profiling; mitochondrial localization assays | TUNEL assay; DNA laddering; comet assay; histone H2AX phosphorylation |
| Functional Interdependence | Activates CAD by cleaving ICAD; cleaves and inactivates Bcl-2/Bcl-xL | Regulates caspase activation via cytochrome c release and apoptosome formation | Downstream consequence of caspase activation (CAD) or parallel pathway (AIF) |
| Experimental Notes | Activity does not always correlate with cleavage; consider multiple caspases | Functional assays (e.g., MOMP) more informative than expression levels alone | TUNEL can detect late-stage apoptosis; DNA laddering is a hallmark but not always observable |
Integrated Signaling Pathways in Apoptosis
The molecular executors of apoptosis do not function in isolation but rather operate within highly interconnected signaling networks. The following diagram illustrates the core apoptotic pathways and the functional relationships between caspases, Bcl-2 proteins, and DNA fragmentation factors.
Integrated Apoptotic Signaling Pathways: This diagram illustrates the key molecular interactions between caspases, Bcl-2 family proteins, and DNA fragmentation factors in extrinsic (death receptor) and intrinsic (mitochondrial) apoptosis pathways, culminating in the execution phase of cell death.
Experimental Protocols for Detection and Analysis
Caspase Activity Assay Using Fluorogenic Substrates
Principle: This protocol measures caspase enzymatic activity in cell lysates using synthetic peptides conjugated to fluorogenic leaving groups (e.g., 7-amino-4-methylcoumarin, AMC). Caspase cleavage releases the fluorophore, generating a measurable signal proportional to caspase activity [4].
Protocol:
- Cell Lysis: Harvest approximately 1×10^6 cells by centrifugation and lyse in 100 µL of cold caspase lysis buffer (50 mM HEPES pH 7.4, 100 mM NaCl, 0.1% CHAPS, 10% sucrose, 1 mM DTT, 0.1 mM EDTA) supplemented with protease inhibitors. Incubate on ice for 15 minutes, then centrifuge at 12,000 × g for 15 minutes at 4°C. Transfer the supernatant to a new tube.
- Protein Quantification: Determine protein concentration using a standard Bradford or BCA assay.
- Reaction Setup: In a black 96-well plate, combine:
- 50 µg of cell lysate protein
- Caspase reaction buffer (final concentration: 50 mM HEPES pH 7.4, 100 mM NaCl, 0.1% CHAPS, 10% sucrose, 10 mM DTT, 0.1 mM EDTA)
- Caspase-specific substrate (e.g., Ac-DEVD-AMC for caspase-3/7; final concentration: 50 µM)
- Bring total volume to 100 µL with reaction buffer
- Incubation and Measurement: Incubate the plate at 37°C for 1-2 hours. Measure fluorescence (excitation: 380 nm; emission: 460 nm) at 15-30 minute intervals using a microplate reader.
- Data Analysis: Calculate caspase activity as the change in fluorescence per minute per µg of protein. Compare treated samples to untreated controls and include a positive control (e.g., staurosporine-treated cells).
Assessment of Mitochondrial Apoptotic Regulation by BH3 Profiling
Principle: BH3 profiling evaluates the functional status of the Bcl-2 network by measuring mitochondrial membrane depolarization in response to synthetic BH3 domain peptides, providing insights into apoptotic priming and dependencies [12].
Protocol:
- Mitochondrial Isolation: Harvest 5×10^6 cells and wash with ice-cold PBS. Resuspend in mitochondrial isolation buffer (200 mM mannitol, 70 mM sucrose, 10 mM HEPES pH 7.5, 1 mM EGTA) and homogenize with a Dounce homogenizer (30-40 strokes). Centrifuge at 800 × g for 10 minutes at 4°C to remove nuclei and unbroken cells. Transfer supernatant and centrifuge at 10,000 × g for 15 minutes at 4°C. The pellet contains mitochondria.
- Membrane Potential Measurement: Resuspend mitochondria in experimental buffer (150 mM KCl, 10 mM HEPES pH 7.5, 1 mM EGTA, 5 mM succinate, 1 µM JC-1 dye). Aliquot 50 µg of mitochondria per well in a 96-well plate.
- BH3 Peptide Addition: Add synthetic BH3 peptides (e.g., BIM, BAD, NOXA; final concentration: 1-10 µM) to respective wells. Include controls: DMSO (negative control) and FCCP (positive control for depolarization).
- Incubation and Reading: Incubate at 37°C for 60-90 minutes. Measure JC-1 fluorescence (excitation: 490 nm; emission: 530 nm for monomeric form, 590 nm for J-aggregates) using a plate reader.
- Data Interpretation: Calculate the percentage of depolarization relative to controls. Selective sensitivity to specific BH3 peptides indicates functional dependencies on particular anti-apoptotic Bcl-2 family members.
DNA Fragmentation Analysis by TUNEL Assay
Principle: The Terminal deoxynucleotidyl transferase dUTP Nick End Labeling (TUNEL) assay detects DNA strand breaks characteristic of apoptosis by enzymatically incorporating modified nucleotides at the 3'-hydroxyl ends of fragmented DNA [4].
Protocol:
- Cell Fixation and Permeabilization: Culture cells on glass coverslips. After treatment, fix with 4% paraformaldehyde in PBS for 30 minutes at room temperature. Wash with PBS and permeabilize with 0.1% Triton X-100 in 0.1% sodium citrate for 2 minutes on ice.
- Labeling Reaction: Prepare TUNEL reaction mixture according to manufacturer's instructions (typically containing terminal deoxynucleotidyl transferase and fluorescein-dUTP). Apply 50 µL of TUNEL reaction mixture to each sample and incubate in a humidified chamber for 60 minutes at 37°C in the dark.
- Counterstaining and Mounting: Wash coverslips three times with PBS. Counterstain nuclei with DAPI (300 nM in PBS) for 5 minutes. Wash and mount coverslips onto glass slides using antifade mounting medium.
- Microscopy and Analysis: Visualize using a fluorescence microscope with appropriate filter sets. TUNEL-positive nuclei will display green fluorescence. Quantify the percentage of TUNEL-positive cells by counting multiple fields (minimum 300 total cells per condition).
Research Reagent Solutions Toolkit
Table 4: Essential Reagents for Apoptosis Research
| Reagent/Category | Specific Examples | Primary Research Application | Key Considerations |
|---|---|---|---|
| Caspase Substrates | Ac-DEVD-AMC (caspase-3/7), Ac-IETD-AFC (caspase-8), Ac-LEHD-AFC (caspase-9) | Fluorometric activity assays; kinetic studies | Specificity varies; use specific inhibitors to confirm signal origin [4] |
| Caspase Inhibitors | Z-VAD-FMK (pan-caspase), Z-DEVD-FMK (caspase-3), Z-IETD-FMK (caspase-8) | Determining caspase-dependence of cell death; pathway dissection | Irreversible inhibitors; cell-permeable forms available for live-cell studies |
| BH3 Domain Peptides | BIM BH3, BAD BH3, MS1 BH3, HRK BH3 | BH3 profiling; mitochondrial priming assays; identifying Bcl-2 dependencies | Different peptides have distinct binding specificities to anti-apoptotic proteins [12] |
| Antibodies | Anti-cleaved caspase-3, Anti-PARP (cleaved), Anti-Bax, Anti-Bcl-2, Anti-cytochrome c | Western blotting; immunohistochemistry; flow cytometry | Validation for specific applications crucial; phospho-specific antibodies available for activation states |
| DNA Fragmentation Detection | TUNEL assay kits, DNA laddering kits, Anti-phospho-H2A.X (Ser139) | Detecting late-stage apoptosis; genotoxic stress response | TUNEL can detect late-stage apoptosis and necrosis; combine with other markers for specificity [4] |
| Live-Cell Apoptosis Probes | NucView 488 caspase-3 substrate, Annexin V conjugates, TMRE (mitochondrial membrane potential) | Real-time apoptosis monitoring; kinetic studies in live cells | Annexin V requires calcium and detects phosphatidylserine exposure [4] |
| Apoptosis Inducers | Staurosporine, Doxorubicin, Etoposide, Anti-FAS antibody | Positive controls; inducing apoptosis in experimental systems | Different inducers activate distinct pathways (intrinsic vs. extrinsic) [8] [4] |
Apoptosis, or programmed cell death, is a fundamental process essential for embryonic development, tissue homeostasis, and the elimination of damaged or infected cells [15] [16]. This genetically regulated process is characterized by distinct morphological changes, including cell shrinkage, chromatin condensation, membrane blebbing, and nuclear fragmentation, culminating in the formation of apoptotic bodies that are swiftly phagocytosed without inducing inflammation [17] [18]. At the molecular level, apoptosis proceeds via two principal signaling cascades: the intrinsic and extrinsic pathways. While both pathways converge on the activation of executioner caspases, their initiation mechanisms, key regulatory molecules, and roles in physiology and disease exhibit critical differences [19] [15]. Understanding this complex signal transduction landscape is crucial for researchers and drug development professionals aiming to modulate cell death in diseases such as cancer, neurodegenerative disorders, and autoimmune conditions. This guide provides a detailed comparison of these pathways, supported by experimental data and methodologies relevant to modern laboratory practice.
Pathway Mechanisms: Molecular Initiators and Executioners
The Extrinsic Pathway: Death Receptor-Mediated Apoptosis
The extrinsic pathway is initiated outside the cell through the engagement of death receptors (DRs) on the cell surface [19] [16]. These receptors, belonging to the tumor necrosis factor (TNF) receptor superfamily, include Fas, TNFR1, DR4, and DR5 [19]. Their activation occurs when specific extracellular death ligands, such as Fas Ligand (FasL) or TNF-α, bind to them, triggering receptor oligomerization [19] [15].
The core signaling event is the formation of the Death-Inducing Signaling Complex (DISC). Upon ligand binding, the adapter protein FADD (Fas-Associated via Death Domain) is recruited to the intracellular death domain of the receptor. FADD then recruits procaspase-8 via shared death effector domains, forming the DISC [19]. Within the DISC, procaspase-8 undergoes autocatalytic activation through proximity-induced dimerization [19] [16]. The activated caspase-8 then initiates a protease cascade, directly cleaving and activating the executioner caspases-3 and -7, which dismantle the cell by cleaving key structural and regulatory proteins [19] [16].
A critical regulatory node in this pathway is the cellular FLICE-inhibitory protein (c-FLIP), which can bind to FADD and procaspase-8, thereby inhibiting caspase-8 activation at the DISC and suppressing the apoptotic signal [19]. Furthermore, crosstalk with the intrinsic pathway can amplify the death signal through caspase-8-mediated cleavage of the Bcl-2 family protein Bid. Truncated Bid (tBid) translocates to mitochondria, promoting mitochondrial outer membrane permeabilization (MOMP) and thus amplifying the apoptotic cascade [19] [16].
Figure 1: The Extrinsic Apoptosis Pathway. This diagram illustrates the sequence from death ligand binding to caspase activation, highlighting the critical DISC complex and crosstalk with the intrinsic pathway via Bid.
The Intrinsic Pathway: Mitochondrial-Mediated Apoptosis
The intrinsic pathway, also known as the mitochondrial pathway, is initiated from within the cell in response to severe internal stress signals [19] [15]. These stresses include DNA damage, oxidative stress, growth factor withdrawal, and oncogene activation [19]. A key sensor and activator of this pathway is the tumor suppressor protein p53, which becomes stabilized in response to DNA damage and transcriptionally activates pro-apoptotic genes from the Bcl-2 family, such as Bax, Noxa, and PUMA [19].
The pathway's pivotal event is Mitochondrial Outer Membrane Permeabilization (MOMP), a decisive step that is tightly regulated by the balance between pro- and anti-apoptotic members of the Bcl-2 protein family [19] [16]. Anti-apoptotic proteins (e.g., Bcl-2, Bcl-xL) preserve mitochondrial integrity, while pro-apoptotic "executioner" proteins (Bax, Bak) are responsible for pore formation. Cellular stress tips the balance in favor of the pro-apoptotic signals, leading to Bax/Bak activation and MOMP [16].
MOMP leads to the release of several apoptogenic factors from the mitochondrial intermembrane space into the cytosol. These include cytochrome c, Smac/DIABLO, and AIF [19] [15]. The release of cytochrome c is a critical event: it binds to Apaf-1 in the cytosol, forming a complex called the apoptosome in the presence of dATP. The apoptosome recruits and activates procaspase-9 [19] [16]. Activated caspase-9 then cleaves and activates the executioner caspases-3 and -7, leading to cell dismantling. Smac/DIABLO promotes apoptosis by neutralizing Inhibitor of Apoptosis Proteins (IAPs), which normally suppress caspase activity [19].
Figure 2: The Intrinsic Apoptosis Pathway. This diagram shows the sequence from cellular stress detection to caspase activation, emphasizing the central role of mitochondrial outer membrane permeabilization and the Bcl-2 protein family.
Comparative Analysis: Intrinsic vs. Extrinsic Pathways
The following tables provide a consolidated comparison of the core characteristics, key molecular components, and functional roles of the intrinsic and extrinsic apoptosis pathways.
Table 1: Core Characteristics and Key Molecules of Apoptotic Pathways
| Feature | Extrinsic Pathway | Intrinsic Pathway |
|---|---|---|
| Initiating Stimulus | Extracellular death ligands (e.g., FasL, TNF-α) [19] [15] | Intracellular stress (e.g., DNA damage, hypoxia, ER stress) [19] [15] |
| Initiation Site | Plasma membrane [19] | Mitochondria [19] [16] |
| Key Initiator Molecule | Death Receptors (Fas, TNFR1) [19] | Bcl-2 Family Proteins [19] [16] |
| Key Adapter Complex | Death-Inducing Signaling Complex (DISC) [19] [16] | Apoptosome [19] [16] |
| Key Initiator Caspase | Caspase-8 [19] [16] | Caspase-9 [19] [16] |
| Regulatory Proteins | c-FLIP (inhibits DISC) [19] | Bcl-2/Bcl-xL (anti-apoptotic), Bax/Bak (pro-apoptotic) [19] [16] |
| Mitochondrial Involvement | Indirect (via Bid cleavage for amplification) [19] | Direct (central role via MOMP) [19] [15] |
Table 2: Physiological Roles and Dysregulation in Disease
| Aspect | Extrinsic Pathway | Intrinsic Pathway |
|---|---|---|
| Primary Physiological Role | Immune regulation; deletion of autoreactive T-cells; immune privilege [15] | Tissue homeostasis; elimination of damaged or stressed cells [15] |
| Associated Diseases (Due to Defects) | Autoimmunity (e.g., ALPS), chronic inflammatory diseases [15] | Cancer, neurodegenerative disorders (e.g., Alzheimer's, Parkinson's) [15] [20] |
| Therapeutic Targeting Examples | Agonistic anti-DR5/DR4 antibodies (e.g., HexaBody DR5/DR5) in clinical trials [15] | BH3 mimetics (e.g., Venetoclax) inhibiting Bcl-2; p53-targeting therapies [15] [16] |
The Scientist's Toolkit: Essential Reagents and Assays
A purpose-dependent approach is critical for accurately detecting and quantifying apoptosis, leveraging techniques based on morphology, biochemistry, and molecular biology [17]. The following table details key reagents and tools essential for studying these pathways.
Table 3: Key Research Reagent Solutions for Apoptosis Detection
| Reagent/Assay | Function/Principle | Key Applications |
|---|---|---|
| Annexin V Conjugates | Binds to phosphatidylserine (PS) exposed on the outer leaflet of the plasma membrane in early apoptosis [17] [16]. | Flow cytometry or fluorescence microscopy to detect early apoptosis, often combined with a viability dye (e.g., PI) to distinguish from late apoptosis/necrosis [16]. |
| Caspase Activity Assays | Fluorometric or colorimetric substrates that are cleaved by active caspases, producing a detectable signal [17]. | Quantifying activity of initiator (Caspase-8, -9) and executioner (Caspase-3/7) caspases to determine pathway-specific activation and apoptotic commitment [18] [16]. |
| TUNEL Assay Kits | Terminal deoxynucleotidyl transferase (TdT) labels the 3'-OH ends of fragmented DNA with a detectable dUTP, a hallmark of late-stage apoptosis [17] [18]. | Detecting and quantifying apoptotic cells in situ (tissue sections) or by flow cytometry. Requires careful controls to avoid false positives from necrotic DNA fragmentation [17] [16]. |
| Mitochondrial Dyes (e.g., TMRE, JC-1) | Accumulate in active mitochondria based on membrane potential; loss of fluorescence indicates loss of ΔΨm, an early event in intrinsic apoptosis [17] [16]. | Flow cytometry or fluorescence microscopy to assess mitochondrial health and early intrinsic pathway activation [16]. |
| Antibodies to Apoptotic Markers | Detect specific protein cleavages (e.g., Cleaved Caspase-3, Cleaved PARP) or localization changes (e.g., Bax, Cytochrome c) [16]. | Western blot, immunofluorescence, and immunohistochemistry to confirm pathway activation and assess molecular events in fixed cells or tissues [16]. |
| BH3 Profiling Peptides | Synthetic peptides mimicking BH3-only proteins used to measure mitochondrial priming and dependence on anti-apoptotic Bcl-2 proteins [16]. | Functional assessment of a cell's proximity to the apoptotic threshold, predicting sensitivity to chemotherapeutics or BH3 mimetics [16]. |
Integrated Experimental Workflows
To obtain a comprehensive understanding of apoptotic signaling, integrating multiple detection methods that capture different stages and characteristics of cell death is essential. The workflow below illustrates a combined morphological and molecular approach.
Figure 3: Integrated Workflow for Apoptosis Detection. This diagram outlines a sequential experimental strategy, combining early-stage biochemical assays with mid/late-stage molecular and morphological analyses for a comprehensive assessment.
Detailed Protocol: Differentiating Pathways via Caspase Activation and Mitochondrial Involvement
This protocol leverages integrated methods to delineate the primary apoptosis pathway activated in a cell population.
1. Experimental Setup and Sample Preparation:
- Treat cells with a known extrinsic inducer (e.g., recombinant FasL), an intrinsic inducer (e.g., Camptothecin, a DNA-damaging agent), and a negative control.
- Harvest cells at multiple time points (e.g., 0, 3, 6, 12, 24 hours) post-treatment to capture kinetic changes.
2. Early-Phase Analysis (Flow Cytometry):
- Annexin V/Propidium Iodide (PI) Staining: Resuspend ~1x10⁶ cells in Annexin V binding buffer. Add FITC-conjugated Annexin V and PI according to manufacturer's instructions. Analyze by flow cytometry within 1 hour. This identifies cells in early (Annexin V+/PI-) and late (Annexin V+/PI+) apoptosis/necrosis [16].
- Mitochondrial Membrane Potential (ΔΨm) Assay: In parallel, stain ~1x10⁶ cells with TMRE (e.g., 100-500 nM) for 20-30 minutes at 37°C. Analyze by flow cytometry. A decrease in TMRE fluorescence indicates loss of ΔΨm, a key event in the intrinsic pathway [16].
3. Mid-Phase Analysis (Biochemical Assays):
- Caspase Activity Assay: Lyse cells and incubate lysates with fluorogenic substrates specific for caspase-8 (IETD-afc), caspase-9 (LEHD-afc), and caspase-3/7 (DEVD-afc). Measure the release of the fluorescent cleaved product over time using a plate reader. Preferential activation of caspase-8 suggests extrinsic pathway, while caspase-9 activation points to intrinsic [16].
- Western Blot Analysis: Resolve cell lysates by SDS-PAGE and transfer to a membrane. Probe with antibodies against:
- Cleaved Caspase-8 and Cleaved Caspase-9 to identify the active initiator caspase.
- Cleaved Caspase-3 and Cleaved PARP as markers of executioner caspase activity and downstream apoptotic signaling.
- Cytochrome c in cytosolic fractions to confirm mitochondrial release.
4. Late-Phase and Morphological Analysis:
- TUNEL Staining: Fix cells or tissue sections and perform TUNEL assay according to kit instructions. Use DNase I-treated samples as a positive control. Detect labeled DNA fragments via fluorescence microscopy or flow cytometry. This confirms the late-stage hallmark of apoptosis but should be interpreted alongside other data to avoid false positives from necrosis [17] [18] [16].
- Nuclear Morphology (Fluorescence Microscopy): Stain fixed cells with DNA-binding dyes like Hoechst 33342 or DAPI. Analyze for characteristic apoptotic morphology under a fluorescence microscope: chromatin condensation, nuclear shrinkage, and fragmentation [17].
5. Data Interpretation:
- A strong apoptotic response with caspase-8 activation, minimal early ΔΨm loss, and cleaved Bid predominantly indicates the extrinsic pathway.
- A response initiated by caspase-9 activation, concurrent loss of ΔΨm, and cytochrome c release confirms the intrinsic pathway.
- In many cases, crosstalk occurs, evidenced by initial caspase-8 activation followed by caspase-9 activation and ΔΨm loss.
The intrinsic and extrinsic apoptosis pathways represent two sophisticated and often interconnected signaling cascades that govern programmed cell death. While they are initiated by distinct stimuli and utilize unique upstream components, their convergence on a common execution phase underscores the efficiency and importance of this biological process. For researchers and drug developers, a precise understanding of this signal transduction landscape, coupled with the strategic application of integrated morphological and molecular detection methods, is paramount. This knowledge not only deepens our fundamental understanding of cellular biology but also unlocks the potential for novel, targeted therapies in oncology, neurodegeneration, and beyond. The continued refinement of assays and reagents will further empower the scientific community to dissect these pathways with ever-greater precision, driving forward both basic research and clinical translation.
Programmed cell death, or apoptosis, is a fundamental process in living organisms, crucial for development, tissue homeostasis, and the pathogenesis of various diseases. For researchers and drug development professionals, accurately detecting and quantifying apoptosis is paramount. The scientific community primarily relies on two distinct yet interconnected approaches: morphological analysis, which documents the physical demise of the cell, and biochemical assays, which probe the molecular machinery executing the death sentence. While each approach has its proponents, this guide argues that their integration is not merely beneficial but essential for a robust and accurate assessment of cell death. Relying on a single method risks misinterpretation, as the complex and dynamic process of apoptosis cannot be fully captured from a single perspective [21]. This integrated approach provides a more comprehensive understanding, which is critical for applications ranging from basic cancer research to the evaluation of novel anticancer therapies [6] [8].
Morphological Hallmarks of Apoptosis
The morphological changes during apoptosis are distinctive and represent the classical standard for its identification. These changes, first systematically defined using transmission electron microscopy, unfold in a coordinated sequence [11] [18].
The key morphological features include:
- Cellular Condensation: The cell shrinks in volume, with the cytoplasm becoming denser [21] [18].
- Nuclear Fragmentation: The chromatin condenses and margins against the nuclear envelope (pyknosis), followed by the breaking up of the nucleus into discrete fragments (karyorrhexis) [6] [18].
- Membrane Blebbing: The cell membrane undergoes dynamic protrusion, leading to the formation of "blebs" [8].
- Formation of Apoptotic Bodies: The cell fragments into multiple, membrane-bound apoptotic bodies containing intact organelles and nuclear fragments [6] [18].
- Phagocytosis: The apoptotic bodies are swiftly engulfed by nearby phagocytic cells without eliciting an inflammatory response, making apoptosis a "silent" form of cell death [21] [18].
Advanced, label-free imaging techniques like Full-Field Optical Coherence Tomography (FF-OCT) now allow for high-resolution, real-time visualization of these events, such as echinoid spine formation, cell contraction, and filopodia reorganization in living cells [8]. It is critical to distinguish these features from necrosis, which is characterized by cell swelling, rupture of the plasma membrane, and spillage of intracellular contents, which provokes a strong inflammatory response [6] [21].
Biochemical Hallmarks of Apoptosis
Underlying the visible morphological changes is a cascade of biochemical events. These molecular signatures provide the basis for numerous quantitative assays.
The principal biochemical hallmarks are:
- Caspase Activation: Caspases, a family of cysteine-aspartic proteases, are the central executioners of apoptosis. Initiator caspases (e.g., caspase-8, -9) are activated early, triggering a cascade that activates effector caspases (e.g., caspase-3, -7) which then cleave key cellular substrates [6] [21]. The cleavage of caspase-3 is widely considered a gold-standard biomarker for apoptosis [6].
- DNA Fragmentation: Activated endonucleases cleave nuclear DNA at internucleosomal sites, leading to a characteristic "ladder" pattern when analyzed by gel electrophoresis [11] [18].
- Phosphatidylserine (PS) Externalization: In viable cells, PS is confined to the inner leaflet of the plasma membrane. During early apoptosis, PS is translocated to the outer leaflet, where it can be detected by its affinity for Annexin V [6].
- Mitochondrial Outer Membrane Permeabilization (MOMP): A pivotal event in the intrinsic pathway, MOMP leads to the release of pro-apoptotic factors like cytochrome c into the cytosol, which promotes the formation of the apoptosome and activation of caspase-9 [22] [6].
Table 1: Key Biochemical Biomarkers in Apoptosis Detection
| Biomarker | Detection Method | Stage of Detection | Significance |
|---|---|---|---|
| Activated Caspase-3/7 | Fluorogenic substrates, Western Blot | Mid-stage | Key executioner caspases; indicates irreversible commitment to apoptosis [6]. |
| Phosphatidylserine (PS) | Annexin V staining (often with flow cytometry) | Early-stage | One of the earliest indicators; detectable before loss of membrane integrity [6]. |
| DNA Fragmentation | TUNEL Assay, Gel Electrophoresis | Late-stage | Hallmark of late apoptosis; TUNEL is highly sensitive but requires careful controls to avoid false positives [11] [18]. |
| Cytochrome c Release | Western Blot, Immunofluorescence | Mid-stage | Specific marker for the intrinsic (mitochondrial) apoptosis pathway [6]. |
A Comparative Analysis: Strengths and Limitations
Morphological and biochemical methods offer complementary strengths and limitations, as summarized in the table below. Their combined use mitigates the weaknesses inherent in either approach alone.
Table 2: Comparison of Morphological and Biochemical Apoptosis Detection Methods
| Feature | Morphological Methods | Biochemical Methods |
|---|---|---|
| Primary Readout | Visual structural changes (e.g., blebbing, condensation) [8] [18] | Molecular events (e.g., enzyme activity, protein cleavage) [6] [21] |
| Key Strengths | - Provides spatial context and single-cell resolution.- Considered the "gold standard" for definitive identification.- Label-free techniques (e.g., FF-OCT) allow live-cell imaging without perturbation [8]. | - Higher throughput and easier quantification.- Can detect early, pre-morphological events (e.g., PS exposure).- Amenable to multiplexing and high-content screening. |
| Key Limitations | - Lower throughput and can be time-consuming to analyze.- Requires expertise for accurate interpretation.- Fixed samples provide only a temporal snapshot. | - Provides limited spatial and structural information.- Susceptible to false positives/negatives (e.g., TUNEL in necrotic cells) [18].- Often requires cell lysis or staining, disrupting native state. |
| Optimal Use Case | - Validating findings from biochemical screens.- Studying complex tissues or heterogeneous cell populations.- Real-time kinetic studies of single cells. | - Rapid screening of drug candidates or genetic manipulations.- Quantifying apoptosis levels across large sample sets.- Dissecting specific molecular pathways. |
Experimental Protocols for an Integrated Workflow
To illustrate the power of integration, the following protocols detail how to combine these approaches in a single experimental workflow, using the example of doxorubicin-induced apoptosis in HeLa cells.
Protocol 1: Inducing and Imaging Morphological Changes with FF-OCT
This protocol leverages label-free imaging to track morphological dynamics in real-time [8].
- Cell Preparation: Culture HeLa cells as a monolayer in appropriate medium under standard conditions (37°C, 5% CO₂).
- Apoptosis Induction: Treat cells with 5 μmol/L doxorubicin. This chemotherapeutic agent intercalates into DNA, causing double-strand breaks and activating the p53 pathway, leading to apoptosis [8].
- FF-OCT Imaging: Use a custom-built time-domain FF-OCT system with a broadband halogen light source and a Linnik-configured interferometer with 40x water-immersion objectives.
- Data Acquisition: Initiate imaging immediately after doxorubicin addition. Acquire en face (x-y) cross-sectional images continuously at 20-minute intervals for up to 180 minutes. Use a piezoelectric actuator for phase-shifting to isolate sample reflection information.
- 3D Reconstruction and Analysis: Stack acquired tomographic images to reconstruct 3D surface topography. Quantify morphological changes such as cell contraction, membrane blebbing, and echinoid spine formation.
Protocol 2: Quantifying Biochemical Hallmarks via Flow Cytometry
This protocol provides a quantitative, population-level assessment of apoptosis through two key biochemical markers.
- Cell Harvesting: After a desired incubation time with doxorubicin (e.g., 4-24 hours), harvest both adherent and floating cells.
- Annexin V/Propidium Iodide (PI) Staining:
- Resuspend cell pellet in a binding buffer containing fluorescently conjugated Annexin V.
- Add PI, a membrane-impermeable DNA dye that labels necrotic cells.
- Incubate for 15 minutes in the dark.
- Analyze by flow cytometry within 1 hour.
- Data Interpretation:
- Annexin V-negative / PI-negative: Viable cells.
- Annexin V-positive / PI-negative: Early apoptotic cells (PS externalized, membrane intact).
- Annexin V-positive / PI-positive: Late apoptotic or necrotic cells.
Visualizing the Integrated Pathway and Workflow
The following diagrams illustrate the molecular pathway of apoptosis and the synergistic relationship between morphological and biochemical detection methods.
Diagram 1: Key signaling pathways in apoptosis execution. Caspase-3 activation is a central event leading to both morphological and biochemical changes.
Diagram 2: An integrated experimental workflow. Combining morphological and biochemical assays provides complementary data streams that, when integrated, lead to a more robust and validated conclusion.
The Scientist's Toolkit: Essential Reagents and Solutions
Successful apoptosis research requires a suite of reliable reagents and tools. The following table catalogs key solutions for an integrated approach.
Table 3: Research Reagent Solutions for Apoptosis Detection
| Research Reagent / Tool | Function / Application | Key Consideration |
|---|---|---|
| Fluorescently-Labeled Annexin V | Detects phosphatidylserine (PS) externalization on the outer leaflet of the cell membrane during early apoptosis. Used in flow cytometry and microscopy [6]. | Should be used in combination with a viability dye (e.g., PI) to distinguish early apoptosis (Annexin V+/PI-) from late apoptosis/necrosis (Annexin V+/PI+). |
| Caspase Activity Assays | Fluorogenic or colorimetric substrates that emit signal upon cleavage by active caspases (e.g., Caspase-3/7). Allow for kinetic quantification of apoptosis progression [6] [21]. | Highly specific for the apoptotic pathway. Can be adapted for high-throughput screening in multi-well plates. |
| TUNEL Assay Kits | Labels DNA strand breaks (a late apoptotic event) in situ. Can be used on tissue sections or cells for fluorescence microscopy or flow cytometry [11] [18]. | Prone to false positives from non-apoptotic DNA damage (e.g., necrosis). Requires careful standardization and controls, including DNAse-treated positive controls [18]. |
| Anti-Cleaved Caspase-3 Antibodies | Highly specific antibodies for detecting the active, cleaved form of caspase-3 via Western Blot or immunofluorescence. Considered a gold-standard biochemical confirmatory test [6]. | Provides definitive evidence of apoptotic pathway activation. Excellent for validating results from other biochemical screens. |
| Optogenetic Systems (e.g., OptoBAX) | Utilizes light-sensitive proteins (e.g., Cry2/CIB) to recruit pro-apoptotic proteins like BAX to mitochondria with high temporal precision, inducing MOMP and apoptosis on demand [22]. | Enables precise spatiotemporal control over apoptosis initiation, ideal for studying early kinetics and downstream events without chemical inducers. |
| High-Resolution Label-Free Imaging (FF-OCT) | Allows for real-time, non-invasive visualization of apoptotic morphological changes in live cells without the need for stains or labels [8]. | Avoids potential artifacts from fluorescent labels or sample fixation. Ideal for long-term kinetic studies and monitoring single-cell dynamics. |
In the meticulous study of apoptosis, there is no single "best" method. Instead, the most powerful and reliable approach lies in the strategic integration of morphological and biochemical data. Morphology provides the undeniable visual evidence of the cell's fate, while biochemistry offers sensitive, quantitative, and early insights into the molecular execution. As demonstrated by advanced tools like FF-OCT for live-cell imaging and optogenetic switches for precise pathway activation, modern research demands a multi-faceted perspective [22] [8]. For researchers and drug developers aiming to make definitive conclusions, leveraging the complementary strengths of both approaches is the key to unlocking a deeper, more accurate understanding of programmed cell death.
A Practical Toolkit: Techniques for Morphological and Molecular Apoptosis Analysis
In the study of complex biological processes such as apoptosis, the integration of morphological with molecular detection methods provides a more comprehensive physiological view. Imaging technologies form the cornerstone of morphological analysis, enabling researchers to visualize cellular and subcellular changes in real-time. This guide objectively compares the performance of three pivotal imaging modalities—Light Microscopy, Electron Microscopy, and the emerging label-free Full-Field Optical Coherence Tomography (FF-OCT)—within the specific context of apoptosis research. By presenting quantitative data, detailed experimental protocols, and key reagents, this article serves as a reference for researchers and drug development professionals selecting the optimal imaging tools for their investigative needs.
The following table summarizes the core characteristics and performance metrics of the three imaging techniques, highlighting their respective strengths in apoptosis research.
Table 1: Performance Comparison of Key Morphological Imaging Techniques
| Feature | Light Microscopy | Electron Microscopy (EM) | Label-Free FF-OCT |
|---|---|---|---|
| Max Resolution (Axial/Lateral) | ~200 nm (diffraction-limited) | Sub-nanometer [23] | Sub-micrometer (e.g., <1 µm) [24] [8] |
| Key Strength | Live-cell imaging, multiplexed fluorescence | Ultra-high resolution, nanoscale structural detail | Label-free, non-invasive, 3D dynamics |
| Key Limitation | Phototoxicity, photobleaching, requires labeling [25] | Requires sample fixation (not for live cells) [8] | Lower resolution than EM; contrast from endogenous properties |
| Live-Cell Apoptosis Imaging | Possible, but with dye/phototoxicity concerns [8] | Not possible | Excellent; enables longitudinal studies over weeks [24] |
| Sample Preparation | Staining or transfection | Fixation, sectioning, staining [8] | Minimal; no labeling or fixation required [8] |
| Imaging Depth | Limited by scattering | Surface or thin sections | ~1 mm in organoids [24] |
| Data on Apoptosis Features | Membrane blebbing, chromatin condensation | Detailed ultrastructural changes (e.g., organelle disruption) | Echinoid spines, membrane blebbing, cell contraction, filopodia reorganization [8] |
Detailed Experimental Protocols
To ensure reproducibility, this section outlines standard methodologies for employing these techniques in apoptosis detection.
Protocol for Label-Free FF-OCT in Apoptosis Detection
This protocol, adapted from a recent study, details the steps for monitoring drug-induced apoptosis in HeLa cells using a custom-built time-domain FF-OCT system [8].
- Cell Culture and Plating: HeLa cells are cultured as a monolayer in Dulbecco’s Modified Eagle’s Medium (DMEM) under standard conditions (37°C, 5% CO₂).
- Apoptosis Induction: To induce apoptosis, doxorubicin is added to the culture medium at a final concentration of 5 μmol/L. As a positive control for necrosis, a separate cell group can be treated with a high concentration (e.g., 99%) of ethanol [8].
- FF-OCT System Setup: A time-domain FF-OCT system with a Linnik interferometer configuration is used.
- Light Source: A broadband halogen lamp (center wavelength: 650 nm, spectral width: 200 nm) to achieve sub-micrometer axial resolution.
- Objectives: Identical 40x water-immersion objectives (NA: 0.8) in both reference and sample arms.
- Detection: A CCD camera captures 2D interference images.
- Image Acquisition: Imaging is initiated immediately after drug administration. The coherence gate is scanned in the z-axis using a precision linear stage or piezoelectric actuator. En face (x-y) cross-sectional images are acquired at successive depths. For dynamic monitoring, images are captured continuously at set intervals (e.g., every 20 minutes) for up to 180 minutes [8].
- 3D Reconstruction and Analysis: Acquired tomographic image stacks are processed to reconstruct three-dimensional surface topography and visualize internal cellular structures. Morphological changes characteristic of apoptosis are identified and quantified.
Protocol for High-Resolution Validation with Electron Microscopy
While not suitable for live-cell imaging, EM provides the gold standard for validating ultrastructural apoptotic features observed via other modalities. The following workflow diagram illustrates a correlative approach, using EM to validate subcellular findings from OCT.
The specific sample preparation and imaging steps for EM are [26]:
- Sample Fixation: Eyes were enucleated and processed for EM, involving chemical fixation to preserve tissue structure.
- Sectioning: The fixed tissue is embedded in resin and cut into ultra-thin sections (typically 60-90 nm thick).
- Staining and Imaging: Sections are stained with heavy metals (e.g., lead citrate, uranium acetate) to enhance contrast and imaged with a high-resolution Transmission Electron Microscope (TEM) or Scanning EM (SEM).
- Analysis and Correlation: Subcellular organelles and features are meticulously annotated. The micrometer-scale axial reflectivity profiles from OCT are then quantitatively compared with the organelle distributions from EM using well-accepted reference surfaces (e.g., the External Limiting Membrane) for alignment [26].
The Scientist's Toolkit: Essential Research Reagents and Materials
Successful execution of the described experiments requires specific reagents and instruments. The following table lists key solutions for apoptosis imaging studies.
Table 2: Essential Research Reagent Solutions for Apoptosis Imaging
| Item | Function/Application | Example Usage in Context |
|---|---|---|
| Doxorubicin HCl | Chemotherapeutic agent; induces apoptosis by intercalating into DNA and inhibiting topoisomerase II. | Used at 5 μmol/L final concentration to induce apoptotic pathway in HeLa cells for FF-OCT observation [8]. |
| Ethanol (Absolute) | Chemical agent; induces rapid, uncontrolled necrosis by disrupting membrane integrity and denaturing proteins. | Serves as a necrosis inducer in control experiments to contrast morphological differences from apoptosis [8]. |
| Dulbecco's Modified Eagle Medium (DMEM) | Standard cell culture medium providing essential nutrients and environment for maintaining HeLa cells. | Used for routine subculturing and as the base medium during imaging experiments [8]. |
| Custom FF-OCT System | Label-free, non-invasive imaging of 3D cellular morphology and dynamics in live cells. | Based on a Linnik interferometer with a halogen lamp and 40x water-immersion objectives for monitoring apoptosis [8]. |
| C57BL/6J Mice | In vivo model organism with pigmented retina; used for validating imaging findings in a physiological context. | Employed in correlative OCT/EM studies to investigate subcellular features in the outer retina [26]. |
| Water-Immersion Objective (40x, NA 0.8) | Microscope objective designed to interface with aqueous samples, minimizing spherical aberration for high-resolution imaging. | Used in both arms of the Linnik interferometer in the FF-OCT system to achieve subcellular resolution [8]. |
Integrated Workflow for Apoptosis Research
The true power of modern microscopy lies in the correlative integration of multiple techniques. The following workflow conceptualizes a comprehensive strategy for apoptosis research, leveraging the strengths of each imaging modality.
This integrated workflow allows researchers to first identify dynamic apoptotic events in live cells using non-invasive FF-OCT, then zoom in for higher-resolution morphological context using visible-light OCT, and finally resolve definitive ultrastructural details using EM on fixed samples, thereby providing a complete picture from the whole cell down to the nanoscale.
The accurate detection of programmed cell death is fundamental to advancing our understanding of cellular mechanisms in both physiological and pathological contexts, including cancer research and drug development [21]. This guide focuses on three pivotal biochemical detection methods—TUNEL assay, DNA laddering, and mitochondrial membrane potential assessment—framed within the broader research objective of integrating morphological and molecular approaches for comprehensive apoptosis analysis. Where apoptosis manifests through characteristic morphological alterations such as cell shrinkage, chromatin condensation, and formation of apoptotic bodies, these biochemical techniques provide specific molecular signatures that confirm and quantify cell death pathways [21] [27]. This integrated approach enables researchers to move beyond observational data to obtain mechanistic insights, crucial for evaluating therapeutic efficacy and understanding disease progression.
Comparative Analysis of Biochemical Detection Methods
The following table provides a systematic comparison of the three biochemical methods based on key parameters, highlighting their distinct advantages and limitations for apoptosis detection.
Table 1: Comparative Analysis of Apoptosis Detection Methods
| Parameter | TUNEL Assay | DNA Laddering | Mitochondrial Membrane Potential (MMP) |
|---|---|---|---|
| Primary Detection Target | DNA strand breaks (3'-OH ends) [28] | Internucleosomal DNA fragmentation [29] | Loss of mitochondrial electrochemical gradient (ΔΨm) [30] |
| Core Principle | Enzymatic labeling of DNA breaks by Terminal deoxynucleotidyl Transferase (TdT) [28] | Gel electrophoresis separation of fragmented DNA into a "ladder" pattern [29] | Fluorescent potentiometric dyes (e.g., JC-1, TMRM) that accumulate in active mitochondria [31] [30] |
| Key Readout | Fluorescence microscopy, colorimetric IHC, or flow cytometry [28] [32] | Agarose gel visualization or capillary electrophoresis [29] | Fluorescence shift (e.g., JC-1 aggregate/monomer ratio) measured via flow cytometry or fluorescence microscopy [30] |
| Primary Application Context | Spatial localization of cell death in situ (tissue sections, cultured cells) [33] [28] | Bulk analysis of cell populations, confirmation of apoptotic DNA cleavage [29] | Early apoptosis detection, functional assessment of mitochondrial health [34] [30] |
| Sensitivity | High (detects single cells) [28] | Moderate (requires a significant proportion of apoptotic cells) | High (can detect changes before phosphatidylserine externalization) [30] |
| Throughput Potential | Medium (imaging-based) to High (flow cytometry) | Low to Medium | High (flow cytometry) |
| Key Advantage | Spatial context preservation; compatibility with multiplexing [33] | Considered a classic, specific hallmark of apoptosis | Detects a very early event in the intrinsic apoptotic pathway [30] |
| Key Limitation | Potential for false positives (e.g., in necrotic cells) [32] | No spatial information; cannot identify individual positive cells | Sensitivity to artifacts from dye loading or cell health |
Detailed Methodologies and Experimental Protocols
TUNEL Assay
The TUNEL (Terminal deoxynucleotidyl transferase dUTP Nick End Labeling) assay detects DNA fragmentation, a hallmark of late-stage apoptosis, by enzymatically labeling the 3'-hydroxyl termini of DNA breaks [28].
Click-iT Plus TUNEL Assay for Fluorescent Detection (Optimized for Tissue Sections) [28]:
- Sample Preparation: Use formalin-fixed, paraffin-embedded (FFPE) tissue sections or fixed cultured cells.
- Deparaffinization and Antigen Retrieval: For FFPE tissues, deparaffinize with xylene and rehydrate through a graded ethanol series. Perform heat-mediated antigen retrieval using a pressure cooker or microwave in a suitable buffer (e.g., citrate buffer, pH 6.0). Recent studies show pressure cooker retrieval enhances protein antigenicity for multiplexing compared to proteinase K, which can degrade proteins [33].
- Permeabilization: Incubate sections with a permeabilization agent (e.g., 0.1% Triton X-100 in PBS) for 15-30 minutes at room temperature [32].
- TdT Labeling Reaction: Prepare the TdT reaction mix containing the enzyme, reaction buffer, and EdUTP (an alkyne-modified dUTP). Apply the mix to the samples and incubate in a humidified chamber for 60 minutes at 37°C.
- Click Chemistry Detection: Prepare the detection cocktail containing the fluorescent azide dye (e.g., Alexa Fluor 488, 594, or 647), a copper protectant, and the copper sulfate catalyst. Incubate with the samples for 30 minutes at room temperature, protected from light. The "Plus" kits use optimized copper concentrations to preserve fluorescent protein signals and phalloidin compatibility [28].
- Counterstaining and Mounting: Counterstain nuclei with Hoechst 33342 or DAPI. Mount slides with an antifade mounting medium.
- Visualization and Analysis: Analyze using fluorescence microscopy or high-content analysis systems. TUNEL-positive nuclei will exhibit specific fluorescent labeling.
DNA Laddering Assay
This method identifies the characteristic internucleosomal DNA cleavage pattern (~180-200 bp) of apoptosis [29].
Standard Agarose Gel Protocol:
- Cell Lysis: Harvest approximately 1-5 x 10^6 cells by centrifugation. Lyse the cell pellet in a DNA lysis buffer (e.g., containing Tris-HCl, EDTA, SDS, and proteinase K) and incubate at 56°C for several hours or overnight.
- DNA Extraction: Purify genomic DNA using a standard phenol-chloroform-isoamyl alcohol extraction protocol or commercial silica column-based kits [35]. Precipitate the DNA with ethanol and sodium acetate, wash with 70% ethanol, and resuspend the pellet in TE buffer or nuclease-free water.
- Quantification and Normalization: Quantify DNA concentration using a spectrophotometer (e.g., DeNovix DS-11) or fluorometer [35]. Normalize concentrations across samples.
- Gel Electrophoresis: Load 0.5-1 μg of each DNA sample onto a 1.5-2% agarose gel containing a safe DNA intercalating dye. Include a DNA mass ladder with fragments of known sizes (e.g., 100 bp ladder) as a reference [29]. Run the gel at 5-8 V/cm until sufficient separation is achieved.
- Visualization: Image the gel under UV light. A positive apoptotic result is indicated by a distinctive ladder pattern, whereas viable cells show a high molecular weight band, and necrotic cells display a "smear" [29].
Mitochondrial Membrane Potential (MMP) Assessment
MMP collapse is an early event in the intrinsic apoptotic pathway. The cationic dye JC-1 is a widely used probe for its dual-emission properties [30].
JC-1 Staining Protocol for Flow Cytometry: [30]
- Cell Preparation and Staining: Harvest and wash cells in PBS. Resuspend 1-5 x 10^5 cells in pre-warmed culture medium or PBS. Add JC-1 dye at a working concentration (e.g., 2-5 μM) and incubate for 15-20 minutes at 37°C in the dark.
- Washing and Resuspension: Wash cells twice with PBS to remove excess dye. Resuspend in PBS for immediate analysis.
- Flow Cytometry Analysis: Analyze cells using a flow cytometer equipped with lasers suitable for FITC (FL-1, ~530 nm) and PE (FL-2, ~585 nm) detection. In healthy cells with high MMP, JC-1 forms aggregates that fluoresce red. In apoptotic cells with dissipated MMP, JC-1 remains in its monomeric form, fluorescing green. The ratio of red to green fluorescence is a quantitative indicator of MMP [30].
Integrated Signaling Pathways in Apoptosis
The biochemical markers detected by these methods are endpoints of controlled molecular cascades. Understanding their position within the apoptotic signaling network is key to accurate interpretation.
Diagram 1: Apoptosis Pathways & Detection
The intrinsic pathway, triggered by internal damage, leads to mitochondrial dysfunction and a decrease in MMP, one of the earliest detectable biochemical events [34] [30]. This is followed by the release of cytochrome c into the cytosol, which activates executioner caspases via the apoptosome [21]. These caspases, in turn, activate endonucleases that cleave nuclear DNA, producing the fragments detected by the TUNEL assay and DNA laddering [28]. The extrinsic pathway, initiated by death receptors, can directly activate executioner caspases or amplify the intrinsic pathway [21].
The Scientist's Toolkit: Essential Research Reagents
Successful execution of these assays relies on specific, high-quality reagents. The following table outlines core solutions required for the experiments described in this guide.
Table 2: Essential Research Reagents for Apoptosis Detection
| Reagent / Kit | Core Function | Key Considerations |
|---|---|---|
| Click-iT Plus TUNEL Assay [28] | Fluorescent detection of DNA breaks in situ using EdUTP and click chemistry. | Optimized for multiplexing with fluorescent proteins and phalloidin; choice of different Alexa Fluor azides. |
| DNA Mass Ladder [29] | Size reference for DNA fragmentation analysis by gel electrophoresis. | Critical for estimating fragment size; batch-to-batch variability can impact accuracy. |
| JC-1 (5,5′,6,6′-tetrachloro-1,1′,3,3′-tetraethylbenzimidazolylcarbocyanine iodide) [30] | Potentiometric dye for flow cytometric or microscopic analysis of MMP. | Ratiometric dye (red/green); requires careful control of loading conditions and temperature. |
| Terminal Deoxynucleotidyl Transferase (TdT) [28] | Core enzyme for the TUNEL assay; adds labeled nucleotides to 3'-OH DNA ends. | Enzyme activity and purity are critical for assay sensitivity and specificity. |
| Proteinase K / Antigen Retrieval Buffers [33] [35] | Unmasking target epitopes in fixed samples. | Proteinase K can degrade protein antigens; heat-mediated retrieval (pressure cooker) is preferred for multiplexed spatial proteomics [33]. |
| Silica Column-based DNA Extraction Kits [35] | Purification of high-quality genomic DNA from cell populations for DNA laddering. | Balance between yield, purity, and cost; suitable for most standard applications. |
| Cell Permeabilization Agents (Triton X-100) [32] | Enable reagent access to intracellular targets in fixed cells. | Concentration and incubation time must be optimized to preserve morphology. |
The TUNEL assay, DNA laddering, and MMP assessment form a powerful triad for detecting biochemical markers of apoptosis, each providing unique and complementary information. The TUNEL assay excels in spatial contextualization within tissues, DNA laddering serves as a specific biochemical hallmark, and MMP measurement acts as a sensitive sentinel for early commitment to cell death. The integration of these molecular data with classical morphological observations, such as cell shrinkage and nuclear condensation, creates a robust framework for unambiguous identification and quantification of apoptotic events [21] [27]. This synergistic approach is indispensable for rigorous research in cell biology, preclinical drug development, and the mechanistic study of human diseases.
Programmed cell death, or apoptosis, is a fundamental process crucial for tissue homeostasis, development, and the elimination of damaged cells. The accurate detection of apoptosis is paramount in basic research and drug discovery, particularly for diseases like cancer and neurodegenerative disorders where the process is dysregulated [17] [36]. Among the most reliable molecular markers of apoptosis are the activation of executioner caspase-3/7 and the externalization of phosphatidylserine (PS). These distinct biochemical events occur at different stages of the apoptotic cascade, offering researchers complementary windows into cell death dynamics. This guide provides a comparative analysis of assays targeting these key molecules, framing them within the advanced research context of integrating molecular data with morphological confirmation for a holistic view of cell death.
Caspase-3/7 Activity Assays
Biochemical Principle and Significance
Caspase-3 and caspase-7 are executioner caspases that share a high degree of structural and functional similarity, with 54% amino acid identity [37]. They are activated downstream in the apoptotic cascade and are responsible for the proteolytic cleavage of a vast array of cellular proteins, executing the dismantling of the cell [36] [38]. Their activity is often considered a "point of no return" in the cell death pathway [36]. These enzymes recognize the tetra-peptide sequence DEVD (Asp-Glu-Val-Asp), which forms the basis for many activity-based assays [37] [36].
Assay Formats and Workflows
Assays for caspase-3/7 are predominantly based on fluorogenic or luminogenic substrates. These substrates consist of the DEVD peptide conjugated to a reporter molecule (e.g., a fluorophore or aminoluciferin). In the presence of active caspase-3/7, the substrate is cleaved, releasing the reporter and generating a detectable signal [36] [38].
- Real-Time, No-Wash Assays: Reagents like CellEvent Caspase-3/7 are cell-permeant and non-fluorescent until cleaved by activated caspases inside the cell. The cleaved dye binds to DNA, producing a bright nuclear fluorescence that can be monitored in live cells over time without wash steps, preserving fragile apoptotic cells [38].
- Endpoint Luminescent Assays: Platforms like the Caspase-Glo 3/7 Assay use a luminogenic DEVD-aminoluciferin substrate. Cleavage provides a substrate for luciferase, generating a luminescent signal. This format is highly sensitive and amenable to high-throughput screening (HTS) in 384- or 1536-well plates [36].
- Flow Cytometry-Based Kits: The Image-iT LIVE kits utilize cell-permeant, fluorescently labeled caspase inhibitors (e.g., FAM-DEVD-FMK) that covalently bind to active caspases. After a wash step, the signal is measured via flow cytometry or microscopy, providing a snapshot of activity at the time of reagent addition [38].
The workflow for a typical real-time caspase-3/7 assay is straightforward, as visualized below.
Performance Data and Comparison
The following table summarizes key characteristics of different caspase-3/7 assay formats, illustrating the trade-offs between sensitivity, throughput, and applicability.
Table 1: Comparison of Caspase-3/7 Activity Assay Platforms
| Assay Format | Detection Method | Sensitivity | Throughput | Key Advantage | Ideal Application |
|---|---|---|---|---|---|
| Luminogenic (Caspase-Glo) | Luminescence (RLU) | Very High (20-50x more sensitive than fluorescent) [36] | Ultra-High (HTS in 1536-well) [36] | Homogeneous, "add-mix-measure"; no cell lysis required. | Primary HTS of large compound libraries [36]. |
| Fluorogenic, No-Wash (CellEvent) | Fluorescence Microscopy/ HCS | High (detects early activation in single cells) [38] | Medium-High | Real-time kinetics in live cells; signal survives fixation. | Kinetic studies & multiplexing with other fluorescent probes [38]. |
| Fluorogenic, Fixed-Cell (Image-iT) | Flow Cytometry/ Microscopy | Moderate-High | Medium | Snapshots of activity; compatible with intracellular staining. | Endpoint analysis and immunophenotyping [38]. |
Phosphatidylserine (PS) Exposure Detection via Annexin V
Biochemical Principle and Significance
In viable cells, phosphatidylserine (PS) is restricted to the inner leaflet of the plasma membrane. During early apoptosis, PS is translocated to the outer leaflet, serving as an "eat-me" signal for phagocytic cells [39] [40]. Annexin V is a 35-36 kDa calcium-dependent phospholipid-binding protein with a high affinity for PS [39] [40]. The binding of fluorescently conjugated Annexin V to the cell surface is thus a canonical marker for early apoptosis. It is critical to note that PS exposure is not exclusive to apoptosis and can also occur in other cell death modalities, such as ferroptosis [41]. Therefore, Annexin V staining is typically used in conjunction with a membrane integrity dye like propidium iodide (PI) to distinguish early apoptotic cells (Annexin V+/PI-) from late apoptotic or necrotic cells (Annexin V+/PI+) [40].
Standard and Advanced Assay Workflows
The classic Annexin V assay is performed using flow cytometry. However, newer formats have been developed to increase throughput and convenience.
- Standard Flow Cytometry: Cells are stained with a fluorescent Annexin V conjugate (e.g., Annexin V-FITC) and PI in a calcium-containing buffer, then analyzed without washing to prevent the loss of apoptotic cells. This allows for the quantitative discrimination of live, early apoptotic, and late apoptotic/necrotic populations [40].
- Whole Blood Flow Cytometry: This specialized protocol allows for the measurement of PS exposure on leukocytes and platelets directly in unlysed whole blood, avoiding artifactual increases in Annexin V binding caused by ammonium chloride lysis procedures [39].
- Homogeneous, No-Wash HTS Assays: Recent innovations use recombinant annexin V fused to subunits of a shrimp-derived luciferase. When bound to PS in the presence of calcium, the luciferase subunits complement, generating a luminescent signal without the need for wash steps, making it suitable for ultra-HTS [36].
The standard workflow for a flow cytometry-based Annexin V assay, which is critical for accurate population discrimination, is outlined below.
Performance Data and Comparison
The choice of Annexin V assay depends on the required throughput, sensitivity, and instrumentation.
Table 2: Comparison of Phosphatidylserine (Annexin V) Detection Assays
| Assay Format | Detection Method | Throughput | Key Advantage | Limitation / Consideration |
|---|---|---|---|---|
| Flow Cytometry | Fluorescence (e.g., FITC, PE) | Medium | Gold standard; quantifies heterogeneous cell populations. | Lower throughput; requires cell suspension [36] [40]. |
| Microscopy/Image Cytometry | Fluorescence Imaging | Low-Medium | Provides morphological context; single-cell analysis. | Throughput limited by image acquisition speed [40]. |
| Homogeneous Luminescent | Luminescence (RLU) | Ultra-High | No-wash; ideal for automated HTS [36]. | Does not distinguish individual cells within a well. |
| Whole Blood Flow Cytometry | Flow Cytometry | Low-Medium | Measures PS in near-physiological state; avoids lysis artifacts [39]. | Complex sample matrix; requires CD45/SSC gating for leukocytes [39]. |
Integrated Detection: A Pathway-Centric View
To fully leverage the complementary nature of caspase-3/7 activity and PS exposure, researchers often multiplex these assays or use them in parallel. The following diagram integrates these key molecular events into the broader apoptotic signaling cascade, highlighting the optimal detection points for each assay.
The Scientist's Toolkit: Essential Reagents and Kits
Successful experimentation requires a suite of reliable tools. The table below catalogues key reagent solutions used in the featured apoptosis detection methods.
Table 3: Key Research Reagent Solutions for Apoptosis Detection
| Reagent / Kit Name | Target | Function and Principle | Primary Application |
|---|---|---|---|
| Caspase-Glo 3/7 Assay [36] | Caspase-3/7 Activity | Luminogenic DEVD-aminoluciferin substrate. Cleavage generates luminescent signal. | High-throughput screening in plate readers. |
| CellEvent Caspase-3/7 Green [38] | Caspase-3/7 Activity | Fluorogenic, cell-permeant reagent. Becomes fluorescent upon cleavage and DNA binding. | Real-time imaging and microscopy of live cells. |
| Image-iT LIVE Caspase Kits [38] | Caspase-3/7 or Pan-Caspases | Fluorescently labeled inhibitor (e.g., FAM-DEVD-FMK) binds irreversibly to active caspases. | Flow cytometry or endpoint microscopy. |
| Annexin V-FITC Apoptosis Detection Kit [42] [40] | Phosphatidylserine | FITC-conjugated Annexin V combined with Propidium Iodide for viability staining. | Standard flow cytometry analysis of apoptosis stages. |
| Membrane Permeability/Dead Cell Apoptosis Kit [43] | Apoptosis vs. Necrosis | Uses YO-PRO-1 (passes through apoptotic membranes) and PI (passes only through dead cell membranes). | Flow cytometry to distinguish apoptotic from necrotic cells. |
| Click-iT TUNEL Assay [43] | DNA Fragmentation | Labels 3'-OH ends of fragmented DNA using click chemistry; highly specific and sensitive. | Imaging late-stage apoptotic cells in situ. |
Experimental Protocols for Key Methodologies
Protocol: Real-Time Caspase-3/7 Activation Imaging in Live Cells
This protocol uses CellEvent Caspase-3/7 Green reagent for kinetic analysis [38].
- Cell Preparation: Plate cells in an appropriate culture vessel (e.g., 96-well imaging plate) and allow to adhere overnight.
- Treatment & Staining: Treat cells with the apoptotic inducer of choice. Prepare a 2X working solution of CellEvent Caspase-3/7 Green reagent in pre-warmed culture medium. Add an equal volume of this solution directly to the wells for a final concentration of 2-5 µM.
- Incubation: Incubate the plate for 30-60 minutes at 37°C, protected from light. Optional: Add a nuclear counterstain like Hoechst 33342 during the last 15 minutes.
- Image Acquisition: Visualize cells using a fluorescence microscope or high-content imager with standard FITC (for CellEvent Green) and DAPI (for Hoechst) filter sets. No washing is required.
- Analysis: Quantify the percentage of cells with bright green nuclear fluorescence, indicating activated caspase-3/7.
Protocol: Annexin V-FITC / Propidium Iodide Staining for Flow Cytometry
This is the standard protocol for quantifying early and late apoptosis [40].
- Cell Harvest: Gently harvest adherent cells using a non-enzymatic dissociation buffer (e.g., EDTA) or gentle trypsinization to preserve membrane integrity. Wash cells once with cold PBS.
- Staining Solution: Resuspend the cell pellet (approximately 1-5 x 10^5 cells) in 100 µL of 1X Annexin V Binding Buffer.
- Add Stains: Add 5 µL of Annexin V-FITC and 1 µL of a 100 µg/mL Propidium Iodide (PI) solution to the cell suspension. Gently vortex and incubate for 15-20 minutes at room temperature in the dark.
- Data Acquisition: After incubation, add 400 µL of 1X Annexin V Binding Buffer to each tube and analyze by flow cytometry within 1 hour. Do not wash the cells.
- Gating Strategy: Use a dot plot of Annexin V-FITC (x-axis) vs. PI (y-axis) to identify four populations: Viable (Annexin V-/PI-), Early Apoptotic (Annexin V+/PI-), Late Apoptotic/Necrotic (Annexin V+/PI+), and cells that have lost membrane integrity without PS exposure (Annexin V-/PI+).
Caspase-3/7 activity assays and Phosphatidylserine detection via Annexin V are pillars of modern apoptosis research. While caspase-3/7 activation serves as a committed step in the death pathway, PS exposure provides an early "eat-me" signal. The experimental data shows that caspase-3/7 luminescent assays offer superior sensitivity for HTS, whereas Annexin V flow cytometry provides unparalleled population resolution. The integration of these molecular datasets with morphological analyses—such as monitoring chromatin condensation with Hoechst 33342 or cell shrinkage via brightfield imaging—creates a powerful, multi-parametric framework. This synergy is essential for advancing a deeper thesis in cell death research, enabling a comprehensive understanding of the timing, heterogeneity, and mechanistic underpinnings of apoptosis in health and disease.
The accurate, non-invasive detection of programmed cell death (apoptosis) is a critical need in both basic research and clinical drug development. For decades, the detection of apoptosis relied heavily on ex vivo histopathological methods such as transmission electron microscopy (TEM) and terminal deoxynucleotidyl transferase dUTP nick end labeling (TUNEL) assays, which serve as the morphological "gold standard" [44] [11]. However, these techniques are invasive, provide only a single time-point snapshot, and cannot be used for repetitive monitoring in living subjects [45] [46]. The field is therefore moving towards a transformative thesis: the integration of these detailed morphological analyses with non-invasive in vivo molecular imaging. This synergy allows for real-time, cross-scale visualization of biological processes within intact organisms, paving the way for "transparent pathology" [45]. Central to this integration are targeted molecular imaging agents, primarily radiotracers for positron emission tomography (PET)/single-photon emission computed tomography (SPECT) and activity-based probes (ABPs) for optical and multi-modality imaging. This guide provides a comparative assessment of these advanced tools, their performance data, and methodologies to inform selection for research and therapeutic development.
Apoptosis Signaling Pathways: A Primer for Probe Design
A foundational understanding of apoptosis biochemistry is essential for appreciating the molecular targets of modern imaging probes. Apoptosis proceeds through two primary pathways that converge on a common execution phase.
Pathway Diagram: Biochemical cascades of apoptosis showing key molecular targets for imaging probe development. The intrinsic and extrinsic pathways converge on the activation of executioner caspases, leading to the hallmark morphological changes of apoptosis [45] [46].
The extrinsic pathway is triggered by external death ligands binding to cell surface receptors, leading to the activation of initiator caspase-8. The intrinsic pathway is initiated by internal cellular stress signals, resulting in mitochondrial outer membrane permeabilization (MOMP), cytochrome c release, and activation of initiator caspase-9. Both pathways converge on the execution phase, characterized by the activation of caspase-3/7, which orchestrates the systematic dismantling of the cell. A key early event in this phase is the loss of plasma membrane phospholipid asymmetry and the externalization of phosphatidylserine (PS) [45] [46]. These defined biochemical alterations—particularly PS exposure and caspase-3/7 activation—provide highly specific molecular targets for the design of imaging probes.
Comparative Performance of Apoptosis Imaging Probes
Established and Emerging Radiotracers
The table below summarizes the mechanism, target, and experimental performance data for several key apoptosis imaging radiotracers.
Table 1: Comparison of Apoptosis-Targeting Radiotracers
| Radiotracer | Primary Target | Mechanism of Action | Key Experimental Findings | Notable Advantages/Limitations |
|---|---|---|---|---|
| 99mTc-Annexin V(SPECT) | Phosphatidylserine (PS) | Binds externally exposed PS on apoptotic cell membranes. | - 1.4-fold increase in tumor uptake in drug-treated vs control mice [47].- Correlated well with cell death in vitro (R² > 0.8) [47]. | Limitations: Poor biodistribution profile; failed in late-stage trials [47] [45]. |
| 18F-ML-10(PET) | Apoptotic Membrane Imprint | Binds to altered lipid composition of apoptotic membrane. | - No correlation to cell death in vitro (R² = 0.05) [47].- No differential response in vivo [47]. | Limitations: Shows poor correlation with established cell death assays [47]. |
| 18F-C-SNAT(PET) | Caspase-3/7 | Activated by caspases, cyclizes, and aggregates intracellularly. | - 2.1-fold increase in tumor uptake in treated mice [47].- k3 rate constant increased 4x post-treatment vs 1.4x for %ID/g [48]. | Advantages: Sensitive; mechanism provides high specificity; pharmacokinetic modeling distinguishes uptake from flow [47] [48]. |
| 18F-ICMT-11(PET) | Caspase-3/7 | Peptide-based substrate for caspase-3/7. | - Used in clinical trials for therapy response assessment [45]. | Advantages: Clinical data available [45]. |
Activity-Based Probes (ABPs) for Protease Imaging
While radiotracers are ideal for deep-tissue clinical imaging, ABPs offer powerful tools for preclinical research and mechanistic studies, particularly for protease families like the cysteine cathepsins.
Table 2: Comparison of Activity-Based Probes vs. Substrates
| Probe / Substrate | Class | Mechanism | Key Experimental Findings | Notable Advantages/Limitations |
|---|---|---|---|---|
| ProSense(Substrate) | Polymer-based fluorescent substrate | Protease cleavage releases quenched fluorophores, generating amplified signal. | - Slow tumor uptake; high background in liver/spleen; weaker overall signals [49]. | Limitations: Signal amplification offset by slow uptake and diffusion of products [49]. |
| GB123, GB138(ABP) | Non-quenched ABP | Covalently binds active site of cysteine cathepsins; always "ON". | - Rapid, selective tumor uptake; brighter signals than substrates [49]. | Advantages: Fast kinetics; prolonged retention; allows ex vivo biochemical analysis [49]. |
| GB137(qABP) | Quenched ABP (qABP) | Fluorescence activated only upon covalent binding to target protease. | - High target-to-background ratio; specific labeling in disease models [49]. | Advantages: Low background signal; ideal for in vivo imaging [49] [50]. |
| BMV109 / BMV101(ABP) | Dual-modality ABP (Optical/PET) | Covalently binds cysteine cathepsins in activated macrophages. | - Significantly higher signal in murine atherosclerotic plaques vs. controls (P<0.05) [51].- Colocalized with macrophages and elastin in human plaques [51]. | Advantages: Enables multi-scale imaging; validates target engagement in human tissues [51]. |
Detailed Experimental Protocols for Probe Validation
To ensure reliable and reproducible results, researchers must adhere to robust experimental methodologies. The following protocols are compiled from key studies.
This protocol is used to correlate radiotracer uptake with levels of drug-induced cell death.
- Cell Treatment: Culture relevant cell lines (e.g., EL-4 murine lymphoma, PC-9 or A549 human NSCLC). Induce apoptosis using established agents (e.g., 15 µM etoposide for EL-4 cells for 18-20 hours, or 200 µM carboplatin for NSCLC lines for 72 hours). Use vehicle-treated cells as a control.
- Preparation of Cell Mixtures: To establish a correlation curve, create mixtures of vehicle- and drug-treated cells (e.g., 0%, 25%, 50%, 75%, and 100% drug-treated cells).
- Radiotracer Incubation: Harvest cells and incubate with the radiotracer of choice in fresh culture medium at 37°C. Typical conditions for
18F-C-SNATare 1.48 MBq/mL for 60 minutes. Use consistent specific activities and concentrations for comparative studies. - Cell Washing and Lysis: After incubation, collect cells by centrifugation (e.g., 1200g for 3 minutes at 4°C). Wash the cell pellet three times with ice-cold Hank's Buffered Salt Solution (HBSS) to remove unbound tracer.
- Radioactivity Measurement: Lyse the final cell pellet in a suitable buffer (e.g., RIPA buffer). Transfer an aliquot of the lysate to a gamma counter to determine the decay-corrected cell-associated radioactivity.
- Protein Quantification: Use a standard protein assay (e.g., bicinchoninic acid, BCA) on the remaining lysate after radioactive decay to normalize the radioactivity counts to total cellular protein content.
- Parallel Cell Death Analysis: In parallel with the uptake experiment, analyze an aliquot of the same cell mixtures for cell death using a standard method like flow cytometry with Annexin V/PI staining.
This workflow outlines the key steps for non-invasive imaging and subsequent validation in animal models.
Experimental Workflow: Key steps for validating molecular imaging probes in vivo, from model preparation to data correlation with ex vivo assays [47] [51] [48].
- Disease Model Induction: Establish a relevant animal model. For apoptosis imaging, this is typically a tumor-bearing mouse model. For protease ABPs, models of atherosclerosis (e.g., carotid artery ligation in mice on a high-fat diet) or cancer are used [51].
- Therapeutic Intervention: Administer a therapy (e.g., doxorubicin) to the experimental group to induce apoptosis, while a control group receives a vehicle.
- Probe Administration: Inject the radiotracer or ABP intravenously (e.g., via tail vein) at a specified dose and specific activity. For optical ABP
BMV109, a dose of 10 nM is typical [51]. - Non-Invasive Imaging: Perform imaging at optimal time points post-injection. For PET tracers like
18F-C-SNAT, dynamic scanning allows for pharmacokinetic modeling to calculate the uptake rate constantk3, which isolates specific tracer retention from blood flow effects [48]. - Ex Vivo Validation: After imaging, euthanize the animals and collect tissues of interest.
- Biodistribution: Weigh organs and measure radioactivity to calculate the percentage of injected dose per gram of tissue (%ID/g).
- Histopathology: Analyze tissue sections by TUNEL staining (for apoptosis), immunofluorescence for specific cell markers (e.g., CD68 for macrophages), or probe colocalization to confirm target engagement at the cellular level [47] [51].
The Scientist's Toolkit: Key Research Reagent Solutions
Table 3: Essential Reagents for Apoptosis and Protease Activity Imaging
| Reagent / Assay | Primary Function | Utility in Probe Validation |
|---|---|---|
| TUNEL Assay | Labels fragmented DNA in apoptotic nuclei. | Histological "gold standard" for correlating and validating in vivo apoptosis imaging signals [45] [44]. |
| Annexin V (FITC conjugate) | Binds externalized PS on apoptotic cells. | Flow cytometry standard for quantifying early-stage apoptosis in vitro, used to correlate with radiotracer uptake [47]. |
| Flow Cytometry with Viability Dyes | Distinguishes apoptotic (Annexin V+/PI-) from necrotic (Annexin V+/PI+) cells. | Essential for in vitro assessment of cell death mechanisms and population quantification during probe development [47]. |
| Caspase-3/7 Activity Assays | Fluorogenic or colorimetric substrates for caspase activity. | Biochemical confirmation of executioner caspase activation, supporting mechanisms of caspase-targeted probes like 18F-C-SNAT [45]. |
| Activity-Based Probes (ABPs) | Covalently bind active proteases for detection and isolation. | Tool for direct target engagement studies, enzyme occupancy analysis, and as imaging agents in their own right [49] [50]. |
| Pharmacokinetic Modeling (2-Tissue Compartment) | Mathematical modeling of dynamic PET data. | Critical for dissecting specific tracer retention (k3) from non-specific blood delivery (K1), enhancing quantification accuracy [48]. |
The integration of detailed morphological analysis with non-invasive molecular imaging represents the future of pathology in apoptosis research. The data and protocols presented herein demonstrate that no single probe is universally superior; each has distinct strengths. Annexin V-based agents provide a well-established link to a classic apoptosis biomarker but face pharmacokinetic challenges. Caspase-targeted agents like 18F-C-SNAT offer a mechanism-based, high-contrast alternative with sensitivity benefits, especially when combined with advanced pharmacokinetic modeling to account for variable blood flow [48]. Meanwhile, ABPs provide unparalleled specificity for protease activity, enabling direct target validation and multi-modal imaging applications from pre-clinical models to human tissue analysis [51] [49] [50].
The field continues to evolve with the development of quenched ABPs (qABPs) for lower background, dual-modality probes that combine PET and optical imaging, and theranostic agents that combine diagnosis with therapy [51] [50]. The choice of imaging agent must be guided by the specific research question, the required spatial and temporal resolution, and crucially, a robust experimental framework that includes ex vivo validation against established morphological and biochemical standards. This integrated approach is key to advancing our understanding of cell death in health and disease and accelerating the development of new therapeutics.
The accurate detection of programmed cell death, or apoptosis, is a cornerstone of modern drug discovery, particularly for evaluating the efficacy of anticancer therapeutics and other agents designed to induce controlled cellular death [52] [21]. Apoptosis represents a fundamental biological process with wide-ranging implications for tissue homeostasis, embryonic development, and the immune response, but its dysregulation is also implicated in a variety of pathological conditions including cancer, neurodegenerative diseases, and autoimmune disorders [52] [53]. Within drug screening paradigms, the ability to precisely monitor and quantify apoptosis induction provides critical insights into therapeutic mechanisms, treatment efficacy, and potential resistance patterns [54] [55].
The complexity of apoptosis as a biological phenomenon, characterized by multiple overlapping signaling pathways and morphological stages, presents both challenges and opportunities for detection method development [44] [21]. A comprehensive understanding of apoptosis requires integration of both morphological hallmarks—including cellular shrinkage, chromatin condensation, and apoptotic body formation—with molecular biomarkers such as phosphatidylserine externalization, caspase activation, and DNA fragmentation [44] [56] [21]. This guide systematically compares the performance of current apoptosis detection technologies within the context of drug screening applications, providing researchers with experimental protocols, performance data, and practical implementation frameworks for evaluating apoptosis-inducing therapeutics.
Apoptosis Signaling Pathways: Molecular Foundations for Detection
The molecular pathways governing apoptosis initiation and execution provide the fundamental basis for detection method development. These cascades converge on characteristic morphological changes that define apoptotic cell death [21]. The following diagram illustrates the core apoptotic signaling pathways and their key biomarkers that serve as detection targets in drug screening applications.
Apoptosis Signaling Pathways and Detection Windows. This diagram illustrates the core apoptotic signaling pathways, highlighting key molecular events targeted by detection methods. The extrinsic pathway initiates through death receptor activation, while the intrinsic pathway triggers via cellular stress signals. Both converge on caspase activation cascades, leading to execution phases with characteristic biomarkers including phosphatidylserine (PS) externalization and DNA fragmentation, which define temporal windows for detection assays [52] [21] [53].
Comparative Analysis of Apoptosis Detection Methods
Classification by Detection Principle and Temporal Application
Apoptosis detection technologies can be systematically categorized based on their underlying detection principles and their applicability to specific phases of the apoptotic process. The following table summarizes the major assay categories, their detection basis, and their temporal application within the apoptosis timeline.
Table 1: Classification of Major Apoptosis Detection Methods
| Detection Category | Detection Basis | Primary Analytes/Targets | Apoptosis Phase | Key Applications in Drug Screening |
|---|---|---|---|---|
| Membrane Alterations | PS externalization | Annexin V conjugates | Early | High-throughput screening of therapeutic candidates [52] [56] |
| Mitochondrial Assays | Δψm dissipation | TMRM, JC-1 dyes | Early | Assessment of mitochondrial-targeted therapies [56] |
| Caspase Activation | Protease activity | FLICA probes, substrates | Mid | Mechanism of action studies [52] [56] |
| DNA Fragmentation | DNA cleavage | TUNEL, sub-G1 analysis | Late | Confirmation of irreversible commitment to cell death [52] [21] |
| Cytomorphological | Cellular structure | Microscopy, imaging | All phases | Validation of apoptotic morphology [44] [21] |
Performance Comparison of Core Detection Technologies
The selection of appropriate apoptosis detection methods requires careful consideration of performance parameters including sensitivity, throughput, and information content. The following table provides a quantitative comparison of widely employed apoptosis detection platforms in drug screening contexts.
Table 2: Performance Comparison of Apoptosis Detection Technologies
| Technology Platform | Sensitivity (Cells) | Throughput | Multiplexing Capacity | Quantitative Output | Key Advantages | Primary Limitations |
|---|---|---|---|---|---|---|
| Flow Cytometry | 10³-10⁶ | Medium-High | High (4+ parameters) | Excellent | Single-cell resolution, multiparametric analysis [56] [55] | Requires cell dissociation, no spatial information |
| Fluorescence Microscopy | 10²-10⁵ | Low-Medium | Medium (2-4 channels) | Good | Spatial context, morphological validation [44] [21] | Lower throughput, subjective analysis |
| Microplate Luminescence | 10³-10⁷ | High | Low | Excellent | Homogeneous format, excellent for HTS [53] | Limited mechanistic information |
| TUNEL Assay | 10³-10⁶ | Low | Low | Good | Specificity for late apoptosis [52] [21] | Cannot detect early apoptosis |
| Western Blot | 10⁵-10⁷ | Low | Low | Semi-quantitative | Molecular specificity, target validation [55] | Low throughput, no single-cell data |
Experimental Protocols for Apoptosis Detection in Drug Screening
Annexin V/Propidium Iodide Staining for Flow Cytometry
The Annexin V/propidium iodide (PI) staining method represents a gold standard for detecting early apoptosis through the externalization of phosphatidylserine on the outer leaflet of the plasma membrane [52] [56]. This protocol enables discrimination between viable (Annexin V⁻/PI⁻), early apoptotic (Annexin V⁺/PI⁻), late apoptotic (Annexin V⁺/PI⁺), and necrotic (Annexin V⁻/PI⁺) cell populations.
Materials and Reagents:
- Annexin V binding buffer (10 mM HEPES/NaOH pH 7.4, 140 mM NaCl, 2.5 mM CaCl₂)
- Fluorochrome-conjugated Annexin V (FITC, APC, or similar)
- Propidium iodide stock solution (50 µg/mL in PBS)
- Cell suspension (2.5×10⁵ – 2×10⁶ cells/mL)
- Flow cytometry tubes
Procedure:
- Cell Preparation: Harvest drug-treated cells by gentle centrifugation (5 min, 300 × g). Wash once with cold PBS and resuspend in Annexin V binding buffer at 1×10⁶ cells/mL.
- Staining: Aliquot 100 µL cell suspension into flow cytometry tubes. Add 5 µL fluorochrome-conjugated Annexin V and 10 µL propidium iodide working solution.
- Incubation: Incubate samples for 15 minutes at room temperature protected from light.
- Analysis: Add 400 µL Annexin V binding buffer to each tube and analyze by flow cytometry within 1 hour using 488 nm excitation with emission detection at 530 nm (Annexin V-FITC) and >575 nm (PI) [56].
Data Interpretation: The flow cytometry data should be plotted as Annexin V fluorescence versus PI fluorescence, creating four distinct quadrants representing the different cell states. This method provides quantitative data on the percentage of cells in each stage, enabling dose-response and time-course analyses for drug screening applications.
Caspase Activity Measurement Using FLICA Assays
Fluorochrome-labeled inhibitors of caspases (FLICA) permit detection of active caspase enzymes, representing a mid-phase apoptotic marker with high specificity [56]. This protocol details the implementation of poly-caspase FLICA assays for drug screening applications.
Materials and Reagents:
- Poly-caspase FLICA reagent (FAM-VAD-FMK)
- Propidium iodide stock solution (50 µg/mL in PBS)
- Apoptosis induction buffer (positive control)
- Cell suspension (2.5×10⁵ – 2×10⁶ cells/mL)
- Flow cytometry tubes or microplate
Procedure:
- Cell Preparation: Harvest drug-treated cells by gentle centrifugation (5 min, 300 × g). Wash once with PBS and resuspend in culture media at 1×10⁶ cells/mL.
- FLICA Staining: Add 3 µL of FLICA working solution (5× dilution of reconstituted stock in PBS) per 100 µL cell suspension.
- Incubation: Incubate for 60 minutes at 37°C protected from light, gently agitating every 20 minutes.
- Washing: Wash cells twice with 2 mL apoptosis wash buffer to remove unbound FLICA reagent.
- Counterstaining: Resuspend cell pellet in 100 µL PI staining mix (diluted in PBS) and incubate 3-5 minutes.
- Analysis: Analyze by flow cytometry using 488 nm excitation with emission detection at 530 nm (FLICA) and >575 nm (PI) [56].
Data Interpretation: FLICA-positive/PI-negative cells represent early apoptotic populations with active caspases but intact membranes, while FLICA-positive/PI-positive cells indicate late apoptosis or secondary necrosis. This assay provides specific information about the activation of the caspase execution pathway in response to therapeutic compounds.
DNA Fragmentation Analysis by TUNEL Assay
The TUNEL (TdT-mediated dUTP-biotin nick end-labeling) assay detects DNA fragmentation, a hallmark of late-stage apoptosis [52] [21]. This protocol adapts the TUNEL methodology for drug screening applications in both fluorescence microscopy and flow cytometry formats.
Materials and Reagents:
- TUNEL assay kit (including TdT enzyme and fluorescent-dUTP)
- Permeabilization solution (0.1% Triton X-100 in 0.1% sodium citrate)
- Cell suspension or fixed cells on slides
- PBS buffer
Procedure:
- Cell Fixation and Permeabilization: Fix cells with 4% paraformaldehyde for 1 hour at room temperature. For adherent cells, perform fixation on coverslips or in culture vessels. Permeabilize with 0.1% Triton X-100 in 0.1% sodium citrate for 2 minutes on ice.
- Labeling Reaction: Prepare TUNEL reaction mixture according to manufacturer instructions. Apply sufficient volume to cover samples completely.
- Incubation: Incubate for 60 minutes at 37°C in a humidified chamber protected from light.
- Washing: Wash samples three times with PBS to remove unincorporated nucleotides.
- Analysis: For microscopy, mount slides and visualize by fluorescence microscopy. For flow cytometry, analyze using 488 nm excitation with emission detection at 530 nm [52].
Data Interpretation: TUNEL-positive cells display bright nuclear fluorescence indicating DNA fragmentation. This method provides confirmation of late-stage apoptosis but cannot detect early apoptotic events, making it most valuable as a confirmatory assay in drug screening cascades.
Advanced Detection Platforms and Emerging Technologies
Microphysiological Systems and Tumor-on-Chip Platforms
Advanced microphysiological systems represent a paradigm shift in apoptosis detection for drug screening by providing more physiologically relevant microenvironments for therapeutic evaluation [54]. The tumor-microenvironment-on-chip (TMoC) platform enables real-time regional analysis of drug response across heterogeneous tumor regions, addressing critical limitations of conventional 2D and 3D culture systems.
Platform Design and Operation: The TMoC system features an elongated culture area (2 cm × 1 cm × 250 μm) with dynamic medium circulation that establishes physiological gradients of oxygen, nutrients, and therapeutic agents [54]. This design recapitulates the intratumoral heterogeneity observed in vivo, including normoxic to hypoxic transitions that significantly influence drug efficacy and apoptosis induction.
Application Workflow:
- Tissue Preparation: Dissociate patient-derived or mouse-derived tumor tissues into single-cell suspensions.
- Matrix Embedding: Combine tumor cells with appropriate extracellular matrix hydrogels.
- Chip Loading: Implant cell-matrix mixture into TMoC culture chamber and allow polymerization.
- Dynamic Culture: Connect to perfusion system to establish physiological flow conditions.
- Drug Exposure and Analysis: Introduce therapeutic agents and monitor apoptosis induction in real-time across different regional zones [54].
Performance Advantages: Comparative studies demonstrate 93% concordance between TMoC drug response data and animal model results, significantly outperforming conventional tumoroid models in predictive accuracy [54]. The platform enables spatial resolution of apoptosis induction, identifying resistant subpopulations in hypoxic regions that would be overlooked in bulk assays.
Bioluminescence-Based Apoptosis Detection Probes
Novel bioluminescence-based detection technologies address limitations of conventional fluorescence methods through enhanced sensitivity and reduced background in complex biological samples [53]. The Annexin V-Renilla luciferase fusion protein (ArFP) represents an advanced probe design combining the specificity of Annexin V with the sensitivity of mutant Renilla luciferase (RLuc8).
Probe Design and Characteristics: The ArFP construct maintains high-affinity phosphatidylserine binding (KD = 20.7 μM) while generating robust bioluminescence signals with coelenterazine substrate [53]. The fusion protein exhibits excellent serum stability, enabling both in vitro and in vivo applications in drug discovery pipelines.
Implementation Protocol:
- Probe Preparation: Express and purify ArFP using standard protein production methods.
- Sample Labeling: Incubate drug-treated cells or tissues with ArFP (0.1-1 μg/mL) for 15-30 minutes.
- Substrate Addition: Administer coelenterazine substrate (5-10 μM final concentration).
- Signal Detection: Quantify bioluminescence using appropriate detection systems [53].
Applications in Drug Screening: The ArFP system enables sensitive detection of apoptosis induction in both 2D and 3D culture systems, with particular utility for longitudinal studies requiring repeated measurements. The technology has been validated in disease-relevant models including ischemia/reperfusion injury, corneal injury, and retinal degeneration [53].
Research Reagent Solutions Toolkit
Table 3: Essential Reagents and Kits for Apoptosis Detection in Drug Screening
| Reagent Category | Specific Examples | Primary Applications | Key Suppliers | Technical Considerations |
|---|---|---|---|---|
| Annexin V Kits | Annexin V-FITC, Annexin V-APC | Flow cytometry, microscopy | Thermo Fisher, BD Biosciences | Calcium-dependent binding requires specific buffer conditions [56] [55] |
| Caspase Activity Assays | FLICA, Caspase-Glo | Microplate assays, flow cytometry | Immunochemistry Tech, Promega | Distinguishes specific caspase isoforms [56] |
| Mitochondrial Dyes | TMRM, JC-1, MitoTracker | Early apoptosis, mechanism studies | Thermo Fisher, Abcam | Concentration-dependent aggregation states affect interpretation [56] |
| DNA Fragmentation Kits | TUNEL, Cell Death ELISA | Late apoptosis confirmation | Roche, Abcam, BioVision | Requires careful fixation and permeabilization [52] [57] |
| Viability Indicators | Propidium iodide, 7-AAD | Membrane integrity assessment | Multiple suppliers | Distinguishes late apoptosis from necrosis [56] |
| Bioluminescent Probes | ArFP (Annexin V-Rluc8) | In vivo imaging, 3D models | Research use only | Requires coelenterazine substrate [53] |
Integrated Workflow for Apoptosis-Based Therapeutic Screening
The effective implementation of apoptosis detection in drug screening programs requires strategic integration of complementary technologies across a cascaded screening workflow. The following diagram illustrates a recommended integrated approach for evaluating apoptosis-inducing therapeutics.
Integrated Apoptosis Detection Workflow for Drug Screening. This diagram outlines a cascaded approach to evaluating apoptosis-inducing therapeutics, linking appropriate detection technologies with specific screening applications. The workflow progresses from high-throughput primary screening through mechanism elucidation, spatial analysis in complex models, and final translational validation, ensuring comprehensive assessment of therapeutic candidates [54] [56] [55].
The evolving landscape of apoptosis detection technologies continues to transform approaches to drug screening and therapeutic development. Integration of morphological assessment with molecular detection methods provides a powerful framework for comprehensive evaluation of apoptosis-inducing compounds [44] [21]. Emerging trends including microphysiological systems, enhanced bioluminescence probes, and artificial intelligence-driven analysis platforms are addressing critical challenges in predicting clinical efficacy during early-stage drug discovery [54] [58] [59].
Future advancements in apoptosis detection will likely focus on increased spatial resolution within complex tissue contexts, real-time kinetic analysis in living systems, and multiparametric single-cell profiling to identify heterogeneous response patterns [54] [55]. The growing adoption of 3D culture models and organ-on-chip platforms represents a particular opportunity for more physiologically relevant apoptosis screening that better bridges the gap between conventional in vitro assays and clinical performance [54]. Additionally, the integration of machine learning approaches for pattern recognition in complex apoptosis data sets promises to enhance predictive accuracy and identify subtle response signatures that may escape conventional analysis methods [58] [59].
As these technologies mature, the field moves toward increasingly sophisticated screening paradigms capable of detecting apoptosis within authentic tissue contexts, resolving subpopulation responses, and predicting clinical efficacy with greater accuracy—ultimately accelerating the development of more effective apoptosis-inducing therapeutics for cancer and other proliferation-related disorders.
Navigating Challenges: Pitfalls, Optimization, and Advances in Complex Models
Accurate detection of apoptosis is fundamental to biomedical research, yet common methodological pitfalls can severely compromise data interpretation. This guide examines the limitations of popular techniques and provides a framework for robust, multi-parameter assessment of programmed cell death.
False Positives and Specificity Challenges in Popular Assays
A primary challenge in apoptosis detection is the significant potential for false positive signals, largely because many assays target late-stage events that can overlap with other cell death mechanisms.
Phosphatidylserine (PS) Externalization Assays
The Annexin V assay, which detects the externalization of phosphatidylserine (PS) on the outer leaflet of the cell membrane, is a established marker of early apoptosis [60]. However, PS externalization is not exclusive to apoptosis; it also occurs during secondary necrosis and in some forms of regulated necrosis [60]. This lack of absolute specificity means that without careful counter-staining, Annexin V-positive cells can be misinterpreted.
- Key Pitfall: Distinguishing early apoptotic cells (Annexin V+/PI-) from late apoptotic or necrotic cells (Annexin V+/PI+) [60].
- Recommended Mitigation: Always use Annexin V in conjunction with a viability dye like propidium iodide (PI) to assess membrane integrity [60].
DNA Fragmentation Detection (TUNEL Assay)
The TUNEL (TdT dUTP Nick-End Labeling) assay detects DNA strand breaks, a hallmark of late-stage apoptosis. Nevertheless, it is notoriously prone to false positive or negative findings [18]. The staining kinetics are highly dependent on reagent concentration, tissue fixation methods, and the extent of proteolysis [18]. Furthermore, active RNA synthesis and extensive DNA damage in necrotic cells can cause non-specific staining [18].
- Key Pitfall: Non-specific labeling of DNA breaks from non-apoptotic processes, such as necrosis or autolysis [61] [18].
- Recommended Mitigation: The TUNEL assay must be carefully standardized with appropriate controls, including DNAse-treated samples as a positive control for apoptosis. Results should be corroborated with morphological analysis [18].
Table 1: Comparison of Major Apoptosis Detection Assays and Their Associated Pitfalls
| Assay | Target | Key Strengths | Common Pitfalls | Specificity Mitigations |
|---|---|---|---|---|
| Annexin V Binding [60] | PS externalization | Early apoptosis detection; adaptable to flow cytometry & microscopy | PS exposure in necrosis; false positives from membrane damage | Combine with PI viability dye; use reversible probes like pSIVA [60] |
| TUNEL Assay [61] [18] | DNA fragmentation | Labels individual cells in tissue sections; high sensitivity | Prone to false positives from non-apoptotic DNA damage; affected by fixation | Standardize with DNAse controls; combine with morphological confirmation [18] |
| Caspase Activity Assays [60] | Caspase-3/7 activation (e.g., DEVD cleavage) | Central role in apoptosis; high mechanistic specificity | Transient activity; does not always commit cell to death; can miss "caspase-independent" apoptosis | Use real-time, live-cell probes; combine with other markers |
| Mitochondrial Potential Probes (JC-1) [60] | ΔΨm collapse | Functional readout of intrinsic pathway; fluorescence shift (J-aggregates to monomers) | Loss of potential can occur in other pathologies; photobleaching | Validate with other mitochondrial markers; use in multi-parametric assays |
Methodological Protocols for Enhanced Specificity
Combined Annexin V/Propidium Iodide Staining Protocol
This protocol allows for the simultaneous discrimination of viable, early apoptotic, late apoptotic, and necrotic cell populations [60].
- Harvesting and Washing: Gently harvest adherent cells using non-enzymatic dissociation buffers to preserve membrane integrity. Wash cells once with cold phosphate-buffered saline (PBS).
- Binding Reaction: Resuspend ~1x10^5 cells in 100 µL of binding buffer. Add Annexin V-fluorophore conjugate (e.g., FITC) and Propidium Iodide (PI) as per manufacturer's instructions. Incubate for 15 minutes at room temperature in the dark.
- Analysis: Within 1 hour, analyze by flow cytometry or fluorescence microscopy. Use the following gating:
- Annexin V-/PI-: Viable, non-apoptotic cells.
- Annexin V+/PI-: Early apoptotic cells.
- Annexin V+/PI+: Late apoptotic or necrotic cells.
Standardization of TUNEL Assay for Tissue Sections
To improve the reliability of TUNEL data, rigorous standardization is essential [18].
- Fixation and Sectioning: Use optimally fixed tissue (e.g., neutral buffered formalin). Avoid over-fixation, which can mask epitopes. Embed in paraffin and section at 4-5 µm.
- Controls: Include the following controls in every run:
- Positive Control: Treat a test section with DNAse I (1 µg/mL for 10 minutes) to induce DNA strand breaks artificially.
- Negative Control: Omit the Terminal deoxynucleotidyl transferase (TdT) enzyme from the reaction mixture.
- Staining and Counterstaining: Perform the TUNEL reaction according to kit specifications. Use a counterstain (e.g., hematoxylin or DAPI) to visualize all nuclei.
- Morphological Validation: Score only cells that show both a positive TUNEL signal and classic apoptotic morphology (nuclear condensation and fragmentation, cell shrinkage) under high-power magnification [18].
TUNEL Assay Standardized Workflow
Detection of Transient and Non-Apoptotic Caspase Activity
Caspase-3 activation is a central event in apoptosis, but its activity can be weak, transient, and not always lead to cell death, presenting a significant detection challenge [62].
The Problem of Transient Signals
Standard caspase activity assays, such as those using DEVD-peptide substrates, provide a snapshot in time. A negative result does not preclude a prior, transient burst of caspase activity that executed limited proteolysis without triggering full apoptosis. This non-apoptotic caspase activity (NACA) is involved in diverse physiological processes including neuronal differentiation, axonal pathfinding, and synaptic plasticity [62].
Advanced Tools for Tracking Transient Caspase Activity
To overcome this, genetically encoded reporters have been developed. For example, a transgenic mouse model expresses a highly sensitive fluorescent reporter based on split intein-mediated protein splicing. This reagent-free system allows for the mapping and quantification of NACA at cellular resolution in fixed brain tissues, revealing its role in neural circuit function and sex-specific stress responses [62].
Table 2: Research Reagent Solutions for Apoptosis Detection
| Reagent / Assay | Primary Function | Key Application Notes |
|---|---|---|
| Fluorescent Annexin V Conjugates [60] | Binds externalized PS | Distinguish early apoptosis with PI; pSIVA variant allows reversible binding for live-cell tracking [60]. |
| DEVD-NucView 488 Caspase-3 Substrate [60] | Detects caspase-3/7 activity | Cell-permeable; cleavage releases DNA dye for nuclear staining. Ideal for multi-parametric live-cell imaging. |
| JC-1 Dye (Lipophilic Cationic Dye) [60] | Measures mitochondrial membrane potential (ΔΨm) | Emits red (J-aggregates, high ΔΨm) or green (monomers, low ΔΨm) fluorescence. Ratio indicates health. |
| TUNEL Assay Kits [61] [18] | Labels DNA strand breaks | Requires rigorous controls (DNAse, no enzyme) and morphological validation to ensure specificity [18]. |
| Caspase Activity Reporter Mice [62] | Reports non-apoptotic caspase activity (NACA) | Enables systems-level mapping of weak/transient caspase activity in vivo without reagents [62]. |
Integrated Workflows and Future Directions
Relying on a single parameter is insufficient for definitive apoptosis identification. The most robust strategy involves correlating multiple molecular markers with high-resolution morphological analysis.
Multi-Parametric Imaging and Label-Free Technologies
Integrating fluorescence-based molecular probes (for PS, caspase activity) with advanced label-free imaging techniques provides a powerful validation tool. For instance, Full-Field Optical Coherence Tomography (FF-OCT) can visualize classic apoptotic morphology—such as echinoid spine formation, cell contraction, and membrane blebbing—in a label-free, non-invasive manner [8]. This allows direct correlation of a biochemical signal (e.g., Annexin V binding) with the physical manifestation of cell death.
Integrated Apoptosis Detection Strategy
The Role of Morphological Profiling
High-content morphological profiling assays, such as Cell Painting, capture a vast array of cellular features across multiple compartments. When applied to a curated library of bioactive compounds, these profiles can predict mechanism of action (MoA), including toxicity and specific death pathways [63]. This data-driven approach complements targeted molecular detection, providing an unbiased readout of the cell's status.
In the fields of cell biology and drug development, understanding the specific mode of cell death induced by therapeutic agents is crucial for evaluating efficacy and safety. Apoptosis and oncosis represent two distinct cellular demise pathways with profoundly different implications for tissue homeostasis and inflammatory outcomes. A critical molecular factor determining the passage a cell takes towards one death pathway or the other is its adenosine triphosphate (ATP) level. This guide provides a comparative analysis of how cellular energy status dictates death mechanism choice, integrating morphological and molecular detection methods to equip researchers with practical tools for distinguishing these pathways in experimental settings.
Defining Apoptosis and Oncosis: Key Characteristics and the ATP Paradox
Apoptosis, a programmed, energy-dependent process, facilitates controlled cell removal without triggering inflammation. It is characterized by cell shrinkage, chromatin condensation, membrane blebbing, and caspase activation [64]. Crucially, apoptosis requires sufficient ATP levels to execute its molecular program, and dying cells are typically phagocytosed by immune cells before membrane integrity is lost, preventing content leakage and inflammatory responses [64].
Oncosis, derived from the Greek "onkos" meaning swelling, presents a stark morphological contrast. This passive, energy-depleting process features cell swelling, plasma membrane disruption, dilation of organelles, and mitochondrial swelling [64] [65]. Oncosis results in necrotic-like death with membrane rupture, releasing pro-inflammatory intracellular contents that damage adjacent tissues [64].
The table below summarizes the fundamental distinctions between these two pathways, with ATP level emerging as the decisive switch.
Table 1: Fundamental Characteristics of Apoptosis and Oncosis
| Characteristic | Apoptosis | Oncosis |
|---|---|---|
| Cell Morphology | Cell shrinkage, membrane blebbing | Cell and organelle swelling [64] [65] |
| Nuclear Changes | Chromatin condensation and margination | Nuclear chromatin aggregation, degeneration [64] [65] |
| Plasma Membrane | Integrity maintained until late stages | Early disruption and rupture [64] |
| Energy Dependency | Energy-dependent process (requires ATP) | Passive process associated with ATP depletion [64] [65] |
| Inflammatory Response | Typically non-inflammatory | Strongly pro-inflammatory [64] |
| Primary Stimuli | Physiological signals, low-dose toxins | Severe ischemia, hypoxia, high-dose toxins [64] |
The Central Role of ATP as a Molecular Switch
Experimental evidence consistently identifies intracellular ATP concentration as the critical factor steering cell death toward apoptosis or oncosis. The relationship is direct: high ATP levels support apoptosis, while ATP depletion forces the cell into the oncotic pathway [64].
This ATP-dependent switch has profound implications for cancer therapy. Many conventional chemotherapeutic agents, such as cisplatin, arsenic trioxide, and doxorubicin, induce apoptosis at low concentrations but trigger oncosis at higher doses [64]. This dose-dependent effect correlates directly with the cell's energy depletion status. Research has demonstrated that supplementing cells with exogenous ATP can facilitate the conversion of oncosis into apoptosis, highlighting the potential for therapeutic intervention targeting cellular energy metabolism [64].
The following diagram illustrates the ATP-level-dependent decision process a cell undergoes when faced with a death stimulus.
Experimental Models and Detection Methodologies
Establishing Experimental Models
Different stressors can be employed to induce apoptosis or oncosis in experimental models, allowing researchers to study these pathways in controlled settings.
- Inducing Apoptosis: Treatment with doxorubicin (5 μmol/L) effectively triggers apoptosis in HeLa cells by causing DNA damage and activating p53 pathways [8]. Similarly, staurosporine is a reliable apoptosis inducer that activates the mitochondrial pathway [66] [67].
- Inducing Oncosis: Heat stress (43°C for 4 hours) has been shown to induce oncosis in human skeletal muscle cells (HSKMC), characterized by cell swelling, mitochondrial damage, and ATP depletion [65] [68]. Treatment with high concentrations of chemotherapeutic agents (e.g., high-dose cisplatin) can also shift cell death from apoptosis to oncosis [64].
Key Detection Techniques and Workflow
Distinguishing between apoptosis and oncosis requires a multi-faceted approach that combines morphological assessment, molecular biomarker detection, and ATP quantification. The following workflow outlines a comprehensive experimental strategy.
Morphological Analysis
Full-field optical coherence tomography (FF-OCT) enables label-free, high-resolution visualization of cellular structural changes. In apoptosis, FF-OCT captures cell contraction, membrane blebbing, and filopodia reorganization. In oncosis/necrosis, it reveals rapid membrane rupture, intracellular content leakage, and loss of adhesion structures [8].
Electron microscopy provides ultrastructural details, showing mitochondrial swelling, cytoplasmic vacuolation, and nuclear degeneration in oncosis, contrasting with preserved organelles until late stages in apoptosis [65].
Molecular Biomarker Detection
Specific protein biomarkers provide definitive identification of cell death pathways:
- Oncosis Markers: Porimin is a specific surface protein marker for oncosis. Detection of Porimin-positive/PI-double positive cells via flow cytometry confirms oncosis [65] [68]. Increased expression of Bax and cytochrome c (CytC) alongside decreased Bcl-2 also indicates oncosis-associated mitochondrial dysfunction [65].
- Apoptosis Markers: Annexin V binding to externalized phosphatidylserine is an early apoptosis indicator. Caspase-3 activation is a hallmark executioner step in apoptosis [65] [68].
ATP and Mitochondrial Function Quantification
Direct ATP measurement is crucial for interpreting death pathways. Multiple technologies are available:
- Extracellular ATP Assay Kit-Luminescence: Measures ATP released into the extracellular environment, which occurs during oncosis but is suppressed in apoptosis [66].
- ATP Assay Kit-Luminescence: Quantifies intracellular ATP levels, confirming energy depletion in oncosis [66].
- JC-1 MitoMP Detection Kit: Assesses mitochondrial membrane potential (ΔΨm). Collapse of ΔΨm is a feature of both pathways but occurs via different mechanisms [65].
Table 2: Key Research Reagent Solutions for Cell Death Analysis
| Target / Process | Kit / Probe | Primary Function |
|---|---|---|
| Extracellular ATP | Extracellular ATP Assay Kit-Luminescence | Measures ATP released from dying cells, a key DAMP [66]. |
| Intracellular ATP | ATP Assay Kit-Luminescence | Quantifies cellular ATP content to determine energy status [66]. |
| Apoptosis Detection | Annexin V Apoptosis Plate Assay Kit | Detects phosphatidylserine externalization, an early apoptosis marker [66]. |
| Cytotoxicity | Cytotoxicity LDH Assay Kit | Measures lactate dehydrogenase release, indicating loss of membrane integrity [66]. |
| Mitochondrial Membrane Potential | JC-1 MitoMP Detection Kit | Assesses mitochondrial health and function via potential-sensitive dyes [66]. |
| Autophagic Flux | Autophagic Flux Assay Kit | Monitors autophagic activity, which can accompany apoptosis [66]. |
Advanced Detection Technologies
Emerging technologies offer sophisticated ways to monitor ATP dynamics and cell death.
Electrochemical biosensors represent a powerful tool for sensitive ATP detection. One advanced design integrates homogeneous bio-recognition with enzymatic signal amplification. The system uses an ATP-binding split DNA aptamer. When ATP is present, it binds the aptamer, generating a DNA product that triggers assembly of a nanostructure on a gold electrode. Subsequent elongation via terminal deoxynucleotidyl transferase (TdT) and electrostatic adsorption of Ru(NH₃)₆³⁺ reporter molecules yields a highly amplified signal, achieving detection limits as low as 8.37 pM [69].
Molecule-responsive DNA nanopores embedded in planar bilayer lipid membranes (pBLMs) enable stochastic sensing. These synthetic nanopores are functionalized with ATP-binding aptamers that undergo conformational changes upon ATP binding, reversibly opening and closing the pore entrance. The resulting ion current fluctuations provide real-time, single-molecule measurement of ATP concentration [70].
Near-infrared-II (NIR-II) fluorescent probes allow for non-invasive, real-time in vivo ATP monitoring. A recently developed water-soluble probe uses a heptamethine-cyanine/Zn[II] complex that selectively binds ATP, inducing enhanced NIR-II fluorescence and optoacoustic signals. This enables dynamic tracking of blood ATP levels in living organisms, relevant for disease diagnosis and therapy monitoring [71].
Research Implications and Therapeutic Applications
The ATP-dependent switch between apoptosis and oncosis has significant research and clinical implications. In cancer therapy, where overcoming apoptosis resistance is a major challenge, intentionally inducing oncosis represents an alternative strategy. However, the pro-inflammatory nature of oncosis requires careful consideration of the tumor microenvironment [64].
Recent findings on BAK-mediated unconventional autophagy reveal how apoptosis actively suppresses immunogenicity by sequestering ATP in LC3-positive vesicles, preventing its release as a DAMP. Interfering with this pathway enhances ATP release and promotes immune activation against tumors, suggesting novel combination therapies [67].
In pathological conditions like exertional heat stroke-induced rhabdomyolysis, research confirms oncosis as the predominant cell death mechanism, characterized by mitochondrial dysfunction, ATP depletion, and oxidative stress. This understanding opens avenues for therapeutic interventions aimed at preserving cellular energy status [65] [68].
Integrating morphological analysis with molecular detection provides a robust framework for distinguishing apoptosis from oncosis. Central to this discrimination is the recognition that ATP levels act as a critical biochemical switch between these pathways. Advanced detection technologies, from high-resolution FF-OCT to ultrasensitive ATP biosensors, empower researchers to precisely characterize cell death mechanisms. This knowledge is fundamental for accurate drug evaluation and the development of novel therapeutic strategies that target cellular energy pathways to direct death outcomes toward desirable immunological consequences.
The study of programmed cell death, or apoptosis, represents a fundamental area of research in drug development and cancer biology. Traditional two-dimensional (2D) cell cultures have long served as the standard model system, yet they present a significantly altered physiological environment that fails to recapitulate critical aspects of in vivo tissue architecture [72]. Cells cultured in 2D monolayers exhibit disturbed morphology, changed gene expression patterns, and unlimited access to nutrients and oxygen—conditions that starkly contrast with the heterogeneous microenvironment of solid tumors [72]. These limitations become particularly problematic when studying complex processes like apoptosis, where cell-cell and cell-extracellular matrix interactions substantially influence death signaling pathways and treatment responses.
Three-dimensional (3D) cell culture models have emerged as physiologically relevant alternatives that better mimic the structural and functional complexity of native tissues. Spheroids and organoids now enable researchers to study apoptosis within contexts that feature natural cell polarity, gradient distributions of oxygen and nutrients, and proper cell-ECM interactions [72] [73]. However, the very complexity that makes these models biologically relevant also introduces significant technical challenges. The dense structure of 3D models creates substantial barriers to the penetration of therapeutic agents and imaging reagents, while simultaneously complicating signal quantification and morphological analysis [73]. This comparison guide objectively evaluates current 3D culture technologies and analytical methods, providing researchers with experimental data and protocols to overcome these persistent barriers in apoptosis research.
Comparative Analysis of 3D Culture Platforms for Apoptosis Studies
Technical Specifications and Performance Metrics
The selection of an appropriate 3D culture system represents a critical first step in apoptosis research, as different platforms offer distinct advantages and limitations. The table below provides a systematic comparison of the most widely used 3D culture techniques.
Table 1: Performance comparison of major 3D cell culture techniques
| 3D Culture Method | Key Features | Success Rate | Advantages for Apoptosis Research | Technical Limitations |
|---|---|---|---|---|
| Scaffold-based (Matrigel, Hydrogels) | Cells embedded in natural/synthetic polymer matrices [72] [74] | Varies by cell type (60-90%) [75] | Preserves tissue architecture; Enables study of ECM-mediated resistance [73] | Batch variability; Potential interference with drug penetration [73] |
| Scaffold-free (Hanging Drop) | Self-assembly of cell aggregates in suspended droplets [74] | Dependent on cell line aggregation capacity [75] | Simple, cost-effective; Uniform spheroid size [74] | Limited scalability; Challenging drug handling [74] |
| Suspension (U-bottom/Low-attachment plates) | Cell aggregation in non-adherent surfaces [72] | High for amenable cell lines (>85%) [75] | High-throughput compatibility; Reproducible spheroid formation [72] | May require optimization for different cell lines [75] |
| 3D Bioprinting | Precise deposition of cells and bioinks in predefined architectures [74] | Emerging technology | Unprecedented control over microenvironment; Spatial precision [74] | High cost; Technical complexity; Requires specialized equipment [74] |
| Patient-Derived Organoids | 3D cultures from patient tumor samples [76] | 96% with optimized protocol [76] | Preserves molecular heterogeneity; Personalized drug screening [76] | Technically challenging; Variable growth rates [76] |
Quantitative Assessment of Culture Performance
Recent studies have provided quantitative data on the efficiency and reliability of various 3D culture establishment methods. In high-grade glioma research, optimized protocols combining different tissue processing techniques have achieved remarkable success rates of 96% for establishing patient-derived cultures [76]. The study demonstrated that 3D-derived cultures from ultrasonic aspirates (3DD-UA-GSC) showed the highest success rate at 92%, significantly outperforming traditional single-cell derived cultures (69%) [76]. This improved efficiency is crucial for apoptosis research, as it ensures that the cellular models better preserve the original tumor's characteristics, including its response to death-inducing stimuli.
For colorectal cancer research, a comprehensive comparison of eight CRC cell lines across multiple 3D culture methodologies revealed significant morphological and viability differences depending on the technique employed [75]. The development of a novel compact spheroid model for SW48 cells—previously known to form only irregular aggregates—demonstrates how protocol optimization can overcome cell-line specific challenges in 3D culture [75]. These advances are particularly relevant for apoptosis studies, as compact spheroids better replicate the diffusion barriers and heterogeneous microenvironments that influence treatment efficacy in solid tumors.
Advanced Imaging Solutions for Apoptosis Quantification in 3D Models
High-Resolution, Label-Free Imaging Technologies
The complex architecture of 3D models necessitates advanced imaging approaches that can resolve subcellular morphological changes associated with apoptosis without compromising sample integrity. Full-field optical coherence tomography (FF-OCT) has emerged as a powerful label-free technique capable of visualizing apoptotic morphological alterations at the single-cell level [8]. This technology enables researchers to distinguish between apoptosis and necrosis based on characteristic structural changes: apoptotic cells display echinoid spine formation, membrane blebbing, and cell contraction, while necrotic cells exhibit rapid membrane rupture and intracellular content leakage [8].
FF-OCT systems achieve sub-micrometer axial resolution using broadband light sources (center wavelength: 650 nm, spectral width: 200 nm) and high numerical aperture objectives (NA: 0.8) [8]. The technical capability to perform continuous monitoring at 20-minute intervals for up to 180 minutes makes it particularly valuable for capturing the dynamic process of apoptosis without the phototoxicity associated with fluorescent labels [8]. Furthermore, FF-OCT-based interference reflection microscopy (IRM)-like imaging effectively highlights changes in cell-substrate adhesion and cell boundary integrity during cell death, providing additional quantitative parameters for apoptosis assessment.
Fluorescence Microscopy and High-Content Screening Applications
While label-free methods offer advantages for live monitoring, fluorescence-based approaches remain indispensable for specific molecular localization within 3D models. Confocal fluorescence microscopy and its advanced modalities enable researchers to extract spatial and temporal information from entire 3D assemblies, tracking nanoparticle entry and trafficking in spheroids and organoids [73]. However, imaging depth limitations and light scattering in dense spheroids remain significant challenges that require optical clearing techniques or specialized microscopes such as light-sheet systems.
High-content screening (HCS) platforms have been adapted for 3D models, allowing quantitative analysis of apoptosis-specific morphological changes. A recent study demonstrated that HCS can detect apoptosis induced by plant alkaloids solely based on cellular morphological descriptors, with correlation coefficients to flow cytometry apoptosis rates ranging from 0.64 to 0.98 [77]. This approach enables rapid toxicity screening in early product development without the need for extensive sample processing that could compromise 3D architecture.
Table 2: Imaging techniques for apoptosis analysis in 3D cultures
| Imaging Technique | Resolution | Penetration Depth | Key Advantages for Apoptosis Studies | Sample Requirements |
|---|---|---|---|---|
| FF-OCT [8] | Sub-micrometer axial and transverse | Limited by scattering in dense spheroids | Label-free; Continuous live monitoring; Distinguishes apoptosis vs. necrosis | No staining; Compatible with live cells |
| Confocal Microscopy [73] | ~200 nm lateral, ~500 nm axial | 50-100 μm (depends on density) | Molecular specificity; 3D reconstruction; Multi-channel detection | Fluorescent labeling; May require clearing |
| High-Content Screening [77] | Varies with objectives | Typically limited to smaller spheroids | High-throughput; Multiparametric analysis; Quantitative morphological descriptors | Fluorescent markers for automated analysis |
| Light-Sheet Microscopy | ~1-5 μm | Several hundred microns | Rapid volumetric imaging; Reduced phototoxicity | Sample mounting in specialized chambers |
Experimental Protocols for Apoptosis Assessment in 3D Models
Standardized Workflow for 3D Spheroid Formation and Treatment
The following protocol outlines a standardized approach for generating consistent multicellular tumor spheroids (MCTS) for apoptosis studies, adapted from recent colorectal cancer research [75]:
Materials:
- CRC cell lines (e.g., DLD1, HCT116, SW48) or other relevant cell types
- U-bottom 96-well plates with ultra-low attachment surface or regular plates treated with anti-adherence solution
- Complete culture medium appropriate for the cell line
- Methylcellulose hydrogel (optional, for compact spheroid formation)
- Therapeutic agents for apoptosis induction (e.g., doxorubicin, staurosporine)
Method:
- Harvest cells using standard trypsinization and prepare a single-cell suspension at 5-10 × 10³ cells/well in complete medium.
- For challenging cell lines like SW48 that form loose aggregates, supplement medium with 0.5-1% methylcellulose to promote compact spheroid formation [75].
- Seed 100 μL cell suspension per well in U-bottom 96-well plates.
- Centrifuge plates at 300 × g for 5 minutes to promote initial cell aggregation.
- Incubate at 37°C with 5% CO₂ for 3-5 days, allowing spheroid formation.
- Monitor spheroid compaction and roundness daily using brightfield microscopy.
- Treat mature spheroids with apoptosis-inducing compounds, considering penetration kinetics which may require longer exposure times compared to 2D cultures.
- Assess apoptosis using appropriate endpoint assays or live monitoring techniques.
This protocol has demonstrated success across eight CRC cell lines, with methylcellulose supplementation particularly effective for promoting compact spheroid morphology in otherwise challenging lines like SW48 [75].
Integrated Workflow for Apoptosis Detection
The diagram below illustrates a comprehensive experimental workflow that combines morphological and molecular approaches for apoptosis detection in 3D models:
Experimental Workflow for Apoptosis Detection
Research Reagent Solutions for 3D Apoptosis Studies
The selection of appropriate reagents represents a critical factor in successful 3D apoptosis studies. The following table details essential materials and their specific functions in experimental workflows.
Table 3: Essential research reagents for 3D apoptosis studies
| Reagent Category | Specific Examples | Function in Apoptosis Research | Application Notes |
|---|---|---|---|
| Scaffold Matrices | Matrigel, Collagen Type I, Synthetic hydrogels [72] [74] | Provide 3D extracellular environment; Influence drug penetration | Matrigel may contain endogenous bioactive factors that affect apoptosis [72] |
| Apoptosis Inducers | Doxorubicin, Staurosporine, Plant alkaloids [8] [77] | Activate intrinsic/extrinsic apoptosis pathways | Penetration efficiency varies in 3D models; Longer exposure may be needed [73] |
| Viability Assays | Modified MTT/WST, ATP-based assays | Measure metabolic activity as apoptosis indicator | Standard assays may require optimization for 3D models [75] |
| Molecular Probes | Caspase substrates, Annexin V, DNA dyes | Specific detection of apoptosis markers | Penetration into dense spheroids can be limited [73] |
| Imaging Reagents | Cell-permeable dyes, Antibodies for IF | Enable visualization of morphological changes | Smaller fragments/nanobodies show better penetration [73] |
Strategic Framework for Overcoming Penetration Barriers
Technical Approaches to Enhance Compound Penetration
The dense extracellular matrix and tight cell-cell contacts in 3D models create significant challenges for the uniform penetration of therapeutic compounds and imaging reagents. Several strategies have demonstrated effectiveness in overcoming these barriers:
Matrix Modulation Techniques: Partial enzymatic digestion of ECM components using collagenase or hyaluronidase can increase porosity and enhance diffusion without completely disrupting 3D architecture [73]. For scaffold-based models, selecting matrices with controlled density and composition allows researchers to balance physiological relevance with experimental accessibility.
Nanoparticle Delivery Systems: Engineered nanoparticles (1-100 nm) represent promising carriers for improving the delivery of apoptosis-inducing compounds into the core of 3D models [73]. Studies using high-resolution fluorescence imaging have shown that nanoparticle size, surface charge, and composition significantly influence their penetration efficiency and distribution within spheroids [73].
Computational and Modeling Approaches
Predictive modeling of diffusion kinetics provides valuable insights for experimental design. Computational approaches that simulate compound penetration based on molecular weight, hydrophobicity, and 3D model characteristics can help researchers optimize treatment protocols and interpret heterogeneous responses within different regions of spheroids. These modeling efforts are particularly important for apoptosis studies, as they help distinguish between true cellular resistance and limited drug access.
Overcoming penetration and signal quantification barriers in 3D cell cultures requires integrated methodological approaches that span from model establishment to final analysis. No single technique provides a comprehensive solution; instead, researchers must select complementary methods based on their specific apoptosis research questions. The optimal strategy combines physiological 3D models with advanced imaging technologies and carefully optimized experimental protocols.
Future directions in the field include the development of more sophisticated co-culture systems that incorporate stromal components, standardized protocols for cross-laboratory validation, and computational tools for extracting maximal information from complex 3D datasets. As these technologies mature, 3D models are poised to become increasingly predictive of in vivo responses, ultimately enhancing the efficiency of drug development and the accuracy of apoptosis mechanism studies.
Programmed cell death (PCD) represents a fundamental biological process crucial for development, homeostasis, and disease pathogenesis in multicellular organisms [6]. While apoptosis has been extensively studied for decades, recent research has unveiled multiple distinct PCD pathways, including necroptosis, pyroptosis, and the controversial concept of oncosis [78] [79]. The precise differentiation of these cell death modalities is essential for researchers and drug development professionals seeking to understand their roles in health and disease. This guide provides a comprehensive comparison of these PCD forms, focusing on integrating morphological assessment with molecular detection methods, a critical approach for accurate identification and characterization in experimental systems. The emerging understanding that these pathways exhibit complex crosstalk and can occur simultaneously as PANoptosis in certain pathological contexts further underscores the need for precise discrimination methods [80].
Morphological and Biochemical Hallmarks of Major PCD Pathways
Comparative Analysis of Key Characteristics
Table 1: Comprehensive comparison of apoptosis, necroptosis, pyroptosis, and oncosis characteristics
| Feature | Apoptosis | Necroptosis | Pyroptosis | Oncosis |
|---|---|---|---|---|
| Nuclear morphology | Chromatin condensation, nuclear fragmentation, pyknosis [6] | Minimal chromatin condensation [6] | Nuclear condensation [6] | Karyolysis (nuclear dissolution) [6] |
| Cellular morphology | Cell shrinkage, membrane blebbing, apoptotic bodies [6] [4] | Cell swelling, organelle edema, plasma membrane rupture [6] [78] | Cell swelling, plasma membrane pore formation, bubble-like protrusions [6] | Cell swelling, plasma membrane rupture without blebbing [6] |
| Inflammation | Anti-inflammatory, no release of cellular contents [4] | Pro-inflammatory, release of DAMPs and HMGB1 [78] | Pro-inflammatory, release of IL-1β and IL-18 [6] [80] | Pro-inflammatory, uncontrolled content release [6] |
| Key executioners | Caspase-3/7, CAD/ICAD, phosphatidylserine externalization [6] [4] | Phospho-MLKL oligomers, membrane disruption [81] | Gasdermin D N-terminal pores, inflammasome activation [81] | Loss of ion homeostasis, energy depletion [6] |
| Primary triggers | DNA damage, growth factor deprivation, death receptor activation [78] | TNF-α, viral infection, caspase inhibition [78] [80] | Pathogen infection, inflammatory caspases, NLRP3 activation [78] [80] | Extreme physical/chemical stress, ischemia, toxins [6] [4] |
| Molecular regulation | Tightly genetically controlled [6] | Regulated (RIPK1-RIPK3-MLKL axis) [80] | Regulated (inflammasome-caspase-gasdermin) [80] | Unregulated, accidental [6] |
Molecular Mechanisms and Signaling Pathways
Diagram 1: Signaling pathways of different PCD forms. Note the regulatory nodes where pathways intersect, particularly caspase-8's role in apoptosis/necroptosis switch.
Integrated Detection Methodologies
Morphological Assessment Techniques
Light microscopy, particularly transmitted light modalities like phase contrast (PC) and differential interference contrast (DIC), enables real-time observation of characteristic morphological changes without staining or significant sample preparation [4]. Apoptotic cells display cytoplasmic blebbing, cell shrinkage, and nuclear fragmentation, while necroptotic and pyroptotic cells exhibit swelling followed by membrane rupture or pore formation, respectively [4]. Oncosis presents with rapid cellular swelling and loss of membrane integrity without the controlled blebbing seen in apoptosis.
Electron microscopy provides ultra-structural details, revealing organelle-specific changes such as mitochondrial cristae loss in ferroptosis, apoptotic body formation in apoptosis, and the distinctive pores formed by gasdermin proteins in pyroptosis [6].
Molecular and Biochemical Detection
Table 2: Experimental methods for detecting different PCD forms
| Method | Parameters Measured | Apoptosis | Necroptosis | Pyroptosis | Oncosis |
|---|---|---|---|---|---|
| Flow Cytometry | Membrane permeability, mitochondrial potential, protein markers [82] [4] | Annexin V/PI, caspase-3 activation [82] | p-MLKL, RIPK1/3 activation [78] | Gasdermin D cleavage, caspase-1 activation [80] | PI uptake only [4] |
| Western Blot | Protein markers, signaling events [4] | Cleaved caspase-3, PARP cleavage [6] | Phospho-MLKL, RIPK3 [78] | Cleaved gasdermin D, IL-1β [80] | No specific markers [6] |
| Immunofluorescence | Protein localization, activation [4] | Phosphatidylserine exposure, cytochrome c release [6] | MLKL oligomerization [78] | Gasdermin D pores, ASC speck formation [80] | Cellular swelling markers |
| DNA Fragmentation | Nuclear changes [4] | TUNEL positive, DNA laddering [11] | Minimal specific fragmentation [6] | TUNEL positive [6] | Random DNA degradation [6] |
| LDH Release Assay | Membrane integrity [80] | Late stage only [4] | Significant release [78] | Significant release [80] | Extensive release [6] |
Experimental Workflow for Integrated Detection
Diagram 2: Integrated experimental workflow for PCD identification combining morphological and molecular approaches.
The Researcher's Toolkit: Essential Reagents and Methods
Key Research Reagent Solutions
Table 3: Essential reagents and materials for PCD research
| Reagent/Method | Primary Application | Specific Function | Detected PCD Form |
|---|---|---|---|
| Annexin V conjugates [82] [4] | Flow cytometry, microscopy | Detects phosphatidylserine externalization | Apoptosis (early stage) |
| Caspase-3/7 substrates (NucView 488) [4] | Live-cell imaging | Fluorogenic substrates activated by executioner caspases | Apoptosis |
| Propidium Iodide [82] [4] | Flow cytometry, microscopy | Membrane impermeant DNA dye indicating loss of integrity | All necrotic forms (late stage) |
| Antibodies: Cleaved caspase-3 [6] | Western blot, IF | Detects activated executioner caspase | Apoptosis |
| Antibodies: Phospho-MLKL [78] | Western blot, IF | Detects activated necroptosis executioner | Necroptosis |
| Antibodies: Cleaved gasdermin D [80] | Western blot, IF | Detects activated pyroptosis executioner | Pyroptosis |
| TUNEL assay kits [11] [4] | Microscopy, flow cytometry | Detects DNA fragmentation | Apoptosis, pyroptosis |
| LDH release assays [80] | Spectrophotometry | Measures lactate dehydrogenase release | All lytic forms |
| RIPK1 inhibitors (Nec-1) [78] | Functional studies | Specific necroptosis inhibition | Necroptosis (specific inhibition) |
| Caspase inhibitors (Z-VAD-FMK) [80] | Functional studies | Pan-caspase inhibition (can induce necroptosis) | Apoptosis, pyroptosis inhibition |
| CY-09 [80] | Functional studies | NLRP3 inflammasome inhibition | Pyroptosis inhibition |
Advanced Research Applications and Considerations
PANoptosis: Integrated Cell Death Communication
Emerging evidence reveals that PCD pathways do not operate in isolation but exhibit complex crosstalk in specific pathological contexts. The concept of PANoptosis describes a multifaceted inflammatory PCD pathway that integrates components from pyroptosis, apoptosis, and necroptosis, which cannot be accounted for by any of these three PCD pathways alone [80]. This integrated death pathway has been observed in response to specific stimuli, such as TNF-α-induced bone infection models, where inhibition of a single pathway (e.g., NLRP3 inhibition with CY-09) can rescue cells from PANoptosis and restore osteogenic differentiation [80].
Technical Considerations for Accurate Discrimination
Researchers must consider several critical factors when designing experiments to distinguish PCD forms:
Temporal dynamics: The sequence of molecular events varies significantly between PCD forms. Apoptotic caspase activation precedes membrane changes, while in necroptosis and pyroptosis, membrane disruption is a later event following kinase activation or gasdermin cleavage, respectively [81].
Context dependence: Cell type, stimulus, and cellular microenvironment profoundly influence PCD pathway activation. For example, caspase-8 serves as a molecular switch between apoptosis and necroptosis depending on its activation status [81].
Inhibitor specificity: Chemical inhibitors should be used with caution as many exhibit off-target effects at higher concentrations. Combination approaches using multiple specific inhibitors provide more reliable results [80].
Multiparameter assessment: No single parameter reliably distinguishes all PCD forms. Integrated approaches combining morphological assessment with multiple molecular markers are essential for accurate identification [4].
The comprehensive integration of morphological assessment with molecular detection methods provides researchers with powerful tools to discriminate between apoptosis, necroptosis, pyroptosis, and oncosis. This discrimination is essential for understanding fundamental biological processes and developing targeted therapeutic strategies for diseases characterized by dysregulated cell death.
The accurate detection of apoptosis, or programmed cell death, is fundamental to advancing biomedical research, particularly in oncology and drug discovery. Apoptosis detection strategies have evolved into two principal categories: molecular methods, which identify specific biochemical markers, and morphological methods, which capture the physical changes characteristic of dying cells. Molecular detection techniques, such as the Annexin V/Propidium Iodide (PI) assay, provide high specificity by targeting established biomarkers like phosphatidylserine (PS) externalization [83] [84]. In parallel, morphological strategies leverage both classic imaging and advanced, label-free computational approaches to identify structural alterations, including cell shrinkage and the formation of apoptotic bodies [63] [85].
A transformative trend in the field is the move toward integrating these morphological and molecular approaches. This synergy creates a more comprehensive analytical framework, enhancing the reliability, depth, and predictive power of apoptosis research. Integrated strategies are becoming crucial for applications ranging from high-throughput drug screening to the development of personalized medicine, where understanding both the "how" and "when" of cell death is critical [63] [55] [20]. This guide provides a detailed comparison of current methods and experimental protocols to help researchers select the optimal strategy based on their specific research purpose and sample type.
Comparative Analysis of Apoptosis Detection Methods
The table below summarizes the core characteristics, advantages, and limitations of key apoptosis detection methodologies, providing a foundation for strategic selection.
Table 1: Comparative Overview of Apoptosis Detection Methods
| Method Category | Specific Technique | Key Readout / Target | Throughput | Key Advantages | Key Limitations |
|---|---|---|---|---|---|
| Molecular Assays | Annexin V/PI Staining [83] [84] | PS externalization & membrane integrity | Medium | High specificity; distinguishes early/late apoptosis | Requires fluorescent labels and sample preparation |
| Morphological Profiling | Cell Painting Assay [63] | Multi-compartment cellular morphology | High | High-content, unbiased; predicts mechanism of action | Complex data analysis; requires specialized instrumentation |
| Label-Free Imaging & AI | ApoBD Detection via ResNet50 [85] | Apoptotic body formation (phase-contrast) | High | Label-free; non-perturbing; earlier detection | Requires expert annotation for model training |
| Flow Cytometry & ML | MLP on FSC/SSC data [83] | Cell size & granularity (FSC-A, SSC-A, etc.) | High | Stain-free classification; uses standard flow parameters | Lower specificity than fluorescent assays |
| Electronic Sensing | Microfluidic Chip [84] | PS externalization (electronic capture) | Medium | Label-free; portable; potential for point-of-care | Emerging technology; not yet widely adopted |
Detailed Methodologies and Experimental Protocols
Molecular Method: Annexin V/Propidium Iodide (PI) Assay with Flow Cytometry
The Annexin V/PI assay is a gold-standard molecular method for quantifying apoptosis by detecting the loss of plasma membrane asymmetry and integrity [83] [84].
Experimental Protocol:
- Cell Preparation: Harvest cells (e.g., ~1 x 10^6 cells) and wash twice with cold phosphate-buffered saline (PBS).
- Staining: Resuspend the cell pellet in 100 µL of 1X Annexin V binding buffer.
- Incubation: Add fluorophore-conjugated Annexin V (e.g., Annexin V-Alexa Fluor 488) and Propidium Iodide (PI) to the cell suspension. Incubate for 15 minutes at room temperature in the dark.
- Analysis: Add an additional 400 µL of binding buffer and analyze the cells using a flow cytometer within 1 hour.
- Gating Strategy: Analyze flow cytometry data by gating on the cell population based on forward scatter (FSC) and side scatter (SSC). Then, create a dot plot of Annexin V fluorescence vs. PI fluorescence to distinguish populations:
- Viable cells: Annexin V-negative, PI-negative.
- Early apoptotic cells: Annexin V-positive, PI-negative.
- Late apoptotic/necrotic cells: Annexin V-positive, PI-positive.
Morphological Method: AI-Driven Label-Free Detection of Apoptotic Bodies
This label-free method uses deep learning on phase-contrast images to directly detect apoptotic bodies (ApoBDs), offering a non-perturbative alternative [85].
Experimental Protocol:
- Image Acquisition:
- Culture and treat cells in nanowell arrays or standard culture dishes.
- Acquire time-lapse phase-contrast images using an automated microscope (e.g., Zeiss Axio microscope with a 20x objective) every 5 minutes. Maintain environmental control (humidity, CO2, temperature).
- Data Preprocessing:
- Use a pipeline (e.g., TIMING pipeline) to identify and crop individual nanowells or fields of view from the raw image data [85].
- Compile image sequences for each well.
- Model Training & Application:
- Annotation: Manually annotate a subset of images to indicate the presence or absence of ApoBDs as ground truth.
- Training: Train a convolutional neural network (CNN), such as a ResNet50 architecture, on the annotated image set to classify frames containing ApoBDs.
- Prediction: Apply the trained model to new image sequences. The onset of apoptosis is typically assigned when ApoBDs are detected in three consecutive frames.
Integrated Approach: Flow Cytometry with Machine Learning
This approach leverages standard flow cytometry parameters (FSC and SSC) to create a stain-free classification model, combining morphological data with machine learning [83].
Experimental Protocol:
- Sample Preparation & Staining:
- Treat cells (e.g., HCT116 colorectal cancer cells) with an apoptosis-inducing agent (e.g., miR-34a mimic).
- Stain an aliquot of cells with Annexin V-Alexa Fluor 488 and PI to establish the ground truth for "live" (Annexin V-negative) and "apoptotic" (Annexin V-positive) populations.
- Data Collection:
- Analyze the stained cells on a flow cytometer.
- Collect the six morphological parameters: FSC-A (area), FSC-H (height), FSC-W (width), SSC-A (area), SSC-H (height), and SSC-W (width) for each cell.
- Record the ground truth state (live/apoptotic) for each cell based on its Annexin V signal.
- Model Building & Validation:
- Data Standardization: Standardize the six morphological features to ensure comparable scales.
- Training: Train a Multilayer Perceptron (MLP) model on 80% of the data, using the six features as inputs and the Annexin V-based classification as the training label.
- Validation: Test the trained MLP model on the remaining 20% of the data. The model in the cited study achieved a live cell recall of 0.93 and precision of 0.91 [83].
An Integrated Framework for Apoptosis Detection
The following diagram illustrates a strategic workflow for integrating morphological and molecular apoptosis detection methods, guiding researchers from experimental setup to a comprehensive analysis.
Integrated Apoptosis Detection Workflow
Morphological Profiling with the Cell Painting Assay
The Cell Painting assay represents a high-content, morphological approach that uses up to six fluorescent dyes to label multiple cellular compartments, generating rich, high-dimensional data for phenotypic profiling [63].
Cell Painting Assay Workflow
AI and Label-Free Apoptosis Detection Pipeline
Advanced computational methods now enable direct, label-free detection of apoptosis by recognizing subtle morphological features, such as apoptotic bodies (ApoBDs).
AI-Based Apoptosis Detection Pipeline
The Scientist's Toolkit: Essential Reagents and Materials
Successful apoptosis detection relies on a suite of specialized reagents and instruments. The following table details key solutions used in the experiments cited in this guide.
Table 2: Key Research Reagent Solutions and Their Functions
| Item Name | Function / Application | Example Use Case |
|---|---|---|
| Annexin V (fluorophore-conjugated) | Binds to externalized phosphatidylserine (PS) to detect early apoptosis. | Annexin V-FITC used in flow cytometry to distinguish apoptotic from live cells [83] [84]. |
| Propidium Iodide (PI) | DNA intercalating dye that stains nuclei in cells with compromised membrane integrity (late apoptosis/necrosis). | Used in conjunction with Annexin V in the standard Annexin V/PI assay [83]. |
| Cell Painting Dye Set | A multiplexed panel of dyes (e.g., Hoechst, Phalloidin, Concanavalin A) to stain multiple organelles. | Used in the Cell Painting assay for high-content morphological profiling [63]. |
| Annexin V Binding Buffer | Provides the optimal calcium-containing environment for Annexin V to bind to PS. | Essential buffer for resuspending cells during Annexin V staining protocols [84]. |
| PKH67/PKH26 Cell Linkers | Fluorescent cell membrane labels for long-term tracking of different cell populations in co-culture. | Used to label effector and target cells differently in TIMING assays [85]. |
| Microfluidic Nanowell Chip | PDMS-based device for isolating single cells or cell pairs for time-lapse imaging and analysis. | Used in the TIMING platform to study cell-cell interactions and apoptosis [85]. |
Strategic Selection Guidelines
Choosing the right apoptosis detection method is a strategic decision that directly impacts research outcomes. The following guidelines, synthesized from the compared methods, will help align your choice with project goals.
For High-Throughput Drug Discovery and Mechanism of Action (MoA) Studies: The Cell Painting Assay is unparalleled. Its ability to generate rich, unbiased morphological profiles makes it ideal for predicting compound bioactivity and MoA in early-stage screening [63]. While requiring specialized instrumentation and complex data analysis, the high content information it provides is invaluable for characterizing novel therapeutics.
For Rapid, Label-Free Screening and Dynamic Live-Cell Imaging: AI-driven label-free imaging is the emerging method of choice. This strategy is optimal when fluorescent labels could be toxic, disruptive, or cost-prohibitive. It enables the detection of apoptosis earlier than some molecular methods by directly identifying ApoBDs, and is perfect for long-term time-lapse experiments [85].
For Gold-Standard Validation and Quantitative Discrimination of Apoptotic Stages: The Annexin V/PI Assay remains the benchmark. Use this molecular method when you need to rigorously quantify the percentages of cells in early vs. late apoptosis for validation purposes. It is a robust and widely accepted technique, though it requires cell staining and cannot be used for long-term live-cell tracking [83] [84].
For Integrating into Existing Flow Cytometry Workflows without Additional Staining: Employ Machine Learning on FSC/SSC Parameters. This approach is highly practical for labs that routinely use flow cytometry, as it extracts apoptotic cell information from standard light scatter data, eliminating the need for additional reagents and channels. It is a powerful method for stain-free classification, though it may have lower specificity than fluorescent-based assays [83].
For Point-of-Care Potential or Resource-Limited Settings: Electronic microfluidic chips represent a forward-looking technology. While not yet widely adopted, these platforms offer the promise of portable, label-free apoptosis detection with electronic readouts, which could be transformative for clinical diagnostics and field applications [84].
The most powerful research strategies often involve combining these methods. An integrated approach, such as using molecular assays for definitive validation and morphological profiling for deep phenotyping, provides a more complete and reliable picture of cellular health and death, ultimately accelerating scientific discovery.
Benchmarking and Validation: Ensuring Accuracy and Reliability in Apoptosis Detection
The precise detection of programmed cell death (PCD) is fundamental to advancing our understanding of cellular behavior in health and disease. Among the various forms of PCD, apoptosis remains the most extensively characterized, with caspase-3 cleavage and phosphatidylserine (PS) exposure established as two paramount molecular biomarkers. These indicators represent critical junctures in the apoptotic cascade, serving as verifiable milestones that researchers rely on to confirm the presence and progression of this controlled cellular demise. While traditional methods often treated these biomarkers in isolation, emerging perspectives in molecular biology emphasize the power of integrative detection approaches that combine these molecular signatures with high-resolution morphological analysis. This paradigm shift enables a more holistic view of cellular behavior, capturing not only the biochemical events but also the structural transformations that define apoptotic progression.
The integration of morphological and molecular detection methods addresses a fundamental need in life science research: to visualize and quantify cellular processes with high spatiotemporal resolution within physiologically relevant contexts. As spatial omics technologies advance, the ability to systematically link cell morphological behaviors with molecular dynamics has become increasingly crucial for exploring complex cellular processes in diseases [86]. This guide provides a comprehensive comparison of these two gold-standard biomarkers, detailing their detection methodologies, applications, and performance characteristics to inform research and drug development strategies.
Molecular Mechanisms and Signaling Pathways
The Apoptotic Cascade: From Initiation to Execution
Apoptosis proceeds through two principal pathways: the extrinsic (death receptor) pathway and the intrinsic (mitochondrial) pathway. Both converge on the activation of executioner caspases, with caspase-3 serving as the primary effector. The extrinsic pathway initiates through ligand binding to death receptors (e.g., Fas, TNFR) at the cell surface, forming the death-inducing signaling complex (DISC) that activates initiator caspase-8. The intrinsic pathway triggers mitochondrial outer membrane permeabilization (MOMP) in response to cellular stress, releasing cytochrome c and forming the apoptosome to activate initiator caspase-9. Both pathways ultimately activate executioner caspase-3, which cleaves numerous cellular substrates, leading to the systematic dismantling of the cell [6].
Simultaneously, during early apoptosis, the membrane phospholipid phosphatidylserine (PS), normally restricted to the inner leaflet of the plasma membrane, undergoes asymmetric redistribution to the outer leaflet. This "eat-me" signal facilitates the recognition and clearance of apoptotic cells by phagocytes, preventing inflammatory responses to cellular debris. This process is regulated by specific lipid transporters whose activity is modified by caspase-mediated cleavage [87] [6].
Pathway Integration and Morphological Correlates
The following diagram illustrates the key apoptotic signaling pathways and their relationship to the primary biomarkers discussed in this guide:
Comparative Analysis of Gold-Standard Biomarkers
Caspase-3 Cleavage: The Executioner Protease
Caspase-3 serves as the key executioner protease in apoptosis, irreversibly cleaving numerous cellular substrates after aspartic acid residues within specific recognition motifs, most notably DEVD (Asp-Glu-Val-Asp) [36]. Activation occurs through proteolytic cleavage of procaspase-3 by initiator caspases (caspase-8 or -9), generating active caspase-3 fragments that systematically dismantle the cell by targeting structural and regulatory proteins [6].
Detection Methodologies: Caspase-3 activity is most commonly measured using consensus tetrapeptide substrates (DEVD) in lytic cell-based assays. These substrates generate fluorescent, colorimetric, or luminescent signals upon cleavage:
- Fluorogenic substrates: DEVD conjugated to AMC, AFC, or R110
- Luminogenic substrates: DEVD conjugated to aminoluciferin (Caspase-Glo 3/7)
- FRET-based reporters: GFP variants with inserted DEVD cleavage motifs [88] [36]
Novel fluorescent reporter technologies engineered through mutagenesis-based insertion of caspase-3 cleavage motifs into green fluorescent protein enable real-time visualization of apoptosis inside living cells with greater sensitivity and simplicity than existing methods [89]. These "bright-to-dark" systems lose fluorescence upon caspase-3 activation, providing a direct readout of apoptosis progression.
Phosphatidylserine Exposure: The Phagocytic Signal
PS externalization represents an early "eat-me" signal in apoptosis, occurring before membrane permeability changes. This process facilitates the immunologically silent clearance of apoptotic cells by phagocytes [87]. While historically viewed as an apoptosis-specific phenomenon, PS exposure also occurs on certain extracellular vesicle (EV) populations, with approximately 90% of circulating EVs carrying PS [87].
Detection Methodologies: PS exposure is predominantly detected using PS-binding proteins in conjunction with flow cytometry, microscopy, or plate reader-based approaches:
- Annexin V: Classical PS-binding protein requiring calcium
- MFG-E8 derivatives: Novel high-affinity PS-binding reagents with superior sensitivity
- C1-tetramer: Streptavidin-multimerized MFG-E8 C1 domains with enhanced detection capability for small vesicles with low PS content [87]
The development of recombinant annexin V fusion proteins containing subunits of shrimp-derived luciferase has enabled no-wash enzyme complementation approaches for detecting PS exposure using multimode plate readers, making this biomarker more accessible for high-throughput screening applications [36].
Performance Comparison Table
Table 1: Comparative analysis of caspase-3 cleavage and phosphatidylserine exposure as apoptosis biomarkers
| Parameter | Caspase-3 Cleavage | Phosphatidylserine Exposure |
|---|---|---|
| Position in Apoptotic Cascade | Execution phase; point of no return | Early-mid phase; potentially reversible under certain conditions |
| Primary Detection Methods | DEVD-based fluorogenic/luminogenic substrates; cleavage-specific antibodies; FRET reporters | Annexin V binding; MFG-E8 derivatives; C1-tetramer |
| Cellular Specificity | High for apoptosis | High, but also present on some EV populations and activated platelets |
| Temporal Resolution | Excellent for mid-late apoptosis | Excellent for early apoptosis detection |
| Throughput Capability | High (luminogenic assays adaptable to 1536-well format) | Moderate-high (recent no-wash assays enable HTS) |
| Key Advantages | High specificity; irreversible commitment to death; multiple detection formats | Early detection capability; viability information when combined with viability dyes |
| Key Limitations | May miss early apoptotic events; potential caspase-independent apoptosis | Not absolutely specific for apoptosis; requires careful controls for membrane integrity |
| Typical Sample Types | Cell lysates, fixed cells, live cell imaging | Whole cells (flow cytometry), live cell imaging, tissue sections |
| Morphological Correlation | Correlates with apoptotic body formation, nuclear fragmentation | Correlates with membrane blebbing, cell shrinkage |
Experimental Protocols and Methodologies
Luminescent Caspase-3/7 Activity Assay
The following protocol adapts the established Caspase-Glo 3/7 assay for high-throughput screening applications [36]:
Materials:
- Caspase-Glo 3/7 reagent (DEVD-aminoluciferin substrate)
- Opaque-walled white plates (96-, 384-, or 1536-well format)
- Multimode plate reader capable of luminescence detection
- Cell culture reagents
Procedure:
- Plate cells in appropriate density and treat with experimental conditions
- Equilibrate Caspase-Glo 3/7 reagent and plate to room temperature
- At assay endpoint, add equal volume of Caspase-Glo 3/7 reagent to each well
- Mix contents gently using a plate shaker (300-500 rpm, 30 seconds)
- Incubate at room temperature (30-60 minutes) to allow signal development
- Measure luminescence using plate reader (integration time: 0.5-1 second/well)
Technical Notes:
- Assay performance is consistent in presence of 0.1-1% DMSO (common solvent for compound libraries)
- Luminescent detection offers ~20-50-fold greater sensitivity than fluorogenic versions
- Miniaturization possible to 1536-well format for ultra-high-throughput screening
- Linear range should be established for each cell type and experimental condition
PS Exposure Detection via No-Wash Annexin V Assay
This protocol describes a homogeneous, no-wash approach for detecting PS exposure using engineered annexin V proteins [36]:
Materials:
- Recombinant annexin V fusion protein (e.g., annexin V-NanoBiT)
- Propidium iodide or other viability dye (optional)
- Assay buffer with calcium
- Appropriate plate reader or flow cytometer
Procedure:
- Harvest cells and wash with cold PBS (if using suspension cells)
- Resuspend cells in assay buffer containing calcium (1-2.5 mM)
- Add annexin V fusion protein according to manufacturer's recommended concentration
- Add viability dye if distinguishing early apoptosis from late apoptosis/necrosis
- Incubate for 15-20 minutes at room temperature protected from light
- Analyze by flow cytometry or plate reader without washing steps
Technical Notes:
- Maintain calcium concentration (1-2.5 mM) for optimal annexin V binding
- Include controls: unstained, single stains, viability dye only
- For plate reader formats, signal normalization to cell number may be necessary
- Novel MFG-E8 derivatives and C1-tetramer offer superior sensitivity for PS detection on small EVs [87]
Integrated Workflow for Combined Detection
The following diagram illustrates an experimental workflow that integrates both biomarker detection methods with morphological analysis:
Research Reagent Solutions
Table 2: Essential research reagents for caspase-3 and phosphatidylserine detection
| Reagent Category | Specific Examples | Primary Applications | Key Features |
|---|---|---|---|
| Caspase-3 Fluorogenic Substrates | Ac-DEVD-AMC, Ac-DEVD-AFC | Plate reader detection, enzyme kinetics | UV excitation, moderate sensitivity, established protocols |
| Caspase-3 Luminogenic Substrates | DEVD-aminoluciferin (Caspase-Glo 3/7) | HTS, low-abundance samples | High sensitivity, broad dynamic range, 1536-well compatible |
| Caspase-3 FRET Reporters | DEVD-inserted GFP variants, ZipGFP-based biosensors | Live-cell imaging, real-time kinetics | Spatiotemporal resolution, single-cell analysis |
| PS-Binding Proteins | Annexin V (FITC, APC conjugates) | Flow cytometry, microscopy | Well-characterized, requires calcium |
| Advanced PS-Detection Reagents | MFG-E8-eGFP, C1-tetramer | EV detection, high-sensitivity applications | Superior affinity, detects low PS density |
| Homogeneous PS Assays | Annexin V-NanoBiT, no-wash kits | HTS, screening applications | No wash steps, reduced hands-on time |
| Cleavage-Specific Antibodies | Anti-cleaved caspase-3 (Asp175) | IHC, ICC, Western blot | Specific for active caspase-3, tissue applications |
Integration with Morphological Analysis
Bridging Molecular and Morphological Detection
The integration of molecular biomarkers with high-resolution morphological analysis represents the cutting edge of apoptosis research. Traditional histopathological assessment has long relied on morphological features such as cell shrinkage, membrane blebbing, nuclear condensation, and apoptotic body formation to identify apoptosis [6]. However, these morphological assessments benefit tremendously from correlation with molecular biomarkers to confirm the specific cell death pathway involved.
Advanced computational frameworks like MorphLink now enable systematic identification of disease-related morphological-molecular interplays by extracting interpretable morphological features and linking them with molecular measurements in spatial omics analyses [86]. This approach provides a transparent view of cellular behavior heterogeneity within tissue regions with similar cell type compositions, characterizing tumor subtypes and immune diversity across different organs.
Applications in Disease Research and Drug Development
The combined assessment of caspase-3 activation and PS exposure has proven particularly valuable in clinical and translational research contexts:
Acute Ischemic Stroke (AIS): Serum caspase-3 levels show significant elevation in AIS patients compared to controls, with levels remaining elevated at 24 and 48 hours post-admission. In subgroup analyses, lower caspase-3 levels in patients with moderate/severe National Institute of Health Stroke Scale (NIHSS) scores were associated with early mortality, suggesting potential prognostic value [90].
Forensic Pathology: Caspase-3 immunohistochemistry serves as a reliable marker of supravitality in ligature marks in premortem hanging cases, with significantly higher expression in compressed skin compared to healthy skin [91].
Cancer Research: Real-time imaging of executioner caspase dynamics coupled with detection of apoptosis-induced proliferation and immunogenic cell death provides insights into tumor responses to therapeutic agents [92].
Caspase-3 cleavage and phosphatidylserine exposure represent complementary gold standards in apoptosis detection, each offering distinct advantages and applications. Caspase-3 activation serves as an irreversible commitment to apoptotic death with high specificity, while PS exposure provides an early window into the apoptotic process with relevance for phagocytic clearance. The continued development of sensitive detection reagents, including novel fluorescent reporters and high-affinity PS-binding proteins, has enhanced our ability to monitor these biomarkers with spatiotemporal precision in living systems.
The integration of these molecular biomarkers with morphological assessment through advanced computational frameworks represents the future of apoptosis research, enabling multidimensional analysis of cell death in physiologically relevant contexts. This integrated approach provides researchers and drug development professionals with powerful tools to investigate disease mechanisms, screen therapeutic compounds, and validate treatment efficacy across diverse biological systems from in vitro models to clinical specimens.
The accurate detection of programmed cell death is fundamental to advancing our understanding of cellular mechanisms in health and disease, particularly in cancer research and therapeutic development [21]. Apoptosis, a highly regulated process, is characterized by specific morphological features and biochemical events that unfold in a coordinated manner [17] [21]. This complex nature necessitates detection methodologies that can capture both structural and molecular changes. The prevailing challenge in the field lies in the historical dichotomy between morphological and molecular detection approaches, often pursued in isolation. This comparative analysis argues that integrating morphological with molecular methodologies provides a more comprehensive and accurate assessment of apoptotic processes, enabling researchers to overcome the inherent limitations of either approach when used independently. Such integration is becoming increasingly feasible with technological advancements in label-free imaging, high-content screening, and computational analysis, offering new pathways for a synergistic evaluation of cell death that aligns with both the structural and biochemical reality of the process.
Comparative Analysis of Major Detection Methodologies
Apoptosis detection techniques can be broadly categorized into morphological, biochemical, and molecular methods, each with distinct strengths, limitations, and optimal application contexts. The following analysis provides a detailed comparison of these major methodologies.
Table 1: Comparison of Morphological Detection Techniques
| Method | Key Features Detected | Advantages | Limitations | Stage Detected |
|---|---|---|---|---|
| Light Microscopy (HE, Giemsa stains) [17] | Cell shrinkage, nuclear shedding, apoptotic bodies | Simple, convenient, intuitive, storable specimens | Apoptosis in small areas not easily recognized | Late (Phase IIb) |
| Electron Microscopy [17] [93] | Chromatin condensation, vacuole formation, organelle changes, apoptotic bodies | Reveals typical ultra-morphological structure and architecture | Time-consuming, requires high skill, endpoint detection only, potential false positives | Early (I), Middle (IIa), Late (IIb) |
| Fluorescence/Confocal Microscopy (Hoechst, DAPI, AO) [17] [94] | Nuclear condensation, chromatin fragmentation, pyknosis | Directly reveals nuclear and chromatin conditions, 3D imaging | Small area apoptosis not easily identified, may require cell permeabilization | Primarily Late (IIb) |
| Full-Field OCT (FF-OCT) [8] | Echinoid spine formation, membrane blebbing, cell contraction, filopodia reorganization | Label-free, non-invasive, high-resolution 3D surface topography, real-time live cell monitoring | Relatively new technology, may require specialized equipment | Early, Middle, Late |
| High-Content Screening (HCS) [95] | Cell shrinkage, nuclear condensation, changes in cell roundness and cytoplasm area | High-throughput, quantitative, automated, multiplexing capability | Requires fluorescent probes and sophisticated image analysis software | Early, Middle, Late |
Table 2: Comparison of Biochemical and Molecular Detection Techniques
| Method | Key Biomarkers/Events Detected | Advantages | Limitations | Stage Detected |
|---|---|---|---|---|
| DNA Gel Electrophoresis [17] | DNA fragmentation (180-200 bp ladder) | Simple, qualitatively accurate for large-scale apoptosis | Poor specificity/sensitivity, cannot localize cells, semi-quantitative | Middle, Late |
| TUNEL Assay [17] [94] | 3'-OH ends of DNA fragments | Relatively sensitive and specific, can count and quantify apoptotic cells | Can yield false-positive/negative results, requires controls | Late |
| Flow Cytometry (Annexin V/PI) [55] [95] | Phosphatidylserine externalization, membrane integrity | Quantitative, can differentiate apoptotic from necrotic cells, high-throughput | Requires cell dissociation, cannot assess spatial information, fluorescent labels needed | Early, Middle |
| Caspase Activity Assays [21] | Caspase activation (Caspase-3, -8, -9) | High specificity, reveals apoptotic pathway activation, various formats available | Does not confirm completion of apoptosis, activity may be transient | Early |
| Mitochondrial Potential Assays (JC-1, TMRM) [17] | Loss of mitochondrial membrane potential (ΔΨm) | Early marker for intrinsic pathway, can be used with flow cytometry | Affected by changes in pH, requires careful calibration | Early |
| Western Blot/RT-qPCR [17] [21] | Protein cleavage (PARP), Bcl-2 family ratios, mRNA expression | Provides mechanistic insights, well-established protocols | Endpoint analysis, does not quantify cell death in heterogeneous populations | Varies by target |
Integrated Workflow for Apoptosis Detection
The following diagram illustrates a strategic workflow for integrating complementary morphological and molecular methods to validate apoptosis across its different stages.
Apoptosis Signaling Pathways and Methodological Alignment
Understanding the core biochemical pathways of apoptosis is essential for selecting appropriate detection methods. The following diagram maps the key apoptotic pathways to the specific biomarkers and methodologies used to detect their activation.
Experimental Protocols for Key Apoptosis Detection Assays
Integrated High-Content Screening (HCS) Morphological Analysis
This protocol enables quantitative assessment of apoptosis-specific morphological changes in a high-throughput format [95].
Procedure:
- Cell Preparation: Plate cells (e.g., Chang liver cells or relevant cell line) in 96-well or 384-well imaging plates and allow to adhere overnight.
- Treatment: Apply apoptosis inducers (e.g., staurosporine, doxorubicin, or plant alkaloids) at varying concentrations for defined time periods.
- Staining: Incubate cells with organelle-specific fluorescent probes:
- Nuclear Stain: Hoechst 33342 (1-5 µg/mL) or DAPI (1 µg/mL) to visualize nuclear morphology [94] [95].
- Mitochondrial Stain: MitoTracker Deep Red (50-200 nM) to assess mitochondrial network integrity.
- Membrane Integrity Stain: Propidium iodide (1 µg/mL) if needed to distinguish late apoptosis/necrosis.
- Image Acquisition: Acquire images using a high-content imaging system with appropriate objectives (20× or 40×) across all fluorescent channels.
- Image Analysis: Use HCS software to quantify morphological descriptors:
- Nuclear Parameters: Area, perimeter, intensity, and roundness.
- Cellular Parameters: Cell area, cytoplasm area, cell roundness.
- Advanced Parameters: Texture analysis, spot counting for apoptotic bodies.
- Validation: Correlate HCS morphological descriptors with established apoptosis markers (e.g., Annexin V flow cytometry, caspase activity) to confirm apoptosis-specific changes [95].
FF-OCT for Label-Free Apoptosis Monitoring
This protocol uses Full-Field Optical Coherence Tomography for non-invasive, label-free monitoring of apoptotic morphological dynamics [8].
Procedure:
- Cell Culture: Seed cells (e.g., HeLa cells) on appropriate imaging dishes and culture until desired confluence is reached.
- Apoptosis Induction: Apply apoptosis inducer (e.g., doxorubicin at 5 μmol/L) directly in culture medium. For necrosis control, treat separate samples with high-concentration ethanol (e.g., 99%).
- FF-OCT Imaging: Place sample on custom-built time-domain FF-OCT system with Linnik-configured Michelson interferometer and broadband halogen light source.
- Time-Lapse Acquisition: Initiate continuous imaging immediately after drug administration at 20-minute intervals for up to 180 minutes.
- Image Processing:
- Acquire 2D interference images using CCD camera.
- Generate en face (x-y) cross-sectional images through phase-shifting algorithms.
- Stack sequential images to reconstruct 3D cellular topography.
- Morphological Analysis: Identify and quantify apoptosis-specific features:
- Cell contraction and echinoid spine formation.
- Membrane blebbing dynamics.
- Filopodia reorganization.
- Loss of cell-substrate adhesion (using IRM-like imaging).
- Data Comparison: Contrast apoptotic morphology with necrotic features (rapid membrane rupture, intracellular content leakage).
Fluorescence Microscopy-Based Nuclear Morphology Assay
This protocol details a computerized method for apoptosis detection and quantification through analysis of fluorescent dye-stained cell nuclei [94].
Procedure:
- Cell Culture and Treatment: Plate cells (e.g., LNCaP prostate cancer or MDA-MB-231 breast cancer cells) and treat with apoptosis inducer (e.g., 3.0 μM cycloheximide) for 24 hours.
- Fixation and Permeabilization: Wash cells twice with PBS and permeabilize with 0.2% Triton X-100 for 10 minutes.
- Nuclear Staining: Incubate cells with DAPI (1.0 μg/mL) for 15 minutes in the dark, then wash with PBS.
- Image Acquisition: Capture fluorescent images using a fluorescence microscope system (e.g., BZ-9000) with 20× objective, acquiring 10 images from different sites per sample.
- Automated Nuclear Analysis: Use image analysis software (e.g., BZ II Analyzer) to:
- Define single nuclei as DAPI-positive areas ranging from 1.0 to 200 μm².
- Exclude small nuclear fragments and nuclei clusters using size criteria.
- Quantify morphological parameters for each nucleus: area, perimeter, major axis, minor axis, and brightness.
- Statistical Analysis: Compare parameters between treated and control groups using Student's t-test, with significance set at p≤0.05.
Research Reagent Solutions
Table 3: Essential Reagents and Kits for Apoptosis Detection
| Reagent/Kits | Primary Function | Detection Method | Key Applications |
|---|---|---|---|
| Annexin V-FITC/PI Kit [55] | Detects PS externalization & membrane integrity | Flow Cytometry, Fluorescence Microscopy | Early/Late Apoptosis vs. Necrosis distinction |
| TUNEL Assay Kit [17] [94] | Labels 3'-OH ends of fragmented DNA | Fluorescence Microscopy, Flow Cytometry | Late-stage apoptosis detection |
| Caspase Activity Assay Kits [21] | Measures caspase-3/8/9 activity | Fluorometry, Luminescence | Early apoptosis, pathway identification |
| Hoechst 33342 & DAPI [17] [95] | Nuclear counterstain, chromatin visualization | Fluorescence Microscopy, HCS | Nuclear morphology changes |
| JC-1 Dye [17] | Mitochondrial membrane potential sensor | Flow Cytometry, Fluorescence Microscopy | Early apoptosis (intrinsic pathway) |
| MitoTracker Probes [95] | Mitochondrial mass and membrane potential | Fluorescence Microscopy, HCS | Mitochondrial health during apoptosis |
| Cell Viability Kits (MTT/XTT) [27] | Measures metabolic activity | Spectrophotometry | Indirect apoptosis assessment via viability |
| Antibodies (Cleaved Caspase-3, PARP) [21] | Detects specific protein cleavage | Western Blot, Immunofluorescence | Apoptosis confirmation & mechanism |
This comparative analysis demonstrates that no single methodology can fully capture the complexity of the apoptotic process. Morphological techniques provide visual confirmation of characteristic structural changes but may lack the molecular specificity of biochemical assays. Conversely, molecular methods offer high specificity for specific biomarkers but can miss the broader cellular context. The integration of complementary approaches—such as combining high-content imaging of nuclear morphology with flow cytometric analysis of phosphatidylserine exposure, or correlating label-free FF-OCT with caspase activity assays—creates a synergistic framework that overcomes the limitations of individual techniques. This multidimensional assessment strategy is particularly crucial in drug discovery and toxicology screening, where accurate classification of cell death mechanisms directly impacts therapeutic development. As detection technologies continue to evolve, particularly in label-free imaging, artificial intelligence-based analysis, and multiplexed assay platforms, the integration of morphological and molecular approaches will become increasingly seamless, providing researchers with more comprehensive tools to decipher apoptotic signaling in both physiological and pathological contexts.
In the field of cell biology and pre-clinical drug discovery, accurately identifying programmed cell death (PCD) is fundamental for evaluating therapeutic efficacy and safety. Apoptosis, a key form of PCD, involves a complex sequence of biochemical and morphological events that unfold over time. Relying on a single detection method risks misinterpreting cellular states due to technique-specific limitations, including temporal sensitivity, biochemical perturbation, and contextual blind spots. This guide examines the growing consensus that robust apoptosis assessment requires cross-validation through multiple, orthogonal techniques. By integrating morphological, molecular, and biophysical methods, researchers can generate a comprehensive death confirmation, thereby enhancing the reliability of data supporting drug development decisions.
The following sections provide a detailed comparison of current apoptosis detection technologies, their experimental protocols, and how they can be strategically combined to validate apoptotic events across different temporal and mechanistic stages.
Comparative Analysis of Apoptosis Detection Techniques
The table below summarizes the core performance characteristics, advantages, and limitations of key apoptosis detection methods.
Table 1: Comparative Analysis of Apoptosis Detection Techniques
| Technique | Detection Principle | Key Readout / Biomarker | Temporal Detection Window | Throughput | Key Advantage | Primary Limitation |
|---|---|---|---|---|---|---|
| Annexin-V Staining [85] [96] | Molecular: Binds externalized PS | Fluorescence signal from PS-AnnV binding | Mid-stage (post-membrane flipping) | Medium | Well-established, quantifiable by flow cytometry | Cannot detect early apoptosis; potential for false positives from necrosis [96] |
| Deep Learning on Phase-Contrast Images [85] | Morphological: Detects structural changes | Apoptotic body count & cell morphology | Early-stage (from body formation) | High | Label-free, non-invasive, allows continuous monitoring | Requires extensive training data; "black box" interpretations [85] |
| Dielectrophoresis (DEP) [96] | Biophysical: Measures dielectric properties | Changes in membrane capacitance & cytoplasmic conductivity | Very Early-stage (within 2 hours post-treatment) | Medium | Extremely early detection; label-free; kinetic data | Requires specialized microfluidic equipment; indirect biomarker [96] |
| Full-Field Optical Coherence Tomography (FF-OCT) [8] | Morphological: High-resolution interferometric imaging | Membrane blebbing, cell shrinkage, spine formation | Early to Mid-stage | Low | Label-free, high-resolution 3D structural data | Lower throughput; more complex image analysis [8] |
| Caspase Cleavage Assays | Molecular: Detects caspase activation | Cleaved caspases (e.g., Casp-3, Casp-8) | Early-stage (initiation/execution phase) | Medium-High | Direct measure of core apoptotic machinery activity | Biochemical disruption from cell lysis; does not confirm completion of death [6] |
Diagram 1: Simplified Apoptosis Signaling Pathway and Detection Windows. Key stages where different detection techniques are applicable are indicated.
Experimental Protocols for Key Techniques
Label-Free Apoptotic Body Detection with Deep Learning
This protocol leverages phase-contrast time-lapse imaging and a ResNet50 deep learning model to detect apoptosis through the direct visualization of apoptotic bodies (ApoBDs), offering a non-invasive alternative to fluorescent markers [85].
- Cell Culture & Assay Setup: Co-culture effector (e.g., tumor-infiltrating lymphocytes) and target (e.g., Mel526 melanoma) cells within polydimethylsiloxane (PDMS) nanowell arrays. Use an appropriate apoptosis inducer based on the experimental context [85].
- Image Acquisition: Acquire time-lapse images using a phase-contrast microscope (e.g., Axio microscope with 20× 0.8 NA objective) every 5 minutes in a controlled environment (humidity/CO₂). Maintain a consistent field of view across time points [85].
- Image Processing & Model Application: Process raw images to extract individual nanowell images. Input the phase-contrast image sequences into the pre-trained ResNet50 network. The network identifies frames containing ApoBDs with high accuracy [85].
- Temporal Validation & Onset Prediction: Apply a three-frame temporal constraint (detection across three consecutive frames) to distinguish true apoptotic events from sporadic noise. The frame where ApoBDs are first consistently detected is assigned as the onset of apoptosis, with an error of approximately one frame (±5 minutes) [85].
- Cross-Validation: Compare the deep learning-derived apoptosis events with results from a parallel Annexin-V staining channel to quantify the percentage of events missed by the conventional molecular method [85].
Early-Stage Apoptosis Detection via Dielectrophoresis (DEP)
This protocol uses DEP to detect the earliest biophysical changes in cells undergoing apoptosis, far earlier than most biochemical markers become apparent [96].
- Cell Culture & Apoptosis Induction: Culture target cells (e.g., HCC1833 NSCLC line) to 70% confluence. Induce apoptosis using a potent Bcl-2 family inhibitor (e.g., ABT-263/Navitoclax) at a clinically relevant concentration (e.g., 1 µM) [96].
- Sample Preparation at Time Points: At designated time points post-treatment (e.g., 2, 6, 10, 24 hours), trypsinize, centrifuge, and wash the cells. Resuspend the pellet (2–2.5 × 10⁶ cells/mL) in a formulated isotonic sucrose-dextrose medium with conductivity adjusted to 50 mS/m [96].
- DEP Chip Setup & Measurement: Use a microfluidic DEP chip with gold interdigitated electrodes. Apply a non-uniform electric field via a function generator across a frequency range. Monitor the movement (attraction/repulsion) of cells in response to the field [96].
- Data Analysis: Calculate the Clausius-Mossotti factor to determine the crossover frequency. Derive dielectric properties, specifically the specific membrane capacitance (Cmem), which shows significant changes during early apoptosis due to alterations in membrane architecture and ion balance [96].
- Cross-Validation: Compare DEP results with standard Annexin-V-FITC/PI flow cytometry assays performed on parallel samples. DEP typically reveals significant dielectric property changes hours before these fluorescent assays can reliably detect apoptosis [96].
High-Resolution Morphological Imaging with FF-OCT
This protocol utilizes FF-OCT for label-free, high-resolution 3D visualization of the characteristic morphological changes in apoptosis and necrosis [8].
- Cell Preparation & Death Induction: Culture adherent cells (e.g., HeLa cells) on imaging-compatible dishes. To induce apoptosis, treat with 5 µM doxorubicin. To induce necrosis for comparative purposes, treat with a high concentration (e.g., 99%) of ethanol [8].
- FF-OCT System Imaging: Use a custom-built time-domain FF-OCT system with a broadband halogen light source (e.g., center wavelength 650 nm) and a Linnik-configured interferometer with high-NA water immersion objectives (e.g., 40×, NA 0.8). Initiate imaging immediately after drug administration [8].
- Time-Lapse Data Acquisition: Acquire en face (x-y) cross-sectional images continuously at set intervals (e.g., every 20 minutes) for up to 3 hours. Use a precision linear stage to control the depth (z-axis) and stack images to reconstruct 3D cellular topography [8].
- Morphological Analysis: Analyze the 3D reconstructions and tomographic slices for key apoptotic features: cell contraction, echinoid spine formation, membrane blebbing, filopodia reorganization, and ultimately, apoptotic body formation. In contrast, necrotic cells will show rapid membrane rupture and content leakage without these structured stages [8].
Diagram 2: Multi-Technique Cross-Validation Workflow. Integrating data from orthogonal methods provides a definitive, time-resolved confirmation of apoptosis.
The Scientist's Toolkit: Essential Reagents & Materials
Table 2: Key Research Reagents and Solutions for Apoptosis Detection
| Reagent / Material | Function / Application | Key Characteristics |
|---|---|---|
| Annexin-V (e.g., conjugated to Alexa Fluor 647) | Fluorescent probe for detecting phosphatidylserine (PS) externalization on the outer leaflet of the cell membrane during mid-stage apoptosis [85] [96]. | High affinity for PS; requires calcium-containing buffer; often used in conjunction with viability dyes (e.g., PI) to exclude late apoptotic/necrotic cells. |
| Bcl-2 Family Inhibitors (e.g., ABT-263/Navitoclax) | Small molecule used to induce intrinsic apoptosis by inhibiting anti-apoptotic proteins Bcl-2, Bcl-xL, and Bcl-w [96]. | Potent and specific; dissolved in DMSO; used at clinically relevant concentrations (e.g., 1 µM). |
| Microfluidic DEP Chips | Platform for characterizing dielectric properties of cells. Typically features interdigitated gold electrodes to generate non-uniform electric fields [96]. | Enables label-free, early detection of apoptosis; requires controlled conductivity buffers (e.g., ~50 mS/m). |
| Polydimethylsiloxane (PDMS) Nanowell Arrays | Microwell structures for confining single cells or small cell populations for high-throughput, time-lapse imaging [85]. | Allows tracking of individual cell fates and cell-cell interactions; compatible with microscopy. |
| Doxorubicin | Anthracycline chemotherapeutic agent used to induce apoptosis in cancer cells, typically by intercalating into DNA and inhibiting topoisomerase II [8]. | Well-characterized apoptosis inducer; used at specific concentrations (e.g., 5 µM) for experimental treatment. |
| Formulated Isotonic Buffer (Sucrose-Dextrose) | Low-conductivity suspension medium for DEP experiments to maximize the field gradient across the cell membrane [96]. | Maintains cell isotonicity while allowing precise control of electrical conductivity for DEP measurements. |
No single apoptosis detection method provides a complete picture from initial trigger to final clearance. The future of accurate cell death assessment lies in the strategic, cross-validated use of orthogonal techniques. As demonstrated, label-free imaging (deep learning, FF-OCT) can continuously monitor for morphological hallmarks, biophysical profiling (DEP) can capture the earliest changes in cellular integrity, and molecular staining (Annexin-V, caspase assays) provides specific biochemical confirmation. By integrating these methods, researchers can construct a precise temporal map of apoptotic events, significantly increasing confidence in experimental results, especially in critical applications like drug discovery and therapeutic efficacy testing. This multi-faceted approach effectively mitigates the limitations inherent in any single methodology, ensuring that apoptotic events are not just detected, but conclusively confirmed.
The accurate assessment of cell death mechanisms, particularly apoptosis, represents a fundamental aspect of cancer research and therapeutic development. Traditional two-dimensional (2D) monolayer cultures have served as the cornerstone of in vitro research for decades, offering simplicity, low cost, and ease of use [97]. However, these models suffer from a critical limitation: their inability to replicate the complex three-dimensional (3D) architecture and microenvironment of solid tumors [97] [98]. This discrepancy significantly impacts cellular behavior, drug penetration, and therapeutic response, ultimately contributing to the high failure rate of anticancer compounds when transitioning from preclinical studies to clinical trials [98].
The transition to three-dimensional (3D) spheroid models addresses these limitations by more faithfully recapitulating the dynamic cell-cell and cell-matrix interactions present within the tumor microenvironment (TME) [97] [99]. These models preserve critical aspects of in vivo tumor biology, including nutrient and oxygen gradients, the development of heterogeneous cell populations, and appropriate extracellular matrix (ECM) signaling [98]. For apoptosis research specifically, the choice of culture model significantly influences experimental outcomes, affecting everything from basal proliferation rates to the activation of cell death pathways in response to therapeutic agents [98]. This guide provides a comprehensive comparison of 2D versus 3D culture systems, offering experimental data and methodologies to inform model selection for apoptosis detection in cancer research.
Fundamental Differences Between 2D and 3D Culture Systems
Architectural and Microenvironmental Characteristics
The architectural divergence between 2D and 3D cultures creates fundamentally different microenvironments that critically influence cellular behavior and response. In 2D monolayers, cells adhere to a rigid, flat plastic surface and experience uniform access to nutrients, oxygen, and therapeutic agents [97]. This artificial setup fails to mirror the spatial constraints and biochemical gradients characteristic of in vivo tumors. Consequently, cells in 2D typically exhibit exaggerated proliferation rates and altered differentiation states that do not accurately reflect their native physiology [98].
In contrast, 3D spheroids develop complex, multi-cellular structures that mimic key aspects of solid tumors. The ERα-positive MCF-7 breast cancer cell line forms compact, spherical aggregates, while the triple-negative MDA-MB-231 line creates more loosely organized structures, reflecting their distinct metastatic potentials [97]. Within these spheroids, concentric zones emerge: an outer layer of proliferating cells, an intermediate region of quiescent cells, and a central core that may become necrotic under nutrient or oxygen deprivation [98]. This organizational complexity leads to the establishment of diffusion gradients for critical molecules like glucose, oxygen, and metabolic waste products, creating microenvironments that profoundly influence cellular function, survival, and death pathways [98].
Table 1: Fundamental Characteristics of 2D vs. 3D Culture Models
| Feature | 2D Monolayer Cultures | 3D Spheroid Cultures |
|---|---|---|
| Spatial Architecture | Flat, monolayer | Three-dimensional, multi-layered structure |
| Cell-Cell Interactions | Limited to peripheral contact | Extensive, multi-directional contacts as in tissues |
| Cell-ECM Interactions | Artificial, single-plane adhesion | Natural, volumetric integration with ECM components |
| Nutrient & Oxygen Access | Uniform | Gradient-dependent, creating heterogeneous microenvironments |
| Proliferation | High, uniform rate | Heterogeneous: proliferating outer layer, quiescent inner region |
| Gene Expression Profile | Does not fully mimic in vivo signatures | Closer resemblance to in vivo tumor gene expression [98] |
| Drug Penetration | Direct, unobstructed access | Limited by diffusion barriers, mimicking in vivo solid tumors |
Impact on Metabolic and Molecular Profiles
The architectural differences between culture models translate into significant metabolic and molecular distinctions that directly impact apoptosis research. Quantitative comparisons using microfluidic-based chips have revealed that 3D cultures exhibit distinct metabolic profiles, including elevated glutamine consumption under glucose restriction and higher lactate production, indicating an enhanced Warburg effect compared to 2D cultures [98]. Notably, 3D models demonstrate increased per-cell glucose consumption, highlighting the presence of fewer but more metabolically active cells than in 2D cultures [98].
At the molecular level, gene expression profiling reveals substantial differences between 2D and 3D systems. Studies using prostate cancer cell lines show significant alterations in genes related to tumor suppression (ANXA1), cell-cell interactions (CD44), and self-renewal (OCT4, SOX2) in 3D cultures [98]. Furthermore, breast cancer spheroids established from MCF-7 and MDA-MB-231 cell lines exhibit distinct expression profiles of key receptors (ERs, EGFR, IGF1R) and matrix molecules (syndecans, matrix metalloproteinases) compared to their 2D counterparts [97]. These molecular differences extend to epithelial-to-mesenchymal transition (EMT) markers, with 3D cultures demonstrating differential expression patterns that better reflect the metastatic potential of cancer cells [97].
Methodological Framework: Establishing 3D Spheroid Models for Apoptosis Research
Spheroid Formation Protocols
The development of robust, reproducible 3D spheroid models requires specialized methodologies that promote cell self-aggregation. Two primary approaches dominate the field: scaffold-based and scaffold-free techniques.
Scaffold-Free Spheroid Formation (Liquid-Overlay Technique): This popular method utilizes U-shape, round-bottom 96-well plates with ultra-low adhesive properties to encourage spontaneous cell aggregation [97]. The standard protocol involves:
- Seeding cells at optimized densities (e.g., 5,000-15,000 cells/well for breast cancer lines) in complete growth medium [97].
- Centrifuging plates at low speed (300-500 × g for 5-10 minutes) to promote initial cell contact.
- Incubating cultures for 72 hours at 37°C in a humidified 5% CO₂ atmosphere to allow spheroid self-assembly [97].
- Monitoring spheroid formation and growth using phase-contrast microscopy until reaching the desired size and compactness. This approach is particularly valuable for studying apoptosis as it generates spheroids with controlled size and minimal external matrix interference.
Scaffold-Based Methods: Alternative approaches utilize natural or synthetic hydrogels to provide an ECM-like 3D scaffold that supports spheroid formation and growth. The collagen-based hydrogel method involves:
- Embedding individual cells within a collagen hydrogel matrix inside microfluidic chips [98].
- Allowing cells to proliferate and self-organize within the hydrogel microarchitecture, mimicking physiological tumorigenesis [98].
- Maintaining cultures for extended periods (up to 10 days) to study long-term apoptosis dynamics and treatment responses [98]. While scaffold-based methods offer enhanced physiological relevance, the natural scaffolds may exhibit batch-to-batch variability that can affect experimental reproducibility [99].
Apoptosis Detection Methodologies in 3D Models
Accurately detecting and quantifying apoptosis in 3D spheroids requires specialized approaches that account for structural complexity. The following methodologies represent state-of-the-art techniques for apoptosis analysis in 3D systems:
Label-Free High-Resolution Imaging: Full-field optical coherence tomography (FF-OCT) enables label-free, non-invasive visualization of apoptotic morphological changes at the single-cell level within 3D structures [8]. This technique employs a custom-built time-domain FF-OCT system with a broadband halogen light source to achieve sub-micrometer resolution, allowing identification of characteristic apoptotic features including cell contraction, membrane blebbing, and filopodia reorganization without chemical staining or fixation [8].
FRET-Based Live Cell Apoptosis/Necrosis Discrimination: This sophisticated approach utilizes cancer cells stably expressing genetically encoded FRET-based caspase sensors combined with organelle-targeted fluorescent proteins (e.g., Mito-DsRed) for real-time discrimination of apoptosis and necrosis [100]. The methodology includes:
- Establishing stable cell lines expressing a FRET probe (ECFP-DEVD-EYFP) that cleaves upon caspase activation, and Mito-DsRed for mitochondrial labeling [100].
- Treating spheroids with apoptosis-inducing agents (e.g., doxorubicin) or necrotic triggers (e.g., H₂O₂).
- Performing time-lapse imaging to monitor FRET ratio changes (indicating caspase activation) and mitochondrial fluorescence retention.
- Identifying three distinct populations: apoptotic cells (FRET ratio change + mitochondrial fluorescence), necrotic cells (loss of FRET probe + retained mitochondrial fluorescence), and live cells (intact probes without ratio change) [100]. This method provides unprecedented sensitivity for distinguishing cell death pathways in real-time at single-cell resolution within complex 3D structures.
Table 2: Key Reagent Solutions for 3D Apoptosis Research
| Research Reagent | Function/Application | Experimental Notes |
|---|---|---|
| Ultra-Low Attachment Plates (U-shape, round-bottom) | Facilitate scaffold-free spheroid formation by minimizing cell-surface adhesion | Enable high-throughput spheroid production; optimal for apoptosis studies requiring minimal external matrix interference [97] |
| FRET-Based Caspase Sensor (e.g., ECFP-DEVD-EYFP) | Genetically encoded probe for real-time detection of caspase activation in live cells | Enables discrimination between apoptosis and necrosis when combined with organelle markers; adaptable to high-throughput screening [100] |
| Mito-DsRed Fluorescent Protein | Mitochondrial-targeted fluorescent marker for tracking organelle integrity during cell death | Retains fluorescence in both apoptotic and necrotic cells until late stages; provides reference signal for FRET probe localization [100] |
| Collagen-Based Hydrogels | Natural ECM-mimetic scaffolds for 3D cell culture | Provides physiological microenvironment for spheroid formation; may introduce batch-to-batch variability [98] [99] |
| Full-Field Optical Coherence Tomography (FF-OCT) | Label-free, high-resolution imaging technique for morphological analysis | Enables non-invasive visualization of apoptotic hallmarks (membrane blebbing, cell shrinkage) without chemical staining or fixation [8] |
Comparative Experimental Data: 2D vs. 3D Models in Apoptosis Research
Proliferation and Viability Assessment
Quantitative comparisons between 2D and 3D cultures reveal profound differences in proliferation dynamics and treatment responses. In 2D cultures, both A549 (lung adenocarcinoma) and U251-MG (glioblastoma) cell lines exhibit exponential growth when glucose is available, reaching confluence within 5 days [98]. However, under glucose deprivation, 2D cultures show rapid viability loss, with U251-MG cells displaying no viable cells by day 3 [98].
In striking contrast, 3D spheroid models demonstrate remarkable resilience under nutrient stress. During the spheroid formation phase (first 5 days), glucose deprivation causes only slight differences in metabolically active cell numbers [98]. Even in the subsequent spheroid growth phase (days 6-10), 3D cultures maintain viability under glucose deprivation, indicating activation of alternative metabolic pathways that enable survival—a response not observed in 2D systems [98]. This differential survival capability has direct implications for apoptosis induction, as 3D models more accurately replicate the adaptive resistance mechanisms operating in solid tumors.
Table 3: Quantitative Comparison of Cellular Responses in 2D vs. 3D Cultures
| Parameter | 2D Monolayer Response | 3D Spheroid Response | Experimental Context |
|---|---|---|---|
| Proliferation Rate | High, uniform exponential growth | Reduced, heterogeneous growth | Measured over 5-10 days in A549 and U251-MG cell lines [98] |
| Glucose Dependence | Absolute requirement for proliferation | Survival maintained under deprivation | Response to glucose-free medium [98] |
| Metabolic Activity | Lower per-cell consumption | Higher per-cell glucose consumption | Microfluidic chip monitoring of metabolites [98] |
| Lactate Production | Lower relative production | Enhanced Warburg effect, higher production | Indicator of glycolytic flux [98] |
| Cell Death Timeline | Rapid onset under stress | Delayed apoptosis/necrosis | Response to nutrient deprivation or chemotherapeutic agents [98] |
| Drug Sensitivity | Typically higher sensitivity | Reduced sensitivity, mimicking in vivo resistance | Response to chemotherapeutic agents [99] |
Apoptosis Pathway Activation and Molecular Regulation
The molecular regulation of apoptosis differs significantly between culture models, with 3D spheroids demonstrating enhanced expression of key extracellular matrix components and receptors that influence cell survival and death decisions. Breast cancer spheroids show distinct expression profiles of critical apoptosis-regulating receptors including ERs, EGFR, and IGF1R compared to 2D cultures [97]. Furthermore, 3D models exhibit altered expression of matrix molecules such as syndecans and matrix metalloproteinases (MMPs), which participate in ECM remodeling and modulate survival signaling within the tumor microenvironment [97].
Bioinformatic analyses confirm the clinical relevance of these matrix regulators, with their expression patterns showing significant correlation with breast cancer prognosis [97]. These molecular differences translate to functional variations in apoptosis activation, with 3D models frequently demonstrating delayed caspase activation and altered kinetics of cell death execution compared to 2D systems. The development of advanced detection methods, including FRET-based caspase sensors and label-free OCT imaging, has been essential for elucidating these fundamental differences in apoptosis regulation between culture models [8] [100].
Visualizing Apoptosis Signaling and Detection Methodologies
Apoptosis Signaling Pathways in 2D vs. 3D Environments
Diagram 1: Apoptosis signaling differences between 2D and 3D culture environments. The diagram illustrates how microenvironmental factors influence cell death pathways across culture models.
Integrated Workflow for Apoptosis Detection in 3D Spheroids
Diagram 2: Integrated workflow for comprehensive apoptosis assessment in 3D spheroid models, combining multiple detection modalities.
The comprehensive comparison between 2D and 3D culture models reveals significant advantages of spheroid systems for apoptosis research in cancer biology and drug discovery. Three-dimensional models more accurately replicate the architectural complexity, metabolic heterogeneity, and molecular signaling networks of in vivo tumors, providing physiologically relevant platforms for investigating cell death mechanisms [97] [98]. The development of advanced detection methodologies, including label-free imaging and FRET-based caspase sensors, has enabled precise discrimination of apoptosis and necrosis within these complex 3D structures [8] [100].
For researchers investigating apoptosis mechanisms or screening therapeutic compounds, the integration of 3D spheroid models with sophisticated detection technologies represents a critical advancement toward more predictive in vitro systems. These approaches better capture the therapeutic resistance mechanisms operating in solid tumors, potentially bridging the gap between conventional cell culture and clinical response [99]. As the field continues to evolve, the standardization of 3D culture protocols and apoptosis detection methodologies will further enhance the reliability and translational value of these physiologically relevant models for cancer research and drug development.
Apoptosis, or programmed cell death, is a fundamental process in maintaining tissue homeostasis, and its dysregulation is a hallmark of cancer [101]. Accurately detecting and quantifying apoptosis is therefore crucial for understanding cancer biology, evaluating treatment efficacy, and advancing drug discovery [36]. Historically, research has relied on single-method approaches, focusing on isolated morphological or molecular markers. However, a paradigm shift is underway toward integrated workflows that combine these data types to gain a more comprehensive and reliable understanding of cell death events. This guide explores this evolution, comparing traditional and emerging methodologies through the lens of integrated analysis, which is central to modern thesis research in the field.
The limitations of single-method approaches are becoming increasingly apparent. For instance, morphological analysis of phytoplankton cysts has shown that integrated molecular methods can uncover a higher number of taxa, demonstrating that a combined approach yields a more complete picture of diversity [102]. In cancer research, this principle translates to using multi-omic models that integrate various data types—from protein expression to mRNA and methylation—to build robust signatures of cell death across cancer types [103]. This guide will objectively compare the performance of key apoptosis detection techniques and provide the experimental protocols and data to support these comparisons.
Comparative Analysis of Apoptosis Detection Methodologies
The following section provides a structured, data-driven comparison of established and emerging apoptosis detection methods, highlighting their performance metrics, advantages, and limitations.
Quantitative Performance Comparison
Table 1: Comparative analysis of apoptosis detection methods and their performance.
| Methodology | Detection Principle | Key Readout | Throughput | Sensitivity (vs. Flow Cytometry) | Key Advantages | Primary Limitations |
|---|---|---|---|---|---|---|
| Real-time Live-Cell Imaging with Annexin V [104] | PS exposure on outer membrane | Kinetic Annexin V fluorescence | High | ~10x more sensitive | Non-toxic, kinetic data at single-cell resolution, minimal handling | Requires specialized live-cell imaging equipment |
| Caspase-3/7 Luminescent Assay [36] | Executioner caspase activity | Luminescence (RLU) | Ultra-High (U/HTS) | ~20-50x more sensitive than fluorescent versions [36] | Highly sensitive, amenable to 1536-well formats, homogeneous "add-and-read" | Measures activity in lysed cells, endpoint measurement |
| Multiparametric Live-Cell Microscopy (FLIM) [105] | Caspase-3 activity + autofluorescence of redox cofactors (NAD(P)H, FAD) | Fluorescence lifetime & intensity | Low | N/A (provides unique multiparametric data) | Reveals correlations between redox status & apoptosis; live-cell | Technically complex, low throughput, specialized equipment |
| Traditional Annexin V Flow Cytometry [104] | PS exposure on outer membrane | Fluorescence at endpoint | Medium | Baseline | Considered a gold standard; widely accessible | Endpoint only, extensive handling induces stress, less sensitive |
Integrated Workflow Reagent Solutions
A successful integrated workflow relies on a toolkit of specialized reagents. The table below details essential solutions for the experiments discussed in this guide.
Table 2: Key research reagent solutions for integrated apoptosis detection workflows.
| Reagent / Assay | Function / Target | Key Features & Considerations |
|---|---|---|
| Recombinant Annexin V (e.g., Annexin V-488, -594) [104] | Binds phosphatidylserine (PS) on the outer leaflet of the apoptotic cell membrane. | Detects early apoptosis. Can be used in live-cell imaging with minimal toxicity. Low concentrations (0.25 µg/mL) are effective in standard cell culture media [104]. |
| Caspase-Glo 3/7 Assay [36] | Measures activity of executioner caspases-3 and -7 via a luminogenic DEVD substrate. | Highly sensitive, lytic assay. Generates a luminescent signal proportional to caspase activity. Ideal for HTS in 96- to 1536-well plates [36]. |
| Viability Dyes (e.g., YOYO-3, DRAQ7) [104] | Labels cells with compromised membrane integrity (late apoptosis/necrosis). | Distinguishes late-stage cell death. YOYO-3 labels cells faster and at lower concentrations than DRAQ7, making it suitable for kinetic imaging [104]. |
| Caspase-3/7 Fluorogenic Substrates (e.g., DEVD-AMC, DEVD-R110) [36] | Measures caspase-3/7 activity via a fluorescent reporter. | Provides a fluorescent readout. More sensitive than colorimetric versions but less sensitive than luminogenic substrates. Potential for fluorescent compound interference [36]. |
| mKate2-DEVD-iRFP Caspase Sensor [105] | Genetically encoded FRET-based sensor for caspase-3 activation. | Used in live-cell microscopy (e.g., FLIM). Allows multiplexing with autofluorescence of metabolic cofactors without spectral overlap [105]. |
Experimental Protocols for Key Integrated Methodologies
Protocol: Real-Time Kinetic Analysis of Apoptosis with High-Content Live-Cell Imaging
This protocol, adapted from a 2016 study, details a highly sensitive method for kinetic analysis of apoptosis using Annexin V in a live-cell imaging system [104].
- Step 1: Cell Seeding and Preparation. Seed cells (e.g., SV40-transformed MEFs or other validated lines) in opaque-walled, clear-bottomed multi-well plates suitable for imaging. Allow cells to adhere overnight under standard culture conditions.
- Step 2: Reagent Addition and Treatment. Add recombinant Annexin V conjugated to a fluorophore (e.g., Annexin V-488 or Annexin V-594) to the culture medium at a final concentration of 0.25 µg/mL. For dual-reporter analysis, add a viability dye such as YOYO-3. Subsequently, treat cells with apoptotic inducers (e.g., cycloheximide, staurosporine) or vehicle control.
- Step 3: Real-Time Imaging and Data Acquisition. Place the plate in a high-content live-cell imager maintained at 37°C and 5% CO₂. Acquire images at regular intervals (e.g., every 2 hours) for the duration of the experiment (e.g., 24 hours).
- Step 4: Data Analysis. Quantify the percentage of Annexin V-positive and viability dye-positive cells at each time point using the imager's analysis software. Generate kinetic curves of apoptosis progression. This method allows for single-cell tracking and population-level analysis.
Protocol: Multiparametric Live-Cell Imaging of Redox Regulation in Apoptosis
This advanced protocol uses two-photon fluorescence lifetime imaging microscopy (FLIM) to correlate caspase-3 activation with cellular redox status, as described in a 2022 study on colorectal cancer cells [105].
- Step 1: Cell Preparation and Sensor Transfection. Seed colorectal cancer cells in imaging dishes. Transfect cells with the genetically encoded caspase-3 sensor mKate2-DEVD-iRFP.
- Step 2: Apoptosis Induction. Stimulate apoptosis using agents such as staurosporine, cisplatin, or hydrogen peroxide.
- Step 3: Multiparametric FLIM Acquisition. Use a two-photon excitation FLIM system to simultaneously monitor:
- Caspase-3 Activity: via the FRET signal from the mKate2-DEVD-iRFP sensor.
- Redox Co-factors: via the autofluorescence and fluorescence lifetime of NAD(P)H and FAD. The redox ratio is calculated as FAD/(NADH+FAD).
- Step 4: Correlation Analysis. Analyze the correlations between the production of reactive oxygen species (ROS), the redox ratio, the proportions of bound vs. free NADH and NADPH, and caspase-3 activity at the level of individual cells.
Visualizing an Integrated Apoptosis Detection Workflow
The following diagram illustrates the logical workflow for integrating morphological and molecular detection methods, as exemplified by the protocols above.
Discussion and Future Perspectives
The case studies and data presented demonstrate a clear trajectory in apoptosis detection toward multiplexed, kinetic, and integrated workflows. The superior sensitivity of real-time Annexin V imaging and Caspase-Glo assays is pushing out traditional endpoint methods in high-quality research [104] [36]. Furthermore, the ability to correlate apoptosis with other cellular states, such as metabolic redox status, as shown in multiparametric FLIM studies, provides a deeper mechanistic understanding of drug action and resistance [105].
This evolution aligns with the broader trend in bioinformatics and cancer research, where "multi-optosis" models that integrate dozens of regulated cell death forms using multi-omic data are being developed for pan-cancer biomarker discovery [103]. The future of apoptosis detection in cancer research lies in seamlessly combining the spatial and kinetic fidelity of live-cell imaging with the biochemical specificity of molecular assays, all within frameworks capable of handling the complex, high-dimensional data these methods produce. This integrated approach is essential for advancing personalized medicine and developing more effective cancer therapies.
Conclusion
The integration of morphological and molecular methods is not merely an enhancement but a necessity for a rigorous and holistic analysis of apoptosis. This synergistic approach overcomes the limitations inherent in using either methodology alone, providing greater confidence in data interpretation, especially in complex physiological models and therapeutic contexts. Future directions will be shaped by the development of more specific molecular probes, the refinement of high-resolution, label-free imaging technologies, and the creation of standardized, validated integrated workflows. Embracing these advanced, multi-parametric detection strategies will accelerate drug discovery, improve therapeutic response monitoring, and deepen our fundamental understanding of cell death in health and disease.
References
- 1. 50 years on and still very much alive: 'Apoptosis [https://www.nature.com/articles/s41416-022-02020-0]
- 2. Apoptosis: A Review of Programmed Cell Death - PMC [https://pmc.ncbi.nlm.nih.gov/articles/PMC2117903/]
- 3. Morphological assessment of apoptosis [https://www.sciencedirect.com/science/article/abs/pii/S1046202307002150]
- 4. Light Microscopy as a Tool to Detect Apoptosis and Other ... [https://pmc.ncbi.nlm.nih.gov/articles/PMC12051451/]
- 5. Apoptosis [https://en.wikipedia.org/wiki/Apoptosis]
- 6. Research progress on morphology and mechanism of ... [https://www.nature.com/articles/s41419-024-06712-8]
- 7. Morphological Features of Organelles during Apoptosis [https://pmc.ncbi.nlm.nih.gov/articles/PMC3972681/]
- 8. High-Resolution Imaging of Morphological Changes ... [https://www.mdpi.com/2079-6374/15/8/522]
- 9. High-Resolution Imaging of Morphological Changes ... [https://pmc.ncbi.nlm.nih.gov/articles/PMC12384366/]
- 10. Caspases as master regulators of programmed cell death [https://pmc.ncbi.nlm.nih.gov/articles/PMC12229594/]
- 11. Apoptotic detection methods — from morphology to gene [https://www.sciencedirect.com/science/article/abs/pii/S0079633603800025]
- 12. Regulation of apoptosis by BH3 domains in a cell-free system [https://www.sciencedirect.com/science/article/pii/S0960982206004106]
- 13. Antiapoptotic Herpesvirus Bcl-2 Homologs Escape ... [https://pmc.ncbi.nlm.nih.gov/articles/PMC110854/]
- 14. Inducing Targeted, Caspase-Independent Apoptosis with ... [https://www.mdpi.com/2072-6694/17/7/1179]
- 15. Apoptosis: A Comprehensive Overview of Signaling Pathways ... [https://pmc.ncbi.nlm.nih.gov/articles/PMC11592877/]
- 16. Mechanisms of Cell Death: Apoptosis - CST Blog [https://blog.cellsignal.com/mechanisms-of-cell-death-apoptosis]
- 17. Apoptosis detection: a purpose-dependent approach ... [https://pmc.ncbi.nlm.nih.gov/articles/PMC8208110/]
- 18. Morphologic criteria and detection of apoptosis [https://pubmed.ncbi.nlm.nih.gov/10412642/]
- 19. Intrinsic and Extrinsic Pathways of Apoptosis [https://www.thermofisher.com/us/en/home/life-science/antibodies/antibodies-learning-center/antibodies-resource-library/cell-signaling-pathways/cellular-apoptosis-pathway.html]
- 20. Apoptosis Market Size, Share and Opportunities, 2025-2032 [https://www.coherentmarketinsights.com/industry-reports/apoptosis-market]
- 21. Programmed cell death detection methods: a systematic ... [https://link.springer.com/article/10.1007/s10495-022-01735-y]
- 22. Imaging of morphological and biochemical hallmarks ... [https://pmc.ncbi.nlm.nih.gov/articles/PMC6851291/]
- 23. NIST Study Aims to Improve Utility of the Scanning Electron ... [https://www.nist.gov/news-events/news/2025/04/nist-study-aims-improve-utility-scanning-electron-microscope]
- 24. Dynamic full-field optical coherence tomography module ... [https://www.nature.com/articles/s42003-023-05378-w]
- 25. Imagining the future of optical microscopy: everything, ... [https://www.nature.com/articles/s42003-023-05468-9]
- 26. Subcellular Comparison of Visible-Light Optical Coherence ... [https://pmc.ncbi.nlm.nih.gov/articles/PMC9379865/]
- 27. Guidelines for Regulated Cell Death Assays: A Systematic ... [https://www.frontiersin.org/journals/cell-and-developmental-biology/articles/10.3389/fcell.2021.634690/full]
- 28. TUNEL Assays | Thermo Fisher Scientific - US [https://www.thermofisher.com/us/en/home/life-science/cell-analysis/cell-viability-and-regulation/apoptosis/tunel-assays.html]
- 29. How DNA Mass Ladder Works — In One Simple Flow (2025) [https://www.linkedin.com/pulse/how-dna-mass-ladder-works-one-simple-flow-2025-itcraft-dynamics-pwaff/]
- 30. Induction of Mitochondria-Mediated Apoptosis in Ca Ski ... [https://pmc.ncbi.nlm.nih.gov/articles/PMC3236607/]
- 31. Analysis of mitochondrial membrane potential, ROS, and ... [https://www.sciencedirect.com/science/article/pii/S1016847825000627]
- 32. TUNEL Assay - an overview | ScienceDirect Topics [https://www.sciencedirect.com/topics/neuroscience/tunel-assay]
- 33. Harmonizing TUNEL with multiplexed iterative ... [https://pmc.ncbi.nlm.nih.gov/articles/PMC12146639/]
- 34. Mitochondrial membrane potential and compartmentalized ... [https://pmc.ncbi.nlm.nih.gov/articles/PMC12454667/]
- 35. Comparison and Optimization of DNA Extraction Methods ... [https://pmc.ncbi.nlm.nih.gov/articles/PMC11932244/]
- 36. Apoptosis Marker Assays for HTS - NCBI [https://www.ncbi.nlm.nih.gov/books/NBK572437/]
- 37. Identification of Functional Regions Defining Different Activity ... [https://pmc.ncbi.nlm.nih.gov/articles/PMC2919105/]
- 38. Caspase Assays | Thermo Fisher Scientific - US [https://www.thermofisher.com/us/en/home/life-science/cell-analysis/cell-viability-and-regulation/apoptosis/caspase-assays.html]
- 39. Measurement of phosphatidylserine exposure in ... [https://pubmed.ncbi.nlm.nih.gov/10744422/]
- 40. Apoptosis Detection: Methods, Assays & Analysis ... [https://www.revvity.com/ask/apoptosis]
- 41. Phosphatidylserine exposure and plasma membrane ... [https://www.nature.com/articles/s44303-025-00110-1]
- 42. Apoptosis Assay Market Size Report, 2025 – 2034 [https://www.gminsights.com/industry-analysis/apoptosis-assay-market]
- 43. Assays for Apoptosis and Autophagy—Section 15.5 [https://www.thermofisher.com/us/en/home/references/molecular-probes-the-handbook/assays-for-cell-viability-proliferation-and-function/assays-for-apoptosis.html]
- 44. Apoptotic detection methods--from morphology to gene [https://pubmed.ncbi.nlm.nih.gov/12756893/]
- 45. Radionuclide imaging of apoptosis for clinical application - PMC [https://pmc.ncbi.nlm.nih.gov/articles/PMC8921127/]
- 46. In Vivo Detection of Apoptosis - Journal of Nuclear Medicine [https://jnm.snmjournals.org/content/49/Suppl_2/81S]
- 47. A systematic comparison of 18F-C-SNAT to established ... [https://pmc.ncbi.nlm.nih.gov/articles/PMC4558304/]
- 48. Imaging of Apoptosis: The Need to Distinguish Tracer Uptake ... [https://jnm.snmjournals.org/content/56/9/1300]
- 49. Comparative Assessment of Substrates and Activity Based ... [https://journals.plos.org/plosone/article?id=10.1371/journal.pone.0006374]
- 50. Imaging of proteases using activity-based probes [https://www.sciencedirect.com/science/article/abs/pii/S1367593123000376]
- 51. Dual-Modality Activity-Based Probes as Molecular Imaging ... [https://pmc.ncbi.nlm.nih.gov/articles/PMC5367444/]
- 52. Apoptosis Detection Assays - PubMed [https://pubmed.ncbi.nlm.nih.gov/36066709/]
- 53. An enhanced bioluminescence-based Annexin V probe for apoptosis detection in vitro and in vivo | Cell Death & Disease [https://www.nature.com/articles/cddis2017141]
- 54. Real-time and regional analysis of the efficacy of anticancer ... [https://pubs.rsc.org/en/content/articlehtml/2025/lc/d4lc00990h]
- 55. North America Apoptosis Assay Market Trends 2025–2034 [https://www.gminsights.com/industry-analysis/north-america-apoptosis-assay-market]
- 56. Flow cytometry-based apoptosis detection - PMC [https://pmc.ncbi.nlm.nih.gov/articles/PMC3863590/]
- 57. Apoptotic Cell Enrichment Kit 2025 Trends and Forecasts ... [https://www.archivemarketresearch.com/reports/apoptotic-cell-enrichment-kit-307679]
- 58. Advances in high-throughput drug screening based on ... [https://www.sciencedirect.com/science/article/pii/S2090123225006897]
- 59. Machine learning-driven programmed cell death signature ... [https://pubmed.ncbi.nlm.nih.gov/40633211/]
- 60. Molecular Imaging of Apoptosis: From Micro to Macro - PMC [https://pmc.ncbi.nlm.nih.gov/articles/PMC4377726/]
- 61. Comparison of several techniques for the detection ... [https://pmc.ncbi.nlm.nih.gov/articles/PMC6495494/]
- 62. Measuring Nonapoptotic Caspase Activity with a ... [https://www.eneuro.org/content/9/5/ENEURO.0147-21.2022]
- 63. Morphological profiling data resource enables prediction of ... [https://www.sciencedirect.com/science/article/pii/S2589004225007060]
- 64. Unravelling oncosis: morphological and molecular insights ... [https://www.frontiersin.org/journals/immunology/articles/10.3389/fimmu.2024.1450998/full]
- 65. Oncosis is the predominant type of cell death in ... [https://pmc.ncbi.nlm.nih.gov/articles/PMC11936275/]
- 66. Regulation of ATP Release in Cell Death [May 6, 2025] [https://www.dojindo.com/contents/celldeath_sn20250506.html]
- 67. An unconventional autophagic pathway that inhibits ATP ... [https://www.nature.com/articles/s41467-025-58619-3]
- 68. Oncosis is the predominant type of cell death in ... [https://journals.plos.org/plosone/article?id=10.1371/journal.pone.0308586]
- 69. An electrochemical detection method for ATP based on ... [https://www.sciencedirect.com/science/article/abs/pii/S0026265X25021599]
- 70. Specific ATP Detection Using Molecule‐Responsive DNA ... [https://pmc.ncbi.nlm.nih.gov/articles/PMC12288776/]
- 71. A water-soluble NIR-II fluorescent probe for non-invasive ... [https://pubs.rsc.org/en/content/articlelanding/2025/tb/d5tb01208b]
- 72. 2D and 3D cell cultures – a comparison of different types of ... [https://pmc.ncbi.nlm.nih.gov/articles/PMC6040128/]
- 73. Harnessing 3D cell models and high-resolution imaging to ... [https://pmc.ncbi.nlm.nih.gov/articles/PMC12277333/]
- 74. 3D tumor cultures for drug resistance and screening ... [https://pmc.ncbi.nlm.nih.gov/articles/PMC11927140/]
- 75. Comparative analysis of 3D-culture techniques for ... [https://www.nature.com/articles/s41598-025-13588-x]
- 76. Optimized culturing yields high success rates and ... [https://www.nature.com/articles/s41698-025-00946-1]
- 77. High-content screening morphological analysis to evaluate ... [https://pubmed.ncbi.nlm.nih.gov/40222580/]
- 78. Comprehensive landscape of cell death mechanisms [https://pmc.ncbi.nlm.nih.gov/articles/PMC12308763/]
- 79. XDeathDB: a visualization platform for cell death molecular ... [https://www.nature.com/articles/s41419-021-04397-x]
- 80. Identification of the pyroptosis, apoptosis, and necroptosis ... [https://eurjmedres.biomedcentral.com/articles/10.1186/s40001-025-02702-4]
- 81. Review The biochemical pathways of apoptotic, necroptotic ... [https://www.sciencedirect.com/science/article/pii/S1097276523010171]
- 82. Investigating apoptosis in peripheral blood mononuclear cells ... [https://pmc.ncbi.nlm.nih.gov/articles/PMC12577001/]
- 83. Cell morphology-based machine learning models for ... [https://www.nature.com/articles/s41540-021-00180-y]
- 84. Electronic detection of apoptotic cells on a microchip [https://www.sciencedirect.com/science/article/abs/pii/S0956566324007565]
- 85. Automated detection of apoptotic bodies and cells in label-free ... [https://pmc.ncbi.nlm.nih.gov/articles/PMC10563152/]
- 86. Bridging cell morphological behaviors and molecular ... [https://pmc.ncbi.nlm.nih.gov/articles/PMC12217155/]
- 87. Assessing Extracellular Vesicle Turnover In Vivo Using ... [https://pmc.ncbi.nlm.nih.gov/articles/PMC12561326/]
- 88. Designing an apoptosis reporter by mutagenesis-based ... [https://www.sciencedirect.com/science/article/pii/S2090123225004795]
- 89. "Reading cell death with light: Real-time visualization of ... [https://www.eurekalert.org/news-releases/1096590]
- 90. Serum Caspase-3 Levels as a Predictive Molecular ... [https://www.mdpi.com/1422-0067/25/12/6772]
- 91. Evaluation of Apoptotic Caspase-3 Immunopositivity in Human ... [https://pmc.ncbi.nlm.nih.gov/articles/PMC11989430/]
- 92. Integrated real-time imaging of executioner caspase ... [https://www.nature.com/articles/s41420-025-02662-y]
- 93. of Detection : A review of conventional and novel... apoptosis [https://pubs.rsc.org/en/content/articlehtml/2010/ay/c0ay00247j]
- 94. and Quantification of Nuclear Detection Changes in... Morphology [https://ar.iiarjournals.org/content/37/5/2239]
- 95. High-content screening morphological analysis to evaluate ... [https://www.sciencedirect.com/science/article/abs/pii/S0300483X25000964]
- 96. Monitoring drug induced apoptosis and treatment ... [https://pmc.ncbi.nlm.nih.gov/articles/PMC5544523/]
- 97. Spheroid-Based 3D Models to Decode Cell Function and ... [https://pmc.ncbi.nlm.nih.gov/articles/PMC12606745/]
- 98. 2D versus 3D tumor-on-chip models to study the impact of ... [https://www.nature.com/articles/s41598-025-03504-8]
- 99. Review of three-dimensional spheroid culture models ... [https://www.sciencedirect.com/science/article/pii/S1572100024000140]
- 100. A quantitative real-time approach for discriminating ... [https://www.nature.com/articles/cddiscovery2016101]
- 101. Assay Reagent in the Real World: 5 Uses You'll Actually... Apoptosis [https://www.linkedin.com/pulse/apoptosis-assay-reagent-real-world-5-uses-youll-actually-gyavf]
- 102. Comparative analysis of morphological and molecular ... [https://pmc.ncbi.nlm.nih.gov/articles/PMC7447646/]
- 103. Frontiers | Integrated multi-optosis model for pan- cancer candidate... [https://www.frontiersin.org/journals/bioinformatics/articles/10.3389/fbinf.2025.1630518/full]
- 104. Robust high-throughput kinetic analysis of apoptosis with ... [https://www.nature.com/articles/cddis2016332]
- 105. Insight into redox regulation of apoptosis in cancer cells with... [https://pubmed.ncbi.nlm.nih.gov/35296739/]