Mitochondrial Cytochrome c Release: Unraveling the Core Trigger of Intrinsic Apoptosis in Disease and Therapy
This comprehensive review delves into the mitochondrial intrinsic apoptosis pathway, with a focused examination of cytochrome c release as a pivotal regulatory point.
Mitochondrial Cytochrome c Release: Unraveling the Core Trigger of Intrinsic Apoptosis in Disease and Therapy
Abstract
This comprehensive review delves into the mitochondrial intrinsic apoptosis pathway, with a focused examination of cytochrome c release as a pivotal regulatory point. Tailored for researchers and drug development professionals, the article synthesizes foundational molecular mechanisms, cutting-edge detection methodologies, common experimental challenges, and comparative validation techniques. It explores the pathway's profound implications in cancer, neurodegenerative diseases, and therapeutic development, highlighting recent advances from 2025 research on novel regulators like LACTB and innovative detection platforms such as 3D bifunctional SERS substrates. The content provides a rigorous scientific framework for understanding apoptosis dysregulation and developing targeted interventions that modulate cytochrome c-mediated cell death.
The Molecular Architecture of Cytochrome c Release in Intrinsic Apoptosis
Core Components of the Mitochondrial Apoptotic Pathway
The mitochondrial apoptotic pathway, or intrinsic pathway, is a tightly regulated process initiated by intracellular stress signals. Its core components involve complex interactions between Bcl-2 family proteins, mitochondrial membrane integrity, and caspase activation.
Bcl-2 Protein Family Regulation
The Bcl-2 protein family constitutes the critical regulatory network controlling mitochondrial outer membrane permeabilization (MOMP). These proteins are categorized by their structure and function into three groups.
Table 1: Bcl-2 Protein Family Classification and Functions
| Classification | Representative Members | Key Features | Primary Function |
|---|---|---|---|
| Anti-apoptotic | Bcl-2, Bcl-xL, Mcl-1 | Contain BH1-BH4 domains | Bind and inhibit pro-apoptotic members; preserve mitochondrial integrity |
| Pro-apoptotic Effectors | Bax, Bak | Contain BH1-BH3 domains | Form oligomeric pores in MOM; execute MOMP |
| Pro-apoptotic Activators | Bid, Bim, Puma | BH3-only proteins | Directly activate Bax/Bak or neutralize anti-apoptotic proteins |
Cytochrome c Release and apoptosome Formation
MOMP enables the release of cytochrome c and other pro-apoptotic factors from the mitochondrial intermembrane space into the cytosol. Quantitative studies reveal the dynamics of this process.
Table 2: Quantitative Parameters of Cytochrome c Release and Apoptosome Formation
| Parameter | Value Range | Experimental Context | Significance |
|---|---|---|---|
| Time to MOMP completion | 5-30 minutes | Single-cell imaging in HeLa cells with STS | Indicates rapid, all-or-nothing commitment |
| Cytochrome c concentration in intermembrane space | ~0.5 mM | Liver mitochondria isolation | High concentration enables rapid signaling upon release |
| Apoptosome molecular weight | ~1.4 MDa | SEC-MALS analysis | Large complex facilitates procaspase-9 activation |
| Caspase-9 activation Kd for apoptosome | ~25 nM | FRET-based binding assays | High affinity interaction ensures efficient signaling |
Experimental Methodologies for Studying Mitochondrial Apoptosis
Quantitative Analysis of Cytochrome c Release
Protocol: Fluorescence Microscopy-Based Cytochrome c Release Assay
- Principle: Track cytochrome c localization in real-time using fluorescently labeled cytochrome c or immunostaining in permeabilized cells.
- Materials:
- Cells expressing cytochrome c-GFP
- Apoptosis inducer (e.g., 1 µM staurosporine)
- Confocal microscope with environmental chamber
- Image analysis software (e.g., ImageJ, MATLAB)
- Procedure:
- Plate cells on glass-bottom dishes and transfert with cytochrome c-GFP construct.
- Treat cells with apoptosis inducer and immediately place on microscope stage maintained at 37°C with 5% CO₂.
- Acquire time-lapse images every 2-5 minutes for 4-6 hours using 488 nm excitation.
- Quantify fluorescence intensity in cytosolic regions of interest (ROI) versus mitochondrial ROI.
- Calculate release kinetics: Time from stimulus to 50% decrease in mitochondrial fluorescence (T₅₀).
Bax/Bak Oligomerization Assessment
Protocol: Cross-linking and Immunoblotting for Bax Oligomerization
- Principle: Chemical cross-linkers stabilize protein complexes for molecular weight analysis via Western blot.
- Materials:
- Isolated mitochondria or digitonin-permeabilized cells
- Bis(maleimido)hexane (BMH) cross-linker (2 mM stock in DMSO)
- Lysis buffer (1% CHAPS, 150 mM NaCl, 50 mM HEPES, pH 7.4)
- Anti-Bax antibody (Clone 6A7 for active conformation)
- Procedure:
- Induce apoptosis in cells or treat isolated mitochondria with recombinant tBid (50 nM).
- At various time points, harvest mitochondria and resuspend in cross-linking buffer.
- Add BMH to 200 µM final concentration and incubate 30 minutes at room temperature.
- Quench reaction with 50 mM DTT for 15 minutes.
- Solubilize proteins in lysis buffer and perform SDS-PAGE under non-reducing conditions.
- Transfer to PVDF membrane and probe with Bax antibody.
- Identify monomeric (21 kDa), dimeric (~42 kDa), and higher-order oligomeric forms.
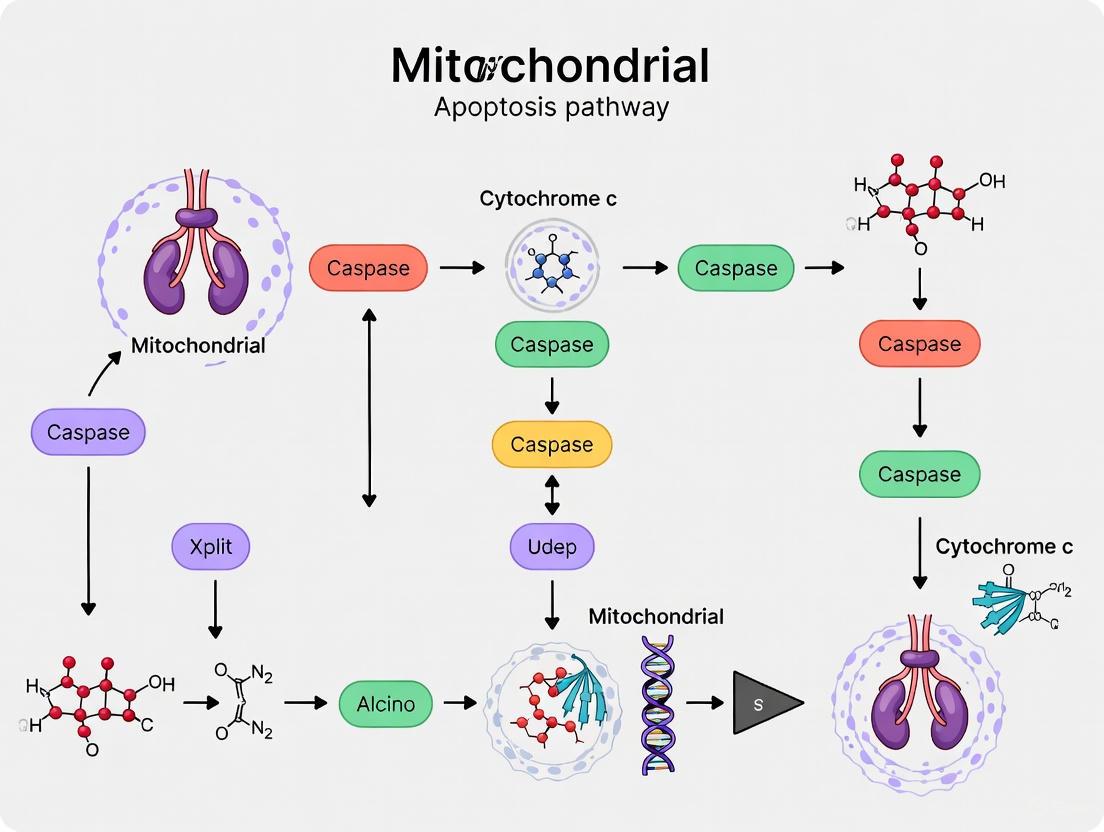
Signaling Pathway Visualization
Mitochondrial Apoptosis Pathway
Cytochrome c Release Assay Workflow
The Scientist's Toolkit: Essential Research Reagents
Table 3: Key Reagents for Mitochondrial Apoptosis Research
| Reagent/Material | Function/Application | Example Products |
|---|---|---|
| Recombinant tBid/Bim | Direct activator of Bax/Bak for in vitro MOMP assays | ProSpec PRO-515, R&D Systems 861-BID |
| Bax Channel Inhibitor | Specifically blocks Bax-mediated membrane permeabilization | EMD Millipore 196855 |
| Cytochrome c ELISA Kit | Quantify cytochrome c release in cell lysates or supernatants | R&D Systems DYC773, Abcam ab119521 |
| Active Conformation-Specific Bax Antibody | Detect activated, mitochondrial Bax by immunofluorescence/flow cytometry | BioLegend 633502 (Clone 6A7) |
| Caspase-3/7 Fluorescent Substrate | Measure effector caspase activity as apoptosis endpoint | Thermo Fisher Scientific E13184 (DEVD-AMC) |
| MitoTracker Probes | Label functional mitochondria for live-cell imaging | Thermo Fisher Scientific M7514 (CMXRos) |
| BH3 Profiling Peptides | Assess mitochondrial priming and Bcl-2 family dependencies | Custom synthesis (Bim, Bad, Noxa, etc.) |
| SMAC/Diablo Mimetics | IAP antagonists that synergize with intrinsic apoptosis inducers | TetraLogic Pharmaceuticals birinapant |
Cytochrome c is a highly conserved nuclear-encoded mitochondrial hemoprotein that serves as a critical integrator of cellular life and death decisions. This multifunctional protein operates as an essential electron shuttle in the mitochondrial respiratory chain under physiological conditions yet transforms into a potent apoptotic trigger upon cellular stress [1] [2]. With a molecular weight of approximately 12-13 kDa and containing 104 amino acids in its mature form in mammals, cytochrome c's structure features five α-helices, a two-strand β-sheet, and a heme group covalently attached via thioether bonds to Cys14 and Cys17, with His18 and Met80 serving as axial ligands to the heme iron [3] [1]. The transition of cytochrome c from its respiratory function to its apoptotic role represents a fundamental shift in cellular fate, making it a pivotal research focus in cell biology, cancer therapeutics, and degenerative diseases. This whitepaper examines the structural basis, molecular mechanisms, and regulatory processes governing cytochrome c's dual functions within the broader context of intrinsic apoptosis pathway research.
Structural Basis of Cytochrome c Functionality
The functional versatility of cytochrome c stems from its evolutionarily conserved structural features, which enable its participation in distinct cellular processes. Fifteen amino acid residues remain highly conserved across species, underscoring their critical functional importance [1]. The heme group, positioned within a hydrophobic environment, exhibits limited solvent exposure (approximately 7.5% of its surface), with only the frontal edge available for electron transfer interactions [2].
Table 1: Key Functional Residues of Cytochrome c
| Residue | Functional Role | Biological Significance |
|---|---|---|
| Cys14, Cys17 | Heme covalent attachment via thioether bonds | Structural integrity and heme retention |
| His18 | Heme iron ligand (CXXCH motif) | Redox function and electron transfer |
| Met80 | Heme iron ligand | Regulates redox potential and peroxidase activity |
| Lys7, Lys25, Lys39, Lys72 | Apaf-1 binding | Apoptosome formation and caspase activation |
| Lys8, Lys13, Lys27, Lys72, Lys86, Lys87 | Respiratory complex binding | Electron transfer to cytochrome c oxidase |
| Glu62, Lys88, Arg91 | ATP binding | Allosteric regulation of electron transfer |
Electrostatic interactions play a crucial role in cytochrome c's functional partnerships. Specific lysine residues (Lys8, Lys13, Lys27, Lys72, Lys86, Lys87) facilitate complex formation with cytochrome c1 through salt bridges [1]. Similarly, recognition sites for cytochrome c oxidase involve Lys8, Gln12, Lys13, and Lys87, forming critical hydrogen bonds and salt bridges near the exposed heme edge [1]. The same lysine residues also participate in interactions with cytochrome b5 and c1, demonstrating the multifunctional nature of these recognition surfaces [4].
The evolutionary conservation of cytochrome c's structure underscores its fundamental biological importance. Global knockout of cytochrome c in mice results in embryonic lethality at mid-gestation, coinciding with the developmental switch from glycolysis to aerobic energy production [3] [2]. This demonstrates the absolute requirement for cytochrome c in sustaining mammalian life beyond early embryonic development.
Cytochrome c in Mitochondrial Electron Transport
Within the mitochondrial electron transport chain, cytochrome c operates as a mobile electron carrier shuttling electrons between Complex III (cytochrome bc₁ complex) and Complex IV (cytochrome c oxidase). This function positions cytochrome c at a critical regulatory point in oxidative phosphorylation [2]. The electron transfer from cytochrome c to oxygen via cytochrome c oxidase represents an essentially irreversible reaction with a substantial free energy change (ΔG°′ = -100 kJ/mol), approximately twice that of the reactions catalyzed by Complexes I and III [2].
The rate-limiting nature of this electron transfer step under physiological conditions necessitates sophisticated regulatory mechanisms. These include allosteric regulation by ATP/ADP ratios, tissue-specific isoform expression, and reversible post-translational modifications, particularly phosphorylation [2]. The binding of ATP to cytochrome c at a site involving invariant residues Lys72, Lys86, Lys87, and Arg91 provides a mechanism for metabolic feedback inhibition, where ATP occupancy at this site diminishes electron flow through the respiratory chain under high cellular energy conditions [4].
Table 2: Quantitative Parameters of Cytochrome c in Electron Transport
| Parameter | Value | Experimental Context |
|---|---|---|
| Redox Potential | ~260 mV | Mammalian cytochrome c, pH 7.0 |
| Electron Transfer Rate | Rate-limiting step | Physiological conditions in mammalian ETC |
| Oxygen Reduction | ΔG°′ = -100 kJ/mol | Complete reduction of O₂ to H₂O via CcO |
| ATP Binding Affinity | Physiological concentrations | K₄ dependent on [ATP]/[ADP] ratio |
| Evolutionary Conservation | 15/104 residues | Absolutely conserved in mammals |
Beyond its primary electron shuttle function, cytochrome c contributes to mitochondrial antioxidant defense by scavenging reactive oxygen species (ROS), particularly superoxide anions [2] [4]. This antioxidant capacity represents an underappreciated aspect of cytochrome c's physiological function, with potential implications for cellular redox homeostasis and mitochondrial integrity.
Cytochrome c Release and Apoptosis Initiation
The transition of cytochrome c from mitochondrial respiratory component to cytosolic apoptosis initiator represents a pivotal event in intrinsic apoptosis. This process involves mitochondrial outer membrane permeabilization (MOMP), regulated primarily by Bcl-2 family proteins [5] [1]. Pro-apoptotic stimuli activate BH3-only proteins, which sequester anti-apoptotic proteins like Bcl-2 and Bcl-xL, thereby liberating multidomain pro-apoptotic effectors Bax and Bak to form pores in the mitochondrial outer membrane [3].
Mechanisms of Cytochrome c Release
Multiple interconnected mechanisms facilitate cytochrome c release from mitochondria:
Bcl-2 Protein Regulation: Oligomerization of Bax or Bak in the outer mitochondrial membrane creates pores permitting cytochrome c release. Cells deficient in both Bax and Bak demonstrate complete resistance to cytochrome c release and apoptosis induction by diverse stimuli [3].
Mitochondrial Permeability Transition (MPT): Calcium overload, oxidative stress, or ATP depletion can induce opening of the mitochondrial permeability transition pore, leading to inner membrane depolarization, osmotic swelling, and outer membrane rupture with consequent cytochrome c release [3]. While the precise molecular composition of the MPT pore remains debated, cyclophilin D (CypD) has been established as a critical regulatory component [3].
Cardiolipin Peroxidation: Cytochrome c undergoes functional conversion to a cardiolipin-specific peroxidase upon interaction with this mitochondria-specific phospholipid. This peroxidation activity disrupts cytochrome c's association with the inner membrane, facilitating its release through outer membrane pores [4].
Apoptosome Formation and Caspase Activation
Upon cytosolic release, cytochrome c initiates apoptosome assembly through ordered molecular interactions:
Apaf-1 Binding: Cytochrome c binds to Apaf-1 in a dATP/ATP-dependent manner, relieving Apaf-1 autoinhibition [3] [1].
Heptameric Complex Assembly: Seven cytochrome c-Apaf-1 complexes oligomerize into a wheel-like structure with CARD domains forming a central platform [6].
Caspase Activation: The apoptosome recruits and activates procaspase-9, which subsequently cleaves and activates effector caspases-3 and -7, executing the apoptotic program [7].
The essential nature of cytochrome c in apoptosis is demonstrated by the K72A mutation, which preserves electron transfer function but abrogates Apaf-1 activation, resulting in embryonic or perinatal lethality in knock-in mice due to central nervous system defects and disrupted lymphocyte homeostasis [1].
Diagram 1: Cytochrome c-mediated Apoptosis
Experimental Analysis of Cytochrome c Function
Methodologies for Cytochrome c Release Detection
Immunocytochemistry and Subcellular Fractionation: Cells are fractionated into mitochondrial and cytosolic components using differential centrifugation following apoptotic induction. Cytochrome c distribution is analyzed by Western blotting using specific antibodies. Subcellular localization can be visualized by immunofluorescence microscopy in fixed cells using cytochrome c antibodies and mitochondrial markers [3].
Cytochrome c Knockout and Mutagenesis Models: Global cytochrome c knockout in mice results in embryonic lethality at approximately mid-gestation (day 10.5), establishing its essential role in embryonic development [3] [1]. Tissue-specific knockout models, such as in forebrain neurons, demonstrate severe behavioral abnormalities and premature death, highlighting its tissue-specific requirements [1].
Site-Directed Mutagenesis: Specific point mutations (e.g., K72A) disrupt apoptotic function while preserving respiratory activity, enabling functional dissection of cytochrome c's dual roles [1]. Mutations in lysine residues involved in Apaf-1 binding (Lys7, Lys25, Lys39, sequence 62-65) progressively reduce apoptosome activity, with multiple mutations decreasing caspase activation by >1000-fold [4].
Analysis of Cytochrome c Protein Interactions
Surface Plasmon Resonance and Fluorescence Assays: Quantitative analysis of cytochrome c binding to interaction partners (Apaf-1, cardiolipin, tRNA) provides kinetic parameters. A novel fluorescence assay revealed cytochrome c binds tRNA with a 3:1 molecular ratio and affinity regulated by cytochrome c's redox state [8].
Cryo-Electron Microscopy: High-resolution (3.8 Å) structures of the complete mammalian apoptosome have elucidated the molecular mechanism of cytochrome c-mediated Apaf-1 activation, revealing critical interaction interfaces involving cytochrome c residues 56, 72, 76, and 81 [1].
Cross-linking and Co-immunoprecipitation: These techniques identify physiological interaction partners of cytochrome c under various cellular conditions, revealing associations with proteins including HIGD1A, CHCHD2, ITPR1, and nucleophosmin that modulate its functions [1].
Table 3: Experimental Models for Cytochrome c Functional Analysis
| Methodology | Key Findings | Technical Considerations |
|---|---|---|
| Cytochrome c knockout mice | Embryonic lethality at E10.5; essential for aerobic energy production | Conditional knockout required for post-embryonic study |
| Mutagenesis studies (K72A) | Separates respiratory (intact) from apoptotic (defective) functions | Demonstrates independent functional domains |
| BH3 mimetic treatments | Induces MOMP and cytochrome c release | Tool for studying regulated apoptosis induction |
| Cytochrome c microinjection | Directly initiates apoptosome formation in cytoplasm | Bypasses mitochondrial regulation mechanisms |
| Phosphomimetic mutants | Identifies phosphorylation regulation sites (T28, Y48) | Modulates respiratory vs. apoptotic preference |
Regulatory Mechanisms
Post-Translational Modifications
Cytochrome c function is precisely regulated through various post-translational modifications that fine-tune its activities:
Phosphorylation: Multiple phosphorylation sites have been identified (T28, Y48, S47, Y97) that differentially modulate cytochrome c functions [1] [2]. Phosphorylation at tyrosine 48 decreases electron transfer activity while enhancing apoptotic function. This regulatory mechanism provides a potential switch mechanism for directing cytochrome c toward either respiration or apoptosis [2].
Oxidative Modifications: Exposure to reactive oxygen species can modify cytochrome c, enhancing its peroxidase activity and promoting cardiolipin oxidation, which facilitates its release from mitochondria [4]. The redox state of cytochrome c itself influences its interactions, with oxidized cytochrome c exhibiting stronger pro-apoptotic activity compared to reduced cytochrome c [8].
Other Modifications: Acetylation, tyrosine nitration, and other oxidative modifications further expand the regulatory landscape of cytochrome c functions, creating a complex signaling network that integrates metabolic and cell death signals [1].
Binding Partners and Allosteric Regulators
Nucleotide Binding: ATP binds to cytochrome c at a specific site involving Lys72, Lys86, Lys87, and Arg91, with occupancy dependent on cellular [ATP]/[ADP] ratios. This allosteric regulation provides metabolic feedback, diminishing electron flow when cellular energy charge is high [4].
tRNA Interactions: Cytochrome c binds tRNA with affinity regulated by its redox state. This interaction facilitates cytochrome c reduction while inhibiting its peroxidase activity, representing a novel regulatory mechanism linking protein synthesis and apoptosis [8].
Cardiolipin Binding: Interaction with the mitochondrial-specific phospholipid cardiolipin facilitates cytochrome c's peroxidase activity, enabling cardiolipin oxidation that disrupts mitochondrial membrane integrity and promotes cytochrome c release [4].
Cytochrome c in Cancer and Therapeutic Applications
Dysregulation in Cancer Cells
Cancer cells frequently exhibit altered cytochrome c expression and function as a mechanism to evade apoptosis. Reduced cytochrome c levels have been observed in various cancers, including gliomas, where decreased expression correlates with advanced disease stage [6]. In breast cancer, cytochrome c is released from epithelial cells into ductal cavities, accompanied by a redox imbalance that prevents apoptosis induction [7].
The pivotal role of cytochrome c in apoptosis has established it as a crucial factor in cancer treatment response. Chemotherapy, radiotherapy, and targeted therapies exert their effects partially through cytochrome c-mediated apoptosis induction [7]. Resistance to these treatments often correlates with impaired cytochrome c release or function, highlighting its central role in treatment efficacy [7].
Therapeutic Targeting Strategies
Direct Cytochrome c Delivery: Introducing exogenous cytochrome c into cancer cell cytosol bypasses mitochondrial regulation to directly activate apoptosis [7]. This approach demonstrates the therapeutic potential of targeting the cytochrome c apoptosis pathway.
Small Molecule Regulators: Natural compounds and synthetic molecules can promote cytochrome c release or enhance apoptosome function. Examples include apigenin, catalpol, and diallyl trisulfide, which upregulate cytochrome c expression or facilitate its release [7].
Cardiolipin Peroxidation Modulation: Inhibitors of cytochrome c-cardiolipin peroxidase activity prevent the early stages of cytochrome c release, representing a strategy for anti-apoptotic therapy in degenerative diseases [4]. Conversely, promoting this interaction could enhance cancer cell apoptosis.
BH3 Mimetics: Compounds that mimic BH3-only proteins promote Bax/Bak activation and cytochrome c release, with several advancing to clinical use for cancer therapy [3].
Diagram 2: Cytochrome c-targeted Therapeutics
The Scientist's Toolkit: Research Reagent Solutions
Table 4: Essential Research Reagents for Cytochrome c Investigation
| Reagent/Category | Specific Examples | Research Application |
|---|---|---|
| Antibodies | Anti-cytochrome c monoclonal antibodies, Anti-COX IV (mitochondrial marker), Anti-Apaf-1 | Western blotting, Immunofluorescence, Immunoprecipitation |
| Cell Lines | Cytochrome c knockout MEFs, Bax/Bak DKO cells, APAF-1 deficient cells | Apoptosis mechanism studies, Genetic background controls |
| Chemical Reagents | BH3 mimetics (ABT-263), Caspase inhibitors (Z-VAD-FMK), MPT inducers (Ca²⁺, ROS) | Pathway modulation, Mechanism dissection |
| Expression Vectors | Wild-type cytochrome c, Mutants (K72A, Y48H), Fluorescent tags (GFP, mCherry) | Structure-function studies, Localization tracking |
| Detection Kits | Cytochrome c release ELISA kits, Caspase activity assays, Mitochondrial isolation kits | High-throughput screening, Biochemical analysis |
| Animal Models | Cytochrome c knockout mice, Tissue-specific conditional knockouts, CYCS mutational models | In vivo pathway validation, Therapeutic testing |
Cytochrome c represents a paradigm of multifunctional protein organization, where evolutionary conservation of structure supports divergent yet essential cellular functions. Its dual roles in energy metabolism and apoptosis initiation position cytochrome c as a critical decision-maker in cellular fate determinations. The structural basis for these functions involves distinct interaction surfaces that facilitate electron transfer or apoptosome formation, with regulatory mechanisms including post-translational modifications and allosteric effectors fine-tuning its functional preferences. Ongoing research continues to elucidate novel aspects of cytochrome c biology, including its roles in non-apoptotic processes such as differentiation, cellular signaling, and immune response modulation. The therapeutic targeting of cytochrome c functions holds significant promise for cancer treatment, particularly in overcoming apoptosis resistance, while also offering potential for neuroprotective strategies in degenerative diseases. As technical advances in structural biology, genome editing, and single-cell analysis continue to expand, our understanding of this fundamental protein will undoubtedly reveal new layers of complexity in its regulation and function.
The B-cell lymphoma 2 (BCL-2) protein family serves as the fundamental regulatory switch controlling mitochondrial outer membrane permeabilization (MOMP), the decisive commitment point in the intrinsic apoptotic pathway [9] [10]. This in-depth technical guide examines the sophisticated molecular mechanisms through which pro- and anti-apoptotic BCL-2 family members interact to govern cellular fate. We detail the structural basis of protein-protein interactions, evaluate competing mechanistic models, present quantitative binding data, and provide methodologies for key experimental assessments. Furthermore, we explore the therapeutic translation of this knowledge through BH3-mimetic drugs, which represent a paradigm shift in targeting apoptotic pathways for cancer treatment. This resource is designed to equip researchers with both theoretical understanding and practical tools for advancing intrinsic apoptosis pathway research.
The BCL-2 family constitutes a critical regulatory network that determines cellular commitment to mitochondrial apoptosis. The founding member, BCL-2, was initially discovered in 1984 as the gene involved in the t(14;18)(q32.3;q21.3) chromosomal translocation found in approximately 85% of follicular lymphomas [9] [11]. This translocation juxtaposes the BCL2 gene with the immunoglobulin heavy chain enhancer region, resulting in BCL-2 overexpression [9]. BCL-2 represented the first identified oncogene that promotes cellular survival by inhibiting programmed cell death rather than stimulating proliferation [9] [12]. The BCL-2 family has since expanded to include approximately 20 proteins in humans, all characterized by the presence of BCL-2 homology (BH) domains—stretches of up to 15 amino acids that facilitate protein interactions [9].
The family is structurally and functionally categorized into three distinct subgroups:
- Multi-domain anti-apoptotic proteins (BCL-2, BCL-XL, BCL-w, MCL1, BCL2A1, BCLB)
- Multi-domain pro-apoptotic effector proteins (BAK, BAX, BOK)
- BH3-only pro-apoptotic proteins (BID, BIM, BAD, BIK, NOXA, PUMA, BMF, HRK) [9] [10] [12]
These proteins collectively function as a tripartite apoptotic switch that integrates diverse cellular stress signals, ultimately deciding whether a cell undergoes mitochondrial apoptosis [9].
Structural Organization and Functional Domains
BCL-2 family proteins are defined by their conserved BH domains and their capacity to regulate mitochondrial membrane permeability. The anti-apoptotic proteins typically contain four BH domains (BH1-BH4) and a C-terminal transmembrane domain that anchors them to intracellular membranes, particularly the mitochondrial outer membrane [9] [13]. The pro-apoptotic multi-domain proteins BAX and BAK possess BH1-3 domains and undergo conformational activation to form permeabilizing pores. BH3-only proteins feature only the BH3 domain, which serves as both a structural and functional motif for engaging other BCL-2 family members [10] [12].
The hydrophobic groove formed by the BH1-3 domains of anti-apoptotic proteins serves as the primary interaction site for the BH3 domains of pro-apoptotic partners [9] [10]. Structural studies have revealed that this groove contains four hydrophobic pockets (P1-P4) that accommodate the BH3 helix [9]. The BH4 domain, unique to anti-apoptotic proteins, is crucial for their survival function and may facilitate interactions with non-BCL-2 family proteins involved in cellular processes beyond apoptosis regulation [13].
Table 1: BCL-2 Protein Family Classification and Characteristics
| Subgroup | Representative Members | BH Domains | Primary Function | Subcellular Localization |
|---|---|---|---|---|
| Anti-apoptotic | BCL-2, BCL-XL, MCL-1, BCL-w | BH1-BH4 | Inhibit MOMP, promote cell survival | Mitochondria, ER, Nuclear envelope |
| Pro-apoptotic Effectors | BAX, BAK, BOK | BH1-BH3 | Execute MOMP, form permeabilizing pores | Cytosol (BAX), Mitochondria (BAK) |
| BH3-only Proteins | BIM, BID, PUMA, BAD, NOXA | BH3 only | Sense stress, inhibit anti-apoptotic or activate effectors | Various, often regulated by localization |
Molecular Mechanisms of Mitochondrial Regulation
The Central Paradigm: Mitochondrial Outer Membrane Permeabilization (MOMP)
The pivotal event in intrinsic apoptosis is MOMP, which permits the release of cytochrome c and other intermembrane space proteins into the cytosol [9] [10]. Once cytoplasmic, cytochrome c nucleates the formation of the apoptosome complex, leading to caspase-9 activation and subsequent execution of cell death via the caspase cascade [9] [14]. MOMP represents a point of no return in apoptotic commitment, and its regulation is the primary function of the BCL-2 protein family network [9].
Anti-apoptotic proteins preserve mitochondrial integrity by preventing MOMP, whereas pro-apoptotic proteins BAX and BAK are directly responsible for pore formation that enables cytochrome c release [10] [12]. In healthy cells, BAX predominantly resides in the cytosol or loosely associates with membranes, while BAK is integrated into the mitochondrial outer membrane. Upon apoptotic activation, BAX undergoes conformational changes, translocates to mitochondria, and inserts into the membrane, where both BAX and BAK oligomerize to form proteolipid pores [10].
Competing Molecular Models of BCL-2 Family Regulation
Several models have been proposed to explain the complex interactions between BCL-2 family proteins, each supported by distinct experimental evidence:
Direct Activation Model
This model posits that "activator" BH3-only proteins (BIM, BID, PUMA) directly bind and conformationally activate BAX and BAK [10]. "Sensitizer" BH3-only proteins (BAD, NOXA, BIK, BMF, HRK) promote apoptosis by neutralizing anti-apoptotic proteins, thereby freeing activators to engage BAX/BAK [10] [12]. Anti-apoptotic proteins sequester both activator and sensitizer BH3 proteins, preventing BAX/BAK activation.
Displacement Model
Also known as the indirect activation model, this hypothesis suggests that BAX and Bak are constitutively active but remain inhibited through direct binding to anti-apoptotic proteins [10]. BH3-only proteins initiate apoptosis by displacing BAX and BAK from anti-apoptotic partners, based on their selective binding affinities for different anti-apoptotic family members.
Embedded Together Model
This more recent model incorporates the critical role of mitochondrial membranes as the platform for BCL-2 family interactions [10]. It proposes that membrane integration induces conformational changes that alter binding affinities and interaction patterns. Anti-apoptotic proteins inhibit both activator BH3 proteins and membrane-inserted forms of BAX and BAK.
Unified Model
Building upon the embedded together model, the unified model distinguishes two inhibitory modes: Mode 1 involves anti-apoptotic proteins sequestering activator BH3 proteins, while Mode 2 involves direct inhibition of activated BAX and BAK [10]. This model also connects BCL-2 family function to mitochondrial dynamics, suggesting that Mode 2 repression affects mitochondrial fusion and fission processes.
Quantitative Binding Affinities and Interaction Specificities
The binding specificity between pro- and anti-apoptotic BCL-2 family members follows distinct patterns that inform both physiological regulation and therapeutic targeting. The following table summarizes key interaction profiles based on biochemical and biophysical studies:
Table 2: BCL-2 Family Protein Interaction Specificities and Binding Affinities
| Anti-apoptotic Protein | High-Affinity BH3 Binders (Activators) | Selective BH3 Binders (Sensitizers) | Effector Proteins Bound |
|---|---|---|---|
| BCL-2 | BIM, PUMA, BID | BAD, BMF | BAX, BID |
| BCL-XL | BIM, PUMA, BID | BAD, BIK, BMF, HRK | BAX, BAK, BID |
| BCL-w | BIM, PUMA, BID | BAD, BIK, BMF, HRK | BAX, BAK, BID |
| MCL-1 | BIM, PUMA, BID | NOXA, HRK | BAK, BID |
| A1/BFL-1 | BIM, PUMA, BID | NOXA, BIK, HRK | BAK, BID |
These selective interaction patterns create a sophisticated regulatory network where different anti-apoptotic proteins provide specific protective functions depending on cellular context and stress stimuli [10] [12]. The development of BH3-mimetic drugs has leveraged these specificity patterns to achieve targeted therapeutic effects.
Experimental Methodologies for Assessing BCL-2 Family Function
BH3 Profiling to Measure Mitochondrial Priming
BH3 profiling is a functional assay that quantifies a cell's proximity to the apoptotic threshold—a state termed "mitochondrial priming" [12]. This technique measures cytochrome c release after exposure to synthetic BH3 peptides that mimic specific BH3-only proteins.
Protocol Summary:
- Isolate mitochondria from target cells or use permeabilized cells
- Incubate with synthetic BH3 peptides (e.g., BIM, BAD, NOXA, HRK) at standardized concentrations
- Quantify cytochrome c release via ELISA, Western blotting, or flow cytometry
- Analyze response patterns to determine dependence on specific anti-apoptotic proteins
The assay interpretation follows these principles:
- Response to BIM peptide indicates overall apoptotic priming
- Selective response to BAD peptide suggests BCL-2/BCL-XL/BCL-w dependence
- Selective response to NOXA peptide indicates MCL-1 dependence
- Response to HRK peptide suggests BCL-XL specificity [12]
BH3 profiling has emerged as a powerful predictive biomarker for sensitivity to BH3-mimetic drugs and conventional chemotherapy.
Structural Biology Approaches
Nuclear Magnetic Resonance (NMR) Spectroscopy and X-ray Crystallography have been instrumental in characterizing BCL-2 family interactions and guiding drug development [9].
NMR-based Screening Protocol for BH3-mimetic Discovery:
- Express and purify recombinant BCL-2 family proteins with proper folding
- Screen fragment libraries using chemical shift perturbation monitoring
- Identify proximal binding fragments using structure-activity relationship (SAR) by NMR
- Link fragments to develop high-affinity ligands using structure-based design
- Validate binding through isothermal titration calorimetry (ITC) and surface plasmon resonance (SPR)
This approach successfully generated the first specific BCL-2 inhibitor, ABT-737, and its clinical derivatives [9].
Mitochondrial Functional Assays
Cytochrome c Release Assay Protocol:
- Isolate intact mitochondria from cells or tissues
- Treat with recombinant BH3-only proteins or activators (e.g., tBID)
- Separate mitochondrial and supernatant fractions by centrifugation
- Detect cytochrome c in fractions by immunoblotting or ELISA
- Quantify and normalize release percentages
BAX/BAK Oligomerization Assessment:
- Treat cells with apoptotic stimuli or isolate mitochondria
- Apply cross-linking reagent (e.g., BS3)
- Separate proteins by SDS-PAGE under non-reducing conditions
- Detect BAX/BAK oligomers by immunoblotting
Research Reagent Solutions
Table 3: Essential Research Tools for BCL-2 Family and Apoptosis Research
| Reagent Category | Specific Examples | Research Application | Key Features/Considerations |
|---|---|---|---|
| BH3-mimetic Compounds | Venetoclax (ABT-199), Navitoclax (ABT-263), A-1331852 (BCL-XL), S63845 (MCL-1) | Functional inhibition of anti-apoptotic proteins | Varying selectivity profiles; consider thrombocytopenia risk with BCL-XL inhibitors |
| Recombinant BH3 Peptides | BIM, BAD, NOXA, MS1, HRK peptides | BH3 profiling, in vitro binding studies | Varying lengths and modifications affect permeability and stability |
| Antibodies for Detection | Phospho-specific BCL-2, Active Conformation BAX/BAK, MCL-1, BCL-XL | Immunoblotting, immunohistochemistry, flow cytometry | Conformation-specific antibodies distinguish inactive vs active states |
| Cell Line Models | OCI-Ly1 (BCL-2-dependent), H146 (MCL-1-dependent), MV4;11 (venetoclax-sensitive) | In vitro drug testing, mechanism studies | Verify BCL-2 family protein expression profiles and dependencies |
| Transgenic Mouse Models | Eμ-Myc, VavP-BCL-2, MCL-1 transgenic, BIM knockout | In vivo therapeutic efficacy, toxicity studies | Tissue-specific expression patterns affect utility for different cancer types |
Therapeutic Translation: BH3-mimetics in Cancer Treatment
The mechanistic understanding of BCL-2 family interactions has enabled the rational development of BH3-mimetic drugs that occupy the BH3-binding groove of anti-apoptotic proteins, thereby neutralizing their pro-survival function [9] [13]. Venetoclax (ABT-199), the first FDA-approved selective BCL-2 inhibitor, demonstrates remarkable efficacy in hematologic malignancies, particularly chronic lymphocytic leukemia (CLL) and acute myeloid leukemia (AML) [9] [13]. Its development illustrates the successful translation of structural biology and mechanistic insights into clinical therapy.
Following venetoclax's success, several next-generation BCL-2 inhibitors such as sonrotoclax and lisaftoclax are undergoing clinical evaluation, both as monotherapies and in rational combination regimens [9]. However, targeting other anti-apoptotic family members has proven more challenging—BCL-XL inhibition causes dose-limiting thrombocytopenia due to BCL-XL's essential role in platelet survival, while MCL-1 inhibitors have encountered cardiac toxicity concerns [9]. Novel approaches including PROTACs (proteolysis targeting chimeras) and antibody-drug conjugates are being explored to achieve tumor-specific targeting of these challenging targets [9].
The BCL-2 protein family represents a master regulatory network controlling the mitochondrial apoptosis pathway through complex interactions between pro- and anti-apoptotic members. The precise balance of these opposing forces determines cellular fate in response to stress signals. Significant progress has been made in understanding the structural basis of these interactions, leading to the revolutionary development of BH3-mimetic therapeutics.
Despite these advances, important challenges remain. The development of BH3-mimetics against BCL-XL and MCL-1 has been hampered by on-target toxicities, necessitating innovative targeting strategies. Furthermore, resistance mechanisms including mutations in the BCL-2 BH3-binding groove (e.g., F104L, F104C) have emerged clinically, underscoring the need for next-generation compounds that can overcome resistance [13]. Future research directions should include deeper investigation of non-canonical BCL-2 family functions, dynamic regulation of protein interactions in cellular microenvironments, and rational combination strategies that maximize therapeutic efficacy while minimizing toxicity.
The continued elucidation of BCL-2 family regulation at mitochondrial membranes not only advances fundamental understanding of cellular life-death decisions but also promises to yield transformative cancer therapies with broader clinical applicability across diverse disease contexts.
The intrinsic apoptotic pathway is a mitochondria-dependent process crucial for developmental biology, immune function, and tissue homeostasis. Its dysregulation is a hallmark of various diseases, most notably cancer [15]. Central to this pathway are two critical mitochondrial membrane remodeling events: cristae reorganization within the inner mitochondrial membrane (IMM) and mitochondrial outer membrane permeabilization (MOMP). These structural changes ensure the efficient release of cytochrome c and other pro-apoptotic factors from the mitochondrial intermembrane space into the cytosol, triggering caspase activation and the commitment to cell death [15] [16]. This whitepaper provides an in-depth technical guide to the molecular mechanisms, experimental methodologies, and functional significance of these coordinated remodeling processes, framed within the context of cytochrome c release research.
The mitochondrial inner membrane possesses a complex ultrastructure, characterized by invaginations known as cristae. These are not static folds but dynamic bioenergetic compartments that define specific submitochondrial spaces [17] [18]. The cristae membranes are connected to the inner boundary membrane (IBM) via narrow, circular-to-slit-shaped openings called cristae junctions (CJs) [18]. This intricate architecture is functionally segregated; the cristae membranes are highly enriched with respiratory chain complexes and supercomplexes for oxidative phosphorylation, while the IBM contains machinery for mitochondrial protein import [18]. This compartmentalization is vital for mitochondrial metabolism and becomes a key regulatory point during apoptosis.
Molecular Mechanisms of Cristae Remodeling
Cristae remodeling during apoptosis involves a dramatic structural change that opens up the cristae junctions and flattens the cristae folds. This process is essential for mobilizing the cytochrome c pool that is concentrated within the cristae lumen, making it available for release through MOMP [19].
Key Regulators of Cristae Architecture
The following table summarizes the core protein complexes and lipids that regulate cristae ultrastructure and their roles in remodeling.
Table 1: Key Molecular Regulators of Cristae Architecture
| Regulator | Localization | Primary Function in Cristae Integrity | Role in Cristae Remodeling |
|---|---|---|---|
| OPA1 | Cristae Junctions | Maintains CJ tightness via interactions between long and short forms; tethers cristae membranes [17] [18]. | Cleaved by the protease OMA1 upon BAK activation; cleavage disrupts tethering, opening CJs and facilitating cytochrome c release [19]. |
| MICOS Complex | Cristae Junctions | Scaffolds CJs and establishes contact sites between the inner and outer membranes [17] [18]. | Dysregulation leads to aberrant CJ and cristae morphology, compromising respiratory function [17]. |
| F₁Fₒ-ATP Synthase | Cristae Membranes | Dimerizes and oligomerizes to shape the high-curvature ridges of cristae tips [17]. | Dissociation of oligomers can lead to cristae destabilization, though its precise role in apoptotic remodeling is an active research area [17]. |
| Cardiolipin | Inner Membrane (Cristae) | A cone-shaped phospholipid that stabilizes membrane curvature and is required for the function of many cristae-resident proteins [17] [18]. | Interacts with and promotes the pore-forming activity of BAX/BAK at the outer membrane; its redistribution may facilitate inner membrane remodeling [18]. |
Sequence of Remodeling Events
The process of cristae reorganization is a tightly controlled cascade:
- Initiation: Apoptotic stimuli, conveyed by BH3-only proteins, lead to the activation of BAK and BAX at the outer membrane.
- OMA1 Activation: Conformational changes in BAK associated with early MOMP activation trigger the metalloprotease OMA1 [19].
- OPA1 Cleavage: Activated OMA1 cleaves the long isoforms of OPA1, disrupting the balanced L-OPA1/S-OPA1 interactions that are required to maintain the narrow diameter of the cristae junctions [19].
- Junction Opening and Cristae Widening: The cleavage of OPA1 results in the remodeling of the cristae, causing the opening of the CJs and the fusion of cristae compartments [19]. This "opening" of the cristae invaginations releases the highly concentrated protons from the cristae lumen, which can be detected as a local acidification event [19].
- Cytochrome c Mobilization: The restructuring of the cristae lumen allows the vast majority of cytochrome c, previously sequestered within the cristae, to diffuse into the intermembrane space, making it accessible for release through pores in the outer membrane [19] [18].
Molecular Mechanisms of Outer Membrane Permeabilization (MOMP)
MOMP is a point-of-no-return in the intrinsic apoptotic pathway, leading to the irreversible release of cytochrome c and other pro-apoptotic factors from the intermembrane space into the cytosol [15]. The Bcl-2 protein family acts as the central regulator of this process.
The Bcl-2 Protein Family Network
The approximately 20 members of the Bcl-2 family are categorized into three functional groups based on their structure and role in apoptosis:
- Effector Proteins (Pro-apoptotic): Bax and Bak are the essential executioners of MOMP. In healthy cells, they are maintained in an inactive state. Upon activation, they homo- and/or hetero-oligomerize to form proteolipidic pores in the mitochondrial outer membrane (MOM) [15].
- BH3-only Proteins (Pro-apoptotic): Members like Bid, Bim, Puma, Bad, and Noxa act as sensors of cellular stress and damage. They initiate apoptosis by either neutralizing pro-survival proteins or directly activating Bax/Bak [15].
- Anti-apoptotic Proteins (Pro-survival): This group, including Bcl-2, Bcl-xL, and Mcl-1, preserves MOM integrity by binding to and inhibiting the pro-apoptotic members, either the activators or the effectors themselves [15].
Several models have been proposed to explain the intricate interplay between these proteins, including the "direct activation model," the "neutralization/indirect activation model," and the more recent "embedded together" and "unified" models, which emphasize the importance of the membrane environment for these interactions [15].
Bax/Bak Activation and Pore Formation
The activation of Bax and Bak is a multi-step process:
- Activation: In healthy cells, Bax is largely cytosolic and constitutively shuttles to the MOM, while Bak is integrated into the MOM. Both are kept in check by pro-survival proteins. Apoptotic signals, via "direct activator" BH3-only proteins (e.g., truncated Bid, Bim), induce conformational changes in Bax/Bak. For Bax, this involves the exposure of its C-terminal transmembrane domain, allowing its insertion into the MOM [15].
- Oligomerization: Activated Bax and Bak form homodimers, which then assemble into higher-order oligomers. Cryo-electron microscopy studies have revealed that these Bax oligomers can form arc-like and ring-shaped structures that perforate the lipid bilayer [15] [16].
- Pore Formation: The prevailing model suggests that these oligomers act as proteolipidic pores—structures composed of both protein and lipid—that permeabilize the MOM, allowing the efflux of soluble proteins like cytochrome c [15] [16]. The exact mechanism of permeabilization, whether purely proteinaceous or through induction of membrane stress, is still under investigation.
The diagram below illustrates the core signaling pathway of MOMP and Cristae Remodeling.
Experimental Methodologies and Quantitative Analysis
Studying these membrane remodeling events requires a combination of biochemical, biophysical, and imaging techniques. The following section details key experimental protocols and the quantitative data they yield.
Protocol: Graphene-Based Sensing of Cristae Remodeling
A innovative method for detecting cristae remodeling in real-time utilizes graphene-based pH sensors [19].
Objective: To simultaneously monitor extra-mitochondrial acidification (a consequence of cristae opening) and inner membrane potential (ΔΨm) during MOMP.
Workflow:
- Device Fabrication: Single-layer graphene is transferred onto a glass slide.
- Surface Functionalization: The graphene is coated with 1-pyrenebutanoic acid succinimidyl ester (pyrene-NHS), which binds via π-π interactions. Anti-TOM20 antibodies are then covalently linked to the NHS terminal, creating a surface for specific mitochondrial tethering.
- Mitochondrial Immobilization: Isolated mitochondria (e.g., from HeLa cells) are incubated on the functionalized device, where they bind to the anti-TOM20 antibodies. The density achieved is ~4,237 mitochondria/mm².
- Concurrent Measurement:
- pH Sensing: Changes in the conductance of the graphene layer directly correlate with the pH of the immediate surrounding medium. A drop in pH increases conductance.
- ΔΨm Monitoring: The potentiometric fluorescent dye TMRE (Tetramethylrhodamine ethyl ester) is used. A decrease in TMRE fluorescence indicates depolarization of the inner membrane.
Key Findings: Using this system, researchers demonstrated that MOMP induced by tBid/BIM is accompanied by a gradual drop in extra-mitochondrial pH (detected as a ~13% increase in graphene conductance) and a concurrent decline in membrane potential (69% reduction in TMRE intensity). Both events were rescued by adding exogenous cytochrome c, linking them directly to cristae remodeling [19].
Protocol: In Vitro Reconstitution of MOMP and Cryo-EM Visualization
To directly visualize Bax pores, a reductionist approach using in vitro vesicle systems has been highly successful [16].
Objective: To form and characterize Bax-induced pores in membrane vesicles that mimic the mitochondrial outer membrane.
Workflow:
- Vesicle Preparation: Two types of vesicles are used:
- Outer Mitochondrial Membrane Vesicles (OMVs): Isolated from purified mitochondria, preserving native lipid and protein composition.
- Liposomes: Synthesized with defined lipid compositions, often including cardiolipin to mimic the MOM.
- MOMP Reconstitution: Recombinant, activated Bax protein is incubated with the vesicles in the presence of caspase-8-cleaved Bid (tBid).
- Content Release Assay: Vesicles are pre-loaded with fluorescent dextrans of varying sizes. MOMP is quantified by measuring the release of these dextrans, which indicates the size of the pores formed.
- Structural Analysis via Cryo-EM: The vesicle-Bax mixtures are flash-frozen in vitreous ice and imaged using cryo-electron microscopy. This allows for the direct visualization of pores and the oligomeric Bax structures lining the pore edges without staining or dehydration artifacts.
Key Findings: This methodology revealed that Bax forms pores of variable sizes, large enough to release 2,000 kDa dextrans (extrapolated to ~54 nm). Bax oligomers were seen to line the edges of these proteolipidic pores, consistent with a model where Bax proteins deform the membrane to create a proteolipidic pore [16].
The experimental workflow for this approach is summarized in the following diagram.
Quantitative Data from MOMP and Remodeling Studies
The following table consolidates key quantitative findings from the research cited in this paper.
Table 2: Quantitative Experimental Data from Membrane Remodeling Studies
| Experimental Readout | System / Inducer | Measured Change | Biological Significance |
|---|---|---|---|
| Extra-mitochondrial pH [19] | Isolated Mitochondria / tBid, BIM | 13% ± 8% increase in graphene conductance (indicating acidification) | Direct evidence of proton release from cristae lumen during OPA1-dependent remodeling. |
| Inner Membrane Potential (ΔΨm) [19] | Isolated Mitochondria / tBid, BIM | 69% ± 7% reduction in TMRE fluorescence | Correlates cristae remodeling with bioenergetic collapse. |
| Bax Pore Size [16] | OMVs / Bax + tBid | Release of ~54 nm (2,000 kDa) dextran | Demonstrates formation of large, non-specific pores sufficient for cytochrome c (12.4 kDa) release. |
| Mitochondrial Tethering Density [19] | Graphene Sensor / Anti-TOM20 | ~4,237 mitochondria/mm² (HeLa) | Quantifies the sensitivity of the graphene-based assay, requiring minimal biological material. |
The Scientist's Toolkit: Key Research Reagents
The following table lists essential reagents and tools used in the featured experiments, providing a resource for researchers seeking to implement these protocols.
Table 3: Essential Research Reagents for Studying Membrane Remodeling
| Reagent / Tool | Function / Target | Experimental Application |
|---|---|---|
| tBid / BIM SAHB | Direct activator BH3-only proteins | To induce Bax/Bak activation and trigger MOMP and OMA1/OPA1-dependent cristae remodeling in vitro and in vivo [15] [19]. |
| TMRE | Potentiometric fluorescent dye | To monitor mitochondrial inner membrane potential (ΔΨm) qualitatively via fluorescence microscopy [19]. |
| CCCP | Proton ionophore (uncoupler) | A control reagent to completely collapse the proton motive force and depolarize mitochondria [19]. |
| Anti-TOM20 Antibody | Subunit of the Translocase of the Outer Membrane | To specifically tether intact mitochondria to solid supports (e.g., graphene sensors) for single-organelle analysis [19]. |
| Recombinant Bax Protein | Pro-apoptotic effector protein | For in vitro reconstitution of MOMP in OMVs or liposomes to study pore formation mechanisms [16]. |
| Cryo-Electron Microscopy | High-resolution structural biology technique | To visualize membrane pores and protein oligomers in a near-native, hydrated state without staining [16]. |
| Outer Membrane Vesicles (OMVs) | Native MOM mimics | As a physiologically relevant target membrane for in vitro MOMP assays, containing natural lipid and protein composition [16]. |
The coordinated remodeling of the mitochondrial inner and outer membranes is a critical event in the intrinsic pathway of apoptosis. Cristae reorganization, driven by the OMA1-OPA1 axis, mobilizes cytochrome c, while MOMP, executed by Bax/Bak oligomers, enables its release into the cytosol to trigger caspase activation [15] [19]. The experimental approaches detailed herein—from sensitive graphene-based biosensors to in vitro reconstitution and cryo-EM—provide powerful methodologies to dissect these complex processes at molecular and structural levels.
Future research will continue to elucidate the precise molecular mechanisms of Bax/Bak pore formation and the detailed structural changes within the cristae. The quantitative data and protocols presented in this whitepaper serve as a foundation for such investigations, with significant implications for drug discovery. Targeting specific steps in membrane remodeling, such as using BH3 mimetics to directly activate Bax/Bak in cancer cells or developing inhibitors to prevent pathological MOMP in neurodegenerative diseases, represents a promising therapeutic frontier [17] [15] [16]. A deep understanding of these mitochondrial "death signals" will undoubtedly continue to inform novel strategies for treating a wide range of human diseases.
The apoptosome is a quintessential signaling platform in the intrinsic apoptotic pathway, acting as the critical link between mitochondrial stress and the execution of programmed cell death. This large, multi-protein complex forms in the cytosol in response to the release of cytochrome c from mitochondria, serving as the activation hub for the initiator caspase-9 [20]. The proper regulation of this process is vital for cellular homeostasis, with an estimated 100 billion cells undergoing apoptosis daily in an adult human [21]. Dysregulation of apoptosome formation or function can lead to pathological conditions, including cancer and neurodegenerative disorders, making it a significant focus for therapeutic development [22] [9]. This whitepaper provides an in-depth technical examination of the apoptosome complex, detailing its composition, assembly mechanism, structural characteristics, and the precise molecular events leading to caspase-9 activation, framed within the broader context of mitochondrial cytochrome c release research.
Molecular Architecture and Assembly
Core Components and Stoichiometry
The mammalian apoptosome is a wheel-shaped complex of approximately 1.1-1.3 MDa with heptameric symmetry [21] [20]. Its assembly requires three core components: Apoptotic Protease-Activating Factor 1 (Apaf-1), cytochrome c, and a nucleotide (dATP/ATP) [20] [23]. The table below summarizes the key structural components of the human apoptosome.
Table 1: Core Structural Components of the Human Apoptosome
| Component | Structure/Domains | Function in Assembly | Stoichiometry per Complex |
|---|---|---|---|
| Apaf-1 | CARD, NOD (NBD, HD1, WHD), HD2, WD40 repeats (2 β-propellers) | Scaffold protein; oligomerizes to form platform | 7 subunits [20] |
| Cytochrome c | Heme protein | Binds Apaf-1 WD40 domain; relieves autoinhibition | 7 molecules [20] |
| Nucleotide | dATP/ATP | Binds NBD; enables oligomerization | 7 molecules [20] [23] |
| Procaspase-9 | CARD, Protease Domain (p20, p10) | Initiator caspase; activated on complex | 3-4 molecules [20] [23] |
Structural Domains of Apaf-1
Apaf-1, the scaffold protein of approximately 140 kDa, contains three major regions that are critical for its function [20]:
- Caspase Recruitment Domain (CARD): Located at the N-terminus, this domain mediates homotypic interactions with the CARD of procaspase-9, recruiting the zymogen to the apoptosome [20] [23].
- Nucleotide-Binding and Oligomerization Domain (NOD): This central region, also referred to as the NB-ARC domain, includes a nucleotide-binding domain (NBD), helical domain 1 (HD1), and a winged-helix domain (WHD). It belongs to the AAA+ ATPase family and facilitates the oligomerization of Apaf-1 [20] [23].
- WD40 Repeat Region: The C-terminal portion consists of 15 WD40 repeats that fold into two β-propeller domains. This region maintains Apaf-1 in an autoinhibited state in the absence of cytochrome c. The binding of cytochrome c to the cleft between the two propellers is the key event that triggers apoptosome assembly [20].
The Assembly Process
The assembly of the apoptosome is a multi-step process initiated by intracellular stress signals that trigger mitochondrial outer membrane permeabilization (MOMP) and the release of cytochrome c into the cytosol [22] [24] [9].
- Activation Signal: MOMP, regulated by the BCL-2 protein family, leads to the efflux of cytochrome c from the mitochondrial intermembrane space [24] [9].
- Conformational Change in Apaf-1: Cytosolic cytochrome c binds to the WD40 domain of monomeric, autoinhibited Apaf-1 (which is bound to ADP/dADP). This binding, coupled with nucleotide exchange to dATP/ATP, induces a profound conformational change, rendering Apaf-1 "assembly-competent" by extending its structure [20] [23].
- Oligomerization: The extended Apaf-1 monomers oligomerize through their NOD domains, forming a symmetric, wheel-like complex with a central hub and seven protruding spokes. The CARD domains remain flexibly tethered above this platform [20].
- Recruitment of Procaspase-9: The Apaf-1 CARDs interact with the CARDs of procaspase-9. Structural studies indicate that these CARDs form an acentric, disk-like spiral atop the platform, recruiting an estimated three to four procaspase-9 molecules per apoptosome [20] [23].
The following diagram illustrates this assembly pathway and the subsequent activation of caspase-9.
Diagram 1: Apoptosome Assembly and Caspase-9 Activation Pathway. The process begins with mitochondrial cytochrome c release and culminates in substrate-induced caspase-9 dimerization and apoptosis execution.
Mechanism of Caspase-9 Activation
The activation of caspase-9 on the apoptosome represents a critical regulatory node in the intrinsic apoptotic pathway. Recent research has challenged earlier models and provided a more nuanced understanding of this process.
From Induced Proximity to Substrate-Induced Dimerization
The traditional "induced proximity" model suggested that merely bringing multiple procaspase-9 molecules together on the apoptosome scaffold was sufficient for their activation [25]. However, recent NMR spectroscopy and biochemical studies have revealed a more complex mechanism termed substrate-induced dimerization [21].
Key findings from this 2023 research include:
- Weak Basal Dimerization: In the absence of both the apoptosome and substrate, caspase-9 and its protease domain (PD) are predominantly monomeric in solution, with very weak dimerization constants in the millimolar range [21].
- Scaffold-Primed Monomers: Upon recruitment to the apoptosome, the caspase-9 PDs remain monomeric and are flexibly tethered to the central platform. The apoptosome does not directly induce dimerization but organizes the PDs to increase their local concentration [21].
- Substrate as a Critical Trigger: The presence of a peptide substrate is the essential trigger for rapid and extensive dimerization of the caspase-9 PDs on the apoptosome scaffold. This finding establishes an important additional layer of regulation, ensuring caspase-9 is only fully activated when substrate is available to be processed [21].
Dimerization Interfaces and Activation States
Activation of procaspase-9 on the apoptosome involves two primary types of dimeric interactions that enhance catalytic activity [20] [23]:
- Homodimerization: Procaspase-9 molecules form active homodimers with each other on the platform. The catalytic activity is dependent on this dimer interface.
- Heterodimerization: Procaspase-9 can also form heterodimers with Apaf-1 subunits via a specific motif (GCFNF406) in its protease domain.
Once activated, caspase-9 cleaves and activates downstream effector caspases, primarily caspase-3 and caspase-7, which then execute the apoptotic program by degrading critical cellular proteins [21] [26]. The apoptosome thus functions as a proteolytic activation cascade amplifier.
Experimental Analysis of the Apoptosome
Key Experimental Methodologies
The study of the apoptosome requires sophisticated biophysical and biochemical techniques due to its large size and complex nature. The table below summarizes key quantitative data and observations from foundational experiments.
Table 2: Key Experimental Data on Apoptosome Structure and Function
| Parameter | Experimental Value | Method Used | Reference / Context |
|---|---|---|---|
| Molecular Weight | ~1.1 - 1.3 MDa | Cryo-EM, SEC-MALS | [21] [20] |
| Symmetry | Heptameric (7-fold) | Cryo-EM | [20] |
| Apaf-1 : Caspase-9 Stoichiometry | 7 : 3-4 (CARD disk) | High-resolution Cryo-EM | [20] [23] |
| Caspase-9 Dimerization Constant (Kd) | Millimolar range (monomeric in solution) | SEC-MALS, NMR | [21] |
| Critical Assembly Components | Apaf-1, Cytochrome c, dATP/ATP | In vitro reconstitution | [20] [23] |
| Caspase-9 Activation Trigger | Substrate-induced dimerization on apoptosome | Methyl-TROSY NMR, Activity Assays | [21] |
The following are detailed protocols for central methodologies used in apoptosome research:
Protocol 1: Reconstitution of the Apoptosome In Vitro
- Purification: Express and purify full-length Apaf-1, procaspase-9, and cytochrome c from suitable expression systems (e.g., insect or bacterial cells).
- Assembly Reaction: Combine Apaf-1 (1-2 µM) with a 2-fold molar excess of cytochrome c in assembly buffer (20 mM HEPES pH 7.5, 150 mM KCl, 5 mM MgCl2).
- Nucleotide Addition: Add 1 mM dATP or ATP to the mixture to initiate oligomerization.
- Incubation: Incubate the reaction at 30°C for 60-90 minutes.
- Validation: Analyze successful assembly via size-exclusion chromatography (SEC) coupled with multi-angle light scattering (SEC-MALS) to confirm the formation of a complex >1 MDa [21] [20].
Protocol 2: Analyzing Caspase-9 Activation via NMR Spectroscopy
- Isotope Labeling: Produce caspase-9 or its protease domain with specific isotope labeling (e.g., ^2H, ^13CH3-Ile, Leu, Val) for NMR studies.
- Apoptosome Formation: Reconstitute the apoptosome as in Protocol 1 using isotope-labeled caspase-9.
- NMR Data Acquisition: Acquire ^1H-^13C methyl-TROSY NMR spectra of the labeled caspase-9 within the large apoptosome complex (up to 1.3 MDa) at high magnetic field strength (≥ 600 MHz).
- Substrate Titration: Titrate a caspase-9 substrate or irreversible inhibitor (e.g., Z-LEHD-fmk) into the sample while monitoring changes in NMR spectra.
- Data Interpretation: Spectral changes, such as line broadening or chemical shift perturbations, upon substrate addition indicate dimerization and activation of the caspase-9 protease domains, even within the massive complex [21].
The Scientist's Toolkit: Essential Research Reagents
Table 3: Key Reagents for Apoptosome and Caspase-9 Research
| Reagent / Tool | Function / Target | Key Utility in Research |
|---|---|---|
| Recombinant Apaf-1 | Full-length scaffold protein | In vitro reconstitution of the apoptosome for structural and functional studies [20] [23]. |
| Cytochrome c | Apaf-1 WD40 domain | Essential trigger for apoptosome assembly; used in reconstitution experiments [20]. |
| dATP/ATP | Apaf-1 NBD domain | Nucleotide cofactor required for oligomerization and complex stability [20] [23]. |
| Z-LEHD-fmk | Caspase-9 active site (Cys287) | Irreversible, cell-permeable inhibitor; traps caspase-9 in an active conformation for structural studies [21]. |
| Q-VD-OPh | Pan-caspase inhibitor | Broad-spectrum caspase inhibitor; used to dissect caspase-dependent and independent aspects of apoptosis [24]. |
| ABT-737 / ABT-263 (Navitoclax) | BCL-2/BCL-XL | BH3-mimetics that induce MOMP and cytochrome c release, triggering intrinsic apoptosis and apoptosome formation [9]. |
| Staurosporine | Broad kinase inhibitor | Commonly used experimental agent to induce intrinsic apoptosis and activate the apoptosome pathway [24]. |
| Antibodies (Anti-Apaf-1, Anti-Cytochrome c, Anti-Caspase-9) | Specific protein targets | Used for Western blot, immunofluorescence, and immunoprecipitation to detect complex formation and subcellular localization (e.g., cytochrome c release) [24]. |
Beyond the Mammalian System: Evolutionary Perspectives
Apoptosome complexes are evolutionarily conserved, though with significant variations. Comparative analysis of model organisms provides insights into the core and adaptable features of this machinery.
- C. elegans (CED-4 Apoptosome): The C. elegans apoptosome, composed of eight CED-4 subunits, is smaller and structurally distinct. It lacks WD40 domains and is regulated not by cytochrome c but by direct binding to the CED-9 (Bcl-2 homolog) protein, which is displaced by the BH3-only protein EGL-1 to initiate assembly [23].
- D. melanogaster (Dark Apoptosome): The Drosophila apoptosome (Dark) forms an octameric ring and recruits eight Dronc (caspase-9 homolog) molecules. While it contains WD40 β-propeller domains, these do not bind cytochrome c, indicating a cytochrome c-independent assembly mechanism in flies [23].
These differences underscore that while the fundamental principle of a CED-4/Apaf-1 scaffold for initiator caspase activation is conserved, the regulatory inputs, particularly the role of cytochrome c, have diverged through evolution [23].
Therapeutic Implications and Future Directions
The apoptosome, as the central executioner of intrinsic apoptosis, represents a promising yet challenging therapeutic target. In cancer, evasion of apoptosis is a hallmark, and mutations impairing apoptosome function (e.g., in Apaf-1 or caspase-9) or the overexpression of inhibitory proteins like XIAP are common [21] [22]. Therapeutic strategies aim to either restore or bypass defective apoptosome signaling.
- BH3 Mimetics: Drugs like venetoclax (ABT-199) target and inhibit anti-apoptotic BCL-2 proteins, promoting MOMP and cytochrome c release, thereby triggering apoptosome formation in cancer cells [9].
- IAP Antagonists: SMAC mimetics are designed to block XIAP, which normally suppresses caspase-9 and effector caspases, thereby potentiating apoptosis once the apoptosome is activated [22].
- Direct Targeting: Future efforts may focus on developing small molecules that directly stabilize the active conformation of the apoptosome or facilitate procaspase-9 dimerization in cells with suboptimal activation.
Recent discoveries, such as the role of the tumor suppressor LACTB in promoting inner mitochondrial membrane remodeling to facilitate cytochrome c release during apoptosis, open new avenues for understanding the upstream regulation of the apoptosome [24]. Furthermore, the revised model of substrate-induced dimerization of caspase-9 [21] necessitates a re-evaluation of drug discovery screens, which should now consider the primed, monomeric state on the apoptosome as a relevant therapeutic target.
The apoptosome is a sophisticated molecular machine that converts a mitochondrial stress signal—the release of cytochrome c—into the proteolytic cascade of apoptosis. Its heptameric structure, governed by Apaf-1, provides a dynamic platform that primes caspase-9 for activation through a finely-tuned, substrate-induced dimerization mechanism. Ongoing research continues to elucidate the intricate details of its assembly, regulation, and interplay with other cell death pathways. As part of the broader landscape of mitochondrial cytochrome c release research, a deep understanding of the apoptosome complex is fundamental to developing novel therapeutic agents for cancer and other diseases characterized by apoptotic dysregulation.
The mitochondrial pathway of intrinsic apoptosis is critically governed by the regulated release of cytochrome c from the mitochondrial intermembrane space into the cytosol, where it initiates caspase activation. While outer mitochondrial membrane permeabilization by BAX/BAK pores is a established key event, the precise regulation of inner mitochondrial membrane (IMM) dynamics and nuclear-mitochondrial communication remain active research frontiers. This whitepaper examines two emerging regulatory mechanisms: LACTB-mediated IMM remodeling and Nur77 translocation from the nucleus to mitochondria. We synthesize recent structural and functional insights into LACTB, a filament-forming serine protease tumor suppressor that directly remodels the cristae architecture to facilitate cytochrome c release. Complementary to this, we analyze the stress-induced translocation of orphan nuclear receptor Nur77 to mitochondria, where it interacts with Bcl-2 to convert it from an anti-apoptotic to pro-apoptotic factor. This technical guide provides researchers with comprehensive experimental datasets, methodological protocols, and visual schematics to advance therapeutic targeting of these pathways in cancer and degenerative diseases.
The intrinsic apoptosis pathway represents a critical mechanism for maintaining cellular homeostasis and eliminating damaged or potentially harmful cells. Central to this pathway is the release of cytochrome c from mitochondria, which serves as an irreversible commitment point to programmed cell death. In healthy cells, cytochrome c functions as an electron shuttle in the respiratory chain, localized within the mitochondrial intermembrane and intercristae spaces where it interacts electrostatically with cardiolipin [5] [27]. Following apoptotic stimuli, cytochrome c translocates to the cytosol where it facilitates the allosteric activation of apoptosis-protease activating factor 1 (Apaf-1), leading to the formation of the apoptosome and subsequent activation of caspase-9 and caspase-3 [5].
While mitochondrial outer membrane permeabilization (MOMP) mediated by BCL-2 family proteins (particularly BAX and BAK) has been extensively characterized, the role of inner mitochondrial membrane (IMM) remodeling in facilitating the complete release of cytochrome c remains less understood [24]. Approximately 85% of cytochrome c is sequestered within cristae folds, requiring substantial reorganization of the IMM architecture for its mobilization and release [24]. This whitepaper focuses on two emerging regulators of this process: LACTB, which directly mediates IMM remodeling, and Nur77, which translocates from the nucleus to mitochondria following stress signals. Understanding these mechanisms provides new insights for therapeutic interventions in diseases characterized by dysregulated apoptosis, particularly cancer and neurodegenerative conditions.
LACTB: A Structural and Functional Profile
LACTB (serine beta-lactamase-like protein) is a conserved mammalian serine protease localized to the mitochondrial intermembrane space (IMS) that has emerged as a significant tumor suppressor across multiple cancer types [24] [28]. Structurally, LACTB shares sequence similarity with the penicillin-binding protein and β-lactamase (PBP-βL) family and contains a conserved catalytic serine residue within the 164SXXK167 motif that is essential for its enzymatic activity [28] [29]. Unlike its prokaryotic homologs, human LACTB is expressed with an N-terminal mitochondrial targeting sequence and uniquely assembles into filamentous polymers extending several hundred nanometers within the IMS [28] [29].
Recent cryo-electron microscopy (cryoEM) structural analysis has revealed that LACTB polymerization is essential for its catalytic activity, with filament-forming interface mutations significantly reducing enzymatic function [28] [29]. These filaments demonstrate direct lipid membrane binding capacity, particularly to cardiolipin-enriched membranes, suggesting a mechanism for their influence on mitochondrial membrane architecture [28]. LACTB expression is significantly downregulated in various cancers through promoter methylation, histone deacetylation, and microRNA-mediated mechanisms, with this downregulation frequently correlating with poor prognosis [29].
Table 1: Experimental Evidence for LACTB in Apoptosis Regulation
| Experimental Approach | Key Findings | Cellular Context | Citation |
|---|---|---|---|
| LACTB Knockdown (KD) | Reduced cytochrome c release and apoptosis; Increased cell viability upon staurosporine treatment | HeLa cells, B16-F10 cells | [24] |
| LACTB Overexpression (OE) | Enhanced cytochrome c release and apoptosis acceleration | HeLa cells | [24] |
| Immunofluorescence & Airyscan Microscopy | Localization to IMM with enrichment in cristae; Colocalization with ATP synthase β subunit | HeLa cells stably overexpressing LACTB | [24] |
| In Vitro Membrane Remodeling Assay | Purified LACTB binds and remodels cardiolipin-enriched membrane nanotubes | Reconstituted lipid systems | [24] |
| CryoEM Structural Analysis | Filament formation essential for catalytic activity; Membrane binding capacity | Purified human LACTB protein | [28] [29] |
LACTB-Mediated Inner Mitochondrial Membrane Remodeling
Mechanism of Action
LACTB promotes apoptosis through a novel mechanism involving direct structural remodeling of the inner mitochondrial membrane. During apoptosis induction, LACTB is required for mitochondrial remodeling that facilitates the efficient release of cytochrome c and other pro-apoptotic factors including SMAC/Diablo, AIF, and HTRA2/Omi [24]. This function is specific to apoptosis-associated remodeling, as LACTB knockdown does not affect mitochondrial shape changes induced by CCCP treatment, which uncouples oxidative phosphorylation through different mechanisms [24].
The mechanism proceeds independently of both BAX/BAK pore formation and OPA1 processing, indicating that LACTB represents a distinct pathway in apoptotic signaling [24]. Structural studies indicate that LACTB filaments preferentially bind to and remodel cardiolipin-enriched membrane nanotubes over planar lipid membranes, suggesting a specific affinity for curved membrane structures characteristic of cristae junctions [24]. This remodeling activity facilitates the reorganization of cristae architecture, mobilizing cytochrome c from its electrostatic binding to cardiolipin on the IMM and enabling its release through BAX/BAK pores in the outer membrane [24] [5].
Experimental Evidence and Methodologies
Key evidence for LACTB's role in apoptosis comes from loss-of-function and gain-of-function studies. LACTB knockdown using RNA interference techniques resulted in significantly reduced cytochrome c release and delayed apoptosis upon treatment with staurosporine or ABT-737/S63845 (ABT-S), a combination that activates BAX pores [24]. Conversely, LACTB overexpression enhanced cytochrome c release and accelerated apoptosis, even in the presence of caspase inhibitors, indicating that its function is upstream of caspase activation [24].
Methodologically, these findings were established through multiple complementary approaches. Differential centrifugation assays quantified cytochrome c redistribution from mitochondrial to cytosolic fractions following apoptotic stimuli [24]. Immunofluorescence imaging using Airyscan microscopy demonstrated LACTB's localization within the inner mitochondrial membrane, specifically colocalizing with ATP synthase β subunit in cristae [24]. In vitro reconstitution experiments with purified LACTB and artificial lipid membranes directly demonstrated its membrane remodeling capability, particularly with cardiolipin-enriched compositions [24].
Table 2: Quantitative Effects of LACTB Modulation on Apoptosis Parameters
| Parameter Measured | LACTB Knockdown | LACTB Overexpression | Measurement Method |
|---|---|---|---|
| Cell Viability | Increased ~20-30% after 4-7h staurosporine | Decreased ~25-40% after 4-7h staurosporine | Sulforhodamine B (SRB) assay |
| Cytochrome c Release | Reduced ~40-60% after 30min ABT-S treatment | Increased ~50-70% after 30min ABT-S treatment | Differential centrifugation + Western blot |
| Caspase-3 Activation | Delayed processing of full-length caspase-3 | Accelerated processing | Western blot analysis |
| PARP Cleavage | Delayed cleavage pattern | Accelerated cleavage | Western blot analysis |
| Mitochondrial Remodeling | Impaired during apoptosis; Normal with CCCP | Enhanced during apoptosis | Electron microscopy, membrane morphology |
Nur77: A Dual-Function Regulator in Apoptosis
Structural Characteristics and Subcellular Dynamics
Nur77 (also known as NR4A1, TR3, or NGFI-B) is an orphan nuclear receptor and immediate-early response gene that exhibits complex dual functions in cell survival and death decisions [30] [31]. Structurally, Nur77 consists of 598 amino acids with an N-terminal activation function region (A/B domain), a central DNA-binding domain (C region), a flexible hinge area (D region), and a C-terminal ligand-interacting domain (E region) [32]. Unique among nuclear receptors, Nur77's ligand-binding domain lacks a conventional ligand-binding cavity due to bulky hydrophobic residues that tightly pack the potential binding space, suggesting it functions through ligand-independent mechanisms [32].
Nur77 demonstrates dynamic subcellular trafficking in response to cellular stressors. Under normal conditions, Nur77 localizes predominantly to the nucleus where it functions as a transcription factor regulating genes involved in metabolism, inflammation, and differentiation [30] [31]. However, in response to apoptotic stimuli including oxidative stress, ischemia/reperfusion injury, and certain chemical inducers, Nur77 translocates from the nucleus to mitochondria [30] [32]. This translocation depends on the nuclear export receptor Chromosome Region Maintenance 1 (CRM1) recognizing a nuclear export signal on Nur77 [32].
Mitochondrial Translocation and Bcl-2 Conversion
Upon reaching mitochondria, Nur77 interacts directly with Bcl-2 through its N-terminal region, triggering a conformational change that exposes Bcl-2's BH3 domain [30] [32]. This transformation converts Bcl-2 from an anti-apoptotic to a pro-apoptotic protein, fundamentally altering the balance of mitochondrial apoptotic regulation. The Nur77-Bcl-2 interaction facilitates cytochrome c release from mitochondria through mechanisms that may involve direct pore formation or sensitization of mitochondria to other pro-apoptotic signals [30].
In cardiomyocytes subjected to ischemia/reperfusion injury, mitochondrial translocation of Nur77 induces typical morphological features of apoptosis, including chromatin condensation and DNA fragmentation, while Nur77 knockdown significantly rescues hydrogen peroxide-induced apoptosis [30]. This pathway represents a novel mechanism for amplifying apoptotic signaling through the subcellular redistribution of a nuclear transcription factor to directly engage the mitochondrial apoptosis machinery.
Experimental Approaches for Studying LACTB and Nur77
Protocol for LACTB Functional Analysis
Knockdown and Overexpression Studies:
- LACTB Knockdown: Utilize siRNA or shRNA targeting LACTB sequences. Transfect HeLa or B16-F10 cells using appropriate transfection reagents (e.g., HiPerfect for siRNA). Validate knockdown efficiency via Western blot (whole-cell extracts) and immunofluorescence (98.5% reduction achieved in cited studies) [24].
- LACTB Overexpression: Stably transduce cells with LACTB-expression vectors. Confirm overexpression levels through Western blot analysis of whole-cell extracts [24].
Apoptosis Induction and Assessment:
- Induction Methods: Treat cells with 1μM staurosporine for 4-7 hours or ABT-S combination (ABT-737 Bcl-2 inhibitor + S63845 MCL-1 inhibitor) for 30 minutes to several hours [24].
- Viability Assays: Perform sulforhodamine B (SRB) assay at 565nm absorbance to quantify cell viability at multiple timepoints [24].
- Annexin V/7-AAD Staining: Use flow cytometry to quantify apoptotic populations at various timepoints after treatment [24].
Cytochrome c Release Measurements:
- Subcellular Fractionation: Employ differential centrifugation to separate cytoplasmic and heavy membrane (mitochondrial) fractions. Confirm purity with compartment-specific markers [24] [33].
- Western Blot Analysis: Probe fractions with anti-cytochrome c antibodies (e.g., mouse anti-cytochrome c, BD Pharmingen). Quantify band intensity to determine redistribution [24] [30].
- Immunofluorescence: Fix cells, permeabilize with 0.1% Triton X-100, and stain with anti-cytochrome c antibodies. Image using confocal microscopy to visualize punctate (mitochondrial) vs. diffuse (cytosolic) patterns [24] [33].
Mitochondrial Morphology Assessment:
- Electron Microscopy: Fix cell pellets in glutaraldehyde, post-fix in OsO4, embed in Epon, and section for transmission electron microscopy analysis of cristae structure [24] [33].
- In Vitro Remodeling Assays: Incubate purified LACTB with artificial lipid nanotubes and planar membranes containing varying cardiolipin concentrations. Assess remodeling via negative-stain TEM [24].
Protocol for Nur77 Translocation Studies
Subcellular Localization Tracking:
- Immunofluorescence Staining: Fix cells with paraformaldehyde, permeabilize with Triton X-100, and incubate with anti-Nur77 antibodies (e.g., rabbit anti-Nur77, Lifespan Biosciences). Use HSP60 or Tom20 as mitochondrial markers and counterstain nuclei with Topro-3 iodide or Sytox Blue [30].
- Confocal Microscopy: Acquire high-resolution z-stack images using laser-scanning confocal microscopy. Quantify colocalization coefficients using ImageJ or similar software [30].
Subcellular Fractionation:
- Mitochondrial Isolation: Homogenize tissues or cells in isolation buffer (70mM sucrose, 190mM D-Mannitol, 20mM Hepes, 0.2mM EDTA). Separate nuclear fractions at 600g for 10min, then mitochondrial fractions at 5,000g for 15min [30].
- Western Blot Analysis: Probe fractions with anti-Nur77 (Santa Cruz Biotechnology), with GAPDH (cytosolic), Lamin B (nuclear), and COX IV (mitochondrial) as compartment markers [30].
Functional Validation:
- Nur77 Knockdown: Transfect cells with Nur77-specific siRNA (sequence: 5'-UGG CCC AGA GUU CCC UGA AGU UGUU-3') using HiPerfect transfection reagent [30].
- Apoptosis Assessment: Perform TUNEL staining using In Situ Cell Death Detection Kit after fixing and permeabilizing cells. Quantify apoptosis rates via fluorescence microscopy [30].
Research Reagent Solutions
Table 3: Essential Research Reagents for LACTB and Nur77 Investigations
| Reagent/Category | Specific Examples | Research Application | Function/Mechanism |
|---|---|---|---|
| Apoptosis Inducers | Staurosporine (1μM); ABT-737 + S63845 (ABT-S) | Induction of intrinsic apoptosis | Protein kinase inhibition; BCL-2/MCL-1 inhibition to activate BAX pores |
| Caspase Inhibitors | Q-VD-OPh (pan-caspase inhibitor) | Distinguishing upstream/downstream events | Irreversible broad-spectrum caspase inhibition |
| Lipid Membranes | Cardiolipin-enriched nanotubes vs planar membranes | In vitro remodeling assays | LACTB binding preference for curved membranes |
| Antibodies | Anti-cytochrome c (PharMingen/BD); Anti-Nur77 (Santa Cruz); Anti-LACTB | Localization, Western blot, immunofluorescence | Target protein detection and visualization |
| Fractionation Markers | GAPDH (cytosol); Lamin B (nucleus); COX IV (mitochondria) | Subcellular fractionation validation | Compartment purity assessment |
| Microscopy Reagents | Tom20-GFP (OMM); Mito-GFP (matrix); ATP synthase β (cristae) | Mitochondrial subcompartment localization | Specific targeting fluorescent markers |
Therapeutic Implications and Future Directions
The emerging understanding of LACTB and Nur77 in mitochondrial apoptosis regulation presents compelling therapeutic opportunities. For LACTB, the structural insights into filament assembly and membrane binding provide potential avenues for developing small molecules that modulate its polymerization state or enzymatic activity [28] [29]. LACTB downregulation in multiple cancers suggests that LACTB-activating compounds could restore apoptotic sensitivity in treatment-resistant tumors [24] [29]. Similarly, Nur77's dual functions offer multiple targeting strategies—compounds that promote its mitochondrial translocation could enhance apoptosis in cancer cells, while inhibitors of this translocation might protect cardiomyocytes or neurons in ischemic conditions [30] [31] [32].
Future research should address several critical questions. For LACTB: What are its physiological substrates? How is filament assembly regulated in response to cellular signals? Are there natural activators that promote its pro-apoptotic functions? For Nur77: What factors determine its choice between genomic and non-genomic functions? How is its subcellular trafficking precisely regulated? Can tissue-specific targeting strategies be developed given its opposing roles in different pathologies? The continuing elucidation of these emerging regulators will undoubtedly refine our understanding of intrinsic apoptosis and potentially yield novel therapeutic modalities for cancer, neurodegenerative diseases, and ischemic conditions.
The intrinsic apoptosis pathway represents a critically regulated form of programmed cell death essential for cellular homeostasis and elimination of damaged cells. Within this pathway, mitochondrial cytochrome c (cyt c) release serves as the pivotal molecular switch that initiates a cascade of cellular events culminating in metabolic collapse and executioner caspase activation [6] [34]. This process transforms mitochondria from power-generating organelles into central signaling hubs that coordinate cellular demise. The release of cyt c from the mitochondrial intermembrane space into the cytosol represents a point of no return, triggering the formation of the apoptosome complex and activation of caspase-9, which subsequently cleaves and activates executioner caspases-3 and -7 [35] [36]. Simultaneously, the depletion of cyt c from mitochondria cripples the electron transport chain, leading to impaired ATP synthesis and collapse of mitochondrial membrane potential (ΔΨm) [37]. This document provides a comprehensive technical examination of the molecular mechanisms, experimental methodologies, and therapeutic implications linking mitochondrial cyt c release to the terminal phases of apoptotic execution.
Molecular Mechanisms of Cytochrome c Release and Caspase Activation
The BCL-2 Family Regulates Mitochondrial Outer Membrane Permeabilization
The intrinsic apoptosis pathway is initiated by diverse cellular stresses including DNA damage, oxidative stress, and endoplasmic reticulum stress [34] [38]. These stimuli activate pro-apoptotic BH3-only proteins (Bid, Bim, Bad, Noxa, PUMA) which either directly activate the effectors Bax and Bak or neutralize anti-apoptotic proteins (Bcl-2, Bcl-xL, Mcl-1) [35] [38]. Once activated, Bax and Bak oligomerize to form pores in the mitochondrial outer membrane (MOMP), facilitating the release of cyt c and other pro-apoptotic factors from the intermembrane space [35] [39]. This pore formation represents a critical commitment step to apoptotic death, as evidenced by studies demonstrating that Bcl-2 overexpression effectively prevents cyt c release and subsequent apoptosis [37] [36].
Cytochrome c Redox State Regulates Apoptosome Function
Upon release into the cytosol, cyt c undergoes a critical redox transition that determines its effectiveness in apoptosome formation. The cytochrome c-mediated caspase activation is potentiated when cyt c is maintained in an oxidized state, a process facilitated by cytochrome oxidase activity [40]. Conversely, reduction of cyt c by systems such as tetramethylphenylenediamine (TMPD) or yeast lactate dehydrogenase/cytochrome c reductase effectively blocks caspase activation, highlighting the crucial relationship between cyt c redox state and apoptotic signaling [40]. This redox dependence provides an additional layer of regulation beyond mere cyt c release, with important implications for therapeutic intervention.
Executioner Caspase Activation and Amplification Loops
The released cyt c binds to Apaf-1 in the cytosol, forming the heptameric apoptosome complex in the presence of dATP/ATP [35] [6]. This complex recruits and activates procaspase-9, which subsequently cleaves and activates the executioner caspases-3 and -7 [35] [34]. Once activated, these executioner caspases initiate a proteolytic cascade that cleaves hundreds of cellular substrates, leading to the characteristic morphological changes of apoptosis, including chromatin condensation, DNA fragmentation, and membrane blebbing [35] [34]. Importantly, activated caspases participate in feedback amplification by further promoting mitochondrial cyt c release through cleavage of Bcl-2 and other regulatory proteins, thereby locking the cell into the death pathway [37].
Table 1: Distinct Stages of Cytochrome c Release and Functional Consequences
| Stage | Timing Post-IR | Cytochrome c Level | Caspase Activity | ATP Level | ΔΨm | Bcl-2 Inhibition |
|---|---|---|---|---|---|---|
| Early Release | 2-8 hours | Low levels in cytosol; minimal mitochondrial depletion | Activated by 4 hours (caspase-9, -3) | Maintained | Maintained | Effective |
| Late Release | 16-24 hours | Dramatic increase in cytosol; mitochondrial depletion | Highly activated | Substantial decline | Significant reduction | Effective |
Metabolic Collapse Following Cytochrome c Depletion
The release and depletion of cyt c from mitochondria initiates a catastrophic metabolic failure through two interconnected mechanisms. First, the loss of cyt c disrupts the electron transport chain, preventing ATP synthesis through oxidative phosphorylation [37] [6]. Second, the activation of executioner caspases targets multiple metabolic enzymes and organelles, further compromising cellular energy production [35]. Studies using ionizing radiation-treated IM-9 cells demonstrate that ATP levels and ΔΨm remain stable during early cyt c release (up to 8 hours) but undergo substantial decline during late-stage cyt c release (16-24 hours), coinciding with massive mitochondrial cyt c depletion [37]. This temporal relationship confirms that metabolic collapse results specifically from the depletion of mitochondrial cyt c pools rather than its initial release.
Diagram 1: Integrated Pathway of Cytochrome c-Mediated Apoptosis. This diagram illustrates the molecular sequence from apoptotic initiation through metabolic collapse, highlighting the two-stage cytochrome c release process and feedback amplification mechanisms.
Experimental Models and Methodologies
Real-Time Tracking of Cytochrome c Release and Caspase Activation
Advanced cellular models enabling simultaneous monitoring of cyt c release and caspase activation have refined our understanding of the temporal relationship between these events. Stable expression of cyt c-EGFP fusion proteins in various cancer cell lines (e.g., SiHa, SW480) permits visualization of cyt c release in live cells using time-lapse microscopy [36]. Complementary FRET-based caspase sensors (ECFP-DEVD-EYFP) enable parallel monitoring of caspase-3/7 activation through measurement of DEVD cleavage efficiency [36]. These approaches have demonstrated that cyt c release consistently precedes caspase activation, with PAC-1 (a putative direct caspase activator) inducing cyt c release at 6-8 hours post-treatment while caspase activation initiates only at 12 hours [36].
Table 2: Quantitative Analysis of Temporal Events in Apoptosis Execution
| Parameter | Measurement Method | Onset Timing | Peak Activity | Key Regulators |
|---|---|---|---|---|
| Cytochrome c Release | Western blot of cytosolic fractions, cyt c-EGFP imaging | 2-4 hours (early), 16+ hours (late) | 16-24 hours | Bcl-2, Bax, Bak |
| Caspase-9 Activation | Western blot (45 kDa→37 kDa cleavage), activity assays | 4 hours | 8-16 hours | Apaf-1, cytochrome c, ATP |
| Caspase-3/7 Activation | DEVD-pNA cleavage, FRET sensors, PARP cleavage | 4-6 hours | 8-24 hours | Caspase-9, IAPs |
| ATP Depletion | Luciferase-based assays | 16+ hours | 24+ hours | Cytochrome c depletion |
| ΔΨm Collapse | Rhodamine 123 staining, TMRE, JC-1 | 16+ hours | 24+ hours | Cytochrome c depletion, ROS |
Biochemical Assessment of Mitochondrial Function
Multiple complementary approaches are employed to quantify the metabolic consequences of cyt c release. ATP levels are typically measured using luciferase-based assays that provide sensitive quantification of cellular ATP concentrations [37]. Mitochondrial membrane potential (ΔΨm) is assessed using potential-sensitive dyes including Rhodamine 123, tetramethylrhodamine ethyl ester (TMRE), or JC-1, which exhibit fluorescence changes dependent on ΔΨm [37] [36]. These measurements reveal that both ATP levels and ΔΨm remain stable during early cyt c release when mitochondrial cyt c stores are largely preserved, but undergo dramatic decline during late-stage cyt c release when mitochondrial pools become depleted [37].
Validation Using Genetic and Pharmacologic Manipulations
Defined cellular models with specific genetic alterations provide critical insights into apoptotic pathway requirements. Caspase-3-deficient MCF7 cells and their caspase-3-reconstituted counterparts (MCFC3) enable assessment of caspase-3 dependency in cell death pathways [36]. Similarly, cells overexpressing Bcl-2 or Bcl-xL permit evaluation of upstream apoptotic regulation, while Bax/Bak double-knockout cells establish the requirement for these effectors in MOMP [36]. Pharmacologic inhibitors including the pan-caspase inhibitor zVAD-fmk selectively block late-stage cyt c release and metabolic collapse without affecting early cyt c release, confirming the caspase-dependence of amplification loops [37]. The differential effects of these manipulations are summarized in Table 3.
Table 3: Experimental Manipulations and Their Effects on Apoptotic Parameters
| Experimental Manipulation | Early Cytochrome c Release | Late Cytochrome c Release | Caspase Activation | Metabolic Collapse |
|---|---|---|---|---|
| Bcl-2 Overexpression | Inhibited | Inhibited | Inhibited | Inhibited |
| zVAD-fmk (pan-caspase inhibitor) | No effect | Inhibited | Inhibited | Inhibited |
| Bax/Bak Deficiency | Inhibited | Inhibited | Inhibited | Inhibited |
| Caspase-3 Deficiency | No effect | No effect | Reduced/Diverted | Delayed |
| TMPD (cytochrome c reductant) | No effect | No effect | Inhibited | No direct effect |
Research Reagent Solutions
Table 4: Essential Research Reagents for Cytochrome c Release and Caspase Activation Studies
| Reagent | Function/Application | Key Features | Experimental Use |
|---|---|---|---|
| zVAD-fmk | Pan-caspase inhibitor | Irreversible binding to catalytic site; distinguishes caspase-dependent/independent processes | 20-100 μM added 1h pre-treatment or at defined intervals |
| Cyt c-EGFP stable cells | Real-time visualization of cyt c release | EGFP fused to cyt c; proper mitochondrial targeting | Live-cell imaging after apoptotic stimuli; confirms release before caspase activation |
| FRET caspase sensors (ECFP-DEVD-EYFP) | Monitoring caspase-3/7 activation | DEVD sequence cleaved by caspases-3/7; loss of FRET upon cleavage | Quantification of caspase activation kinetics in live cells |
| Rhodamine 123/JC-1 | ΔΨm measurement | Fluorescence intensity/polarization dependent on membrane potential | Flow cytometry or microscopy to assess mitochondrial function |
| Annexin V conjugates | Detection of phosphatidylserine exposure | Binds externalized PS on outer membrane leaflet | Early apoptosis marker combined with viability dyes (PI) |
| PAC-1 | Putative direct caspase activator | Reported to activate procaspase-3 by zinc chelation | Positive control for caspase activation (though requires cyt c release) |
| Venetoclax (ABT-199) | BCL-2 inhibitor; BH3 mimetic | Binds BCL-2; releases BIM to activate BAX/BAK | Induces intrinsic apoptosis in BCL-2-dependent cells |
| Carbon nanoparticles (CDots) | Apoptosis detection via altered uptake | Enhanced accumulation in apoptotic cells | Distinguish live vs. apoptotic cells by fluorescence intensity |
Diagram 2: Experimental Workflow for Apoptosis Assessment. This diagram outlines a systematic approach for evaluating the temporal sequence of apoptotic events, highlighting key measurement timepoints and intervention strategies.
Therapeutic Implications and Concluding Perspectives
The molecular events connecting mitochondrial cyt c release to metabolic collapse and executioner caspase activation represent promising therapeutic targets, particularly in oncology where apoptotic evasion is a cancer hallmark [35] [6]. BCL-2 inhibitors such as venetoclax have demonstrated clinical efficacy in hematologic malignancies by directly promoting MOMP and cyt c release [35]. Similarly, strategies targeting the redox regulation of cyt c or exploiting the differential cyt c requirements in cancer cells versus normal cells offer promising avenues for selective cancer therapy [40] [6]. The intricate relationship between cyt c release, caspase activation, and metabolic collapse underscores the importance of maintaining mitochondrial integrity for cellular survival and represents a critical focal point for developing novel therapeutic interventions against cancer and other diseases characterized by apoptotic dysregulation.
The intrinsic apoptosis pathway is a genetically programmed cell death mechanism essential for multicellular life. At the core of this pathway lies cytochrome c (Cyt c), a mitochondrial protein with a dualistic biological function that places it at the crossroads of cellular survival and death. Under physiological conditions, Cyt c operates as an indispensable electron carrier within the mitochondrial respiratory chain, facilitating oxidative phosphorylation and cellular energy production [41] [42]. However, when cells encounter irreparable internal damage—such as DNA damage, oxidative stress, or oncogenic signaling—Cyt c undergoes a dramatic functional transformation, becoming a potent initiator of programmed cellular destruction [41].
The release of Cyt c from the mitochondrial intermembrane space into the cytosol represents a critical point of no return in the intrinsic apoptosis pathway. This translocation event is meticulously regulated by B-cell lymphoma 2 (BCL-2) family proteins, which govern mitochondrial outer membrane permeabilization (MOMP) [35] [43]. Upon entering the cytosol, Cyt c binds to apoptotic protease-activating factor 1 (Apaf-1), forming a complex known as the "apoptosome." This complex recruits and activates procaspase-9, initiating a proteolytic cascade that culminates in the activation of executioner caspases (e.g., caspase-3, -6, -7) and the systematic dismantling of cellular structures [41] [44] [34].
Dysregulation of this meticulously controlled process has profound implications for human health. Either insufficient or excessive mitochondrial Cyt c release can disrupt tissue homeostasis and contribute to diverse pathological states, most notably cancer and neurodegenerative diseases [41] [45] [43]. This technical review examines the pathophysiological significance of mitochondrial Cyt c release, with particular emphasis on its role in oncogenesis, neurodegeneration, and the maintenance of homeostatic balance.
Cytochrome c Release in Cancer Development
Evasion of Apoptosis as a Hallmark of Cancer
The evasion of programmed cell death represents a fundamental hallmark of cancer, enabling transformed cells to overcome intrinsic barriers to tumor development and progression [35]. Malignant cells frequently develop mechanisms to restrict mitochondrial Cyt c release, thereby bypassing a critical tumor suppressor mechanism. Common adaptations include the overexpression of anti-apoptotic BCL-2 family proteins (e.g., BCL-2, BCL-xL, MCL-1), which sequester pro-apoptotic proteins and prevent MOMP [35] [43]. Additionally, many cancers exhibit reduced expression or functional inactivation of pro-apoptotic BCL-2 family members (e.g., BAX, BAK), creating an environment resistant to mitochondrial apoptosis [35].
Molecular studies have identified specific defects in the intrinsic apoptosis pathway across various cancer types. These include acquired caspase gene mutations that inhibit caspase function, overexpression of inhibitor of apoptosis proteins (IAPs), insufficient release of cytochrome c due to altered mitochondrial physiology, and mutations of specific cytochrome c lysine residues (e.g., K72) that abrogate apoptosome formation [35]. For instance, colorectal cancer cells frequently demonstrate decreased death receptor 4/5 (DR4/5) activity and impaired transport mechanisms, contributing to their resistance to apoptosis-inducing stimuli [35].
Altered Cytochrome c Dynamics and Metabolic Reprogramming in Malignancy
Cancer cells exhibit distinct alterations in Cyt c expression, localization, and function that extend beyond its role in apoptosis regulation. Raman imaging studies of human breast tissue specimens have revealed that Cyt c becomes released into the ductal lumen during cancer development, whereas the lumen remains empty in normal breast ducts [42]. This altered distribution pattern suggests that malignant transformation disrupts normal Cyt c compartmentalization. Furthermore, cancerous tissues consistently demonstrate upregulation of the reduced form of Cyt c (Fe²⁺) across all stages of cancer development, indicating a fundamental shift in mitochondrial redox balance [42].
The metabolic reprogramming characteristic of cancer cells—particularly the Warburg effect, wherein cancer cells preferentially utilize glycolysis over oxidative phosphorylation even in the presence of oxygen—further connects Cyt c functionality to tumor biology [41]. While Cyt c traditionally supports oxidative phosphorylation, its post-translational modifications in cancer cells can influence metabolic adaptations that support anabolic growth and proliferation [41]. The observed reduction in Cyt c levels in advanced glioma tissues compared to healthy counterparts suggests that diminished apoptotic potential may correlate with disease progression in certain malignancies [41].
Table 1: Cytochrome c Alterations in Cancer Pathophysiology
| Alteration Type | Specific Changes | Functional Consequences | Cancer Examples |
|---|---|---|---|
| Expression Levels | Reduced cytochrome c levels | Decreased apoptotic capacity | Gliomas, advanced-stage cancers |
| Subcellular Localization | Release into ductal lumen | Disrupted cellular compartmentalization | Breast ductal carcinoma |
| Redox State | Upregulated reduced Cyt c (Fe²⁺) | Altered mitochondrial redox signaling | Multiple cancer types |
| Protein Interactions | Mutated lysine residues (K72) | Impaired apoptosome formation | Various cancers |
| Regulatory Control | Overexpressed anti-apoptotic BCL-2 | Inhibition of MOMP | Hematologic malignancies, solid tumors |
Therapeutic Targeting of Apoptotic Pathways
The central role of defective apoptosis in cancer has motivated the development of therapeutic agents designed to reactivate cell death programs in malignant cells. BH3 mimetics represent a promising class of small molecules that mimic the function of pro-apoptotic BH3-only proteins [35]. Venetoclax (ABT-199), the first FDA-approved BCL-2 inhibitor, binds directly to BCL-2 and displaces pro-apoptotic proteins like BIM, leading to BAX/BAK activation, MOMP, and cytochrome c release [35]. This agent has demonstrated significant efficacy in chronic lymphocytic leukemia (CLL) and acute myeloid leukemia (AML), particularly in elderly patients unsuitable for intensive chemotherapy [35].
Additional therapeutic strategies have focused on the extrinsic apoptosis pathway, including TRAIL (tumor necrosis factor-related apoptosis-inducing ligand) analogues and DR4/5 agonist antibodies designed to trigger caspase activation independently of BCL-2 regulation [35]. Second-generation TRAIL derivatives such as TLY012 exhibit prolonged half-life and enhanced antitumor activity, while combination approaches with IAP antagonists or immune checkpoint inhibitors show potential for overcoming therapeutic resistance [35]. The compound ONC201, which induces TRAIL and DR5 expression, has demonstrated synergistic activity with TLY012 in pancreatic cancer models, suggesting promising avenues for combating apoptosis-resistant malignancies [35].
Table 2: Therapeutic Agents Targeting Apoptotic Pathways in Cancer
| Therapeutic Class | Representative Agents | Molecular Target | Clinical Applications |
|---|---|---|---|
| BH3 Mimetics | Venetoclax (ABT-199) | BCL-2 | CLL, AML |
| TRAIL Analogs | TLY012 (PEGylated rhTRAIL) | DR4/5 | Colorectal cancer, pancreatic cancer |
| DR4/5 Agonists | Lexatumumab (DR5), Mapatumumab (DR4) | Death Receptors | Solid tumors (clinical trials) |
| TRAIL-Inducing Compounds | ONC201 | Multiple targets including DR5 | Pancreatic cancer models |
| Combination Therapies | Venetoclax + Obinutuzumab | BCL-2 + CD20 | CLL (chemotherapy-free regimen) |
Cytochrome c Dysregulation in Neurodegenerative Disorders
Excessive Apoptosis in Neurodegenerative Pathogenesis
In contrast to cancer, where insufficient apoptosis permits cell survival, neurodegenerative diseases are characterized by excessive neuronal cell death mediated through mitochondrial dysfunction [46] [43]. The intrinsic apoptosis pathway plays a central role in this process, with cytochrome c release serving as a critical commitment step. In conditions such as Alzheimer's disease (AD), Parkinson's disease (PD), amyotrophic lateral sclerosis (ALS), and Huntington's disease (HD), various stressors—including oxidative damage, protein misfolding, excitotoxicity, and bioenergetic deficits—converge on mitochondria to promote MOMP and Cyt c release [46] [43].
Amyotrophic lateral sclerosis provides a compelling example of apoptosis dysregulation in neurodegeneration. Studies in SOD1 mutant mouse models of familial ALS have demonstrated abnormally reduced levels of the anti-apoptotic protein BCL-2 and increased expression of the pro-apoptotic effector BAX in spinal cord motor neurons [43]. Notably, elevated mRNA levels of the BH3-only protein BIM have been observed in the spinal cord of symptomatic SOD1 transgenic mice, and genetic deficiency of BIM extends lifespan in SOD1G93A mutant mice [43]. Administration of broad-spectrum caspase inhibitors or overexpression of BCL-2 similarly delays disease onset and progression in ALS models, supporting the therapeutic relevance of apoptosis modulation [43].
Mitochondrial Dysfunction Beyond Apoptosis in Neurodegeneration
While cytochrome c-mediated apoptosis represents a significant mechanism of neuronal loss, mitochondrial contributions to neurodegeneration extend beyond this canonical pathway. Mitochondria in neuronal cells are particularly vulnerable to dysfunction due to high energy demands, relatively weak antioxidant defenses, and calcium buffering requirements [46]. In Alzheimer's disease, alterations in oxidative phosphorylation enzymes, oxidative damage, and mitochondrial binding of amyloid-β (Aβ) and amyloid precursor protein have all been reported [46]. Similarly, Parkinson's disease involves mutations in mitochondrial proteins and mitochondrial DNA mutations in substantia nigra neurons, while ALS demonstrates abnormalities in mitochondrial respiratory chain enzymes and cell death proteins [46].
The mitochondrial permeability transition pore (mPTP) represents another mechanism linking mitochondrial dysfunction to neuronal death. The mPTP is a high-conductance channel in the inner mitochondrial membrane whose opening leads to loss of membrane potential, mitochondrial swelling, and rupture of the outer mitochondrial membrane [46]. This process can trigger both apoptotic and necrotic cell death depending on cellular context and energy status. In neurodegenerative conditions, calcium overload and oxidative stress—common features of diseased neurons—promote mPTP opening, creating a vicious cycle of mitochondrial dysfunction and cellular demise [46].
Cytochrome c in Homeostatic Imbalance
Developmental Regulation of Apoptotic Sensitivity
The regulation of mitochondrial apoptosis exhibits significant variation across tissues and developmental stages, creating context-specific susceptibilities to homeostatic imbalance. Research using BH3 profiling has demonstrated that mitochondria from many adult somatic tissues—including brain, heart, and kidneys—are profoundly refractory to pro-apoptotic signaling, conferring cellular resistance to cytotoxic stimuli [47]. In striking contrast, mitochondria from these same tissues in young mice and humans are primed for apoptosis, predisposing them to cell death in response to genotoxic damage [47].
This developmental regulation of apoptotic sensitivity has important clinical implications, potentially explaining why pediatric cancer patients experience higher risks of treatment-associated toxicities affecting neural and cardiac tissues [47]. The molecular basis for this developmental switch involves the expression of the apoptotic protein machinery, which is nearly absent in many adult tissues but prominently expressed in young tissues under the control of c-Myc, thereby linking developmental growth programs with cell death pathways [47].
Interplay Between Cell Death Modalities
The traditional binary classification of cell death into strict categories of apoptosis and necrosis has evolved to recognize a continuum of cell death modalities with overlapping features [46] [34]. In this model, classical apoptosis (with internucleosomal DNA fragmentation) and necrosis (with random DNA digestion) represent extremes, with various hybrid forms occupying intermediate positions [46]. Cytochrome c release primarily initiates apoptosis, but crosstalk with other cell death mechanisms—including necroptosis, ferroptosis, pyroptosis, and autophagic cell death—creates a complex network of cellular demise pathways that collectively maintain tissue homeostasis [45] [34].
The BCL-2 protein family, which regulates cytochrome c release, serves as a critical node integrating diverse death signals. For example, the BH3-only protein Bid provides a molecular connection between the extrinsic and intrinsic apoptosis pathways. Upon activation of caspase-8 by extracellular death signals, Bid is cleaved to its active form, which translocates to mitochondrial membranes and interacts with Bax to promote MOMP and cytochrome c release, thereby amplifying the apoptotic signal [44]. Similar connections exist with other cell death modalities, creating a flexible system for eliminating damaged cells while minimizing inflammatory consequences.
Experimental Methodologies and Research Tools
Assessing Cytochrome c Release and Apoptotic Signaling
The investigation of mitochondrial cytochrome c release employs diverse methodological approaches spanning biochemical, imaging, and functional techniques. Western blot analysis of subcellular fractions remains a cornerstone method for detecting cytochrome c translocation from mitochondria to cytosol during apoptosis [48]. This approach typically involves differential centrifugation to separate mitochondrial and cytosolic fractions, followed by immunoblotting with anti-cytochrome c antibodies. Complementary methodologies include immunofluorescence and immunohistochemistry using cytochrome c-specific antibodies to visualize its subcellular localization in fixed cells and tissues [42].
Advanced imaging technologies provide additional insights into cytochrome c dynamics and related cellular processes. Raman spectroscopy and imaging represent particularly powerful label-free methods that can monitor changes in the redox state of mitochondrial cytochromes while simultaneously providing spatial information about their distribution within cells and tissues [42]. This technique has revealed that cytochrome c, cardiolipin, and palmitic acid constitute main components inside the lumen of cancerous breast ducts, in contrast to normal ducts which remain empty [42]. Additionally, live-cell imaging using fluorescently tagged cytochrome c constructs or dyes that track mitochondrial membrane potential (e.g., JC-1, TMRM) enables real-time monitoring of apoptosis initiation and progression.
Table 3: Key Experimental Approaches for Studying Cytochrome c Biology
| Methodology | Key Reagents/Assays | Applications | Technical Considerations |
|---|---|---|---|
| Subcellular Fractionation + Western Blot | Differential centrifugation, Cytochrome c antibodies | Detect cytochrome c translocation | Requires careful fractionation controls |
| Raman Spectroscopy/Imaging | Label-free spectral analysis | Cytochrome c redox state and localization | Provides spatial and biochemical information |
| Live-Cell Imaging | Fluorescent protein-tagged cytochrome c, MMP-sensitive dyes | Real-time apoptosis monitoring | Enables kinetic analysis |
| BH3 Profiling | Synthetic BH3 peptides, Membrane potential dyes | Measure mitochondrial priming | Functional assessment of apoptotic readiness |
| Flow Cytometry | Annexin V/PI staining, Caspase activity probes | Quantify apoptosis stages | Distinguishes early/late apoptosis and necrosis |
The Scientist's Toolkit: Essential Research Reagents
The following research reagents represent essential tools for investigating mitochondrial cytochrome c release and its pathophysiological significance:
BH3 Peptides: Synthetic peptides corresponding to the BH3 domains of pro-apoptotic BCL-2 family proteins (e.g., BIM, BID, PUMA) used in BH3 profiling to measure mitochondrial priming and apoptotic susceptibility [35] [47].
Caspase Inhibitors (e.g., Z-VAD-FMK): Pan-caspase inhibitors that block apoptotic execution, enabling researchers to distinguish caspase-dependent and -independent cell death mechanisms [43] [48].
Mitochondrial Membrane Potential Dyes (e.g., JC-1, TMRM): Fluorescent dyes that accumulate in polarized mitochondria, allowing assessment of mitochondrial health and early apoptosis stages through flow cytometry or microscopy [48].
Cytochrome c Antibodies: Specific monoclonal and polyclonal antibodies for detecting cytochrome c release via Western blot, immunofluorescence, and immunohistochemistry applications [42] [48].
BCL-2 Family Modulators: Small molecule inhibitors (e.g., Venetoclax for BCL-2) and activators that specifically target anti-apoptotic or pro-apoptotic BCL-2 family members to manipulate apoptotic thresholds [35].
Recombinant Death Ligands (e.g., rhTRAIL/dulanermin): Recombinant forms of death receptor ligands that activate the extrinsic apoptosis pathway, often used in combination studies to overcome apoptotic resistance [35].
Annexin V/Propidium Iodide: Fluorescent conjugates for flow cytometry that distinguish early apoptotic (Annexin V+/PI-), late apoptotic (Annexin V+/PI+), and necrotic (Annexin V-/PI+) cell populations [48].
Visualizing Key Pathways and Experimental Approaches
The Intrinsic Apoptosis Pathway and Cytochrome c Release
Diagram 1: Intrinsic Apoptosis Pathway Initiated by Cytochrome c Release
Experimental Workflow for Assessing Cytochrome c-Mediated Apoptosis
Diagram 2: Experimental Workflow for Cytochrome c Apoptosis Assessment
The release of cytochrome c from mitochondria represents a decisive event in cellular fate determination, with profound implications for human health and disease. In cancer pathogenesis, suppression of cytochrome c-mediated apoptosis enables transformed cells to evade elimination, contributing to tumor development and therapeutic resistance. Conversely, in neurodegenerative conditions, excessive activation of the intrinsic apoptosis pathway accelerates neuronal loss and functional decline. The delicate balance of these processes—orchestrated through complex interactions between BCL-2 family proteins, mitochondrial physiology, and cellular stress responses—highlights the critical importance of context-appropriate apoptotic regulation for tissue homeostasis.
Future research directions will likely focus on developing more precise modulators of cytochrome c release that can selectively target pathological cell populations while sparing healthy tissues. The ongoing refinement of BH3 mimetics, the exploration of combination therapies that overcome apoptotic resistance, and the development of agents that modulate mitochondrial function without triggering catastrophic apoptosis represent promising therapeutic strategies. Additionally, advanced imaging technologies such as Raman spectroscopy will continue to provide unprecedented insights into cytochrome c dynamics within living systems, potentially enabling earlier detection of apoptotic dysregulation in disease states. As our understanding of the intricate relationships between cytochrome c release, cellular metabolism, and inter-organellar communication deepens, new opportunities will emerge for targeting this fundamental process in a wide spectrum of human diseases characterized by homeostatic imbalance.
Advanced Detection Methods and Therapeutic Applications Targeting Cytochrome c Release
The intrinsic apoptosis pathway is a precisely regulated form of programmed cell death crucial for development, tissue homeostasis, and eliminating damaged cells. A pivotal event in this pathway is the release of cytochrome c (cyt c) from the mitochondrial intermembrane space into the cytoplasm [49]. This release triggers the formation of the apoptosome, a multi-protein complex that activates a cascade of caspases, the primary executors of apoptosis [50]. Consequently, the detection of cytochrome c release serves as a critical biochemical marker for confirming the activation of the intrinsic apoptotic pathway [51].
The translocation of cytochrome c from mitochondria represents a fundamental step in cellular demise and is implicated in various pathological conditions, including neurodegenerative diseases, cancer, and ischemia-reperfusion injury [49]. Accurate detection of this event is therefore indispensable for researchers and drug development professionals seeking to understand cell death mechanisms and evaluate therapeutic efficacy. Among the most established methods for this purpose are Western blot, enzyme-linked immunosorbent assay (ELISA), and flow cytometry. This guide provides an in-depth technical examination of these three cornerstone techniques, detailing their principles, methodologies, and applications within intrinsic apoptosis research.
The following table summarizes the core attributes, advantages, and limitations of Western blot, ELISA, and flow cytometry for detecting cytochrome c release.
Table 1: Comparison of Traditional Cytochrome c Detection Techniques
| Feature | Western Blot | ELISA | Flow Cytometry |
|---|---|---|---|
| Primary Readout | Semi-quantitative protein presence and cleavage via band intensity [52] | Quantitative concentration measurement via optical density [49] | Quantitative analysis of cytochrome c retention on a per-cell basis [53] |
| Key Strength | Confirms specific protein identity and cleavage events (e.g., PARP); wide accessibility [52] | High throughput; excellent for quantifying cyt c in serum or cell culture supernatants [49] | Single-cell resolution; ability to correlate cyt c release with other parameters (e.g., ΔΨm) [51] |
| Key Limitation | Semi-quantitative; requires cell fractionation; poor sample throughput [54] | Does not provide single-cell information; requires specific antibodies [49] | Requires optimization of permeabilization to distinguish cytosol from mitochondria [53] |
| Ideal Application | Mechanistic studies verifying apoptosis via parallel caspase/PARP activation [52] | Screening serum samples for mitochondrial damage or monitoring therapy response [49] | Heterogeneous cell populations, kinetic studies of release, and multiparametric assays [51] |
| Information Context | Population-average, endpoint analysis | Population-average, quantitative analysis | Single-cell, quantitative, and potentially multiparametric analysis |
Workflow Diagram for Cytochrome c Release Detection
The diagram below illustrates the core decision-making workflow for selecting and applying the three primary detection techniques in cytochrome c research.
Detailed Experimental Protocols
Western Blot for Cytochrome c Detection
Western blotting allows for the specific detection of cytochrome c release through cellular fractionation, separating mitochondrial and cytosolic components.
Table 2: Key Reagents for Western Blot Detection of Cytochrome c
| Reagent / Solution | Function / Purpose |
|---|---|
| Digitonin-based Lysis Buffer | Selectively permeabilizes the plasma membrane without disrupting mitochondria [51]. |
| Protease Inhibitor Cocktail | Prevents degradation of cytochrome c and other proteins during fractionation. |
| Anti-Cytochrome c Antibody | Primary antibody for specific recognition and binding to cytochrome c [52]. |
| Caspase-3 & PARP Antibodies | Apoptosis markers used to confirm activation of the apoptotic cascade alongside cyt c release [52]. |
| HRP-conjugated Secondary Antibody | Binds primary antibody and enables chemiluminescent detection. |
| Chemiluminescent Substrate | Produces light signal upon reaction with HRP, captured on X-ray film or digital imager. |
Protocol:
- Cell Fractionation: Harvest approximately 1-5 x 10^6 cells. Wash with PBS and resuspend in digitonin-based permeabilization buffer (e.g., 100 μg/mL digitonin in PBS) [51]. Incubate on ice for 5-10 minutes. The digitonin selectively perforates the cholesterol-rich plasma membrane, releasing the cytosolic contents.
- Centrifugation: Centrifuge the sample at high speed (e.g., 10,000 x g) for 5 minutes to pellet the intact mitochondria and other organelles.
- Sample Preparation: The supernatant (cytosolic fraction) is collected. The pellet (heavy membrane fraction containing mitochondria) is lysed using a strong RIPA buffer. Both fractions are mixed with Laemmli sample buffer containing β-mercaptoethanol and heated.
- Gel Electrophoresis: Load equal amounts of protein from each fraction onto an SDS-polyacrylamide gel. Separate proteins by electrophoresis.
- Membrane Transfer and Blocking: Transfer proteins from the gel to a nitrocellulose or PVDF membrane. Block the membrane with 5% non-fat milk or BSA in TBST to prevent non-specific antibody binding.
- Antibody Incubation: Incubate the membrane with a primary antibody against cytochrome c. After washing, incubate with an HRP-conjugated secondary antibody. To confirm apoptosis and equal loading, blot for markers like caspase-3 (cleaved form) and a cytosolic protein (e.g., GAPDH or β-actin) as a fractionation purity control [52].
- Detection and Analysis: Develop the blot using a chemiluminescent substrate. The release of cytochrome c is indicated by its presence in the cytosolic fraction and a corresponding decrease in the mitochondrial fraction.
Flow Cytometry for Cytochrome c Release
This protocol enables the quantification of cytochrome c release in individual cells, providing statistical power and the ability to study heterogeneous populations.
Protocol:
- Induction and Harvest: Induce apoptosis in cells and harvest them, keeping samples on ice to halt further biochemical processes.
- Selective Permeabilization: Resuspend cell pellets (2 x 10^4 to 1 x 10^5 cells) in 100 μL of ice-cold permeabilization buffer (e.g., 100 mM KCl with 50-200 μg/mL digitonin in PBS) [53] [51]. Incubate on ice for 3-5 minutes. This critical step allows the cytosolic cytochrome c to leak out of the cell while the mitochondria remain intact.
- Fixation: Immediately add an equal volume of 4% paraformaldehyde (PFA) to the cells and fix for 20 minutes at room temperature. This cross-links and immobilizes the proteins, including any cytochrome c still retained within the mitochondria.
- Immunostaining: Pellet the cells, wash, and permeabilize thoroughly with a detergent like saponin or Triton X-100 to allow antibody access to the mitochondria. Incubate with an anti-cytochrome c primary antibody, followed by a fluorophore-conjugated secondary antibody.
- Flow Cytometric Analysis: Analyze the cells using a flow cytometer. Cells that have undergone cytochrome c release will show low fluorescence intensity, as the protein has been washed away after the initial digitonin step. Cells with intact mitochondria will display high fluorescence [53]. The data is typically presented as a histogram or dot plot, quantifying the percentage of cells with released cytochrome c.
ELISA for Cytochrome c Detection
ELISA is preferred for highly sensitive and quantitative measurement of cytochrome c concentrations, especially in serum or plasma.
Protocol:
- Sample Preparation: Obtain cell culture supernatant, serum, or prepare a cytosolic fraction from lysed cells.
- Plate Coating: Coat the wells of a 96-well plate with a capture antibody specific for cytochrome c.
- Blocking: Block remaining protein-binding sites on the plate with a neutral protein like BSA or casein.
- Sample and Standard Incubation: Add samples and a series of known concentrations of purified cytochrome c (standard curve) to the wells. Incubate to allow cytochrome c to bind to the capture antibody.
- Detection Antibody Incubation: After washing, add a detection antibody (often biotinylated) that binds to a different epitope on the cytochrome c molecule.
- Enzyme Conjugate Incubation: Add an enzyme-conjugated streptavidin (if the detection antibody is biotinylated) or directly an enzyme-conjugated secondary antibody.
- Substrate Addition and Readout: Add a chromogenic or chemiluminescent substrate. The enzymatic reaction produces a color or light signal proportional to the amount of cytochrome c present. Measure the optical density or luminescence with a plate reader and interpolate sample concentrations from the standard curve [49].
Advanced Technical Considerations and Assay Integration
Multiparametric Flow Cytometry Analysis
A significant advantage of flow cytometry is its capacity for multiparametric analysis. Researchers can simultaneously assess cytochrome c release alongside other key apoptotic events to build a comprehensive picture of the cell death process. A common combination is the measurement of cytochrome c retention and mitochondrial membrane potential (ΔΨm). The collapse of ΔΨm is an early event in the intrinsic pathway and can be monitored using cationic dyes like Tetramethylrhodamine Ethyl Ester (TMRE) or JC-1 [51]. Cells undergoing apoptosis will typically show a loss of TMRE fluorescence (indicating depolarization) co-occurring with a loss of cytochrome c immunofluorescence. This dual-parameter analysis can help delineate the sequence of events during mitochondrial dysfunction.
Troubleshooting and Validation
- Specificity of Permeabilization (Flow Cytometry): The concentration of digitonin is critical. Too little fails to permeabilize the plasma membrane, trapping cytochrome c in the cytosol and leading to false negatives. Too much can disrupt mitochondrial membranes, releasing cytochrome c artificially and causing false positives [51]. Each cell type requires optimization, and efficacy should be confirmed using a dye like trypan blue.
- Cellular Fractionation Purity (Western Blot): A common pitfall is cross-contamination between cytosolic and mitochondrial fractions. The purity of the fractionation must be validated by probing the blots for compartment-specific markers, such as GAPDH or β-actin for the cytosol and COX IV or HSP60 for the mitochondria [54].
- Apoptosis Specificity: It is crucial to confirm that cytochrome c release is part of an apoptotic program and not a result of general necrosis. This can be achieved by parallel detection of other apoptotic hallmarks, such as caspase-3 activation or PARP cleavage [52], and by assessing plasma membrane integrity using dyes like propidium iodide.
Western blot, flow cytometry, and ELISA each provide distinct and valuable perspectives for detecting mitochondrial cytochrome c release. The choice of technique is not a matter of which is superior, but which is most appropriate for the specific research question. Western blot offers confirmatory power for protein identity and cleavage events, flow cytometry delivers unparalleled single-cell kinetic data in complex populations, and ELISA provides robust quantitative data ideal for screening and clinical sample analysis. By understanding the principles, protocols, and comparative strengths of these traditional techniques, researchers can effectively design experiments to unravel the complexities of the intrinsic apoptosis pathway and advance therapeutic development.
Cytochrome c is a multifunctional hemoprotein that is fundamentally involved in the intrinsic apoptosis pathway. Under normal physiological conditions, it is sequestered within the mitochondrial intermembrane space, where it functions as an essential electron carrier in the respiratory chain [1]. However, during cellular stress, including that induced by photothermal therapy (PTT) or chemotherapeutic agents, cytochrome c is released from mitochondria through mitochondrial outer membrane permeabilization (MOMP), a process largely controlled by the BCL-2 family of proteins [1]. Once in the cytosol, cytochrome c binds to apoptotic peptidase activator 1 (APAF1), forming the apoptosome complex that activates caspase-9 and initiates the caspase cascade, ultimately leading to apoptotic cell death [1]. Beyond its intracellular apoptotic role, extracellular cytochrome c acts as a damage-associated molecular pattern (DAMP) molecule, alerting the immune system to cellular damage or stress and contributing to inflammatory responses [55] [1].
Understanding the spatial distribution and temporal dynamics of cytochrome c release at the single-cell level provides critical insights into cellular fate decisions and therapeutic efficacy. Surface-enhanced Raman spectroscopy has emerged as a powerful analytical technique that enables researchers to visualize these processes with exceptional sensitivity and spatial resolution, offering significant advantages over traditional detection methods such as ELISA, Western blot, and flow cytometry [55].
SERS Technology Fundamentals and Advantages
Surface-enhanced Raman spectroscopy is a vibrational spectroscopic technique that amplifies the inherently weak Raman scattering signals of molecules adsorbed on or near specially engineered nanostructured metal surfaces. The enhancement mechanisms primarily include electromagnetic enhancement from localized surface plasmon resonance and chemical enhancement from charge-transfer interactions [56]. SERS offers several distinctive advantages for cytochrome c detection and spatial profiling:
- Single-Molecule Sensitivity: Enhancement factors can reach up to 10$^{14}$, enabling detection at the single-molecule level [56] [57].
- Label-Free Detection: SERS can directly probe the intrinsic "fingerprint" spectrum of cytochrome c without requiring fluorescent labels or tags that might alter its biological behavior [55].
- Spatial Resolution: SERS imaging enables mapping of molecular distributions with subcellular resolution, providing insights into localized release patterns [55] [58].
- Multiplexing Capability: The narrow spectral bands of Raman signals allow simultaneous detection of multiple biomarkers [56].
- Real-Time Monitoring: Dynamic SERS techniques enable tracking of molecular processes with microsecond to millisecond temporal resolution [57].
Table 1: Comparison of Cytochrome c Detection Techniques
| Technique | Sensitivity | Spatial Resolution | Label Requirement | Single-Cell Capability |
|---|---|---|---|---|
| SERS | Single-molecule | Subcellular (≈200 nm) | Label-free or labeled | Excellent |
| ELISA/Western Blot | Nanomolar | Population average | Antibody required | No |
| Flow Cytometry | Single-cell | Cellular level | Fluorescent labels | Good |
| Confocal Fluorescence | Single-molecule | Diffraction-limited (≈250 nm) | Fluorescent labels | Excellent |
Experimental Platform: 3D Bifunctional SERS Substrate
A groundbreaking approach for spatial profiling of cytochrome c release utilizes a three-dimensional (3D) bifunctional plasmonic nanostructure that integrates both photothermal conversion capability and SERS detection functionality [55]. This innovative substrate enables in situ induction of apoptosis and simultaneous monitoring of cytochrome c release patterns at the single-cell level.
Substrate Design and Fabrication
The 3D bifunctional substrate consists of two distinct nanoparticle layers that work synergistically:
- Upper Layer: A gold octahedral (AuNO) monolayer optimized for superior SERS detection capability, providing enhanced electromagnetic "hotspots" for signal amplification [55].
- Lower Layer: A gold nanorod@palladium concave cuboid (AuNR@Pd) monolayer engineered to exhibit substantial photothermal effects under laser irradiation [55].
These two nanostructured layers are coupled through surface plasmon interactions, creating a unified platform capable of both inducing apoptosis through localized heating and detecting the subsequent cytochrome c release with high spatial resolution. The substrate can be fabricated as a flexible patch for in vivo applications, enabling spatial mapping of cytochrome c released from apoptotic tumor tissues during photothermal therapy [55].
Experimental Workflow for Cytochrome c Spatial Profiling
The complete experimental procedure for spatial profiling of cytochrome c release encompasses substrate preparation, cell culture, apoptosis induction, and SERS detection, as illustrated below:
Validation with Mitochondrial Targeting Nanoprobes
To confirm the extracellular release pattern of cytochrome c, researchers have employed mitochondrial targeting SERS nanoprobes functionalized with mitochondria-localization sequences (MLS) [55]. These nanoprobes, such as GERTs@MLS, allow for in situ monitoring of the simultaneous release of both the nanoprobe and cytochrome c during apoptosis, providing direct evidence of mitochondrial origin and validating the release mechanism [55].
Key Research Findings and Quantitative Data
SERS-based spatial profiling has yielded significant insights into cytochrome c release dynamics and patterns. The quantitative data obtained through this approach reveals critical aspects of apoptotic processes at the single-cell level.
Table 2: Spatial Profiling Data of Cytochrome c Release
| Parameter | Finding | Experimental Condition | Significance |
|---|---|---|---|
| Release Pattern | Isotropic distribution from individual apoptotic cells | Photothermal stress | Consistent with diffusion-based release mechanism |
| Spatial Resolution | Subcellular level (single-cell resolution) | 3D bifunctional substrate | Reveals heterogeneity in release patterns |
| Cell Line Variability | Distinct release profiles between different cell lines | Comparison of two cancer cell lines | Highlights cell-type specific apoptosis mechanisms |
| Release Timing | Early event in apoptosis, preceding caspase activation | UVB or staurosporine induction [59] | Confirms cytochrome c as initiator rather than consequence |
| In Vivo Detection | Successful spatial mapping in tumor tissues | Flexible patch during PTT | Demonstrates clinical translation potential |
The Scientist's Toolkit: Essential Research Reagents and Materials
Successful implementation of SERS-based cytochrome c profiling requires carefully selected materials and reagents, each serving specific functions in the experimental workflow.
Table 3: Essential Research Reagents and Materials
| Reagent/Material | Function | Specifications | Application Context |
|---|---|---|---|
| Gold Octahedrals (AuNO) | SERS-active nanostructures | 80-150 nm diameter, monolayer formation | Upper layer of 3D substrate for signal enhancement |
| Gold Nanorod@Pd (AuNR@Pd) | Photothermal conversion elements | Specific LSPR in NIR region | Lower layer for apoptosis induction |
| Mitochondrial Targeting SERS Nanoprobes (GERTs@MLS) | Validation of release origin | Conjugated with mitochondria-localization sequences | Co-localization studies with cytochrome c |
| Cell Culture Media | Maintenance of cell viability | Cell-type specific formulations | In vitro models for apoptosis studies |
| Raman Reporter Molecules | Signal generation | Resonance matching with laser excitation | SERS signal amplification |
| Flexible Polymer Substrate | In vivo applications | Biocompatible, conformable material | Tumor tissue analysis during photothermal therapy |
Signaling Pathways and Molecular Interactions
The role of cytochrome c in apoptosis involves complex molecular interactions and signaling pathways that can be visualized through the following diagram:
Technical Considerations and Methodological Optimization
Successful implementation of SERS-based cytochrome c profiling requires careful attention to several technical aspects:
Substrate Optimization
The 3D bifunctional substrate requires precise engineering to balance photothermal conversion efficiency and SERS enhancement capability. Correlation studies between the 3D nanostructure and bifunctional properties should be conducted alongside electrodynamics calculations to optimize performance [55]. Key parameters include nanoparticle size, shape, interparticle spacing, and plasmonic coupling between layers.
Spectral Processing and Data Analysis
SERS imaging generates complex hyperspectral datasets that require sophisticated processing:
- Background Subtraction: Removal of autofluorescence and non-specific signals
- Spectral Unmixing: Deconvolution of overlapping spectral features
- Multivariate Analysis: Principal component analysis (PCA) for pattern recognition
- Image Reconstruction: Conversion of spectral data into spatial distribution maps
Experimental Validation
Controls and validation experiments are essential for interpreting SERS data:
- Specificity Verification: Use of mitochondrial co-localization probes to confirm cytochrome c origin
- Quantification Standards: calibration curves for semi-quantitative analysis
- Comparative Methods: Parallel analysis with established techniques (e.g., Western blot) when feasible
Future Perspectives and Applications
The integration of SERS-based spatial profiling of cytochrome c with emerging technologies opens new avenues for apoptosis research and therapeutic development. Future directions include:
- Multiplexed Biomarker Detection: Simultaneous monitoring of multiple apoptosis-related proteins
- High-Throughput Screening: Adaptation for drug discovery applications
- Correlative Microscopy: Combination with electron microscopy for ultrastructural context
- Machine Learning Integration: Advanced pattern recognition in complex cellular populations
- Clinical Translation: Intraoperative assessment of treatment efficacy during cancer therapy
SERS-based spatial profiling represents a powerful methodology that provides unprecedented insights into cytochrome c dynamics during apoptosis, bridging the gap between bulk biochemical assays and single-cell biology while offering potential applications in basic research, drug development, and clinical diagnostics.
The release of cytochrome c from mitochondria into the cytosol is a decisive event in the intrinsic apoptosis pathway, serving as a critical point of no return for programmed cell death. This technical guide provides researchers and drug development professionals with advanced methodologies for monitoring this process in real-time using live-cell imaging. We detail experimental protocols for visualizing cytochrome c dynamics, present quantitative data on key cellular responses, and outline the molecular machinery governing its release. By integrating recent findings on inner mitochondrial membrane remodeling and apoptotic effectors, this whitepaper establishes a comprehensive framework for investigating mitochondrial regulation of cell death with high spatiotemporal precision.
The intrinsic apoptosis pathway represents a genetically encoded programme of cellular suicide crucial for development, tissue homeostasis, and disease pathogenesis, particularly in cancer and neurodegeneration. Mitochondria function as central signaling hubs in this pathway, integrating diverse death stimuli including DNA damage, oxidative stress, and growth factor withdrawal. A pivotal event in this process is the mitochondrial outer membrane permeabilization (MOMP), which facilitates the release of several pro-apoptotic proteins from the mitochondrial intermembrane space into the cytosol. Among these, cytochrome c plays an essential role: once released, it binds to Apaf-1, forming the apoptosome complex that activates caspase-9 and initiates a proteolytic cascade leading to orderly cellular dismantling [5] [33].
Historically, cytochrome c release was considered an irreversible consequence of mitochondrial permeability transition. However, evidence now indicates this process can be finely regulated and, under specific conditions, even reversible, highlighting the dynamic nature of mitochondrial control over cell fate decisions [33]. Contemporary research has elucidated that cytochrome c release involves a sophisticated multi-step process including: (1) mobilization from cristae where approximately 85% of cytochrome c is sequestered through electrostatic interactions with cardiolipin, (2) permeabilization of the outer mitochondrial membrane via BAX/BAK pore formation, and (3) remodeling of the inner mitochondrial membrane (IMM) architecture [24] [5]. Recent discoveries have identified novel regulators such as LACTB, a filament-forming serine protease and tumor suppressor that promotes apoptosis-induced IMM remodeling independent of OPA1 processing, thereby facilitating cytochrome c release [24]. This guide details methodologies for capturing these dynamic processes in living cells, providing unprecedented insight into the spatiotemporal regulation of apoptotic signaling.
Molecular Mechanisms of Cytochrome c Release
Core Apoptotic Machinery
The release of cytochrome c is orchestrated by coordinated actions of BCL-2 family proteins and mitochondrial membrane remodeling factors:
BAX/BAK Pore Formation: Pro-apoptotic BCL-2 proteins BAX and BAK undergo activation and oligomerization at the outer mitochondrial membrane, forming macropores that permit the passage of cytochrome c and other intermembrane space proteins [60] [61]. This process, termed mitochondrial outer membrane permeabilization (MOMP), represents a committed step in apoptosis execution.
Inner Mitochondrial Membrane Remodeling: The serine beta-lactamase-like protein (LACTB) has been identified as a critical regulator of IMM dynamics during apoptosis. This filament-forming serine protease and tumor suppressor promotes apoptosis-induced mitochondrial remodeling independent of OPA1 processing, facilitating the release of cytochrome c and other apoptotic factors [24].
Cardiolipin-Cytochrome c Interactions: Cytochrome c is normally sequestered within mitochondrial cristae through electrostatic binding to cardiolipin, an anionic phospholipid abundant in the IMM. During apoptosis, these interactions are disrupted, mobilizing cytochrome c for release through BAX/BAK pores [5].
Ceramide Signaling: Ceramides, bioactive sphingolipids, contribute to MOMP through multiple mechanisms including potential direct channel formation in the outer membrane and facilitation of BAX/BAK activation. Mitochondria-targeted photocaged ceramides can trigger BAX-dependent apoptosis upon UV illumination, demonstrating their direct apoptogenic activity at mitochondrial membranes [62].
The following diagram illustrates the key molecular events in cytochrome c release during intrinsic apoptosis:
Advanced Imaging Reveals Mitochondrial Remodeling
High-resolution live-cell imaging has uncovered dramatic mitochondrial remodeling during apoptosis that extends beyond MOMP. Following initial BAX/BAK pore formation, further oligomerization creates arcs and macropores through which the inner mitochondrial membrane herniates into the cytosol [61]. This herniation exposes the IMM to the cytoplasm, triggering a unique form of mitophagy independent of PINK1/Parkin signaling that may function as a quality control mechanism to contain damaged mitochondria and prevent inflammatory responses [61]. The visualization of these complex membrane dynamics requires sophisticated imaging approaches detailed in subsequent sections.
Experimental Protocols for Live-Cell Imaging
Cell Line Engineering and Cytochrome c Labeling
Generation of Cytochrome c Reporter Cell Lines
Fluorescent Protein Tagging: Create cytochrome c fusion constructs by inserting coding sequences for fluorescent proteins (e.g., GFP, mCherry, YFP) at the N- or C-terminus of cytochrome c via molecular cloning. Consider using tandem tags (e.g., cytochrome c-GFP-mCherry) to simultaneously monitor localization and caspase activation through differential fluorescence quenching.
Stable Cell Line Development: Transduce HeLa, U2-OS, or other relevant cell lines using lentiviral or retroviral delivery systems for consistent, low-level expression. Select clones with moderate expression (2-5× endogenous levels) using antibiotic resistance (e.g., puromycin, G418) to avoid overexpression artifacts that may alter apoptotic thresholds.
Validation Steps: Confirm mitochondrial localization in untreated cells via co-staining with Mitotracker dyes or mitochondrial-targeted fluorescent proteins (e.g., Mito-GFP, TOMM20-Halo). Verify apoptotic function by comparing caspase activation kinetics and cell death progression to wild-type cells following staurosporine treatment (1 μM, 2-8 hours) [24] [33].
Multi-Color Organelle Staining for Contextual Imaging
Mitochondrial Membrane Staining: Utilize MitoTracker Red CMXRos (100-500 nM, 15-30 min loading) for active mitochondria or MitoTracker Green FM (50-250 nM, 15-30 min) for total mitochondrial mass, followed by washout and recovery in fresh medium before imaging.
Nuclear Counterstaining: Incorporate Hoechst 33342 (1-5 μg/mL) or DAPI (0.5-2 μg/mL) for nuclear morphology assessment during apoptosis, particularly to observe chromatin condensation and nuclear fragmentation.
Caspase Activity Reporters: Express FRET-based caspase sensors (e.g., SCAT3, NucView) to correlate cytochrome c release with downstream caspase activation in real-time.
Apoptosis Induction and Imaging Conditions
Controlled Apoptosis Induction Protocols
- Kinetic Optimization for Imaging: Based on quantitative studies, optimal imaging windows for cytochrome c release typically occur 30 minutes to 6 hours post-induction, depending on the stimulus and cell type [24]. The table below summarizes response kinetics across common induction methods:
Table 1: Temporal Dynamics of Cytochrome c Release Following Apoptotic Stimuli
| Induction Method | Mechanism of Action | Onset of Cytochrome c Release | Completion Window | Caspase Dependence |
|---|---|---|---|---|
| Staurosporine (1 μM) | Broad-spectrum kinase inhibitor | 2-4 hours | 4-8 hours | Caspase-dependent [24] |
| ABT-737/S63845 combination | BCL-2/MCL-1 inhibition | 30-60 minutes | 2-4 hours | Partially caspase-independent [24] |
| Raptinal (10-50 μM) | Direct mitochondrial perturbation | 5-15 minutes | 30-60 minutes | Caspase-dependent [63] |
| UV-induced ceramide uncaging | Direct mitochondrial ceramide release | 2-5 minutes post-UV | 15-30 minutes | Caspase-dependent [62] |
- Caspase Inhibition Strategies: To isolate early mitochondrial events from downstream demolition phases, utilize pan-caspase inhibitors such as Q-VD-OPh (10-20 μM) added 30-60 minutes prior to apoptosis induction. This approach prevents cell detachment and preserves membrane integrity during extended imaging sessions while allowing cytochrome c release to proceed [24] [61].
Live-Cell Imaging Configuration
Environmental Control: Maintain cells at 37°C with 5% CO₂ using stage-top incubators throughout imaging. For CO₂-independent imaging, utilize pre-equilriched medium with 25 mM HEPES buffer.
Temporal Resolution Optimization: For capturing rapid cytochrome c release events (e.g., with Raptinal or ceramide uncaging), employ acquisition rates of 1-5 frames/minute. For slower processes (e.g., staurosporine-induced apoptosis), 1 frame/2-5 minutes suffices to capture dynamics while minimizing phototoxicity.
Multi-Position Imaging: Implement automated stage control to monitor multiple fields simultaneously, increasing statistical power while capturing potential cell-to-cell heterogeneity in apoptotic responses.
Advanced Perturbation Experiments
Genetic Manipulation of Apoptotic Regulators
LACTB Modulation: To investigate IMM remodeling mechanisms, perform LACTB knockdown (>90% efficiency achieved with lentiviral shRNA) or stable overexpression in reporter cell lines [24]. Validate modulation via Western blotting and assess impacts on cytochrome c release kinetics and mitochondrial morphology.
BAX/BAK Deficiency: Utilize BAX/BAK double-knockout cell lines (e.g., Mcl1-/- MEFs) as negative controls to confirm specificity of cytochrome c release observations [61]. These cells should resist cytochrome c release despite apoptotic stimulation.
Mitochondria-Targeted Photoactivation
- Caged Ceramide Compounds: Employ mitochondria-targeted photocaged ceramides (e.g., cgMito-cCer6) that accumulate inertly in mitochondria until UV illumination (365 nm, 30-60 seconds) triggers localized ceramide release, enabling spatiotemporally precise apoptosis induction in subcellular regions [62].
Quantitative Analysis of Cytochrome c Dynamics
Image Processing and Feature Extraction
The transition from punctate mitochondrial to diffuse cytosolic fluorescence distribution serves as the primary quantitative metric for cytochrome c release. Implement the following analytical pipeline:
Background Subtraction: Apply rolling-ball algorithm or morphological top-hat filters to correct for uneven illumination and background fluorescence.
Mitochondrial Segmentation: Use machine learning classifiers (e.g., Random Forest, U-Net) trained on MitoTracker or TOMM20 signals to generate binary mitochondrial masks. Alternatively, employ intensity-based thresholding (e.g., Otsu's method) for rapid segmentation.
Cytosolic Region Definition: Create cytosolic masks by dilating mitochondrial masks by 5-10 pixels, then subtracting the original mitochondrial regions.
Colocalization Analysis: Calculate Mander's overlap coefficients between cytochrome c fluorescence and mitochondrial masks over time. Release events are defined by coefficients dropping below 0.7-0.8 from initial values >0.9.
Kinetic Parameter Extraction
From time-lapse data, extract the following quantitative parameters to characterize cytochrome c release dynamics:
Release Onset Time: Time from stimulus application to first significant decrease in mitochondrial cytochrome c signal (>10% decrease from baseline).
Release Half-Time (t₁/₂): Time from stimulus application to 50% decrease in mitochondrial cytochrome c signal.
Release Duration: Time between 10% and 90% decrease in mitochondrial cytochrome c signal.
Cell-to-Cell Variability: Coefficient of variation in release timing across isogenic cell populations under identical conditions.
Table 2: Quantitative Effects of Genetic and Pharmacological Perturbations on Cytochrome c Release
| Experimental Condition | Impact on Release Kinetics | Effect on Apoptosis Completion | Technical Considerations |
|---|---|---|---|
| LACTB Knockdown | Delayed release (t₁/₂ increased ~40%) [24] | Reduced apoptotic efficiency [24] | High knockdown efficiency (>90%) required for robust phenotype |
| LACTB Overexpression | Accelerated release (t₁/₂ decreased ~30%) [24] | Enhanced apoptotic sensitivity [24] | Moderate overexpression prevents artifacts |
| Caspase Inhibition (Q-VD-OPh) | No significant effect on timing [24] | Blocks downstream execution | Essential for prolonged imaging without cell detachment |
| Ceramide Uncoupling | Rapid release (t₁/₂ < 10 minutes) [62] | Complete apoptosis induction | Requires precise UV illumination controls |
| BAX/BAK DKO | Abolished release [61] | Complete apoptosis resistance | Validates specificity of observed events |
The Scientist's Toolkit: Essential Research Reagents
Table 3: Key Reagents for Live-Cell Imaging of Cytochrome c Dynamics
| Reagent Category | Specific Examples | Function/Application | Considerations |
|---|---|---|---|
| Apoptosis Inducers | Staurosporine (1 μM), ABT-737 (1 μM)/S63845 (1 μM) combination, Raptinal (10-50 μM) | Activate intrinsic pathway through distinct mechanisms | Varying kinetics; ABT-737/S63845 requires BAX/BAK [24] [63] |
| Caspase Inhibitors | Q-VD-OPh (10-20 μM), Z-VAD-FMK (20-50 μM) | Block downstream execution phase; preserve cell integrity during imaging | Q-VD-OPh shows superior efficacy and reduced toxicity [24] |
| Mitochondrial Dyes | MitoTracker Red CMXRos, MitoTracker Green FM, TMRM | Label mitochondrial compartments and monitor membrane potential | CMXRos is potential-dependent; Green FM is potential-independent |
| Genetic Tools | LACTB shRNA/overexpression constructs, BAX/BAK DKO cells, Cytochrome c-FP fusions | Perturb specific pathway components; visualize localization | Confirm expression levels and functionality via Western blot [24] |
| Advanced Probes | Mitochondria-targeted photocaged ceramides (cgMito-cCer6), mtKeima | Spatiotemporally precise apoptosis induction; monitor mitophagy | Ceramide uncaging requires UV illumination setup [62] [61] |
| Analysis Software | FlowJo (with UMAP/t-SNE plugins), ImageJ with TrackMate, Imaris, CellProfiler | High-dimensional data analysis; single-cell tracking and quantification | Algorithm selection depends on data complexity and throughput needs [64] |
Integrated Workflow for Comprehensive Analysis
The following diagram illustrates a complete experimental workflow from sample preparation to data analysis:
Technical Considerations and Troubleshooting
Optimization of Signal-to-Noise Ratio
Photobleaching Mitigation: Implement optimized exposure times (100-500 ms typically) and use neutral density filters to limit photodamage while maintaining sufficient signal. Consider using spinning disk confocal systems for improved optical sectioning with reduced out-of-focus fluorescence.
Focus Stabilization: Employ hardware autofocus systems (e.g., Nikon Perfect Focus, ZDC technology) to maintain consistent focal plane during extended acquisitions, particularly when imaging through cell death-associated morphological changes.
Validation of Physiological Relevance
Expression Level Verification: Confirm that cytochrome c fusion proteins do not exceed 2-5× endogenous levels through quantitative Western blotting to prevent artifactual kinetics from buffer overload effects.
Functional Apoptosis Confirmation: Always parallel imaging experiments with standard apoptosis assays (e.g., annexin V staining, caspase activity measurements, Western blotting for PARP cleavage) to confirm that observed cytochrome c release correlates with authentic apoptotic progression [24] [33].
Advanced Correlative Approaches
For unprecedented structural insights, combine live-cell imaging with complementary techniques:
Correlative Light and Electron Microscopy (CLEM): Identify cells undergoing cytochrome c release via fluorescence imaging, then process for EM to visualize ultrastructural changes in mitochondrial membrane architecture at nanoscale resolution [60].
Single-Molecule Imaging: Utilize TIRF or PALM/STORM microscopy to visualize individual BAX/BAK oligomerization events and their correlation with cytochrome c release patterns in real-time [60].
Live-cell imaging of cytochrome c translocation provides a powerful window into the fundamental processes governing cellular life and death decisions. The methodologies outlined in this technical guide enable researchers to capture the dynamic remodeling of mitochondrial membranes and the coordinated molecular events that commit cells to apoptosis. By integrating quantitative imaging approaches with genetic, biochemical, and pharmacological perturbations, investigators can dissect the complex regulatory networks controlling cytochrome c release with unprecedented temporal and spatial resolution. These advanced techniques continue to reveal new dimensions of mitochondrial biology, from the tumor suppressor functions of LACTB in inner membrane remodeling to the spatiotemporally controlled apoptogenic activity of mitochondrial ceramides. As imaging technologies advance toward higher resolution, greater speed, and reduced phototoxicity, our ability to visualize and understand these fundamental processes in health and disease will continue to expand, offering new opportunities for therapeutic intervention in cancer, neurodegeneration, and other pathologies linked to dysregulated apoptosis.
The study of the intrinsic apoptosis pathway, particularly the release of cytochrome c (Cyt c) from mitochondria, is a cornerstone of cancer biology and therapeutic development. Cytochrome c serves as a critical switch, functioning as an essential electron carrier in the mitochondrial respiratory chain under normal conditions and transforming into a potent apoptotic trigger when released into the cytosol [65]. The release of Cyt c into the extracellular space during apoptosis also functions as a damage-associated molecular pattern (DAMP), alerting the immune system to cellular stress or damage [55]. Despite its fundamental importance, effective methodologies for studying the spatial distribution and dynamics of Cyt c release in its native context have remained limited, creating a significant technological gap in apoptosis research.
Traditional detection methods such as enzyme-linked immunosorbent assay (ELISA), Western blot, and flow cytometry, while specific and sensitive, provide only population-averaged data and lack the spatial resolution and capability for in situ monitoring at the single-cell level [55]. This limitation has hindered a deeper understanding of the heterogeneity of apoptotic responses and the precise mechanisms by which Cyt c influences neighboring cells and tissue microenvironments.
The integration of photothermal therapy (PTT) with advanced spectroscopic detection represents a paradigm shift in this field. PTT is a non-invasive cancer treatment that induces tumor cell apoptosis through localized heat generation [55] [66]. When combined with surface-enhanced Raman spectroscopy (SERS)—a molecular vibrational "fingerprinting" technique with single-molecule sensitivity—researchers can now achieve unprecedented spatial and temporal resolution in monitoring apoptotic events [55] [67]. This technical guide explores the development, application, and significance of novel 3D bifunctional substrates that seamlessly integrate photothermal induction with SERS detection, offering researchers a powerful tool for investigating the intrinsic apoptosis pathway.
Technical Foundation and Substrate Design
The 3D Bifunctional SERS Substrate: Architecture and Components
The 3D bifunctional substrate represents a sophisticated nano-architectural platform engineered to simultaneously provide optimized photothermal conversion efficiency and enhanced SERS detection capabilities. This substrate is constructed through the assembly of upper and lower nanostructured layers that work in concert through surface plasmon coupling effects [55].
Table 1: Components of the 3D Bifunctional SERS Substrate
| Component | Composition | Primary Function | Key Characteristics |
|---|---|---|---|
| Upper Layer | Gold octahedral (AuNO) monolayer | SERS detection | Superior SERS activity, provides enhanced electromagnetic fields for signal amplification |
| Lower Layer | Gold nanorod@palladium concave cuboid (AuNR@Pd) monolayer | Photothermal induction | Strong localized surface plasmon resonance (LSPR), substantial photothermal conversion efficiency |
| 3D Structure | Coupled nanoparticle layers | Functional integration | Synergistic plasmonic coupling, enables simultaneous heating and detection |
The unique design of the AuNR@Pd nanostructures in the lower layer retains strong localized surface plasmon resonance in the near-infrared region, making them exceptionally efficient for photothermal conversion [55]. Meanwhile, the AuNO monolayer in the upper layer creates the enhanced electromagnetic fields necessary for sensitive SERS detection. This vertical integration creates a functional synergy that enables real-time monitoring of photothermally induced biological processes, including Cyt c release during apoptosis.
Quantitative Performance Characteristics
The performance of the 3D bifunctional substrate has been rigorously characterized to establish its capabilities for both photothermal induction and spectroscopic detection.
Table 2: Quantitative Performance Metrics of the 3D Bifunctional Substrate
| Parameter | Performance Metric | Experimental Significance |
|---|---|---|
| Photothermal Conversion Efficiency | Substantial and optimized | Enables efficient induction of apoptosis at the single-cell level under photothermal stress |
| SERS Enhancement Factor | Exceptional sensitivity enabling single-molecule detection | Allows label-free mapping of spatial Cyt c distribution with subcellular resolution |
| Spatial Resolution | Subcellular level | Reveals isotropic Cyt c release patterns from individual apoptotic cells |
| In Vivo Application | Flexible patch integration | Enables in situ spatial mapping of Cyt c released from apoptotic tumor tissues during PTT |
The substrate's bifunctionality is further demonstrated through its application in validating extracellular Cyt c release patterns using a mitochondrial targeting SERS nanoprobe (GERTs@MLS), which allows for in situ monitoring of the simultaneous release of the nanoprobe and Cyt c during apoptosis [55]. This co-release validation confirms that the detected Cyt c originates specifically from mitochondrial release during apoptosis rather than other cellular compartments or processes.
Experimental Protocols and Methodologies
Substrate Fabrication and Characterization Protocol
Objective: To synthesize and characterize the 3D bifunctional plasmonic nanostructure with both photothermal and SERS detection capabilities.
Materials:
- Chloroauric acid (HAuCl₄) for gold nanostructure synthesis
- Palladium precursors for AuNR@Pd formation
- Capping agents and surfactants for shape-controlled synthesis
- Substrate materials (e.g., glass coverslips or flexible polymer patches)
Procedure:
- Synthesis of AuNR@Pd Nanostructures:
- Prepare gold nanorods using seed-mediated growth methods
- Perform palladium deposition on AuNR surfaces through controlled reduction
- Characterize the resulting AuNR@Pd structures using TEM and UV-Vis-NIR spectroscopy to confirm retention of strong LSPR in the NIR region
Fabrication of AuNO Monolayer:
- Synthesize gold octahedral nanoparticles via colloidal chemistry approaches
- Assemble nanoparticles into a monolayer using self-assembly techniques at interfaces
- Verify monolayer integrity and uniformity through SEM imaging
3D Substrate Assembly:
- Stack the upper (AuNO) and lower (AuNR@Pd) nanostructured layers
- Engineer the interlayer distance to optimize plasmonic coupling effects
- Validate the coupled architecture through correlated SEM and optical measurements
Bifunctional Performance Validation:
- Quantify photothermal conversion efficiency by measuring temperature increase under NIR laser irradiation
- Determine SERS enhancement factors using standard Raman reporters (e.g., crystal violet, rhodamine 6G)
- Correlate nanostructure geometry with functional properties through electrodynamics calculations
Validation Metrics:
- TEM confirmation of nanostructure morphology
- UV-Vis-NIR spectroscopy verifying plasmonic properties
- SERS enhancement factor calculation (>10⁷ typically required for single-molecule detection)
- Photothermal conversion efficiency measurement
Single-Cell Cytochrome c Release Monitoring Protocol
Objective: To achieve in situ spatial profiling of Cyt c release at the single-cell level under photothermal stress.
Materials:
- 3D bifunctional SERS substrate
- Appropriate cell lines (e.g., cancer cells for therapy models)
- Cell culture media and standard tissue culture reagents
- Mitochondrial targeting SERS nanoprobe (GERTs@MLS) for validation [55]
- Raman microscope with appropriate laser excitation sources
- NIR laser system for photothermal induction
Procedure:
- Cell Culture on 3D Substrate:
- Seed cells directly onto the 3D bifunctional substrate at appropriate density
- Allow cells to adhere and grow under standard culture conditions (37°C, 5% CO₂) for 24-48 hours
- For validation studies, pre-load cells with mitochondrial targeting SERS nanoprobe
Photothermal Induction of Apoptosis:
- Apply controlled NIR laser irradiation to induce localized hyperthermia
- Optimize irradiation parameters (power density, exposure time) to achieve temperatures in the range of 45-55°C to trigger apoptosis without causing immediate necrosis [66]
- Monitor temperature in real-time using infrared thermal imaging or incorporated temperature sensors
SERS Monitoring and Spatial Mapping:
- Acquire SERS spectra from multiple points around single cells using a Raman microscope with 532 nm or 785 nm laser excitation
- Collect spatial mapping data by scanning the laser in a grid pattern with submicron resolution
- Record time-series measurements to capture release dynamics
- Identify Cyt c-specific Raman bands (750 cm⁻¹, 1127 cm⁻¹, 1313 cm⁻¹, 1371 cm⁻¹, 1585 cm⁻¹) [67] [65]
Data Analysis and Validation:
- Process raw SERS spectra to remove background and cosmic rays
- Generate spatial distribution maps by integrating intensity of characteristic Cyt c Raman bands
- Validate extracellular Cyt c release by confirming co-localization with mitochondrial nanoprobe signal
- Compare release patterns between different cell lines to investigate cell-type specific variability
Key Parameters:
- Laser power density: 0.1-1.0 mW/μm² for SERS detection
- Integration time: 0.1-1.0 seconds per spectrum for spatial mapping
- Spatial resolution: <500 nm for subcellular mapping
- Characteristic Cyt c bands: 750 cm⁻¹ (redox-sensitive), 1127 cm⁻¹ (C-N stretching), 1313 cm⁻¹ (oxidation marker), 1371 cm⁻¹ (oxidation marker), 1585 cm⁻¹ (redox-sensitive) [67]
Diagram 1: Cyt c in Intrinsic Apoptosis
In Vivo Monitoring Using Flexible Patch Platform
Objective: To achieve in situ spatial mapping of Cyt c released from apoptotic tumor tissues during in vivo photothermal therapy.
Materials:
- Flexible patch integrated with 3D bifunctional SERS substrate
- Animal tumor model (e.g., murine xenograft)
- In vivo imaging system
- NIR laser system with appropriate fiber optics for in vivo PTT
Procedure:
- Flexible Patch Fabrication:
- Integrate the 3D bifunctional substrate onto a biocompatible flexible polymer
- Ensure conformal contact with tumor tissue while maintaining substrate functionality
- Validate patch flexibility and SERS performance under bending conditions
In Vivo Application:
- Surgically implant or topically apply the flexible patch to establish contact with tumor tissue
- Administer in vivo PTT using NIR laser irradiation through the patch or adjacent delivery
- Perform real-time SERS measurements through integrated optics or direct patch interrogation
Data Correlation and Analysis:
- Correlate SERS-based Cyt c detection with traditional apoptosis markers (e.g., TUNEL staining)
- Map spatial distribution of Cyt c release across tumor regions
- Correlate extracellular Cyt c levels with therapeutic response and immune activation
Validation:
- Histological confirmation of apoptosis in patch-contacting regions
- Comparison with serum Cyt c levels as a conventional apoptosis marker [68]
- Correlation with therapeutic outcomes and tumor regression
The Scientist's Toolkit: Essential Research Reagents and Materials
Table 3: Research Reagent Solutions for 3D Bifunctional Substrate Experiments
| Category | Reagent/Material | Function/Application | Technical Notes |
|---|---|---|---|
| Substrate Components | Gold octahedral nanoparticles | SERS-active upper layer | Optimized for electromagnetic enhancement |
| Gold nanorod@Pd concave cuboids | Photothermal lower layer | Strong NIR absorption for efficient heating | |
| Flexible polymer patches | In vivo substrate platform | Enables conformal contact with tumor tissues | |
| Cell Culture | Appropriate cell lines | Apoptosis models | Select based on research focus (e.g., cancer type) |
| Mitochondrial targeting SERS nanoprobe (GERTs@MLS) | Release validation | Co-released with Cyt c during apoptosis [55] | |
| Characterization | Raman microscope with 532/785 nm lasers | SERS detection | Essential for spatial mapping capabilities |
| NIR laser system (e.g., 808 nm) | Photothermal induction | Controlled apoptosis triggering | |
| TEM/SEM instrumentation | Nanostructure characterization | Quality control of substrate fabrication |
Diagram 2: Experimental Workflow
Research Implications and Future Directions
The development of 3D bifunctional substrates integrating photothermal induction with SERS detection represents a significant advancement in apoptosis research methodology. This technology enables unprecedented spatial and temporal resolution in monitoring cytochrome c release dynamics, providing researchers with a powerful tool to investigate fundamental aspects of the intrinsic apoptosis pathway.
The ability to perform in situ monitoring at the single-cell level reveals cellular heterogeneity in apoptotic responses that would be obscured by population-averaging conventional techniques [55]. Furthermore, the spatial mapping capabilities of this technology provide insights into how released Cyt c distributes in the extracellular environment and potentially influences neighboring cells through paracrine signaling [55]. The detection of extracellular Cyt c is particularly relevant as it functions as a damage-associated molecular pattern (DAMP) molecule, engaging toll-like receptor 4 (TLR4) and its downstream c-Jun N-terminal kinase (JNK) pathway to activate immune cells [55].
From a therapeutic perspective, the integration of this technology into a flexible patch platform for in vivo applications [55] opens new possibilities for monitoring treatment responses in real-time during photothermal therapy. The correlation of Cyt c release patterns with therapeutic outcomes could provide valuable biomarkers for treatment optimization and personalization.
Future developments in this technology will likely focus on enhancing the multiplexing capabilities to simultaneously monitor multiple apoptotic markers, improving the penetration depth for in vivo applications, and increasing the throughput for drug screening applications. As these technical advancements progress, 3D bifunctional substrates are poised to become an indispensable tool in the apoptosis researcher's toolkit, providing unprecedented insights into the spatiotemporal dynamics of cell death signaling.
High-Content Screening Approaches for Compound Library Evaluation
High-content screening (HCS) represents an advanced phenotypic screening technique that integrates automated microscopy with quantitative image analysis to evaluate the effects of chemical or genetic perturbations on cells [69]. Unlike traditional high-throughput screening (HTS), which rapidly tests large compound libraries against single targets using simple activity counts, HCS captures rich, image-based phenotypic data that provides deeper biological insights and mechanistic information about cellular responses [69]. This approach enables researchers to extract multidimensional data indicating changes in cell morphology, protein expression and localization, and metabolite levels from thousands of cells simultaneously [69]. The compatibility of HCS with various biological models—including immortalized cell lines, primary cells, induced pluripotent stem cells (iPSCs), and increasingly, 3D organoids that better mimic physiological environments—makes it particularly valuable for contemporary drug discovery pipelines [69].
Within the specific context of intrinsic apoptosis pathway research, HCS provides powerful tools for investigating mitochondrial cytochrome c release, a pivotal event in the apoptotic cascade. The ability to simultaneously monitor multiple parameters, including mitochondrial membrane potential, cytochrome c localization, caspase activation, and cellular morphology, makes HCS ideally suited for quantifying the complex, multi-stage process of intrinsic apoptosis [33] [5]. Recent advances in image acquisition and analysis have established HCS as an essential component of the drug discovery process, though its full potential in antiviral drug discovery remains underutilized compared to conventional fluorescence or luminescence-based microplate assays [70].
HCS Technological Foundations and Workflow
Imaging Modalities and Instrumentation
High-content screening traditionally relies on fluorescence microscopy, where cellular components are tagged with fluorescent dyes or proteins to visualize biological processes such as protein localization, cell cycle progression, or apoptosis [69]. Multiplexed fluorescence imaging allows simultaneous detection of multiple markers, providing rich, multidimensional datasets from single samples [69]. In contrast, label-free imaging approaches, including phase-contrast or brightfield microscopy, capture cellular morphology and dynamics without external probes, simplifying sample preparation and minimizing phototoxicity for live-cell imaging and longitudinal studies [69].
Confocal microscopy represents another key HCS modality, enhancing image resolution and depth discrimination through optical sectioning to eliminate out-of-focus light [69]. This capability is particularly valuable for visualizing 3D cell models such as spheroids or organoids, where spatial organization and intracellular localization are crucial for interpreting biological effects [69]. Automation is central to all HCS workflows, with robotic microscopes, plate readers, liquid handlers, and motorized stages streamlining sample preparation and capturing thousands of images per experiment with minimal human intervention [69]. These instruments ensure consistent exposure, focus, and field of view across samples, which is critical for reproducible image analysis [69].
HCS Workflow and Data Management
The standard HCS workflow encompasses multiple stages, from study design and sample preparation to data acquisition, processing, and analysis [71]. Effective management of this workflow requires robust metadata standards to ensure findable, accessible, interoperable, and reusable (FAIR) data sharing practices [71]. The Minimum Information for High Content Screening Microscopy Experiments (MIHCSME) has been developed as a metadata model and reusable tabular template that combines the ISA (Investigations, Studies, Assays) metadata standard with a semantically enriched instantiation of REMBI (Recommended Metadata for Biological Images) [71]. This framework enables broader integration with other experimental data types, paving the way for visual omics and multi-omics integration [71].
The OMERO database, specifically designed to manage bioimaging experiment data, has become the de facto standard for storing bioimaging data, with numerous installations globally [71]. The Open Microscopy Environment (OME) standard, which OMERO is based on, enables images from different microscope manufacturers to be ingested and exchanged in common formats [71]. This standardization is essential for establishing reproducible HCS workflows that can be reliably deployed across different laboratories and research initiatives.
Table 1: Key Stages in High-Content Screening Workflows
| Workflow Stage | Key Activities | Technologies & Standards |
|---|---|---|
| Study Design | Experimental definition, assay development, plate planning | MIHCSME metadata template, ISA framework |
| Sample Preparation | Cell culture, compound treatment, fluorescent labeling | Liquid handlers, multiplexed dyes (e.g., Cell Painting) |
| Image Acquisition | Automated microscopy, multi-site imaging | Robotic microscopes, confocal systems, OME-TIFF format |
| Image Analysis | Segmentation, feature extraction, phenotypic classification | CellProfiler, convolutional neural networks, deep learning |
| Data Management | Metadata annotation, data storage, sharing | OMERO database, REMBI guidelines, FAIR principles |
HCS Applications in Intrinsic Apoptosis Research
Monitoring Cytochrome c Release Dynamics
High-content screening provides powerful approaches for investigating cytochrome c release during intrinsic apoptosis, a process fundamentally important for both basic research and drug discovery [33] [5]. In healthy cells, cytochrome c is located in the mitochondrial intermembrane and intercristae spaces, where it functions as an electron shuttle in the respiratory chain and interacts with cardiolipin [5]. Various proapoptotic stimuli induce permeabilization of the mitochondrial outer membrane, facilitate communication between intermembrane and intercristae spaces, and promote mobilization of cytochrome c from cardiolipin, enabling its release into the cytosol [5]. Once in the cytosol, cytochrome c mediates the allosteric activation of apoptosis-protease activating factor 1 (Apaf-1), which is required for proteolytic maturation of caspase-9 and caspase-3, ultimately leading to apoptotic cell dismantling [5].
Research using sympathetic neurons has demonstrated that cytochrome c release during apoptosis occurs without mitochondrial swelling and can be a controlled process compatible with functional recovery [33]. When NGF-deprived sympathetic neurons were protected from apoptosis by caspase inhibitors, their mitochondria, though depleted of cytochrome c and reduced in size, remained structurally intact according to electron microscopy [33]. After re-exposure to NGF, these mitochondria recovered their normal size and cytochrome c content through a process requiring de novo protein synthesis [33]. These findings suggest that cytochrome c depletion from mitochondria is a regulated process that may be reversible under certain conditions, with important therapeutic implications for acute neuropathologies [33].
Multiparametric Apoptosis Assays
High-content screening enables simultaneous monitoring of multiple apoptotic parameters, providing comprehensive insights into the complex regulation of cell death. Key apoptotic features measurable by HCS include mitochondrial transmembrane potential dissipation, caspase activation, plasma membrane alterations, and DNA fragmentation [72]. The ability to correlate these different cellular events at a single-cell level through multiparameter measurements represents a significant advantage over traditional bulk analysis techniques [72].
Flow cytometry, often integrated with HCS workflows, provides sensitive detection of early apoptotic events through assessment of mitochondrial transmembrane potential (Δψm) using fluorescent lipophilic cationic probes such as tetramethylrhodamine methyl ester (TMRM) [72]. These probes are readily taken up by live cells and accumulate in energized mitochondria, with uptake intensity proportional to cellular Δψm status [72]. Similarly, fluorochrome-labeled inhibitors of caspases (FLICA) allow estimation of apoptosis by detecting active caspases, while Annexin V conjugates identify phosphatidylserine externalization on the plasma membrane [72]. When combined with plasma membrane permeability markers like propidium iodide, these assays can distinguish consecutive stages of apoptosis within heterogeneous cell populations [72].
Table 2: Key Apoptotic Parameters Measurable by High-Content Screening
| Parameter | Detection Method | Biological Significance |
|---|---|---|
| Cytochrome c Release | Immunofluorescence, subcellular fractionation | Indicator of mitochondrial outer membrane permeabilization in intrinsic apoptosis |
| Mitochondrial Membrane Potential (Δψm) | TMRM, JC-1 staining | Early apoptotic event preceding cytochrome c release |
| Caspase Activation | FLICA reagents, antibody detection | Execution phase of apoptosis; confirms functional caspase activation |
| Phosphatidylserine Externalization | Annexin V conjugates | Early marker of apoptosis; detected before membrane permeability changes |
| DNA Fragmentation | TUNEL assay, sub-G1 analysis | Late apoptotic marker indicating endonuclease activation |
| Nuclear Morphology Changes | DNA-binding dyes (Hoechst, DAPI) | Chromatin condensation and nuclear fragmentation |
Artificial Intelligence in HCS Data Analysis
AI-Enhanced Image Analysis
Artificial intelligence, particularly machine learning and deep learning methods, has revolutionized the analysis of complex HCS datasets [69] [73]. These computational approaches streamline complex image analyses, improve segmentation and feature extraction in heterogeneous samples, and facilitate clustering and pattern recognition across massive datasets [69]. Consequently, researchers can correlate cellular responses to therapeutic outcomes with reduced human bias and processing time, accelerating the evaluation of promising drug candidates [69].
Machine learning-based image analysis enables the extraction of quantitative phenotypic features from various imaging modalities [69]. Once images are captured, segmentation separates them into meaningful regions containing individual cells or subcellular structures using AI-based models like convolutional neural networks (CNNs) [69]. From these segmented regions, hundreds of features can be extracted, ranging from shape, size, and texture to signal intensity and spatial organization [69]. These quantitative features form the foundation for downstream statistical analysis and phenotype classification [72]. Increasingly, deep learning approaches are capable of recognizing and extracting image characteristics that go beyond human-defined features, with the extracted features aggregated into profiles using unbiased methods according to biologically meaningful similarities [73].
Phenotypic Profiling and Compound Screening
AI-powered high-content screening plays an increasingly important role in phenotypic profiling, enabling researchers to detect subtle cellular changes in response to compounds or genetic perturbations [69]. While traditional phenotypic profiling relies on predefined biomarkers, machine learning models can learn complex morphological patterns directly from image data [69]. This capability paves the way for unbiased phenotypic profiling, where cellular states are characterized based on global morphology, texture, and spatial organization rather than predetermined markers [69].
The Cell Painting assay represents one of the most common HCS approaches for morphological profiling [73]. This assay uses six fluorescent dyes to label eight different cellular components—including the nucleus, endoplasmic reticulum, Golgi apparatus, mitochondria, lysosomes, endosomes, and cytoskeleton—capturing thousands of metrics and features in imaged cells [73]. Compared to specialized conventional HCS assays that can take months or years to develop, Cell Painting provides a ready-to-use solution for comprehensive and unbiased data capture that can be scaled to test hundreds of thousands of compounds [73]. The standardized nature of Cell Painting facilitates data sharing, combination, and repurposing by different research teams for various applications [73].
Experimental Protocols for Apoptosis-Focused HCS
Protocol: Monitoring Cytochrome c Release and Mitochondrial Morphology
This protocol outlines a multiplexed approach for investigating cytochrome c release and mitochondrial changes during intrinsic apoptosis using high-content screening.
Materials:
- Cells of interest (e.g., primary neurons, HeLa, or other relevant cell lines)
- Apoptotic inducers (e.g., Raptinal [63], staurosporine, or other compounds)
- Anti-cytochrome c antibody (monoclonal, e.g., from PharMingen [33])
- Fluorescent secondary antibodies
- Mitochondrial dyes (e.g., TMRM [72], MitoTracker)
- Nuclear stain (e.g., Hoechst 33342)
- Cell culture reagents and multi-well plates suitable for imaging
- Formaldehyde (4%) and permeabilization buffer (0.2% Triton X-100 in PBS)
- Blocking solution (5% normal goat serum in PBS)
Procedure:
- Cell Preparation and Treatment: Plate cells in multi-well imaging plates at appropriate density and allow to adhere overnight. Treat cells with apoptotic inducers for various timepoints. Include untreated controls and caspase inhibitor controls (e.g., 100 μM BAF [33]) where appropriate.
Staining:
- For fixed endpoint studies: Fix cells with 4% formaldehyde for 15 minutes, permeabilize with 0.2% Triton X-100 for 10 minutes, and block with 5% normal goat serum for 1 hour.
- Incubate with anti-cytochrome c antibody (1:15 dilution [33]) for 2 hours at room temperature.
- Wash and incubate with appropriate fluorescent secondary antibody for 1 hour.
- Counterstain with nuclear dye (e.g., Hoechst) for 10 minutes.
For live-cell studies: Load cells with TMRM (1 μM working solution [72]) for 20 minutes at 37°C to monitor mitochondrial membrane potential.
Image Acquisition: Acquire images using a high-content imaging system with appropriate filters for each fluorophore. Capture multiple fields per well to ensure adequate cell numbers for statistical analysis.
Image Analysis:
- Segment individual cells based on nuclear staining.
- Identify mitochondrial regions using cytochrome c signal or specific mitochondrial markers.
- Quantify cytochrome c release by measuring the transition from punctate mitochondrial pattern to diffuse cytosolic distribution [33].
- Measure mitochondrial morphology parameters (size, fragmentation, interconnectivity).
- Correlate cytochrome c localization with mitochondrial membrane potential changes.
Protocol: Multiparametric Apoptosis Assessment
This protocol enables simultaneous monitoring of multiple apoptotic parameters using a combination of fluorescent probes.
Materials:
- Cell suspension (2.5×10⁵ – 2×10⁶ cells/mL [72])
- 1× PBS
- TMRM probe (1 mM stock in DMSO, stored at -20°C [72])
- FLICA reagent (FAM-VAD-FMK, reconstituted in DMSO, stored at -20°C [72])
- Annexin V-FITC or Annexin V-APC conjugate (stored at +4°C [72])
- Propidium iodide (PI) stock solution (50 μg/mL in PBS, stored at +4°C [72])
- Annexin V Binding Buffer (AVBB: 10 mM HEPES/NaOH pH 7.4, 140 mM NaCl, 2.5 mM CaCl₂ [72])
Procedure:
- Mitochondrial Membrane Potential (Δψm) Assessment:
- Collect cell suspension by centrifugation (5 min, 1100 rpm).
- Resuspend cell pellet in 100 μL of TMRM staining mix (1 μM TMRM in PBS).
- Incubate 20 min at 37°C protected from light.
- Add 500 μL PBS and analyze by flow cytometry or image-based cytometry using 488 nm excitation and 575 nm emission collection [72].
Caspase Activation Detection (FLICA Assay):
- Collect cells by centrifugation and resuspend in 100 μL PBS.
- Add 3 μL of FLICA working solution (5× dilution of reconstituted stock in PBS).
- Incubate 60 min at 37°C, gently agitating every 20 minutes.
- Wash with 2 mL PBS and centrifuge.
- Resuspend in 100 μL of PI staining mix (5 μg/mL PI in PBS).
- Incubate 3-5 min, add 500 μL PBS, and analyze using 488 nm excitation with emission collection appropriate for FITC and PI [72].
Phosphatidylserine Externalization (Annexin V Assay):
- Collect cells by centrifugation and resuspend in 100 μL of Annexin V Binding Buffer.
- Add Annexin V-FITC or Annexin V-APC conjugate according to manufacturer's instructions.
- Incubate 15 min at room temperature protected from light.
- Add 400 μL AVBB and 10 μL of PI staining mix.
- Analyze within 1 hour using appropriate fluorescence channels [72].
Research Reagent Solutions for Apoptosis HCS
Table 3: Essential Research Reagents for Apoptosis-Focused High-Content Screening
| Reagent Category | Specific Examples | Function in Apoptosis Research |
|---|---|---|
| Cytochrome c Detection | Anti-cytochrome c monoclonal antibody [33] | Immunofluorescence detection of cytochrome c release from mitochondria |
| Mitochondrial Function Probes | TMRM [72], JC-1, MitoTracker | Assessment of mitochondrial membrane potential (Δψm) dissipation |
| Caspase Activity Detection | FLICA reagents (FAM-VAD-FMK) [72] | Detection of caspase activation in early apoptosis |
| Plasma Membrane Markers | Annexin V conjugates [72] | Detection of phosphatidylserine externalization |
| Viability Indicators | Propidium iodide [72], SYTOX dyes | Discrimination of membrane integrity and cell viability status |
| Nuclear Stains | Hoechst 33342, DAPI | Assessment of nuclear morphology changes and DNA fragmentation |
| Apoptosis Inducers | Raptinal [63], staurosporine | Positive controls for rapid intrinsic apoptosis induction |
| Caspase Inhibitors | BAF (Boc-aspartyl(Ome)-fluoromethylketone) [33] | Tool compounds for validating caspase-dependent mechanisms |
Signaling Pathways and Experimental Workflows
High-content screening represents a powerful platform for compound library evaluation, particularly within the context of intrinsic apoptosis pathway research. The ability to simultaneously monitor multiple cellular parameters—including cytochrome c release, mitochondrial membrane potential dissipation, caspase activation, and morphological changes—provides unprecedented insights into the complex regulation of programmed cell death [33] [5] [72]. The integration of artificial intelligence and machine learning approaches is revolutionizing HCS data analysis, enabling more accurate segmentation, unbiased feature extraction, and enhanced phenotypic classification [69] [73]. These computational advances, combined with standardized assays such as Cell Painting and robust data management frameworks like MIHCSME and OMERO, are accelerating the application of HCS in drug discovery pipelines [71] [73].
As HCS technologies continue to evolve, several emerging trends promise to further enhance their utility for apoptosis research and compound screening. These include the development of more physiologically relevant 3D cell models, improved label-free imaging techniques, and increasingly sophisticated AI algorithms capable of identifying subtle phenotypic patterns beyond human perception [69]. The recent identification of rapid apoptosis inducers such as Raptinal, which triggers intrinsic pathway caspase-dependent apoptosis within minutes, highlights how specialized compounds can serve as both valuable research tools and potential therapeutic candidates [63]. By leveraging these advanced HCS approaches, researchers can continue to unravel the complexities of mitochondrial cytochrome c release and apoptosis regulation, ultimately facilitating the development of novel therapeutics for cancer, neurodegenerative diseases, and other conditions characterized by dysregulated cell death.
The intrinsic apoptosis pathway is a precisely regulated form of programmed cell death essential for maintaining tissue homeostasis and eliminating damaged cells. Its dysregulation is a hallmark of cancer, enabling malignant cells to survive and proliferate uncontrollably. A pivotal event in this pathway is the mitochondrial outer membrane permeabilization (MOMP), which leads to the release of cytochrome c and other pro-apoptotic factors from the mitochondrial intermembrane space into the cytosol [74] [75]. Cytochrome c then binds to Apoptotic Protease-Activating Factor 1 (Apaf-1), forming the "apoptosome" complex that activates caspase-9, initiating a cascade of executioner caspases that ultimately lead to cell death [74] [76].
Targeting the intrinsic pathway to restore apoptosis in cancer cells is a cornerstone of modern oncotherapeutics. However, conventional treatments are often burdened with side effects and the emergence of resistance [74] [77]. This has spurred the investigation of natural compounds as alternative or adjunctive inducers of apoptosis. Plant extracts and specific phytochemicals represent a rich source of bioactive molecules capable of modulating key checkpoints in the mitochondrial pathway, offering multi-targeted actions and often lower toxicity profiles [74] [78] [77]. This whitepaper synthesizes current preclinical evidence on how these natural inducers, with a focus on plant extracts and oxysterols, trigger cytochrome c release, framing their potential within the broader context of targeted cancer therapy and drug discovery.
Molecular Mechanisms of Plant Extracts and Bioactive Compounds
Plant-derived compounds exert their pro-apoptotic effects through diverse and often overlapping mechanisms, directly targeting the delicate balance of proteins governing mitochondrial integrity.
Regulation of the Bcl-2 Protein Family
The Bcl-2 family of proteins are critical arbiters of mitochondrial apoptosis. Natural compounds can shift this balance in favor of cell death by downregulating anti-apoptotic members (e.g., Bcl-2, Bcl-xL) and/or upregulating or activating pro-apoptotic members (e.g., Bax, Bak) [74] [76] [75]. For instance, the triterpenoid Ganoleuconin O, isolated from Ganoderma leucocontextum, was shown to upregulate Bax and downregulate Bcl-2 in liver cancer cells (Huh7.5 line), thereby promoting cytochrome c release [76]. Similarly, Lupeol, a pentacyclic triterpenoid found in fruits, induced mitochondrial fission and apoptosis in renal cell carcinoma by tilting the dynamic balance towards the pro-apoptotic proteins [76].
Induction of Oxidative Stress
Many phytochemicals exhibit hormetic behavior, acting as antioxidants at low doses but inducing pro-oxidant effects in cancer cells, which already operate under elevated oxidative stress [79]. This heightened reactive oxygen species (ROS) level can trigger the intrinsic pathway. Research on terpenes like carvacrol, thymol, eugenol, and lycopene demonstrated that their senolytic (killing of senescent cells) and anticancer activity is associated with a significant increase in ROS. Pre-incubation with the antioxidant glutathione partially rescued cell viability, confirming oxidative stress as a central trigger for apoptosis [79]. ROS can directly damage mitochondria, leading to membrane permeabilization and cytochrome c release.
Modulation of Metabolic and Transcriptional Regulators
Cancer stem cells (CSCs) and other resilient cell populations often rely on unique metabolic adaptations for survival. Natural compounds can disrupt this delicate balance. For example, they can target key transcriptional orchestrators of CSC metabolism like HIF-1α, c-Myc, and PGC-1α [78]. By inhibiting HIF-1α, compounds can reverse the glycolytic reprogramming (Warburg effect) common in tumors. Targeting c-Myc disrupts its dual role in promoting both glycolysis and mitochondrial biogenesis. This multi-targeted modulation alters the metabolic phenotype of CSCs, making them susceptible to apoptosis [78].
Direct Effects on Mitochondrial Membrane Permeability and Structure
Some compounds directly compromise mitochondrial function. Ganoleuconin O was observed to change the shape and size of mitochondria, fragment mitochondrial cristae, decrease ATP production, and reduce the amount of cardiolipin, a phospholipid vital for mitochondrial membrane structure and function [76]. The dissipation of mitochondrial membrane potential (ΔΨm) is a common downstream consequence of these actions, which is a key step preceding cytochrome c release [76].
Table 1: Natural Compounds and Their Mechanisms in Inducing Mitochondrial Apoptosis
| Compound / Extract | Class | Reported Mechanism of Action | Experimental Model |
|---|---|---|---|
| Ganoleuconin O [76] | Triterpenoid | ↑ Bax, ↓ Bcl-2; ΔΨm loss; cytochrome c release; cardiolipin reduction; cristae fragmentation | Huh7.5 liver cancer cells |
| Lupeol [76] | Triterpenoid | Alters mitochondrial dynamics towards fission; ΔΨm loss | SK-RC-45 renal cell carcinoma cells |
| Terpenes (Carvacrol, Thymol, etc.) [79] | Monoterpenes / Tetraterpene | ↑ ROS; BAX activation; cytochrome c release; AIF translocation | Senescent Mesenchymal Stromal Cells (MSCs) |
| Curcumin, Resveratrol [78] | Polyphenols | Target CSC pathways (Wnt, Notch); modulate HIF-1α, c-Myc; sensitize to chemo/radiotherapy | Various preclinical CSC models |
| Plant Extracts (Mixed) [74] | Various Phytochemicals | Pro-apoptotic, anti-proliferative, antiangiogenic, immunomodulatory activities | Broad in vitro and in vivo studies |
The following diagram illustrates the core intrinsic apoptosis pathway and the points of intervention by various natural compounds, summarizing the mechanisms described above.
Diagram 1: Mechanism of Natural Compounds in Intrinsic Apoptosis. This diagram illustrates how cellular stress induced by natural compounds converges on mitochondrial outer membrane permeabilization (MOMP), leading to cytochrome c release and apoptosis. Key steps include Bcl-2 protein family imbalance, oxidative stress, direct mitochondrial damage, and metabolic dysregulation.
Experimental Protocols for Assessing Cytochrome c Release
To evaluate the efficacy of natural compounds as inducers of the intrinsic pathway, a multi-faceted experimental approach is required. The following protocols detail key methodologies used in preclinical models.
In Vitro Assessment Using Cell Culture Models
1. Induction of Senescence or Stress:
- Protocol: To study senolytic effects, induce senescence in human Mesenchymal Stromal Cells (MSCs) by treating with 300 µM H₂O₂ for 30 minutes in complete medium. Replace with fresh medium and incubate for 48-72 hours to establish senescence [79].
- Application: This model is useful for testing compounds like terpenes that selectively eliminate senescent cells, which share apoptotic resistance mechanisms with cancer cells.
2. Measurement of Mitochondrial Membrane Potential (ΔΨm):
- Protocol: Use fluorescent dyes such as JC-1 or Tetramethylrhodamine, Ethyl Ester (TMRE). JC-1 forms red fluorescent aggregates in healthy mitochondria, which shift to green fluorescent monomers upon ΔΨm loss. Load treated cells with JC-1 (2-5 µM) for 15-30 minutes at 37°C, wash, and analyze by flow cytometry or fluorescence microscopy. A decrease in the red/green fluorescence ratio indicates ΔΨm dissipation [76].
- Application: This is a early and reliable indicator of mitochondrial integrity compromise preceding cytochrome c release.
3. Detection of Cytochrome c Release:
- Protocol: Perform subcellular fractionation to separate cytosolic and mitochondrial fractions. Lyse cells with a digitonin-based buffer to gently permeabilize the plasma membrane and collect the cytosolic fraction. Subsequently, lyse the remaining cell material with a stronger detergent (e.g., Triton X-100) to obtain the mitochondrial fraction. Analyze both fractions for cytochrome c presence via Western Blotting. Alternatively, use immunofluorescence staining in fixed cells with antibodies against cytochrome c and a mitochondrial marker (e.g., COX IV); a diffuse cytosolic staining pattern indicates release [79] [76].
- Application: This is the definitive assay for confirming the key event of intrinsic apoptosis.
4. Analysis of Apoptotic Executors:
- Protocol: To confirm downstream apoptosis, assess the activation of caspase-9 and caspase-3 using fluorometric or colorimetric activity assays. These kits use specific substrates that release a chromophore or fluorophore upon cleavage by the active enzyme. Additionally, detect the cleavage of endogenous substrates like Poly (ADP-ribose) polymerase (PARP) by Western Blotting [79] [75].
- Application: Validates that cytochrome c release leads to successful initiation of the caspase cascade.
The workflow for a typical in vitro experiment is visualized below.
Diagram 2: In Vitro Workflow for Apoptosis Induction. This flowchart outlines a standard experimental sequence for evaluating the pro-apoptotic effects of natural compounds, from initial treatment and viability screening to detailed mechanistic studies of mitochondrial pathway activation.
Advanced Preclinical Models
1. Cancer Stem Cell (CSC) Models:
- Protocol: Enrich CSCs from established cancer cell lines (e.g., MCF-7, MDA-MB-231 for breast cancer) through sphere-forming assays under non-adherent, serum-free conditions. Treat these tumorspheres with natural compounds like curcumin or resveratrol and assess the reduction in CSC markers (e.g., CD44+, ALDH+ population via flow cytometry) and impairment of secondary sphere formation, indicating loss of self-renewal capacity [78].
- Application: Evaluates the compound's efficacy against the therapy-resistant CSC subpopulation.
2. Xenograft Models:
- Protocol: Immunocompromised mice (e.g., NOD/SCID) are subcutaneously injected with human cancer cells or patient-derived cells to form tumors. Animals are then treated with the natural compound (e.g., via oral gavage or intraperitoneal injection) alone or in combination with standard chemotherapeutics. Monitor tumor volume and harvest tumors for immunohistochemical analysis of apoptosis (TUNEL staining) and cytochrome c localization [78].
- Application: Provides in vivo validation of antitumor efficacy and apoptosis induction in a physiological context.
The Scientist's Toolkit: Key Research Reagent Solutions
Successful investigation into natural compound-induced apoptosis relies on a suite of specialized reagents and tools. The following table details essential items for a research protocol.
Table 2: Essential Research Reagents for Investigating Mitochondrial Apoptosis
| Reagent / Kit | Function / Application | Key Details / Considerations |
|---|---|---|
| JC-1 Dye [76] | Fluorescent probe for measuring mitochondrial membrane potential (ΔΨm). | Forms aggregates (red) in polarized mitochondria, monomers (green) upon depolarization. Ratio (red/green) is key metric. |
| Anti-Cytochrome c Antibody | Detects cytochrome c release via immunofluorescence (IF) or Western blot (WB) after subcellular fractionation. | Critical for confirming the central event of intrinsic apoptosis. |
| Caspase-9 & Caspase-3 Activity Assay Kits [75] | Fluorometric or colorimetric measurement of caspase enzyme activity in cell lysates. | Confirms downstream activation of the apoptotic cascade following cytochrome c release. |
| Anti-Bax / Anti-Bcl-2 Antibodies [76] [75] | Western blot analysis to quantify expression levels of pro- and anti-apoptotic Bcl-2 family proteins. | Assesses the balance of regulatory proteins controlling MOMP. |
| Cell Viability Assay Kits (e.g., MTT, MTS) | Initial screening for compound cytotoxicity and anti-proliferative effects. | Provides a first-line assessment of biological activity. |
| ROS Detection Probes (e.g., DCFH-DA, MitoSOX) [79] | Measures intracellular or mitochondrial-specific reactive oxygen species levels. | Determines if oxidative stress is a contributing mechanism. |
| Senescence-Associated β-Galactosidase (SA-β-Gal) Staining Kit [79] | Histochemical detection of senescent cells in culture (blue precipitate at pH 6.0). | Essential for establishing and validating senescence models before senolytic testing. |
| Annexin V-FITC / Propidium Iodide (PI) Apoptosis Kit | Flow cytometry-based method to distinguish early apoptotic (Annexin V+/PI-), late apoptotic (Annexin V+/PI+), and necrotic (Annexin V-/PI+) cells. | Quantifies the percentage of cells undergoing apoptosis. |
The efficacy of natural compounds is quantified through various parameters in preclinical models. The table below consolidates key quantitative findings from the reviewed literature.
Table 3: Quantitative Data from Preclinical Studies of Natural Compounds
| Compound / Extract | Reported Efficacy / Effect | Experimental Model & Notes |
|---|---|---|
| Terpenes (Carvacrol, Thymol, Eugenol, Lycopene) [79] | Induction of apoptosis in senescent MSCs via ROS increase; effect partially rescued by glutathione. | Human senescent Mesenchymal Stromal Cells (MSCs). Demonstrates caspase-dependent and -independent (AIF translocation) mechanisms. |
| Ganoleuconin O [76] | Decreased ATP production in a dose- and time-dependent manner; ↓ Bcl-2, ↑ Bax, ΔΨm loss, cytochrome c release. | Huh7.5 liver cancer cells. Shows direct impact on mitochondrial energy production and structure. |
| Lupeol [76] | Promoted mitochondrial fission; decreased mitochondrial network parameters (mean length, network size, footprint). | SK-RC-45 renal cell carcinoma cells. Quantitative analysis of mitochondrial morphology via Fiji/ImageJ. |
| Curcumin, Resveratrol, Sulforaphane [78] | Reduced CSC fractions (ALDH+, CD44+); impaired tumorsphere formation; enhanced chemosensitivity. | Various xenograft and genetically engineered models. Highlights multi-targeted action against resistant cell populations. |
| Plant Extracts (General) [74] | Proapoptotic, antiproliferative, antiangiogenic, and immunomodulatory activities demonstrated across numerous studies. | Broad in vitro and in vivo evidence. Underpins the "multi-targeted" therapeutic potential. |
The compelling body of preclinical evidence underscores the significant potential of plant extracts and their constituent compounds as potent inducers of the intrinsic apoptotic pathway. Their ability to trigger mitochondrial cytochrome c release through mechanisms like Bcl-2 family modulation, ROS induction, and direct mitochondrial targeting offers a multi-pronged strategy to combat cancer, including therapy-resistant populations like CSCs [74] [78] [76]. The experimental frameworks and tools outlined provide a roadmap for rigorous investigation.
Future research must prioritize overcoming challenges related to the bioavailability, precise dosing, and potential herb-drug interactions of these complex natural mixtures [74] [77]. Furthermore, integrating these compounds into rational combinatorial regimens with conventional chemotherapeutics or radiotherapy represents a promising frontier in precision oncology [78]. By systematically validating their efficacy and safety in advanced preclinical models and clinical trials, natural compounds can transition from traditional remedies to established, evidence-based allies in the ongoing fight against cancer.
The intrinsic apoptotic pathway is a genetically programmed cell death process crucial for maintaining tissue homeostasis and eliminating damaged cells. This pathway is centrally regulated by the B-cell lymphoma-2 (BCL-2) protein family, which controls the pivotal event of mitochondrial outer membrane permeabilization (MOMP) [9] [80]. Upon cellular stress signals such as DNA damage or oxidative stress, pro-apoptotic BCL-2 family members become activated, leading to MOMP and the release of cytochrome c (Cyt c) from the mitochondrial intermembrane space into the cytosol [5] [81]. Once in the cytosol, cytochrome c binds to Apoptotic Protease-Activating Factor 1 (Apaf-1), forming the apoptosome complex which activates caspase-9 and initiates a cascade of caspase activation, ultimately executing programmed cell death [82] [83]. Simultaneously, another mitochondrial protein called Second Mitochondria-derived Activator of Caspases (SMAC) is released, which counteracts the inhibitory effects of Inhibitor of Apoptosis Proteins (IAPs) on caspases, thereby further promoting the apoptotic process [84] [85]. Cancer cells frequently exploit this pathway by overexpressing anti-apoptotic proteins to evade cell death, making the therapeutic restoration of apoptosis a promising anticancer strategy [86] [83] [9].
Core Molecular Mechanisms
BCL-2 Protein Family: Gatekeepers of Mitochondrial Apoptosis
The BCL-2 protein family constitutes the primary regulatory circuit governing mitochondrial apoptosis and consists of three functional subgroups [9] [80]:
- Anti-apoptotic proteins (BCL-2, BCL-XL, MCL-1, BCL-w, BFL-1, and BCL-B) contain four BCL-2 homology (BH) domains (BH1-BH4) and preserve mitochondrial integrity by sequestering pro-apoptotic members [83] [9].
- Pro-apoptotic effector proteins (BAX, BAK, and BOK) contain three BH domains (BH1-BH3) and directly execute MOMP through oligomerization and pore formation in the outer mitochondrial membrane [80].
- BH3-only proteins (BIM, BID, BAD, PUMA, NOXA, etc.) sense cellular damage and initiate apoptosis by either activating BAX/BAK directly or neutralizing anti-apoptotic proteins [83] [80].
In healthy cells, anti-apoptotic proteins bind and inhibit pro-apoptotic members. Cellular stress activates BH3-only proteins, which disrupt this balance by binding to anti-apoptotic proteins, thereby freeing pro-apoptotic BAX and BAK to form permeabilizing pores in the mitochondrial outer membrane [9] [80]. This leads to the release of cytochrome c and other apoptotic factors, committing the cell to death.
Cytochrome c and SMAC: Mitochondrial Apoptotic Activators
Following MOMP, mitochondrial proteins that are normally confined to the intermembrane space are released into the cytosol, where they activate downstream apoptotic machinery [5].
Cytochrome c is a nuclear-encoded hemoprotein normally localized in the mitochondrial intermembrane space, where it functions as an essential electron shuttle in the respiratory chain [5] [81]. Upon MOMP, cytochrome c is released into the cytosol and binds to Apaf-1, triggering apoptosome formation and initiating the caspase cascade [5] [83].
SMAC/DIABLO is another crucial mitochondrial protein released concurrently with cytochrome c [84]. Its primary function is to promote caspase activation by binding to and neutralizing IAPs, particularly XIAP, which directly inhibits caspase-3, -7, and -9 [82] [84]. By eliminating IAP inhibition, SMAC facilitates robust caspase activation and apoptotic execution.
Table 1: Key Mitochondrial Pro-apoptotic Factors Released During Apoptosis
| Factor | Normal Localization | Function After Release | Molecular Targets |
|---|---|---|---|
| Cytochrome c | Mitochondrial intermembrane space | Forms apoptosome with Apaf-1 | Apaf-1, procaspase-9 |
| SMAC/DIABLO | Mitochondrial intermembrane space | Neutralizes IAP inhibition | XIAP, cIAP1, cIAP2 |
| AIF | Mitochondrial intermembrane space | Caspase-independent DNA fragmentation | DNA |
| Omi/HtrA2 | Mitochondrial intermembrane space | Protease activity and IAP inhibition | IAPs |
IAP Proteins: Negative Regulators of Apoptosis
Inhibitor of Apoptosis Proteins function as crucial brakes on the apoptotic process. The major IAP family members include XIAP, cIAP1, and cIAP2 [82]. XIAP directly binds to and inhibits active caspase-3, -7, and -9, while cIAP1 and cIAP2 primarily function as E3 ubiquitin ligases that regulate NF-κB signaling and indirectly influence apoptosis [82]. The release of SMAC from mitochondria during apoptosis counteracts IAP-mediated inhibition by binding to IAP proteins and displacing their interaction with caspases, thereby promoting apoptotic execution [84] [85].
Therapeutic Targeting Strategies
BCL-2 Inhibitors: BH3 Mimetics
BCL-2 inhibitors, known as BH3 mimetics, are small molecules designed to mimic the function of native BH3-only proteins by binding to the hydrophobic groove of anti-apoptotic BCL-2 family proteins, thereby disrupting their interaction with pro-apoptotic partners and restoring apoptosis in cancer cells [86] [9].
Table 2: Developed BCL-2 Inhibitors in Cancer Therapy
| Compound | Molecular Targets | Development Status | Primary Cancer Applications |
|---|---|---|---|
| Venetoclax (ABT-199) | BCL-2 | FDA-approved | CLL, AML, other hematologic malignancies |
| Navitoclax (ABT-263) | BCL-2, BCL-XL, BCL-w | Phase 1/2 clinical trials | NHL, CLL, SCLC |
| Obatoclax (GX15-070) | BCL-2, BCL-XL, BCL-w, MCL-1 | Phase 1/2 clinical trials | Hematologic malignancies, NSCLC |
| APG-2575 (Lisaftoclax) | BCL-2 | Phase 1/2 clinical trials | Hematologic cancers |
| S55746 (BCL201) | BCL-2 | Phase 1 clinical trials | Hematologic cancers |
| AZD4320 | BCL-2, BCL-XL | Preclinical development | Hematologic cancers, mesothelioma |
| AT-101 | BCL-2, BCL-XL, BCL-w, MCL-1 | Phase 1/2 clinical trials | Various cancers |
Venetoclax represents the first highly selective BCL-2 inhibitor approved for clinical use. It effectively displaces pro-apoptotic proteins like BIM from BCL-2, triggering mitochondrial apoptosis in cancer cells dependent on BCL-2 for survival [86]. While venetoclax has demonstrated remarkable efficacy in hematological malignancies like chronic lymphocytic leukemia (CLL) and acute myeloid leukemia (AML), its application in solid tumors remains challenging due to tumor heterogeneity and acquired resistance mechanisms [86] [9].
Resistance to BCL-2 inhibitors often emerges through various mechanisms, including upregulation of alternative anti-apoptotic proteins like MCL-1 or BCL-XL, mutations in BCL-2 that reduce drug binding, and deregulation of pro-apoptotic proteins [86] [9]. Current research focuses on developing next-generation BCL-2 inhibitors with improved selectivity profiles and combination strategies to overcome resistance.
SMAC Mimetics: IAP Antagonists
SMAC mimetics are synthetic small molecules designed to mimic the N-terminal tetrapeptide of native SMAC protein, which enables them to bind to and antagonize IAP proteins [82] [85]. These compounds promote apoptosis through two primary mechanisms:
Direct caspase activation: By binding to XIAP, SMAC mimetics displace caspases from IAP-mediated inhibition, allowing for unimpeded caspase activation and apoptotic execution [82].
Induction of cIAP autodegradation: SMAC mimetics trigger the auto-ubiquitination and proteasomal degradation of cIAP1 and cIAP2, which leads to non-canonical NF-κB pathway activation and TNF-α production. In sensitive cells, this creates an autocrine/paracrine loop that activates extrinsic apoptosis through caspase-8 [85].
The efficacy of SMAC mimetics as single agents is highly dependent on cellular context, particularly in cancers with constitutive TNF-α signaling. More promising results have been observed in combination with conventional chemotherapeutics or targeted agents, where SMAC mimetics can lower the apoptotic threshold and overcome treatment resistance [85].
Table 3: SMAC Mimetics in Preclinical and Clinical Development
| Compound Class | Key Characteristics | Mechanistic Insights | Experimental Findings |
|---|---|---|---|
| Monovalent SMAC mimetics | Mimic AVPI motif of SMAC | Target BIR domains of IAPs | Induce TNF-α-dependent apoptosis in sensitive cells |
| Bivalent SMAC mimetics | Simultaneously engage multiple BIR domains | Enhanced potency against multiple IAPs | More effective in triggering cIAP degradation |
| Combination with chemotherapy | Synergistic cell death | Enhanced autocrine TNF-α feedback loop | Increased caspase activation in vitro and in vivo |
| Combination with BCL-2 inhibitors | Dual targeting of apoptotic pathway | Concurrent IAP inhibition and BCL-2 blockade | Synergistic tumor regression in xenograft models |
Direct Cytochrome c Delivery: An Emerging Paradigm
While still primarily in experimental stages, direct cytochrome c delivery represents a novel approach to bypass upstream apoptotic defects in cancer cells. The conceptual framework involves introducing cytochrome c directly into the cytosol of cancer cells to directly initiate apoptosome formation and caspase activation, irrespective of BCL-2 family imbalances or MOMP deficiencies [5] [81].
Preclinical studies have explored various delivery systems including:
- Nanoparticle-based carriers for cytosolic cytochrome c delivery
- Cell-penetrating peptides conjugated to cytochrome c
- Liposomal encapsulation systems for intracellular delivery
Although technically challenging, this strategy offers potential for overcoming common resistance mechanisms associated with conventional apoptotic therapies, particularly in apoptosis-refractory solid tumors.
Experimental Approaches and Methodologies
Assessing Apoptotic Function: BH3 Profiling
BH3 profiling is a powerful functional assay that measures mitochondrial priming to determine apoptotic susceptibility at the single-cell level [80]. This technique utilizes synthetic BH3 peptides to probe the dependency of cancer cells on specific anti-apoptotic BCL-2 family members, providing predictive information about response to BH3 mimetics.
Protocol:
- Isolate mitochondria from target cells or prepare permeabilized cells
- Incubate with BH3 peptides representing different BH3-only proteins (e.g., BIM, BAD, NOXA, HRK)
- Measure mitochondrial membrane depolarization using JC-1 or TMRE fluorescent dyes
- Quantify cytochrome c release via ELISA or immunoblotting
- Analyze pattern of response to determine anti-apoptotic dependencies
The resulting profile indicates which anti-apoptotic proteins (BCL-2, BCL-XL, MCL-1, etc.) the cancer cell is primarily dependent on for survival, guiding targeted therapy selection [80].
Evaluating Cytochrome c Release Dynamics
Multiple experimental approaches are employed to monitor cytochrome c release during apoptosis:
Immunofluorescence microscopy:
- Cells grown on coverslips are treated with apoptotic inducers
- Fixed and stained with anti-cytochrome c antibodies and mitochondrial markers
- Subcellular localization is visualized by confocal microscopy
- Cytosolic cytochrome c redistribution indicates MOMP
Mitochondrial fractionation:
- Cells are fractionated into mitochondrial and cytosolic components
- Cytochrome c distribution is assessed by Western blotting
- Quantification of cytochrome c in cytosolic fractions indicates MOMP extent
Bioluminescence resonance energy transfer (BRET):
- Genetically encoded biosensors with cytochrome c-luciferase fusion
- Real-time monitoring of cytochrome c release in live cells
- Enables kinetic analysis of MOMP dynamics
SMAC Mimetic Sensitivity Assays
Determining cellular sensitivity to SMAC mimetics involves:
Viability assays:
- Cells treated with SMAC mimetics alone or in combination
- Viability measured via MTT, CellTiter-Glo, or propidium iodide exclusion
- EC50 values calculated for potency comparison
TNF-α dependency assessment:
- Neutralizing antibodies against TNF-α or TNF receptor
- Evaluation of apoptosis protection to confirm mechanism
- RT-PCR or ELISA to measure TNF-α production
IAP protein analysis:
- Western blotting for cIAP1/2 degradation kinetics
- XIAP-caspase co-immunoprecipitation to demonstrate disruption
Research Reagent Solutions
Table 4: Essential Research Tools for Apoptosis Targeting Studies
| Research Tool | Specific Examples | Experimental Applications | Technical Considerations |
|---|---|---|---|
| BH3 mimetics | Venetoclax, ABT-737, Navitoclax | BCL-2 family inhibition studies | Consider selectivity profiles and combination strategies |
| SMAC mimetics | BV6, LCL161, Birinapant | IAP antagonism research | Monitor cIAP1/2 degradation and TNF-α production |
| Mitochondrial dyes | JC-1, TMRE, MitoTracker | MOMP and membrane potential assessment | Optimize loading concentrations and incubation times |
| Cytochrome c antibodies | Clone 7H8.2C12, Clone 6H2.B4 | Immunodetection and localization | Validate specificity in knock-down controls |
| Caspase activity assays | DEVD-afc (caspase-3), IETD-afc (caspase-8) | Apoptosis execution measurement | Include z-VAD-fmk negative controls |
| Apoptosis inducers | Staurosporine, ABT-737, TRAIL | Positive controls for apoptotic pathways | Titrate for optimal time course and concentration |
| IAP antibodies | Anti-XIAP, Anti-cIAP1, Anti-cIAP2 | Protein level and degradation monitoring | Confirm specificity with genetic knockdown |
The therapeutic targeting of the mitochondrial apoptotic pathway represents a paradigm shift in cancer treatment, moving beyond traditional cytotoxic approaches to specifically reactivate endogenous cell death programs in malignant cells. The clinical success of venetoclax in hematological malignancies validates BCL-2 as a compelling therapeutic target, while SMAC mimetics offer a complementary approach to overcome IAP-mediated apoptotic resistance [86] [85]. The emerging concept of direct cytochrome c delivery may provide future opportunities to bypass upstream apoptotic blocks entirely.
Future directions in this field include developing next-generation BH3 mimetics with improved selectivity for other anti-apoptotic family members like MCL-1 and BCL-XL, optimizing combination strategies that simultaneously target multiple nodes in the apoptotic pathway, and advancing biomarker-driven patient selection through functional assays like BH3 profiling [9] [80]. Additionally, innovative delivery platforms such as PROTACs and antibody-drug conjugates may enhance the therapeutic index of apoptotic modulators, particularly for solid tumors [9] [87].
As our understanding of the intricate regulation of mitochondrial apoptosis continues to evolve, so too will our ability to therapeutically harness this fundamental cellular process for more effective and selective cancer therapeutics.
Cytochrome c (Cyt c), a central protein in the intrinsic apoptotic pathway, has emerged as a critical indicator of cellular response to anti-cancer therapies. Its release from mitochondria into the cytoplasm and subsequent detection in extracellular spaces signifies the irreversible commitment to programmed cell death. This whitepaper synthesizes current evidence establishing extracellular Cyt c as a promising biomarker for monitoring treatment efficacy across various cancers, including breast cancer and glioblastoma. We detail the molecular mechanisms governing Cyt c-mediated apoptosis, present quantitative clinical data supporting its prognostic value, and provide standardized experimental methodologies for its detection in research and clinical settings. The technical guidelines and reagent solutions outlined herein aim to facilitate the translation of Cyt c measurement into robust biomarker assays for drug development and therapeutic monitoring.
Cytochrome c is a nuclear-encoded 13 kDa hemoprotein localized in the mitochondrial intermembrane space, where it functions as an essential electron shuttle in the respiratory chain [7] [5]. Beyond its metabolic role, Cyt c serves as a critical initiator of the intrinsic apoptotic pathway. When cells receive internal death signals—such as DNA damage, metabolic stress, or unfolded protein accumulation—Cyt c is released from mitochondria into the cytosol [7]. This translocation represents a pivotal commitment point in apoptosis, as cytosolic Cyt c binds to apoptotic protease-activating factor-1 (Apaf-1) in the presence of dATP/ATP to form the oligomeric apoptosome complex [7] [6].
The apoptosome serves as a activation platform for the initiator caspase, caspase-9, which undergoes auto-cleavage and subsequently activates the effector caspases-3 and -7 [7]. These executioner caspases then orchestrate the systematic dismantling of the cell through cleavage of key structural and functional proteins [48]. The critical nature of this process is highlighted by the fact that in the absence of Cyt c, Apaf-1 fails to activate caspase-9, thereby aborting the apoptotic cascade [7]. Consequently, the detection of Cyt c release provides a direct measure of a cell's engagement in the mitochondrial apoptotic pathway, making it a compelling indicator of treatment-induced cell death.
Molecular Mechanisms of Cytochrome c Release
Regulation by the BCL-2 Protein Family
The B-cell lymphoma 2 (BCL-2) protein family serves as the primary regulator of mitochondrial outer membrane permeabilization (MOMP), the critical event enabling Cyt c release [9]. This protein family consists of approximately 20 members that can be functionally categorized into three groups:
- Multi-domain anti-apoptotic proteins (BCL-2, BCL-XL, BCL-w, MCL1, BCL2A1, BCLB) that preserve mitochondrial integrity and prevent Cyt c release
- Multi-domain pro-apoptotic proteins (BAK, BAX, BOK) that directly mediate MOMP
- BH3-only pro-apoptotic proteins (BID, BIM, BAD, BIK, NOXA, PUMA, BMF, HRK) that sense cellular stress and initiate the apoptotic cascade [9]
In healthy cells, anti-apoptotic BCL-2 proteins bind and sequester pro-apoptotic members, maintaining mitochondrial integrity. Cellular stressors (e.g., DNA damage, oxidative stress) activate BH3-only proteins, which neutralize anti-apoptotic proteins and directly activate BAX and BAK. These activated pro-apoptotic proteins oligomerize to form pores in the mitochondrial outer membrane, facilitating Cyt c release into the cytosol [9].
Cytochrome c Release and Apoptosome Formation
The following diagram illustrates the sequential process from apoptotic stimulus to caspase activation:
Figure 1: Cytochrome c-Mediated Intrinsic Apoptosis Pathway
Upon release into the cytosol, Cyt c binds to Apaf-1, triggering a conformational change that promotes oligomerization into a wheel-like heptameric complex known as the apoptosome [7]. This complex serves as a activation platform for caspase-9 through induced proximity and autocatalysis. The central role of Cyt c in this process is underscored by the observation that its absence completely abrogates apoptosome formation, even when all other components are present [6].
The release process involves multiple coordinated steps, beginning with the permeabilization of the mitochondrial outer membrane, facilitated by communication between intermembrane and intercristae spaces [5]. This is followed by the mobilization of Cyt c from cardiolipin, a phospholipid in the mitochondrial membrane with which Cyt c interacts [5]. Importantly, research indicates that Cyt c release can occur independently of mitochondrial transmembrane depolarization, representing an early event in the apoptotic cascade that precedes caspase activation [59].
Cytochrome c as a Biomarker in Cancer Therapy
Evidence Across Cancer Types
The response of tumors to conventional treatments including chemotherapy, radiotherapy, and endocrine therapy is mediated, at least partially, through induction of Cyt c release and activation of the intrinsic apoptotic pathway [7]. The table below summarizes key clinical and preclinical evidence supporting Cyt c as a biomarker of treatment response:
Table 1: Cytochrome c as a Biomarker of Treatment Response in Preclinical and Clinical Studies
| Cancer Type | Evidence | Association with Outcome | Reference |
|---|---|---|---|
| Breast Cancer | Cyt c released from epithelial cells into cancerous duct cavity; redox imbalance with reduced Cyt c unable to induce apoptosis | Upregulated at all cancer stages; reduced expression associated with lower patient survival | [7] |
| Triple-Negative Breast Cancer (TNBC) | Small extracellular vesicles (sEVs) induce Cyt c release in T cells, promoting dysfunction | Contributes to tumor immune evasion and progression | [7] |
| Glioblastoma | Low cytochrome c oxidase (CcO) activity combined with MGMT promoter methylation | Predictive of long-term survival | [88] |
| Multiple Cancers | Natural compounds (e.g., Apigenin, Catalpol) promote Cyt c release and apoptosis | Significant antitumor activity in breast and lung cancer models | [7] |
In breast cancer, studies have demonstrated that Cyt c is released from epithelial cells into the cavity of cancerous ducts, accompanied by a Cyt c redox imbalance where the reduced form cannot induce apoptosis [7]. This abnormal regulation is upregulated across all stages of cancer development. Significantly, some gene regulatory mechanisms lead to reduced Cyt c expression or release, resulting in insufficient apoptosis that correlates with lower patient survival rates [7].
The potential for exploiting this pathway therapeutically is underscored by research showing that delivering exogenous Cyt c directly into the cytoplasm of cancer cells effectively induces apoptosis [7]. Furthermore, in triple-negative breast cancer (TNBC), small extracellular vesicles (sEVs), particularly tumor-derived exosomes (TEXs), have been shown to enter T cells and induce Cyt c release, promoting T-cell dysfunction and contributing to tumor progression [7].
Cytochrome c in Treatment Resistance
Reduced Cyt c levels or impaired release have been associated with resistance to various cancer treatments:
- Chemotherapy resistance: Multiple studies indicate that decreased Cyt c contributes to patient resistance to chemotherapeutic agents [7]
- Therapeutic targeting: Beyond conventional chemotherapy, systemic treatments including endocrine therapy, anti-HER2 targeted therapy, and immunotherapy for different molecular types of breast cancer ultimately promote Cyt c expression and release, increasing tumor cell sensitivity to apoptosis [7]
- Metabolic reprogramming: In glioma tissues, Cyt c levels are lower compared to healthy tissues, with this reduction becoming more pronounced in advanced disease stages, suggesting an inhibition of apoptosis [6]
The relationship between Cyt c and cancer cell metabolism presents a complex interplay, as Cyt c becomes intertwined with the metabolic reprogramming characteristic of cancer cells [6]. This suggests that Cyt c plays a crucial role in tumor progression and resistance to treatment beyond its direct apoptotic function.
Experimental Methodologies for Cytochrome c Detection
Standardized Workflow for Biomarker Assessment
The following diagram outlines a comprehensive experimental workflow for assessing Cyt c release and apoptotic engagement:
Figure 2: Experimental Workflow for Cytochrome c Biomarker Analysis
Detailed Methodological Protocols
Subcellular Fractionation for Cytochrome c Localization
Principle: This protocol separates mitochondrial and cytosolic fractions to determine Cyt c translocation during apoptosis [88].
Procedure:
- Tissue Homogenization: Weigh and mince tissue specimens, then suspend in ice-cold isolation buffer (250 mM sucrose, 10 mM Tris-HCl, 0.5 mM EDTA; pH 7.4). Homogenize manually using a Dounce homogenizer [88].
- Differential Centrifugation:
- Centrifuge homogenate at 1,000 × g for 5 minutes at 4°C to pellet nuclear components
- Transfer supernatant to new tube and centrifuge at 12,500 × g for 10 minutes at 4°C
- The resulting pellet contains the mitochondrial fraction
- The supernatant contains the cytosolic fraction [88]
- Mitochondrial Solubilization: Resuspend mitochondrial pellet in 10 mM potassium phosphate buffer supplemented with 0.2% n-dodecyl β-d-maltoside and protease/phosphatase inhibitors. Extract on ice for 1 hour with occasional vortexing, then centrifuge at 10,000 × g for 10 minutes [88].
- Protein Quantification: Determine protein concentration of all fractions using Bradford assay.
Critical Notes:
- Maintain samples at 4°C throughout the procedure
- Process samples within 30 minutes of collection
- Snap-freeze specimens in liquid nitrogen and store at -80°C if not processed immediately [88]
Cytochrome c Detection via Western Blotting
Procedure:
- Electrophoresis: Separate proteins (20-50 μg per lane) by SDS-PAGE (15% gel recommended for optimal Cyt c separation)
- Transfer: Electroblot onto PVDF membrane using wet transfer system
- Blocking: Incubate membrane with 5% non-fat dry milk in TBST for 1 hour at room temperature
- Primary Antibody Incubation: Incubate with anti-cytochrome c antibody (1:1000 dilution) overnight at 4°C
- Secondary Antibody Incubation: Incubate with HRP-conjugated secondary antibody (1:2000 dilution) for 1 hour at room temperature
- Detection: Develop using enhanced chemiluminescence substrate and visualize with imaging system
Controls Required:
- Mitochondrial marker (e.g., COX IV) for fraction purity assessment
- Cytosolic marker (e.g., LDH) to confirm absence of mitochondrial contamination
- Housekeeping proteins (e.g., β-actin) for loading normalization
Functional Apoptosis Assays
Caspase Activity Assessment:
- Caspase-3/7 Activity: Use commercial caspase-3/7 assay kits based on DEVD-peptide cleavage and luminescent signal detection [48]
- Caspase-9 Activity: Measure using LEHD-peptide substrates specific for initiator caspase activity
Mitochondrial Membrane Potential (MMP) Measurement:
- Use fluorescent dyes such as JC-1 or tetramethylrhodamine ethyl ester (TMRE)
- Analyze by flow cytometry or fluorescence microscopy [48]
Morphological Assessment of Apoptosis:
- DAPI Staining: Identify characteristic nuclear condensation and fragmentation [48]
- Annexin V/PI Staining: Distinguish early apoptotic (Annexin V+/PI-) from late apoptotic (Annexin V+/PI+) populations using flow cytometry [48]
Research Reagent Solutions
Table 2: Essential Research Reagents for Cytochrome c Biomarker Studies
| Reagent/Category | Specific Examples | Function/Application | Technical Notes |
|---|---|---|---|
| Apoptosis Inducers | Staurosporine, UVB irradiation, 25-Hydroxycholesterol [48], Doxorubicin [89] | Activate intrinsic apoptotic pathway; positive controls for Cyt c release | Concentration and time optimization required for each cell type |
| BCL-2 Family Inhibitors | Venetoclax (BCL-2 specific), Navitoclax (BCL-2/BCL-xL/BCL-w) [9] | BH3-mimetics that inhibit anti-apoptotic proteins; induce Cyt c release | Specificity profiles vary; venetoclax selective for BCL-2 |
| Caspase Inhibitors | Z-VAD-FMK (pan-caspase) [48] | Confirm caspase-dependent apoptosis; mechanistic studies | Pretreatment (1-2 hours) before apoptotic stimulus |
| Detection Antibodies | Anti-cytochrome c (clone 7H8.2C12), Anti-COX IV, Anti-β-actin | Western blot, immunofluorescence for Cyt c localization and quantification | Validate specificity with knockout controls |
| Mitochondrial Dyes | JC-1, TMRE, MitoTracker | Assess mitochondrial membrane potential and morphology | JC-1 exhibits potential-dependent emission shift |
| Apoptosis Assay Kits | Annexin V/PI staining kits, Caspase-3/7 activity assays, Caspase-9 activity assays | Quantitative apoptosis measurement by flow cytometry and luminescence | Distinguish early vs. late apoptotic populations |
The accumulation of evidence from multiple cancer types solidifies the position of cytochrome c as a mechanistically grounded biomarker for monitoring treatment response. Its central role in the intrinsic apoptotic pathway provides a direct readout of therapeutic efficacy at the cellular level. The methodologies outlined in this whitepaper offer standardized approaches for quantifying Cyt c release and related apoptotic events in both preclinical and clinical settings.
Future development should focus on translating these research techniques into clinically applicable assays, potentially through the detection of Cyt c in circulating extracellular vesicles or other accessible biospecimens. The integration of Cyt c biomarkers with other apoptotic indicators and conventional prognostic factors holds promise for developing comprehensive response prediction models that could ultimately guide personalized treatment strategies in oncology.
Resolving Experimental Challenges in Cytochrome c Release Assays and Pathway Modulation
The release of cytochrome c from the mitochondrial intermembrane space into the cytosol is a pivotal event in the intrinsic apoptotic pathway, serving as a critical marker for researchers studying cell death mechanisms. Despite its established importance, accurate detection and quantification of cytochrome c release remain technically challenging. This technical guide examines the principal pitfalls in cytochrome c detection methodologies, with particular focus on subcellular fractionation artifacts and antibody specificity issues. Within the broader context of intrinsic apoptosis research, we provide detailed protocols for reliable experimental approaches, quantitative data analysis frameworks, and reagent solutions to overcome these common challenges. The recommendations herein are designed to help researchers obtain more reproducible and biologically relevant data in mitochondrial cytochrome c release studies, ultimately supporting advances in both basic science and drug development applications targeting apoptotic pathways.
The intrinsic apoptotic pathway is a tightly regulated process essential for development, tissue homeostasis, and elimination of damaged cells. Mitochondria serve as central integration points for diverse apoptotic stimuli, including DNA damage, oxidative stress, and growth factor withdrawal [90]. Mitochondrial outer membrane permeabilization (MOMP) represents the critical commitment point in intrinsic apoptosis, enabling the release of various pro-apoptotic proteins from the intermembrane space into the cytosol [5] [91].
Among these proteins, cytochrome c plays a dual role in cellular life and death decisions. In healthy cells, cytochrome c functions as an essential electron shuttle in the respiratory chain, interacting with cardiolipin in the mitochondrial inner membrane [5]. Upon apoptotic activation, cytochrome c is released into the cytosol where it facilitates the oligomerization of apoptosis-protease activating factor 1 (Apaf-1) into the apoptosome complex, which subsequently activates caspase-9 and the downstream caspase cascade [90] [92]. This biochemical switch from metabolic regulation to cell death execution makes accurate detection of cytochrome c localization fundamental to apoptosis research.
The translocation of cytochrome c during apoptosis is not always an all-or-nothing event, and under certain circumstances, its release may be partial or reversible, adding complexity to its detection and interpretation [5] [33]. Furthermore, cytosolic cytochrome c has been associated with vital cell functions including differentiation, suggesting that mitochondrial outer membrane permeabilization may not invariably lead to cell death [5]. These biological nuances, combined with technical challenges in detection methodologies, create a landscape where researchers must exercise considerable rigor in experimental design and interpretation.
Technical Challenges in Cytochrome c Detection
Subcellular Fractionation Pitfalls
Subcellular fractionation remains a widely employed technique for determining cytochrome c localization, but this approach is fraught with potential artifacts that can compromise experimental results.
Mitochondrial Integrity During Preparation: The process of cell disruption must be sufficient to break the plasma membrane while preserving mitochondrial integrity. Under-homogenization leaves cells intact, while over-homogenization damages mitochondrial membranes, causing artifactual cytochrome c release [33]. The use of isotonic buffers (e.g., 210 mM mannitol, 70 mM sucrose, 1 mM EDTA, 10 mM HEPES pH 7.5) is essential to prevent osmotic damage during fractionation [33].
Cross-Contamination Between Fractions: Incomplete separation of mitochondrial and cytosolic fractions can lead to misinterpretation of release kinetics. Differential centrifugation protocols must be rigorously optimized and validated for each cell type, as mitochondrial size and density vary across tissues [33]. The inclusion of marker proteins for different compartments (e.g., COX4 for mitochondria, LDH for cytosol) is essential for assessing fraction purity.
Time-Dependent Artifacts: Cytochrome c release can continue post-homogenization if proteases are not adequately inhibited or if buffers lack appropriate ionic composition. Immediate processing and maintenance of samples at 4°C throughout fractionation are critical safeguards [33].
Antibody Specificity Issues
Antibody-related problems represent another major category of pitfalls in cytochrome c detection, particularly in immunofluorescence and Western blot applications.
Cross-Reactivity: Many commercially available cytochrome c antibodies show cross-reactivity with other proteins or modified forms of cytochrome c. For instance, the conformational change in cytochrome c upon binding to cardiolipin can alter epitope accessibility, leading to variable detection efficiency between mitochondrial and cytosolic pools [5] [93].
Variability Between Commercial Sources: Significant lot-to-lot and vendor-to-vendor variations in antibody specificity have been documented. Researchers should validate each new antibody batch using appropriate controls, including cytochrome c knockout cells or siRNA knockdown where feasible.
Detection of Non-Apoptotic Release: Some antibodies cannot distinguish between cytochrome c released during apoptosis versus other physiological processes, potentially leading to overestimation of apoptotic induction [5].
Methodological Limitations in Detection Techniques
Table 1: Comparison of Major Cytochrome c Detection Methods
| Method | Key Advantages | Primary Limitations | Optimal Applications |
|---|---|---|---|
| Subcellular Fractionation + Western Blot | Semi-quantitative; familiar methodology; assesses multiple samples | Potential fraction cross-contamination; mitochondrial damage during isolation; antibody specificity concerns | Screening multiple apoptotic inducers; time-course studies |
| Immunofluorescence Microscopy | Single-cell resolution; preserves spatial information; co-localization possible | Subjective quantification; potential antibody penetration issues; limited throughput | Analysis of heterogeneous cell populations; preliminary investigations |
| Flow Cytometry | Quantitative; high throughput; multi-parameter analysis | Requires specialized equipment; cannot distinguish cytosolic vs. mitochondrial localization without fractionation | High-throughput drug screening; kinetic studies in homogeneous populations |
| ELISA-based Approaches | Highly sensitive; quantitative; amenable to serum samples | Does not provide subcellular information; may detect non-apoptotic release | Clinical applications; drug development screening |
| Biosensors | Real-time monitoring in live cells; spatial and temporal resolution | Technical complexity; potential perturbation of native biology; validation requirements | Detailed mechanistic studies; single-cell dynamics |
Each detection method carries inherent limitations that researchers must acknowledge in experimental design. Western blotting following subcellular fractionation, while widely used, risks artifactual release during sample preparation [33]. Immunofluorescence can be confounded by subjective quantification and antibody accessibility issues, particularly in fixed cells. Flow cytometric methods offer quantitative data but typically lose spatial information unless coupled with imaging platforms [94]. Emerging biosensor technologies provide real-time monitoring in live cells but may perturb the native biological system being studied [93].
Detailed Experimental Protocols for Reliable Detection
Optimized Subcellular Fractionation Protocol
Based on methodologies successfully employed in sympathetic neuron studies [33], the following protocol minimizes artifacts in cytochrome c detection:
Cell Harvesting and Homogenization:
- Wash cells with ice-cold PBS and harvest using trypsinization or scraping.
- Resuspend cell pellet in isotonic mitochondrial buffer (210 mM mannitol, 70 mM sucrose, 1 mM EDTA, 10 mM HEPES pH 7.5) supplemented with protease inhibitors.
- Homogenize with a Dounce homogenizer (15-30 strokes) on ice. Confirm >90% cell disruption by microscopy.
- Centrifuge at 900 × g for 5 minutes at 4°C to remove nuclei and unbroken cells.
Fraction Separation:
- Transfer supernatant to fresh tube and centrifuge at 10,000 × g for 30 minutes at 4°C.
- Collect supernatant (cytosolic fraction) and carefully wash pellet (heavy membrane/mitochondrial fraction).
- Resuspend mitochondrial fraction in lysis buffer (PBS with 0.2% Triton X-100).
- Determine protein concentration for both fractions using Bradford or BCA assay.
Quality Assessment:
- Validate fraction purity by Western blotting for compartment-specific markers:
- Mitochondrial: COX4, COX5A, or ATP5A
- Cytosolic: LDH or tubulin
- Assess mitochondrial integrity by measuring cytochrome c oxidase activity in both fractions.
- Validate fraction purity by Western blotting for compartment-specific markers:
Standardized Western Blot Protocol
Electrophoresis and Transfer:
- Load equal protein amounts (10-30 μg) for each fraction on 12-15% SDS-PAGE gels.
- Include positive controls (purified cytochrome c) and molecular weight markers.
- Transfer to PVDF membrane using wet transfer system at 100V for 1 hour.
Immunodetection:
- Block membrane with 5% non-fat milk in TBST for 1 hour.
- Incubate with primary antibody against cytochrome c (1:1000 dilution) overnight at 4°C.
- Use validated monoclonal antibodies targeting distinct epitopes for confirmation.
- Wash and incubate with HRP-conjugated secondary antibody (1:5000) for 1 hour.
- Develop with enhanced chemiluminescence substrate and image with digital system.
Quantification and Normalization:
- Normalize cytochrome c signals to fraction-specific markers.
- Express release as percentage of total cellular cytochrome c (sum of both fractions).
- Include non-apoptotic controls in every experiment to establish baseline release.
Complementary Techniques for Validation
Given the limitations of any single method, orthogonal approaches strengthen conclusions:
Immunofluorescence Validation:
- Fix cells with 4% paraformaldehyde (avoid methanol which can extract cytochrome c).
- Permeabilize with 0.2% Triton X-100 and block with 5% normal goat serum.
- Co-stain with cytochrome c and mitochondrial markers (e.g., TOM20, COX4).
- Use high-resolution confocal microscopy and quantitative image analysis.
Flow Cytometric Assessment:
- For cells stably expressing fluorescent proteins targeted to mitochondria, monitor redistribution in real-time [94].
- Combine with viability dyes (e.g., propidium iodide) to correlate cytochrome c release with cell death.
The Scientist's Toolkit: Essential Research Reagents
Table 2: Key Research Reagents for Cytochrome c Detection
| Reagent/Category | Specific Examples | Function/Application | Considerations |
|---|---|---|---|
| Fractionation Buffers | Mannitol-sucrose-HEPES buffer | Maintain mitochondrial integrity during isolation | Isotonicity critical; EDTA prevents mitochondrial swelling |
| Protease Inhibitors | Complete Mini cocktail | Prevent protein degradation during fractionation | Add fresh before each use |
| Mitochondrial Markers | COX4, TOM20, ATP5A | Assess mitochondrial fraction purity and integrity | Use multiple markers for different mitochondrial compartments |
| Cytosolic Markers | LDH, tubulin, GAPDH | Assess cytosolic fraction contamination | Avoid markers with dual localization |
| Cytochrome c Antibodies | Monoclonal 7H8.2C12, 6H2.B4 | Specific detection in Western blot, immunofluorescence | Validate for specific applications; check cross-reactivity |
| Apoptotic Inducers | Staurosporine, UV irradiation, Bax overexpression | Positive controls for cytochrome c release | Use multiple mechanisms to confirm findings |
| Caspase Inhibitors | zVAD-fmk, BAF | Distinguish upstream events from downstream effects | Confirm efficacy in parallel assays |
Data Interpretation and Quantitative Analysis
Normalization and Quantification Strategies
Accurate quantification of cytochrome c release requires careful normalization to account for technical and biological variables:
Fraction Purity Correction: Adjust cytochrome c signals based on the percentage of cross-contamination between fractions as determined by compartment-specific markers.
Total Cellular Content: Calculate the proportion of released cytochrome c relative to total cellular content (cytosolic + mitochondrial fractions) rather than relying on absolute values from either fraction alone.
Threshold Determination: Establish significance thresholds based on negative controls (untreated cells) and positive controls (cells treated with established apoptotic inducers).
Common Artifacts and Troubleshooting
Incomplete Release Interpretation: Partial cytochrome c release may reflect biological reality rather than technical failure, particularly in early apoptosis or in cells with heterogeneous responses [33].
Apparent Reversal Artifacts: The observation of cytochrome c returning to mitochondria in NGF-rescued neurons [33] highlights the potential for dynamic redistribution that should not be dismissed as artifact without investigation.
Cell-Type Specific Considerations: Mitochondrial density, cytochrome c expression levels, and apoptotic machinery vary across cell types, necessitating optimization for each experimental system.
Cytochrome c Release Signaling Pathway
Visualization of Cytochrome c Release Pathway and Detection Challenges
This diagram illustrates the key events in the intrinsic apoptosis pathway culminating in cytochrome c release, while highlighting critical points where detection artifacts commonly occur. The pathway begins with apoptotic stimuli such as DNA damage or oxidative stress, which trigger Bcl-2 family protein activation and cardiolipin oxidation within mitochondria [5] [90]. These events converge on mitochondrial outer membrane permeabilization (MOMP), enabling cytochrome c release from the intermembrane space into the cytosol [91]. Cytosolic cytochrome c then facilitates apoptosome formation, caspase activation, and eventual apoptotic cell death. The dashed red connections indicate where technical pitfalls—specifically subcellular fractionation issues and antibody specificity problems—can compromise accurate detection and interpretation of cytochrome c release dynamics.
Accurate detection of cytochrome c release remains fundamental to advancing our understanding of intrinsic apoptosis, with implications for basic research, drug discovery, and therapeutic development. The technical challenges outlined in this guide—particularly those related to subcellular fractionation and antibody specificity—represent significant but surmountable obstacles. Through implementation of optimized protocols, rigorous validation using orthogonal methods, and careful data interpretation, researchers can overcome these common pitfalls.
Future methodological developments will likely focus on real-time monitoring of cytochrome c release in live cells using improved biosensors [93], multiplexed assays that simultaneously track multiple apoptotic parameters, and single-cell approaches that capture population heterogeneity. Additionally, standardized validation protocols for cytochrome c detection reagents would benefit the research community by improving reproducibility across laboratories.
As we continue to unravel the complexities of mitochondrial regulation in cell death and survival, refined detection methodologies for cytochrome c will remain essential tools for elucidating the nuanced role of this critical protein in both pathological processes and therapeutic interventions.
This technical guide examines a critical paradigm shift in intrinsic apoptosis research: the transition from viewing mitochondrial cytochrome c release as a uniform, complete, all-or-nothing process at the population level to understanding it as a heterogeneous event at the single-cell level, encompassing both complete and partial release phenotypes. Conventional population-averaging methods, such as Western blot and ELISA, often obscure this heterogeneity, leading to an incomplete understanding of apoptotic regulation and its implications in cancer therapy and drug resistance. This whitepaper synthesizes current evidence demonstrating that cytochrome c release is a controlled and potentially reversible process, details advanced single-cell methodologies for its detection, and explores the functional consequences of release heterogeneity on cellular fate decisions. Acknowledging this complexity is paramount for developing more effective therapeutic strategies, particularly in overcoming treatment resistance in cancers like neuroblastoma.
The intrinsic (mitochondrial) apoptosis pathway is a tightly regulated process essential for development, tissue homeostasis, and the elimination of damaged or cancerous cells. A pivotal event in this pathway is the release of cytochrome c (Cyt c) from the mitochondrial intermembrane space into the cytosol [5] [3]. In the cytosol, Cyt c binds to Apaf-1, triggering the formation of the apoptosome and the subsequent activation of caspase-9 and the downstream caspase cascade, culminating in apoptotic cell death [3] [48].
For decades, the prevailing model characterized this release as a rapid, complete, and irreversible commitment to death, an "all-or-nothing" event at the cellular level. This view was largely built on data from population-averaging techniques. However, a growing body of evidence, powered by advanced single-cell analysis technologies, now challenges this dogma. It reveals significant cell-to-cell heterogeneity in the timing, extent, and irreversibility of Cyt c release, with profound implications for understanding apoptotic resistance, tumor recurrence, and the variable effectiveness of cancer treatments.
This guide delves into the mechanisms and methodologies that distinguish complete release, which leads to full caspase activation and cell death, from partial release, which may permit cellular recovery, foster non-apoptotic signaling, and contribute to phenotypic variation within isogenic cell populations.
Mechanisms of CytochromecRelease and the Basis for Heterogeneity
The release of Cyt c is primarily governed by mitochondrial outer membrane permeabilization (MOMP), a process regulated by the Bcl-2 protein family. The core mechanisms and emerging nuances that permit heterogeneity are outlined below.
Core Mechanisms of MOMP
The permeabilization of the outer mitochondrial membrane is the critical step enabling Cyt c release. Two primary, non-mutually exclusive models explain this process:
- Bax/Bak Oligomerization: Pro-apoptotic Bcl-2 family proteins like Bax and Bak, when activated by BH3-only proteins (e.g., tBid), undergo conformational change and oligomerize to form pores in the outer mitochondrial membrane [3]. This allows for the selective release of intermembrane space proteins, including Cyt c. The balance between pro-apoptotic (e.g., Bax, Bak, Bid) and anti-apoptotic (e.g., Bcl-2, Bcl-xL) proteins tightly regulates this process.
- Mitochondrial Permeability Transition (MPT): Under conditions of severe cellular stress, such as calcium overload and oxidative stress, a non-specific pore can open in the inner mitochondrial membrane. This leads to mitochondrial swelling, rupture of the outer membrane, and the release of Cyt c [3]. The role of specific components like cyclophilin D (CypD) is more clearly established in this pathway than that of VDAC or ANT.
Molecular Basis for Heterogeneous Release
The seemingly stochastic nature of Cyt c release at the single-cell level arises from several sources of cellular and subcellular heterogeneity:
- Pre-existing Variability in Bcl-2 Family Proteins: Cell-to-cell differences in the expression levels, localization, and activation kinetics of Bcl-2 family members create a spectrum of MOMP sensitivities within a population [95]. A cell with higher levels of Bcl-2 may resist pore formation longer than a cell with dominant Bax expression.
- Subcellular Protein Localization and Organelle Heterogeneity: The spatial distribution of key proteins, including autophagy-related components and Bcl-2 members, can create subpopulations of mitochondria with varying susceptibility to MOMP within a single cell [95]. This means MOMP may not occur synchronously across all mitochondria.
- Mitochondrial Morphology and Functional State: Mitochondria are dynamic organelles, and their functional state, including mitochondrial membrane potential (ΔΨm), is a key source of cellular heterogeneity. Studies have shown that cell-to-cell variation in ΔΨm predicts variation in proliferation, stress tolerance, and drug resistance [96]. A cell with a lower initial ΔΨm may be primed for apoptosis, while one with a high ΔΨm may resist death signals.
- Stochastic Biochemical Events: The small numbers of molecules involved in the key signaling events leading to MOMP can lead to probabilistic outcomes, where identical genetic and environmental conditions can result in different cellular fates [96].
Limitations of Population-Averaging Methodologies
Traditional biochemical techniques have been instrumental in establishing the core pathways of apoptosis but are inherently limited in resolving single-cell heterogeneity.
Table 1: Limitations of Population-Averaging Techniques in Apoptosis Research
| Method | Principle | Key Limitation in Context of Heterogeneity |
|---|---|---|
| Western Blot | Detects average protein levels (e.g., Cyt c) in cytosolic or mitochondrial fractions from thousands to millions of lysed cells. | Cannot distinguish between 100% of cells having partial release and 50% of cells having complete release; obscures the very existence of distinct subpopulations [55]. |
| ELISA | Quantifies soluble Cyt c concentration in a cell lysate or supernatant. | Provides a bulk measurement that masks the distribution of release levels across individual cells [55]. |
| Flow Cytometry | Measures fluorescence per cell, potentially detecting Cyt c release in single cells. | Lower spatial resolution and limited capacity for continuous, in-situ monitoring compared to imaging techniques; often requires cell fixation. |
These methods create a composite picture that can be misleading. A slow, steady increase in cytosolic Cyt c measured by Western blot could be interpreted as a synchronous, gradual release from all cells. In reality, it may represent an asynchronous, all-or-nothing release event happening in an increasing number of individual cells over time—a fundamentally different biological scenario.
Advanced Single-Cell and Sub-Cellular Resolving Methodologies
To overcome the limitations of population averaging, researchers employ a suite of advanced techniques that provide spatial and temporal resolution at the single-cell and organelle level.
Single-Cell Imaging and Profiling Techniques
Table 2: Advanced Single-Cell Methodologies for Analyzing Cytochrome c Release
| Technique | Application & Workflow | Key Insight Enabled |
|---|---|---|
| Surface-Enhanced Raman Spectroscopy (SERS) | A 3D bifunctional SERS substrate is engineered with photothermal and sensing capabilities. Cells are cultured on the substrate, and photothermal stress induces apoptosis. The system performs label-free, in-situ mapping of the spatial distribution of Cyt c released around single cells [55]. | Revealed isotropic release patterns from individual apoptotic cells and enabled the distinction of release variability between different cell lines at the single-cell level. |
| Live-Cell Fluorescence Imaging | Cells are transfected with fluorescently tagged Cyt c (e.g., GFP-Cyt c). Time-lapse confocal microscopy tracks the redistribution of fluorescence from a punctate (mitochondrial) pattern to a diffuse (cytosolic) pattern in live cells [33]. | Demonstrated that Cyt c release is an "all-or-nothing" event per mitochondrion, but that a single cell can experience partial release if only a subset of its mitochondria undergo MOMP. |
| High-Throughput Microscopy & Mitochondrial Morphomics | Cells are stained with TMRM (for ΔΨm) and other dyes. Automated imaging captures thousands of cells. Machine learning algorithms extract ~50 morphological features (size, shape, texture, spatial distribution) to create a "mitochondrial morphome" for each cell [97]. | Identified distinct cell subpopulations with varying sensitivity to mitochondrial inhibitors. Showed that neurite-related mitochondrial features were more severely impacted by certain inhibitors than cell body features, highlighting subcellular compartment-specific responses. |
| Single-Cell RNA Sequencing (scRNA-seq) | Transcriptomes of individual cells are sequenced. Analysis focuses on mitochondrial gene content (pctMT) and stress pathway signatures [98]. | Challenged the dogma that high mitochondrial RNA content always indicates low-quality/dead cells. Revealed that viable, metabolically altered malignant cells often have high pctMT, linking mitochondrial metabolic state to tumor cell heterogeneity and drug response. |
Detailed Experimental Protocol: SERS-Based Spatial Profiling
The following protocol, adapted from Lu et al., details the process for in-situ spatial profiling of Cyt c release at the single-cell level [55].
- Objective: To achieve label-free, spatial mapping of Cyt c released from single apoptotic cells under photothermal stress.
- Materials:
- 3D Bifunctional SERS Substrate: Composed of an upper monolayer of gold nano-octahedrons (AuNO, for SERS detection) and a lower monolayer of gold nanorod@palladium concave cuboids (AuNR@Pd, for photothermal conversion).
- Cell Culture: Appropriate adherent cell lines (e.g., neuroblastoma BE(2)-C cells).
- Mitochondrial Targeting SERS Nanoprobes (GERTs@MLS): To validate co-release with Cyt c during apoptosis.
- Raman Microscope: Equipped with a laser source suitable for exciting the plasmonic substrate.
- Procedure:
- Substrate Preparation: Synthesize the 3D bifunctional substrate via layer-by-layer assembly, ensuring synergistic plasmonic coupling between the upper and lower nanostructured layers.
- In-Situ Cell Culture: Plate cells directly onto the SERS substrate and allow them to adhere and grow under standard culture conditions.
- Induction of Apoptosis: Apply a laser to the substrate to induce localized photothermal stress, triggering the apoptotic pathway.
- SERS Measurement and Imaging: Immediately following photothermal induction, perform Raman spectroscopy scans across a predefined grid surrounding single cells.
- Data Analysis: Construct spatial distribution maps of Cyt c by plotting the characteristic SERS fingerprint intensity of Cyt c (e.g., ~750 cm⁻¹ band for the heme group) against spatial coordinates.
- Validation: Repeat experiments using the GERTs@MLS nanoprobe to confirm that the detected signal originates from mitochondrial release.
The Scientist's Toolkit: Research Reagent Solutions
Table 3: Essential Research Reagents for Single-Cell Cytochrome c Release Studies
| Reagent / Tool | Function & Application |
|---|---|
| 3D Bifunctional SERS Substrate | Core platform enabling simultaneous induction of apoptosis (via photothermal effect) and label-free detection of released Cyt c (via SERS) in situ [55]. |
| Fluorescently Tagged Cytochrome c (e.g., GFP-Cyt c) | Enables real-time visualization of Cyt c localization and release dynamics in live cells via time-lapse fluorescence microscopy [33]. |
| Mitochondrial Dyes (TMRM, JC-1) | Cationic dyes that accumulate in active mitochondria based on membrane potential (ΔΨm). A drop in fluorescence indicates loss of ΔΨm, an early event in apoptosis. Used for high-throughput morphomic analysis [97]. |
| Caspase Inhibitors (e.g., Z-VAD-FMK) | Pan-caspase inhibitor. Used to experimentally dissect caspase-dependent and -independent phases of cell death, and to demonstrate recoverability from Cyt c release [33] [48]. |
| BH3 Mimetics (e.g., ABT-263) | Small molecules that inhibit anti-apoptotic Bcl-2 proteins. Used to probe the cell's "priming" for death and to study the threshold for MOMP [3]. |
| Mitochondrial-Targeted SERS Nanoprobes (GERTs@MLS) | Nanoparticles targeted to the mitochondrial matrix. Their co-release with Cyt c serves as a validation tool to confirm mitochondrial outer membrane permeabilization in SERS experiments [55]. |
Signaling Pathways and Experimental Workflows
The following diagrams, generated using Graphviz DOT language, illustrate the core apoptotic pathway and a key experimental workflow detailed in this guide.
Diagram 1: Intrinsic Apoptosis Pathway and Cell Fate Decisions
This diagram depicts the intrinsic apoptosis pathway, highlighting the decision point between complete and partial cytochrome c release and the resulting divergent cellular fates.
Diagram 2: Single-Cell SERS Profiling Workflow
This diagram visualizes the experimental workflow for the SERS-based spatial profiling of cytochrome c release.
Functional Consequences of Release Heterogeneity
The distinction between complete and partial Cyt c release is not merely observational; it has significant functional consequences for cellular fate and tissue physiology.
- Cellular Recovery and Reversible Apoptosis: Seminal work on sympathetic neurons demonstrated that cells can survive and recover full function after Cyt c release and caspase activation, provided caspase activity is inhibited. Upon re-exposure to NGF, these neurons recovered their normal mitochondrial size and cytochrome c content, a process requiring de novo protein synthesis [33]. This proves that Cyt c depletion is a controlled process compatible with functional recovery.
- Sublethal Caspase Signaling and Oncogenic Transformation: Partial MOMP and limited Cyt c release can lead to sublethal caspase activation. This low-level activity has been shown to promote DNA damage and, paradoxically, oncogenic transformation rather than cell death [95]. This mechanism represents a dangerous trade-off where an incomplete apoptotic response can potentially fuel tumorigenesis.
- Metabolic Heterogeneity and Drug Resistance in Cancer: Single-cell transcriptomics has revealed that cancer cells with high mitochondrial content (high pctMT) are not necessarily dying cells but are often viable, metabolically dysregulated, and associated with drug response mechanisms [98]. Filtering out these cells during data analysis, a common practice, inadvertently removes a clinically relevant subpopulation that may be involved in therapeutic resistance.
- Inflammation and Immune Activation: Extracellular Cyt c acts as a damage-associated molecular pattern (DAMP). Its release, even from a subset of cells in a tissue, can alert the immune system by engaging toll-like receptor 4 (TLR4) and triggering pro-inflammatory signaling in immune cells, thereby exacerbating conditions like neuroinflammation, sepsis, and arthritis [55].
The recognition of single-cell heterogeneity in cytochrome c release fundamentally changes our understanding of the intrinsic apoptosis pathway. Moving beyond the oversimplified "all-or-nothing" model is crucial for explaining critical biological and clinical phenomena, such as fractional killing by anticancer drugs, the emergence of drug-resistant persister cells, and the complex role of apoptosis in development and disease.
Future research directions will focus on:
- Dynamic Tracking: Further developing tools for long-term, live-cell tracking of cells that experience partial MOMP to trace their ultimate fate.
- Therapeutic Targeting: Exploiting the mechanisms that govern heterogeneity to develop novel therapies that can push "hesitant" cancer cells over the threshold to complete commitment to death, thereby overcoming treatment resistance.
- Systems Biology Integration: Using multi-omics data at the single-cell level to build predictive models of cell fate decisions that integrate mitochondrial state, Bcl-2 family dynamics, and metabolic profiles.
For researchers and drug development professionals, incorporating the principles of single-cell heterogeneity is no longer optional but essential for designing robust experiments, interpreting complex data, and developing the next generation of effective cancer therapeutics.
The mitochondrial transmembrane potential (ΔΨm) is a critical parameter routinely measured to assess mitochondrial health and function during apoptosis. A prevailing model in cellular biology posits that the release of cytochrome c (cyt c), a pivotal event in the intrinsic apoptotic pathway, is preceded and triggered by a loss of ΔΨm. However, a growing body of evidence challenges this linear perspective, revealing a more complex and often confounding relationship. This whitepaper synthesizes current research to delineate the intricate temporal and mechanistic dynamics between ΔΨm and cyt c release. We critically evaluate key confounders, including the phenomenon of transient ΔΨm depolarization and recovery, the distinct roles of mitochondrial outer membrane permeabilization (MOMP) and permeability transition pore (MPT) opening, and the influence of cellular energy status. By integrating quantitative data, experimental protocols, and visual schematics, this guide aims to equip researchers with the nuanced understanding necessary to accurately interpret ΔΨm fluctuations and their functional consequences in cell death signaling and drug development.
In the intrinsic apoptotic pathway, mitochondria serve as central executioners. The release of cyt c from the mitochondrial intermembrane space into the cytosol is a decisive step, leading to the formation of the apoptosome and the activation of caspase cascades [5] [7]. Concurrently, ΔΨm, an electrochemical gradient across the inner mitochondrial membrane essential for ATP production, is a well-established indicator of mitochondrial health [99] [45]. Traditional models often depict a universal and irreversible collapse of ΔΨm as a prerequisite for cyt c release. This overview, however, will dissect the evidence demonstrating that this relationship is not a simple cause-and-effect sequence but a regulated, context-dependent process. Misinterpreting these dynamics can lead to incorrect conclusions about the mode of cell death and the efficacy of therapeutic agents, making it a critical consideration for research and drug development.
Mechanisms of Cytochrome c Release and ΔΨm Dynamics
The relationship between cyt c release and ΔΨm is fundamentally determined by the specific mechanism of mitochondrial membrane permeabilization.
MOMP and Its Limited Impact on ΔΨm
MOMP is a process primarily governed by the BCL-2 protein family. Pro-apoptotic proteins like BAX and BAK oligomerize to form pores in the outer membrane, allowing the release of intermembrane space proteins, including cyt c [5] [100] [101]. Crucially, MOMP alone does not directly disrupt the integrity of the inner mitochondrial membrane. Since ΔΨm is sustained by the proton gradient across the inner membrane, it can remain largely intact even after cyt c has been released via MOMP [99] [101]. The electron transport chain can continue to function, and mitochondria can maintain ATP production for a period, especially if cytosolic cyt c is available to support electron transfer [99].
MPT and the Collapse of ΔΨm
In contrast, the MPT involves the opening of a non-selective pore in the inner mitochondrial membrane, leading to the rapid and irreversible dissipation of ΔΨm, osmotic swelling, and often physical rupture of the outer membrane [45] [1]. This process is regulated by components such as cyclophilin D and can be triggered by calcium overload and oxidative stress [45]. When MPT occurs, cyt c release is a consequence of outer membrane rupture and is accompanied by a profound loss of mitochondrial function.
Table 1: Comparative Overview of MOMP and MPT
| Feature | Mitochondrial Outer Membrane Permeabilization (MOMP) | Mitochondrial Permeability Transition (MPT) |
|---|---|---|
| Primary Membrane Affected | Outer Membrane | Inner Membrane |
| Key Regulators | BAX, BAK, BCL-2, BID [100] [101] | Cyclophilin D, ANT, VDAC [45] [1] |
| Effect on ΔΨm | Can be maintained initially; may depolarize and recover [99] | Rapid, irreversible collapse [45] |
| Primary Release Mechanism for Cyt c | Pores in outer membrane [101] | Outer membrane rupture due to swelling [45] |
| Energy Consequences | ATP production can be sustained [99] | Severe ATP depletion [45] |
The following diagram illustrates the two primary pathways leading to cytochrome c release and their distinct effects on mitochondrial membrane potential.
Key Confounding Factors in Interpreting ΔΨm
Researchers must account for several confounding factors to avoid misinterpretation of ΔΨm data.
Temporal Disconnect and Recovery
A critical confounder is the transient nature of ΔΨm depolarization following MOMP. Single-cell analysis has revealed that after cyt c release, ΔΨm can depolarize rapidly but then recover to near-original levels within 30-60 minutes, even in the continued absence of cyt c [99]. This recovery demonstrates that the loss of ΔΨm is not a permanent marker of commitment to death and highlights the limitations of endpoint assays.
Caspase Dependence
The sustained loss of ΔΨm following cyt c release is often not a direct result of the release itself but a consequence of downstream caspase activation. When caspase activity is pharmacologically or genetically inhibited, mitochondria can maintain their ΔΨm post-MOMP for extended periods, underscoring that irreversible depolarization is a later event in the apoptotic cascade rather than an initiating one [99].
Contextual Dependence on MPT
The contribution of MPT to apoptosis is highly cell type- and stimulus-dependent. In many canonical models of apoptosis, MOMP is the primary and sufficient event, and MPT may play a minor role or occur only in a subset of mitochondria [39]. Assuming that every instance of cyt c release is driven by MPT and should therefore be accompanied by an immediate, global collapse of ΔΨm is a significant oversimplification.
Table 2: Key Confounding Factors When Interpreting ΔΨm
| Confounding Factor | Description | Experimental Implication |
|---|---|---|
| Transient Depolarization | ΔΨm can depolarize and then recover after MOMP [99]. | Single-cell, real-time analysis is superior to population-level, endpoint measurements. |
| Caspase Dependence | Irreversible ΔΨm loss often depends on downstream caspase activity [99]. | Use caspase inhibitors (e.g., Z-VAD-FMK) to dissect primary vs. secondary events. |
| MPT vs. MOMP | MPT causes ΔΨm collapse; MOMP may not. | Use MPT inhibitors (e.g., Cyclosporin A) to determine the mechanism. |
| Bioenergetic Status | Cells can use cytosolic cyt c to support ΔΨm and ATP production [99]. | Monitor cellular ATP/ADP levels in conjunction with ΔΨm. |
Essential Experimental Protocols and Reagents
Accurate interpretation requires robust and specific methodologies. Below are detailed protocols for key techniques in the field.
Protocol: Simultaneous Assessment of ΔΨm and Cytochrome c Release in Single Cells
This protocol allows for the direct correlation of ΔΨm dynamics with the subcellular localization of cyt c in real time.
- Cell Preparation: Use HeLa cells stably expressing cytochrome c-GFP (Cc-GFP-HeLa) or perform transient transfection [99] [101].
- Staining: Load cells with tetramethylrhodamine ethyl ester (TMRE) at a concentration of 50 nM in culture media for 20 minutes at 37°C. TMRE is a potentiometric dye that accumulates in active mitochondria in a ΔΨm-dependent manner [99].
- Microscopy: Plate cells on glass-bottom dishes and image using a confocal microscope equipped with a live-cell incubation chamber (37°C, 5% CO₂).
- Image Acquisition:
- Acquire baseline images of TMRE fluorescence (excitation/emission ~549/575 nm) and GFP fluorescence (~488/510 nm).
- Induce apoptosis by adding a stimulus (e.g., 1 µM staurosporine or 1 µM actinomycin D) directly to the chamber.
- Acquire time-lapse images every 2-5 minutes for 1-2 hours.
- Data Analysis: A release event is identified by the diffuse redistribution of cyt c-GFP fluorescence from a punctate mitochondrial pattern to a homogeneous cytosolic signal. Concurrent changes in TMRE fluorescence are quantified for the same cell.
Protocol: Subcellular Fractionation to Assess Cytochrome c Release
This biochemical method quantitatively measures cyt c release in a population of cells.
- Cell Lysis and Fractionation:
- Harvest approximately 1x10⁷ cells by centrifugation.
- Resuspend the cell pellet in 100 µL of ice-cold Mitochondrial Isolation Buffer (e.g., 250 mM sucrose, 20 mM HEPES-KOH pH 7.4, 10 mM KCl, 1.5 mM MgCl₂, 1 mM EGTA, 1 mM DTT) supplemented with 50-200 µg/mL digitonin and protease inhibitors [101].
- Incubate on ice for 5-10 minutes. Confirm >95% plasma membrane permeabilization using Trypan blue exclusion.
- Centrifuge at 1,000 x g for 5 minutes at 4°C.
- Collection of Fractions:
- The supernatant (S1) contains the cytosolic fraction, including any released cyt c.
- The pellet contains the heavy membrane fraction (mitochondria). For a clean mitochondrial fraction, wash the pellet in digitonin-free buffer and re-centrifuge. The pellet can be lysed in mitochondrial lysis buffer (e.g., 50 mM HEPES pH 7.4, 1% NP-40) to obtain the mitochondrial fraction [101].
- Detection:
- Subject proteins from both fractions to SDS-PAGE and Western blotting.
- Probe blots with anti-cytochrome c antibody (e.g., 7H8.2C12). Use markers for different compartments for validation (e.g., COX IV for mitochondria, tubulin for cytosol).
The Scientist's Toolkit: Essential Research Reagents
Table 3: Key Reagents for Investigating ΔΨm and Cyt c Release
| Reagent / Assay | Function / Application | Key Considerations |
|---|---|---|
| TMRE | Potentiometric fluorescent dye for measuring ΔΨm [99]. | Use at low concentrations (e.g., 20-50 nM) to avoid artifacts; quenching upon depolarization. |
| Cytochrome c-GFP | Enables direct visualization of cyt c release via live-cell imaging [99]. | Requires generation of stable cell lines; confirms localization at the single-cell level. |
| Digitonin-based Fractionation | Selectively permeabilizes plasma membrane for biochemical separation of cytosolic and mitochondrial fractions [101]. | Digitonin concentration is critical and must be optimized for each cell type. |
| Caspase Inhibitor (Z-VAD-FMK) | Pan-caspase inhibitor to dissect caspase-dependent and -independent ΔΨm loss [99]. | Confirms if depolarization is a primary or secondary event. |
| MPT Inhibitor (Cyclosporin A) | Inhibits cyclophilin D, a regulator of the MPT pore [45]. | Determines the contribution of MPT to the observed cell death phenotype. |
The following workflow integrates these protocols and reagents into a logical experimental strategy for dissecting the relationship between ΔΨm and cyt c release.
The interpretation of ΔΨm changes in the context of cyt c release demands a move beyond simplistic models. The data compellingly show that a loss of ΔΨm is neither a reliable proxy for nor a mandatory prerequisite of MOMP. Instead, the dissolution of ΔΨm is a context-dependent event, heavily influenced by the permeabilization mechanism (MOMP vs. MPT), the activity of downstream caspases, and the cell's bioenergetic adaptability. For researchers in drug development, this is particularly salient. A therapeutic agent designed to induce apoptosis via the intrinsic pathway may be highly effective without causing an immediate, global collapse of ΔΨm. Relying solely on ΔΨm as a primary screening readout could therefore lead to the dismissal of promising compounds. Future research must embrace complex models and multi-parametric assays that capture the temporal and spatial nuances of these fundamental processes in cell death signaling.
The intrinsic apoptosis pathway, a programmed cell death mechanism essential for development and tissue homeostasis, is initiated by diverse cellular stresses including DNA damage and growth factor withdrawal. A pivotal event in this pathway is the mitochondrial outer membrane permeabilization (MOMP), which leads to the release of cytochrome c (Cyt c) from the mitochondrial intermembrane space into the cytosol [5] [38]. Once in the cytosol, cytochrome c binds to Apoptotic Protease Activating Factor 1 (Apaf-1), forming the apoptosome complex that activates caspase-9, which in turn activates effector caspases such as caspase-3 and -7, ultimately executing apoptosis [26] [5]. Caspase inhibition strategies serve as indispensable tools for delineating the temporal sequence of these apoptotic events, particularly for distinguishing upstream signaling events from downstream consequences of caspase activation.
Understanding the order of molecular events is crucial for both basic research and therapeutic development. For instance, distinguishing whether cytochrome c release occurs upstream or downstream of caspase activation has significant implications for designing treatments for cancer, neurodegenerative disorders, and other diseases involving dysregulated apoptosis [37]. This technical guide provides researchers with a comprehensive framework for employing caspase inhibitors to map apoptotic pathways, with a specific focus on validating the position of mitochondrial cytochrome c release within the cell death cascade.
The Apoptotic Pathway: Molecular Framework for Intervention
The intrinsic apoptosis pathway is rigorously regulated by the BCL-2 protein family, which includes pro-apoptotic (e.g., BAX, BAK, BID) and anti-apoptotic (e.g., BCL-2, BCL-xL) members [102] [38]. A key regulatory mechanism involves the caspase-8-mediated cleavage of BID to its truncated form (tBID) at the mitochondrial membrane. This process occurs within a specialized platform comprising cardiolipin (a mitochondrial lipid), caspase-8, and BID [102] [103]. tBID subsequently activates the pore-forming proteins BAX and BAK, leading to MOMP and cytochrome c release [102] [103].
Table 1: Key Molecular Components in the Intrinsic Apoptosis Pathway
| Component | Function in Apoptosis | Regulatory Role |
|---|---|---|
| Cytochrome c | Electron transport in mitochondria; apoptosome formation in cytosol [5] | Initiation of caspase cascade upon release |
| Caspase-9 | Initiator caspase activated by apoptosome [26] | Activates executioner caspases (e.g., caspase-3/7) |
| Caspase-3/7 | Executioner caspases [26] | Cleave cellular substrates, leading to apoptotic morphology |
| Apaf-1 | Cytosolic adaptor protein forming apoptosome with cytochrome c [5] | Platform for caspase-9 activation |
| BID/tBID | Pro-apoptotic BCL-2 family protein; target of caspase-8 [102] | Links extrinsic and intrinsic pathways; activates BAX/BAK |
| BAX/BAK | Pro-apoptotic multi-domain proteins [38] | Form pores in mitochondrial outer membrane (MOMP) |
| Cardiolipin | Mitochondrial-specific phospholipid [102] | Platform for caspase-8 activation and tBID generation |
The following diagram illustrates the core intrinsic apoptosis pathway and the critical intervention point for caspase inhibitors.
Figure 1: The Intrinsic Apoptosis Pathway and Caspase Inhibition Point. This diagram illustrates the sequence of events from cellular stress to apoptotic execution, highlighting the critical step where caspase inhibitors, such as zVAD-fmk, intervene to block caspase activation and subsequent cell death.
Caspase Inhibition: Mechanisms and Experimental Applications
Caspase inhibitors are typically synthetic peptides that mimic the caspase recognition sequence and contain an electrophilic group that covalently binds to the catalytic cysteine residue in the caspase active site, thereby irreversibly inhibiting enzyme activity [37]. The most commonly used broad-spectrum inhibitor is zVAD-fmk (benzyloxycarbonyl-Val-Ala-Asp-fluoromethylketone), which effectively inhibits most caspases [33] [37].
The strategic application of these inhibitors allows researchers to determine the dependency of a particular apoptotic event on caspase activity. If an event (such as cytochrome c release) occurs even in the presence of a potent caspase inhibitor, it can be classified as an upstream, caspase-independent event. Conversely, if the event is blocked by the inhibitor, it is considered a downstream, caspase-dependent event [37].
Table 2: Commonly Used Caspase Inhibitors in Apoptosis Research
| Inhibitor | Target Specificity | Key Applications in Research |
|---|---|---|
| zVAD-fmk | Pan-caspase inhibitor [37] | Determining overall caspase dependency of a process; blocking late apoptotic events |
| Ac-DEVD-CHO | Caspase-3 and -7 [37] | Specifically inhibiting executioner caspase activity |
| Ac-LEHD-CHO | Caspase-9 [26] | Blocking initiator caspase of the intrinsic pathway |
| Ac-IETD-CHO | Caspase-8 [26] | Inhibiting the initiator caspase of the extrinsic pathway |
A Case Study: Determining the Caspase-Dependency of Cytochrome c Release
Research utilizing caspase inhibitors has revealed that cytochrome c release is a complex process that can occur in distinct stages. A seminal study investigating ionizing radiation-induced apoptosis in IM-9 myeloid cells demonstrated a two-stage release mechanism [37].
- Stage 1 - Early, Caspase-Independent Release: A small amount of cytochrome c is released from mitochondria before significant caspase- activation. This release is not inhibited by zVAD-fmk and is sufficient to initiate low-level activation of caspases-9 and -3 [37].
- Stage 2 - Late, Caspase-Dependent Amplification: Following initial caspase activation, a massive, irreversible release of cytochrome c occurs. This secondary release is blocked by zVAD-fmk, indicating it is caspase-dependent. This stage is associated with a loss of mitochondrial membrane potential (ΔΨm) and a decline in cellular ATP levels, reflecting mitochondrial dysfunction [37].
This two-stage model was further supported by experiments showing that recombinant caspase-3 could directly induce cytochrome c release from isolated mitochondria, confirming that activated caspases can feed back to amplify the initial mitochondrial signal [37].
Experimental Protocols for Pathway Mapping
This section provides detailed methodologies for key experiments designed to position cytochrome c release relative to caspase activation using pharmacological inhibition.
Protocol: Inhibitor Treatment and Apoptosis Induction
This protocol outlines the foundational steps for using zVAD-fmk to assess caspase dependency.
- Cell Preparation: Plate cells in appropriate culture dishes and allow them to adhere and reach 50-70% confluence.
- Pre-treatment with Inhibitor: Add 50-100 µM zVAD-fmk (or an equivalent volume of vehicle control, e.g., DMSO) to the culture medium 1 hour prior to the apoptotic stimulus. This pre-incubation ensures effective inhibition at the time of induction [37].
- Induction of Apoptosis: Apply the chosen apoptotic stimulus (e.g., ionizing radiation, 10 µM etoposide, growth factor withdrawal) to the cells.
- Incubation and Time-Course: Incubate cells for varying time periods (e.g., 2, 4, 8, 16, 24 hours) post-induction to capture early and late events.
- Harvesting: Harvest cells at each time point for subsequent analysis by subcellular fractionation, Western blotting, and caspase activity assays.
Protocol: Subcellular Fractionation and Cytochrome c Release Analysis
This protocol details the separation of mitochondrial and cytosolic fractions to monitor cytochrome c localization.
- Cell Lysis: Harvest and wash cells with ice-cold PBS. Resuspend the cell pellet in isotonic homogenization buffer (e.g., 210 mM mannitol, 70 mM sucrose, 1 mM EDTA, 10 mM HEPES, pH 7.5, supplemented with protease inhibitors) [33].
- Homogenization: Lyse cells using a Dounce homogenizer with a tight-fitting pestle (approximately 30-50 strokes). Efficiency can be monitored by trypan blue staining (>90% cell lysis is ideal).
- Fractionation: Centrifuge the homogenate at 900 g for 5 minutes at 4°C to remove nuclei and unbroken cells. Transfer the supernatant to a new tube and centrifuge at 10,000 g for 30 minutes at 4°C [33].
- Collection of Fractions:
- The resulting supernatant (S10) represents the cytosolic fraction.
- The pellet (P10) represents the heavy membrane fraction enriched in mitochondria. Resuspend this pellet in a lysis buffer containing 0.2% Triton X-100.
- Western Blot Analysis: Resolve 20-50 µg of protein from both cytosolic and mitochondrial fractions by SDS-PAGE. Transfer to a membrane and immunoblot for cytochrome c. Also, blot for compartment-specific markers to confirm fractionation purity (e.g., COX IV for mitochondria, α-tubulin for cytosol).
- Data Interpretation: The appearance of cytochrome c in the cytosolic fraction and its concomitant depletion from the mitochondrial fraction indicates release. Compare the levels and kinetics between zVAD-fmk-treated and untreated cells to determine caspase dependency.
Protocol: Caspase Activity Assay
Confirm the efficacy of caspase inhibition and monitor activation kinetics.
- Sample Preparation: Prepare whole-cell lysates or cytosolic fractions from treated and control cells.
- Reaction Setup: Incubate cell lysates with caspase-specific chromogenic or fluorogenic substrates (e.g., Ac-DEVD-pNA for caspase-3/7) in assay buffer at 37°C [37].
- Measurement: Monitor the release of the chromophore (p-nitroanilide, pNA) or fluorophore over time using a spectrophotometer or fluorometer.
- Data Analysis: Compare caspase activity levels across different treatment conditions (e.g., stimulus alone vs. stimulus + zVAD-fmk). Effective inhibition is demonstrated by a significant reduction in substrate cleavage in the zVAD-fmk-treated samples.
The Scientist's Toolkit: Essential Research Reagents
Table 3: Key Reagent Solutions for Caspase Inhibition Studies
| Reagent / Assay | Function | Example Use Case |
|---|---|---|
| zVAD-fmk | Broad-spectrum caspase inhibitor; establishes caspase dependency [37] | Used at 50-100 µM to pre-treat cells and determine if cytochrome c release is an upstream event |
| Cytochrome c Antibody | Detects cytochrome c protein via Western blot or immunofluorescence [33] [37] | Critical for monitoring its translocation from mitochondria to cytosol in fractionation experiments |
| Caspase Activity Assay Kits | Measure the proteolytic activity of specific caspases using colorimetric or fluorescent substrates [37] | Confirms the efficacy of caspase inhibitors and quantifies the extent of caspase activation |
| Subcellular Fractionation Kits | Isolate relatively pure mitochondrial and cytosolic cellular compartments [33] | Essential for objectively quantifying cytochrome c release, superior to whole-cell lysate analysis |
| Mitochondrial Dyes (e.g., Rhodamine 123) | Assess mitochondrial health and function, including membrane potential (ΔΨm) [37] | Used to correlate late-stage cytochrome c release with loss of ΔΨm and mitochondrial dysfunction |
Data Interpretation and Visualization
The following diagram synthesizes the experimental workflow and the logical decision process for interpreting results from caspase inhibition experiments, specifically in the context of cytochrome c release.
Figure 2: Experimental Workflow and Interpretation Logic for Caspase Inhibition. This flowchart outlines the key experimental step and the logical process for determining whether cytochrome c release is upstream or downstream of caspase activation. The dashed box represents a more complex, multi-stage release process as identified in research [37].
Advanced Concepts and Inter-pathway Cross-talk
Beyond the intrinsic pathway, caspase inhibition studies have revealed intricate crosstalk between different cell death modalities. Caspase-8, for instance, acts as a molecular switch. It not only initiates extrinsic apoptosis by cleaving caspase-3 and BID but also, when inhibited, can shift cell fate towards necroptosis, a form of inflammatory programmed necrosis [26] [38]. Furthermore, recent research has uncovered non-apoptotic roles for apoptotic components. Notably, sublethal cytochrome c release can promote cell survival by inhibiting another form of cell death called ferroptosis. Cytosolic cytochrome c was shown to complex with INPP4A, boosting its phosphatase activity and preventing lethal lipid peroxidation, thereby repressing ferroptosis [104]. This finding redefines cytosolic cytochrome c as a regulator of multiple cell death pathways, not just an apoptosis trigger.
Strategic caspase inhibition remains a cornerstone methodology for deconstructing the complex molecular sequence of apoptotic signaling. The application of pan-caspase inhibitors like zVAD-fmk has been instrumental in establishing that cytochrome c release can initiate caspase activation, but also that a secondary, amplification phase of release is often driven by active caspases, creating a positive feedback loop [37]. This nuanced understanding is vital for accurate pathway mapping. As research progresses, the role of mitochondrial events and caspase activity continues to expand, revealing complex cross-regulation between apoptosis, necroptosis, and ferroptosis. A rigorous experimental approach, incorporating the protocols and controls outlined in this guide, is essential for researchers aiming to definitively classify pathway events and identify optimal therapeutic intervention points for diseases characterized by dysregulated cell death.
The susceptibility of cells to undergo apoptosis is not uniform across different cell types; rather, it exhibits remarkable variation governed by a complex interplay of molecular regulators. Within the context of intrinsic apoptosis, which is characterized by mitochondrial outer membrane permeabilization (MOMP) and the release of cytochrome c, these differential sensitivities determine fundamental biological outcomes in development, homeostasis, and disease [100] [22]. Understanding the precise molecular mechanisms that establish and modulate these cellular susceptibility thresholds is critical for both basic biological research and the development of targeted therapeutic strategies, particularly in oncology where cancer cells often exploit these regulatory networks to evade cell death [22] [105].
This technical guide examines the key molecular determinants of cell type-specific apoptotic sensitivity, focusing on the regulatory networks that control the intrinsic pathway. We explore experimental approaches for quantifying these differential responses and provide a practical toolkit for researchers investigating cell death mechanisms. The insights presented herein aim to facilitate more precise manipulation of apoptotic thresholds for therapeutic benefit.
Molecular Mechanisms Governing Differential Apoptotic Sensitivity
The Type I/Type II Paradigm in Death Receptor Signaling
The classification of cells into Type I and Type II represents a fundamental distinction in apoptotic signaling pathways that reflects their differential sensitivity to death receptor stimulation.
- Type I Cells demonstrate direct caspase activation independent of mitochondrial amplification. In these cells, high levels of caspase-8 activation at the Death-Inducing Signaling Complex (DISC) are sufficient to directly process and activate effector caspases-3 and -7, bypassing the need for mitochondrial involvement [100].
- Type II Cells require mitochondrial amplification to achieve full apoptotic commitment. These cells exhibit limited caspase-8 activation at the DISC and depend on caspase-8-mediated cleavage of the BH3-only protein BID to generate truncated tBID. tBID subsequently translocates to mitochondria, inducing BAX/BAK oligomerization, MOMP, and cytochrome c release, which amplifies the apoptotic signal through the apoptosome [100] [106].
The critical determinant distinguishing these pathways is the cellular level of X-linked Inhibitor of Apoptosis Protein (XIAP). Cells with high XIAP expression typically require the mitochondrial amplification pathway (Type II) to overcome XIAP-mediated caspase inhibition, whereas cells with low XIAP levels can execute apoptosis directly via caspase-8 (Type I) [100]. This paradigm illustrates how differential expression of a single regulatory protein can fundamentally alter a cell's apoptotic pathway utilization.
BCL-2 Family Protein Expression and Regulation
The BCL-2 protein family serves as the primary regulatory network controlling MOMP, and the relative concentrations of its pro- and anti-apoptotic members establish the apoptotic threshold in different cell types.
- Pro-apoptotic Effectors: BAX and BAK are the essential gateway proteins for MOMP, forming pores in the outer mitochondrial membrane that facilitate cytochrome c release. Cells deficient in both BAX and BAK are profoundly resistant to a diverse array of apoptotic stimuli [106].
- Anti-apoptotic Regulators: BCL-2, BCL-XL, and MCL-1 function to restrain BAX/BAK activation, thereby raising the threshold for apoptosis induction. Overexpression of these anti-apoptotic proteins is a common mechanism of chemoresistance in cancer cells [22] [107].
- BH3-Only Proteins: These sensors (including BID, BIM, PUMA, and others) integrate death signals and either directly activate BAX/BAK or antagonize the anti-apoptotic BCL-2 members. The "direct activator" subclass (tBID, BIM, PUMA) can initiate BAX/BAK oligomerization, while "sensitizer" BH3-only proteins (Bad, Noxa) displace activators from anti-apoptotic proteins [106].
The specific expression patterns and stoichiometric relationships between these three BCL-2 family subgroups vary significantly between cell types, creating distinct susceptibility profiles to apoptotic stimuli.
Mitochondrial Composition and Membrane Dynamics
The mitochondrial membrane itself serves as more than just a passive platform for BCL-2 family interactions; its specific lipid composition and organizational state actively regulate apoptotic sensitivity.
- Cardiolipin Content: This mitochondrial-specific phospholipid plays a critical role in the mitochondrial apoptosis pathway. It facilitates the full activation of caspase-8 at the outer mitochondrial membrane and provides a docking site for tBID translocation and insertion [100]. Cells with varying cardiolipin content or composition may display markedly different sensitivities to intrinsic apoptotic stimuli.
- MICOS Complex: The Mitochondrial Contact Site and Cristae Organizing System determines mitochondrial membrane architecture and physiology. This complex maintains cristae structure and governs the release of cytochrome c and other intermembrane space proteins during apoptosis [100]. Disruption of MICOS can alter apoptotic susceptibility by modulating the availability of pro-apoptotic proteins for release.
- Cristae Remodeling: During apoptosis, mitochondrial cristae undergo structural reorganization that facilitates the complete release of cytochrome c. Variations in cristae architecture between cell types may contribute to differential apoptotic kinetics and thresholds [100].
Table 1: Molecular Determinants of Cell Type-Specific Apoptotic Sensitivity
| Regulatory Component | Molecular Function | Impact on Apoptotic Sensitivity |
|---|---|---|
| XIAP Protein Level | Inhibits caspase-3, -7, and -9 activity | High levels confer Type II characteristics requiring mitochondrial amplification |
| Caspase-8 Expression | Initiator caspase in extrinsic pathway | High levels enable Type I apoptosis independent of mitochondria |
| BCL-2/BCL-XL Level | Sequester activators of BAX/BAK | Overexpression increases apoptotic threshold; common in chemoresistant cancers |
| BAX/BAK Expression | Execute MOMP through oligomerization | Deficiency confers profound resistance to intrinsic apoptosis |
| Cardiolipin Composition | Platform for caspase-8 and tBID activation | Modulates efficiency of mitochondrial apoptosis pathway |
| BH3-Only Protein Repertoire | Signal-specific initiation of apoptosis | Determines response patterns to different death stimuli |
Experimental Approaches for Assessing Apoptotic Sensitivity
Real-Time Imaging of Caspase Activation and Membrane Integrity
Advanced quantitative imaging approaches enable dynamic, single-cell analysis of apoptotic commitment, allowing researchers to distinguish between primary apoptosis, secondary necrosis, and other cell death modalities.
Methodology Overview: The established protocol utilizes cells stably expressing two fluorescent reporters: (1) a FRET-based caspase sensor (ECFP and EYFP linked by a DEVD caspase-cleavable sequence), and (2) a mitochondrial-targeted DsRed (Mito-DsRed) that serves as a non-soluble marker of cellular integrity [108].
Experimental Workflow:
- Cell Line Development: Establish stable cell lines expressing homogeneous levels of both the FRET-based caspase sensor and Mito-DsRed.
- Treatment and Imaging: Expose cells to apoptotic stimuli (e.g., doxorubicin, staurosporine) or necrotic inducers (e.g., H₂O₂) while performing time-lapse imaging using wide-field, confocal, or high-throughput microscopy systems.
- Multiparameter Image Analysis: Quantify three key parameters simultaneously:
- FRET Ratio Change: Caspase activation is indicated by an increase in ECFP/EYFP emission ratio due to cleavage of the DEVD linker.
- Mito-DsRed Retention: The persistence of mitochondrial fluorescence indicates maintained membrane integrity.
- FRET Probe Retention: Loss of both ECFP and EYFP fluorescence indicates plasma membrane permeability.
- Cell Fate Classification: Based on the dynamic fluorescence patterns:
- Viable Cells: Maintain intact FRET probe (no ratio change) and retain Mito-DsRed fluorescence.
- Apoptotic Cells: Display FRET ratio change while retaining Mito-DsRed fluorescence.
- Necrotic Cells: Lose FRET probe fluorescence without ratio change while retaining Mito-DsRed signal.
- Late Apoptotic/Secondary Necrotic Cells: Show initial FRET ratio change followed by subsequent loss of FRET probe [108].
This methodology provides unprecedented resolution for tracking temporal progression of cell death and can be adapted for high-throughput compound screening to assess cell type-specific death responses.
Quantitative Assessment of Mitochondrial Parameters
Quantitative Phase Imaging (QPI) represents a powerful label-free approach for characterizing cell death dynamics through measurements of biophysical parameters that change during apoptosis.
Technical Implementation: QPI utilizes holographic microscopy to measure subtle changes in cell mass distribution and density without requiring fluorescent labels or cell fixation [109].
Key Measurable Parameters:
- Cell Density: Measured in picograms per pixel (pg/pixel), this parameter typically increases during apoptosis due to cell shrinkage and water loss.
- Cell Dynamic Score (CDS): A derived metric representing the average intensity change of cell pixels over time, which captures dynamic morphological alterations.
- Morphological Features: QPI can detect characteristic apoptotic features including membrane blebbing, nuclear condensation, and cell shrinkage with high temporal resolution [109].
Classification Performance: When combined with machine learning algorithms, QPI-based parameters can distinguish caspase-dependent and caspase-independent cell death subroutines with approximately 75% prediction accuracy, providing a robust label-free method for profiling cell type-specific death responses [109].
Table 2: Quantitative Parameters for Distinguishing Cell Death Modalities
| Parameter | Measurement Technique | Apoptotic Signature | Necrotic Signature |
|---|---|---|---|
| Caspase Activation | FRET-based biosensor [108] | DEVD cleavage with FRET loss | No caspase activation |
| Membrane Integrity | Propidium iodide uptake / Mito-DsRed retention [108] | Maintained until late stages | Early loss of barrier function |
| Cell Density | Quantitative Phase Imaging [109] | Increased density (cell shrinkage) | Decreased density (cell swelling) |
| Morphological Dynamics | Cell Dynamic Score (CDS) [109] | Characteristic "Dance of Death" microblebbing | Swelling and rupture without blebbing |
| Mitochondrial Membrane Potential | TMRE, JC-1 staining [110] | Collapse during MOMP | Variable, often dissipates |
The Scientist's Toolkit: Essential Research Reagents
Table 3: Key Research Reagents for Apoptosis Sensitivity Studies
| Reagent / Tool | Primary Function | Application in Sensitivity Studies |
|---|---|---|
| FRET Caspase Sensor (ECFP-DEVD-EYFP) | Caspase-3/7 activity reporting | Real-time visualization of caspase activation kinetics in live cells [108] |
| Mito-DsRed | Mitochondrial mass and integrity marker | Distinguishes primary necrosis from apoptosis; tracks organelle fate [108] |
| z-VAD-FMK | Pan-caspase inhibitor | Determines caspase-dependence of cell death; identifies caspase-independent pathways [109] |
| CellEvent Caspase-3/7 Green | Fluorogenic caspase substrate | Endpoint or live-cell detection of executioner caspase activation [109] |
| Propidium Iodide | Membrane impermeant DNA dye | Identifies loss of plasma membrane integrity (necrosis/late apoptosis) [109] |
| BH3 Mimetics (e.g., ABT-199) | Specific BCL-2 family inhibitors | Profiles dependence on specific anti-apoptotic proteins; "BH3 profiling" for predictive sensitivity [22] |
| Recombinant Death Ligands (FasL, TRAIL) | Extrinsic pathway activation | Assess Type I/II classification and death receptor sensitivity [100] [110] |
Cell type-specific variations in apoptotic sensitivity represent a fundamental biological phenomenon with profound implications for development, tissue homeostasis, and disease pathogenesis. The molecular determinants of these differential sensitivities—spanning the BCL-2 family repertoire, IAP protein expression, mitochondrial composition, and caspase activation thresholds—create a complex regulatory network that establishes each cell's unique death threshold. The experimental approaches and research tools detailed in this technical guide provide a framework for systematically investigating these variations, enabling researchers to quantify apoptotic susceptibilities with increasing precision. As our understanding of these regulatory mechanisms deepens, so too does our ability to therapeutically manipulate apoptotic thresholds in diseases characterized by dysregulated cell death, particularly cancer where overcoming chemoresistance remains a paramount challenge.
The intrinsic apoptosis pathway is a precisely regulated mechanism of programmed cell death, central to development, tissue homeostasis, and the pathogenesis of numerous diseases. Mitochondrial outer membrane permeabilization (MOMP) represents a critical commitment point in this pathway, enabling the release of intermembrane space proteins, chief among them being cytochrome c [111]. In healthy cells, cytochrome c functions as an essential electron shuttle in the mitochondrial respiratory chain. However, upon its release into the cytosol, it initiates the formation of the apoptosome—a multimeric complex comprising cytochrome c, Apaf-1, and procaspase-9 [3]. This complex facilitates the activation of caspase-9, which in turn cleaves and activates effector caspases-3, -6, and -7, ultimately leading to the systematic dismantling of the cell [111]. Research into mechanisms triggering cytochrome c release is therefore fundamental for developing therapies for cancer, neurodegenerative disorders, and other conditions characterized by apoptotic dysregulation. This guide details optimized protocols for inducing intrinsic apoptosis via three key strategies: the broad kinase inhibitor staurosporine, the targeted BH3 mimetic ABT-737, and precisely controlled photothermal stress.
Staurosporine: A Broad-Spectrum Inducer of Mitochondrial Apoptosis
Staurosporine is a potent, broad-spectrum kinase inhibitor widely utilized to induce the intrinsic apoptotic pathway in experimental models. It triggers a rapid and well-characterized sequence of mitochondrial events, serving as a positive control in cytochrome c release studies.
Mechanism of Action
Staurosporine induces apoptosis by initiating mitochondrial cytochrome c release in a Bax/Bak-dependent manner, which occurs as an early event prior to a measurable loss of mitochondrial transmembrane potential (ΔΨm) and is not prevented by broad-spectrum caspase inhibitors like zVAD-fmk [59]. This places its primary action at the level of Bcl-2 protein regulation and MOMP control.
Experimental Protocol for Staurosporine Treatment
The following protocol is optimized for adherent cell lines such as HeLa or CEM cells [59].
- Reagent Preparation: Prepare a 1 mM stock solution of staurosporine in high-quality DMSO. Aliquot and store at -20°C. Avoid repeated freeze-thaw cycles.
- Cell Seeding and Culture: Seed cells in appropriate culture dishes to reach 50-60% confluence at the time of treatment. Allow cells to adhere fully overnight in a standard humidified incubator at 37°C with 5% CO₂.
- Treatment Application: Dilute the staurosporine stock directly into the pre-warmed culture medium to achieve a final working concentration of 1 µM. A vehicle control containing an equivalent volume of DMSO (e.g., 0.1% v/v) is essential.
- Incubation and Monitoring: Incubate cells with staurosporine for 2 to 4 hours. Cytochrome c release can be detected as early as 30 minutes post-treatment, preceding caspase activation and DNA fragmentation [59].
- Analysis and Validation:
- Cytochrome c Release: Assess by subcellular fractionation to isolate cytosolic fractions, followed by Western blotting using anti-cytochrome c antibodies. Alternatively, use immunofluorescence microscopy to visualize the translocation of cytochrome c from punctate mitochondrial patterns to a diffuse cytosolic localization.
- Apoptotic Confirmation: Measure activation of executioner caspases (e.g., caspase-3) via fluorometric or colorimetric activity assays, or by detecting cleavage of caspase substrates like PARP.
Optimization Notes
Titration of staurosporine concentration (0.1 - 2 µM) and treatment duration may be necessary for different cell types. The efficacy of cytochrome c release and subsequent apoptosis can be influenced by the baseline expression levels of pro- and anti-apoptotic Bcl-2 family proteins.
ABT-737: A Targeted BH3 Mimetic and Combinatorial Strategies
ABT-737 is a pioneering small-molecule BH3 mimetic that antagonizes specific anti-apoptotic Bcl-2 proteins. Its targeted mechanism and combinatorial potential make it a cornerstone of modern apoptosis research and drug development.
Mechanism of Action
ABT-737 binds with high affinity (IC50 < 10 nM) to the hydrophobic grooves of Bcl-2, Bcl-xL, and Bcl-w, effectively displacing pro-apoptotic BH3-only proteins like Bax and Bak [112]. This displacement allows Bax/Bak to oligomerize and permeabilize the mitochondrial outer membrane, leading to cytochrome c release. A critical determinant of sensitivity is Mcl-1; because ABT-737 does not target Mcl-1, high Mcl-1 expression is a primary resistance mechanism [112] [113].
Experimental Protocol for ABT-737 Treatment
This protocol outlines single-agent use and a key combinatorial strategy to overcome resistance.
- Reagent Preparation: Prepare a 10 mM stock solution of ABT-737 in DMSO. Store aliquots at -80°C protected from light.
- Single-Agent Treatment:
- Apply ABT-737 to cells at concentrations typically ranging from 0.1 to 10 µM for 24-48 hours [112].
- Sensitivity is highly dependent on cellular Mcl-1 levels. Cell lines with low Mcl-1 (e.g., some lymphomas) may undergo robust apoptosis, while those with high Mcl-1 (e.g., many solid tumors) will be refractory.
- Combinatorial Strategy to Sensitize Resistant Cells: To overcome Mcl-1-mediated resistance, combine ABT-737 with agents that downregulate or inhibit Mcl-1.
- Protocol: Pre-treat cells for 2-4 hours with a pharmacological Mcl-1 inhibitor (e.g., S63845, not in search results) or use genetic strategies (siRNA/shRNA against Mcl-1) for 24-48 hours to deplete Mcl-1. Then, add ABT-737 (at 1 µM) for an additional 24 hours [112] [113].
- This combination can synergistically induce Bax/Bak-dependent apoptosis in otherwise resistant cells [112].
Analysis and Validation
- Protein Interaction Studies: Use co-immunoprecipitation with an anti-Bcl-2 antibody to demonstrate that ABT-737 disrupts the endogenous Bcl-2/BAX complex [113].
- Cell Viability: Measure apoptosis via Annexin V/propidium iodide staining and flow cytometry.
- Mechanistic Confirmation: Confirm the dependence on Bax/Bak using wild-type versus Bax/Bak double-knockout mouse embryo fibroblasts (MEFs), which are completely resistant to ABT-737 [112].
Photothermal Stress: A Novel Physical Inducer of Cell Death
Photothermal therapy (PTT) uses photothermal agents activated by near-infrared (NIR) light to generate localized heat, inducing various forms of cell death. The parameters of this stress are critical for steering the cellular response towards apoptosis or other death modalities.
Mechanism of Cell Death
The mode of cell death induced by PTT is highly dependent on the thermal dose (temperature and time).
- Mild-Temperature PTT (mPTT, 42-45°C): Can induce immunogenic cell death (ICD) and, under specific conditions, apoptosis. It promotes the release of damage-associated molecular patterns (DAMPs) and can upregulate heat shock proteins (HSPs) like HSP70, which may initially confer thermoresistance [114] [115].
- High-Temperature PTT (>50°C): Typically causes necrotic cell death, which can trigger undesirable inflammatory responses [116].
- Synergistic Nano-Agents: Advanced nanoparticle systems (e.g., FePc NPs) can catalyze reactive oxygen species (ROS) generation under NIR irradiation. This can simultaneously trigger ferroptosis (via lipid peroxidation and GPX4 inactivation) and pyroptosis (via the Caspase-1/GSDMD pathway), creating a potent, immunogenic anti-tumor response [114].
Experimental Protocol for Photothermal Stress
This protocol utilizes a common photothermal agent, Indocyanine Green (ICG), adaptable to other agents like gold nanoparticles or FePc NPs [115] [114].
- Photothermal Agent Preparation: Prepare a 1 mg/mL (1000 µg/mL) stock solution of ICG in sterile water. Protect from light and use freshly prepared.
- Cell Loading:
- Seed cells in 96-well or other optically clear plates.
- Incubate cells with 100 µg/mL ICG in PBS or serum-free medium for 90 minutes at 37°C [115].
- Carefully wash cells twice with warm PBS to remove unincorporated agent.
- Near-Infrared (NIR) Laser Irradiation:
- Use an 808 nm NIR laser.
- Resuspend cells in a small volume (e.g., 50 µL) of fresh medium to concentrate the cells.
- Irradiate the cell spot at a defined power density and duration. Critical: Monitor the temperature in real-time with an infrared thermal camera [115].
- Parameter Optimization and Post-Treatment:
- After irradiation, immediately add warm culture medium to the cells.
- Allow cells to recover in a 37°C incubator for 1-6 hours before analyzing downstream apoptotic events.
Optimization of Stress Parameters
The table below summarizes key photothermal stress parameters for steering cell death fate.
Table 1: Photothermal Stress Parameters and Cell Death Outcomes
| Target Temperature | Laser Parameters (Example) | Primary Cell Death Mechanism | Key Molecular Markers | Notes and Applications |
|---|---|---|---|---|
| ~43°C (mPTT) | 808 nm, 0.8 W/cm², 5-10 min [114] | Apoptosis / Immunogenic Cell Death (ICD) | Caspase-3 activation, Cytochrome c release, Surface exposure of CALR, Release of ATP and HMGB1 [115] | Upregulation of HSP70 can cause thermoresistance. Requires combinatorial strategies for efficacy. |
| >50°C (Ablative PTT) | 808 nm, 1.5 W/cm², 5-10 min | Necrosis | LDH release, loss of membrane integrity, Pro-inflammatory cytokine release [116] | Causes collateral damage to surrounding tissues; promotes inflammation. |
| Combinatorial mPTT & ROS | 808 nm, 0.8 W/cm², 5 min (with FePc NPs) [114] | Ferroptosis & Pyroptosis | Lipid peroxidation, GSH depletion, GPX4 inactivation; Cleavage of GSDMD [114] | Powerful synergy for overcoming apoptosis resistance and remodeling the tumor microenvironment. |
The Scientist's Toolkit: Essential Reagents and Materials
This table catalogs key reagents and tools for researching intrinsic apoptosis induction.
Table 2: Research Reagent Solutions for Apoptosis Induction
| Reagent / Tool | Function / Mechanism | Key Considerations |
|---|---|---|
| Staurosporine | Broad-spectrum kinase inhibitor; induces rapid, Bax/Bak-dependent cytochrome c release. [59] | Serves as a strong positive control. Can have off-target effects due to its potency. |
| ABT-737 | Small-molecule BH3 mimetic; inhibits Bcl-2, Bcl-xL, and Bcl-w. [112] | Check Mcl-1 status for resistance. Precursor to clinical analogs (e.g., Navitoclax). |
| Mcl-1 siRNA/shRNA | Genetic knockdown tool to deplete Mcl-1 protein. | Critical for sensitizing resistant cells to ABT-737. [112] |
| Indocyanine Green (ICG) | FDA-approved NIR dye used as a photothermal agent. [115] | Prone to photobleaching and aqueous instability. Handle in the dark. |
| FePc Nanoparticles | Multifunctional nanoplatform with peroxidase-like activity. [114] | Generates ROS under NIR to induce ferroptosis/pyroptosis, bypassing apoptotic resistance. |
| zVAD-fmk | Pan-caspase inhibitor. | Used to confirm caspase-dependent apoptosis or to investigate caspase-independent cell death pathways. [59] |
| Bax/Bak DKO MEFs | Mouse embryonic fibroblasts lacking both Bax and Bak. | Essential control to prove the requirement for the intrinsic pathway, as these cells are resistant to ABT-737 and other mitochondrial stressors. [112] |
Signaling Pathways and Experimental Workflows
Core Intrinsic Apoptosis Signaling Pathway
This diagram illustrates the central pathway of intrinsic apoptosis, integrating the action points of the inducers discussed.
Diagram 1: Core Intrinsic Apoptosis Pathway and Inducer Action Points.
Experimental Workflow for Apoptosis Induction & Validation
This workflow outlines a generalized experimental process for conducting and validating the apoptosis induction strategies described in this guide.
Diagram 2: Generalized Workflow for Apoptosis Induction and Validation.
The intrinsic apoptosis pathway, governed by the precise regulation of mitochondrial outer membrane permeabilization (MOMP) and cytochrome c release, is a critical defense mechanism against carcinogenesis. A major frontier in oncology lies in overcoming tumor resistance conferred by the overexpression of anti-apoptotic proteins, particularly B-cell lymphoma 2 (BCL-2) and the Inhibitor of Apoptosis (IAP) proteins. This whitepaper delineates the molecular mechanisms through which BCL-2 overexpression inhibits MOMP and how IAPs block subsequent caspase activation, creating a synergistic resistance architecture. We further explore cutting-edge therapeutic strategies, including BH3 mimetics and SMAC mimetics, which are designed to re-sensitize resistant malignancies to cell death. Supported by detailed experimental methodologies and quantitative data, this guide provides a framework for researchers and drug development professionals to advance therapeutics targeting these resilient cancer defenses.
The intrinsic apoptotic pathway is initiated in response to cellular stress signals, such as DNA damage or oncogene activation, and is centrally coordinated at the mitochondria [15] [117]. The pivotal event in this pathway is Mitochondrial Outer Membrane Permeabilization (MOMP), a process that is critically regulated by the BCL-2 family of proteins [15] [80]. Upon MOMP, proteins from the mitochondrial intermembrane space, including cytochrome c and SMAC, are released into the cytosol [15]. Cytochrome c binds to APAF-1, forming the apoptosome complex which activates caspase-9 and the ensuing caspase cascade [117]. Simultaneously, SMAC neutralizes IAP proteins, which are endogenous caspase inhibitors, thereby facilitating apoptosis [117].
Malignant cells often evade this programmed cell death through two primary, interconnected mechanisms:
- BCL-2 Overexpression: By overexpressing anti-apoptotic BCL-2 family members, cancer cells prevent the activation of the pro-apoptotic executors BAX and BAK, thereby inhibiting MOMP and cytochrome c release [9] [87].
- IAP Protein Interactions: By maintaining high levels of IAPs, cancer cells can block the function of caspases even if cytochrome c is released, effectively creating a fail-safe mechanism against apoptosis [117].
Understanding and overcoming this dual-layered resistance is paramount for the development of effective cancer therapies.
BCL-2 Family Dynamics and Mechanisms of Resistance
The Tripartite Apoptotic Switch
The BCL-2 protein family functions as a tripartite apoptotic switch, comprising three functionally distinct groups [9]:
- Anti-apoptotic Proteins: This group includes BCL-2, BCL-XL, MCL-1, BCL-w, and BFL-1. They contain four BH domains and preserve mitochondrial integrity by sequestering pro-apoptotic family members [9] [118].
- Pro-apoptotic Effectors: BAX and BAK are multi-domain proteins that, upon activation, homo-oligomerize to form pores in the mitochondrial outer membrane, directly causing MOMP [15] [80].
- BH3-only Proteins: These are upstream sentinels of cellular damage (e.g., BIM, BID, PUMA, BAD). They initiate apoptosis by either directly activating BAX/BAK or by neutralizing anti-apoptotic proteins [15] [117].
The founding member, BCL-2, was first discovered as the gene involved in the t(14;18) chromosomal translocation found in most follicular lymphomas. This translocation juxtaposes the BCL-2 gene with the immunoglobulin heavy chain enhancer, leading to its constitutive overexpression and a resultant block in apoptosis, a hallmark of cancer [9] [118].
Molecular Mechanism of BCL-2-Mediated Resistance
BCL-2 overexpression confers resistance by disrupting the delicate balance between pro- and anti-apoptotic signals. Anti-apoptotic proteins like BCL-2 possess a hydrophobic groove on their surface that acts as a receptor for the BH3 domains of pro-apoptotic proteins [9]. In cancer cells with BCL-2 overexpression, this groove is available in excess, allowing them to effectively sequester and inhibit activator BH3-only proteins (like BIM and tBID) and activated BAX/BAK [80] [117]. This inhibition prevents the oligomerization of BAX and BAK, thereby blocking MOMP and the release of cytochrome c, making the cells highly resistant to intrinsic apoptotic stimuli [15] [87].
Table 1: Major Anti-apoptotic BCL-2 Family Proteins and Their Roles in Resistance
| Protein | Key Cancers Involved | Mechanism of Resistance | Notes on Therapeutic Targeting |
|---|---|---|---|
| BCL-2 | CLL, Follicular Lymphoma, AML [9] | Sequesters activators (BIM, tBID) and effectors (BAX/BAK) [117] | Target of venetoclax; on-target toxicity manageable [9] |
| BCL-XL | Solid Tumors [9] | Potent inhibitor of BAX/BAK; high affinity for BIM [9] | Inhibition causes on-target thrombocytopenia; requires novel delivery (e.g., PROTACs, ADCs) [9] |
| MCL-1 | Multiple Myeloma, Solid Tumors [9] | Rapid turnover; neutralizes BIM, BAK, NOXA [9] [119] | Inhibition linked to cardiac toxicity; development challenging [9] |
IAP Proteins: The Second Line of Defense and Its Subversion
The Role of IAPs in Apoptosis Regulation
The Inhibitor of Apoptosis (IAP) family of proteins, most notably XIAP, functions as a critical post-MOMP brake on the apoptotic cascade. XIAP directly binds to and inhibits the activity of caspase-9, -3, and -7, preventing the execution of cell death [117]. Under normal physiological conditions, this inhibition is relieved by the mitochondrial protein SMAC (also known as DIABLO), which is released alongside cytochrome c during MOMP. SMAC binds to XIAP, displacing it from the caspases and thus permitting apoptosis to proceed [117].
IAP-Mediated Resistance in Cancer
Many cancers exploit this regulatory system by overexpressing IAP proteins, particularly XIAP and survivin [117]. This creates a formidable secondary barrier to apoptosis, even in scenarios where MOMP has been partially achieved. The overexpressed IAPs can effectively neutralize the limited amount of SMAC released and inhibit any activated caspases, rendering the cell resistant to death. This mechanism works synergistically with BCL-2 overexpression; if BCL-2 blocks MOMP, IAPs are redundant, but if some cytochrome c is released, IAPs provide a robust fail-safe.
Integrated Therapeutic Strategies to Overcome Resistance
BH3 Mimetics: Re-arming the Apoptotic Trigger
BH3 mimetics are a class of small-molecule drugs designed to mimic the function of sensitizer BH3-only proteins. They bind with high affinity to the hydrophobic grooves of specific anti-apoptotic BCL-2 family proteins, displacing the sequestered pro-apoptotic proteins (e.g., BIM, BAX) and tipping the balance toward apoptosis [9] [117].
Venetoclax (ABT-199), a first-in-class, highly selective BCL-2 inhibitor, has shown remarkable efficacy in hematologic malignancies like CLL and AML [9]. Its success validates the strategy of targeting anti-apoptotic proteins. However, resistance can emerge through upregulation of other anti-apoptotic family members, such as MCL-1 or BCL-XL [9] [87]. This has spurred the development of next-generation BH3 mimetics and combination therapies.
Table 2: Clinically Advanced BH3 Mimetics
| Therapeutic Agent | Primary Target(s) | Clinical Stage / Status | Key Challenges & Resistance Mechanisms |
|---|---|---|---|
| Venetoclax (ABT-199) | BCL-2 [9] | FDA-approved for CLL/AML [9] | Upregulation of MCL-1 or BCL-XL [87] |
| Navitoclax (ABT-263) | BCL-2, BCL-XL, BCL-w [9] | Clinical trials [80] | Dose-limiting thrombocytopenia from BCL-XL inhibition [9] |
| Sonrotoclax / Lisaftoclax | BCL-2 [9] | Under clinical evaluation [9] | Aims to improve on venetoclax profile |
| MCL-1 Inhibitors | MCL-1 [9] | Clinical development | On-target cardiac toxicity [9] |
SMAC Mimetics: Countering the IAP Defense
SMAC mimetics are small molecules that replicate the N-terminal tetrapeptide of SMAC, enabling them to bind to IAP proteins, particularly XIAP, and promote its auto-ubiquitination and degradation [117]. By antagonizing IAPs, these compounds relieve the inhibition on caspases, thereby sensitizing cancer cells to apoptosis. They are particularly effective in cancers with high IAP expression or certain genetic backgrounds that predispose cells to TNF-α-mediated death upon IAP loss.
Novel Targeting Approaches and Combination Therapies
To address the challenges of on-target toxicity and resistance, novel strategies are under investigation:
- PROTACs (Proteolysis Targeting Chimeras): These heterobifunctional molecules are designed to recruit an E3 ubiquitin ligase to a target protein (e.g., BCL-XL or MCL-1), leading to its ubiquitination and proteasomal degradation. This offers a potential strategy to achieve transient, tumor-specific inhibition of challenging targets like BCL-XL, potentially mitigating thrombocytopenia [9] [87].
- Antibody-Drug Conjugates (ADCs): ADCs can be engineered to deliver potent BCL-XL inhibitors selectively to tumor cells that express a specific surface antigen, sparing platelets and other healthy tissues [9].
- Rational Combinations: The most promising strategies involve rational combination therapies. Co-targeting BCL-2 with venetoclax and MCL-1 with a specific inhibitor can overcome compensatory resistance. Furthermore, combining BH3 mimetics with SMAC mimetics can synergistically target both the primary (MOMP) and secondary (caspase inhibition) barriers to apoptosis.
Essential Experimental Methodologies
Cytochrome c Release Assay
This is a cornerstone assay for measuring MOMP and the functional output of BCL-2 family interactions [120].
Detailed Protocol:
- Mitochondrial Isolation: Fresh mitochondria are isolated from cell lines or primary tissues via differential centrifugation. The cell pellet is homogenized in a cold isotonic buffer (e.g., containing mannitol, sucrose, EDTA, HEPES) and centrifuged at low speed (e.g., 1,000 × g) to remove nuclei and unbroken cells. The supernatant is then centrifuged at high speed (e.g., 10,000 × g) to pellet the heavy membrane fraction containing mitochondria [16].
- Incubation with Proteins/Peptides: The purified mitochondria are treated with recombinant BCL-2 family proteins (e.g., activated BAX, tBID) or synthetic BH3-domain peptides (e.g., from BIM, BAD) in an isotonic reaction buffer. To test for dependence on a specific anti-apoptotic protein, mitochondria are incubated with a BH3 mimetic drug or a sensitizer BH3 peptide (like BAD) that selectively inhibits BCL-2/BCL-XL [80].
- Measurement of Cytochrome c Release: After incubation, the mitochondrial and supernatant fractions are separated by centrifugation. The presence of cytochrome c in the supernatant (released fraction) and the mitochondrial pellet is quantified via Western blotting or ELISA [120].
BH3 Profiling
BH3 profiling is a functional assay that determines the "primed" state of a cell and its dependence on specific anti-apoptotic proteins [80].
Detailed Protocol:
- Sample Preparation: Mitochondria are isolated from the cell line or patient-derived sample of interest.
- Peptide Incubation: The mitochondria are exposed to a panel of synthetic peptides derived from the BH3 domains of different BH3-only proteins (e.g., BIM, BAD, NOXA, HRK). Each peptide has a distinct binding profile for the anti-apoptotic proteins.
- MOMP Measurement: The loss of mitochondrial membrane potential (ΔΨm) is measured in real-time using a fluorescent dye like JC-1 or TMRM. Alternatively, cytochrome c release can be quantified immunologically after fixation.
- Data Interpretation: The pattern of which peptides induce MOMP reveals the anti-apoptotic proteins maintaining survival. For example, if the BAD peptide (binds BCL-2, BCL-XL, BCL-w) causes MOMP, it indicates dependence on one of these proteins. If the NOXA peptide (binds MCL-1, BFL-1) causes MOMP, it indicates MCL-1 dependence [80].
The Scientist's Toolkit: Key Research Reagents
Table 3: Essential Reagents for Apoptosis and Resistance Research
| Reagent / Tool | Function in Research | Example Application |
|---|---|---|
| Recombinant BAX/BAK Protein | To directly activate the MOMP machinery in vitro [16] | In vitro reconstitution of MOMP in liposomes or isolated mitochondria [16] |
| Synthetic BH3 Peptides | To selectively inhibit anti-apoptotic proteins or directly activate BAX/BAK [80] | BH3 profiling; determining apoptotic dependencies [80] |
| BH3 Mimetics (e.g., Venetoclax) | Small-molecule inhibitors of specific anti-apoptotic proteins [9] | In vitro and in vivo models to test for sensitivity and resistance mechanisms [9] |
| SMAC Mimetics | Small-molecule antagonists of IAP proteins [117] | Studying caspase activation and overcoming IAP-mediated resistance [117] |
| Cytochrome c Detection Antibodies | To quantify release from mitochondria via ELISA or Western Blot [120] | Cytochrome c release assays; confirming MOMP [120] |
| Caspase Activity Assays | Fluorometric or colorimetric kits to measure caspase activation [117] | Determining the point of apoptotic blockade (pre- or post-MOMP) [117] |
Signaling Pathway and Experimental Workflow Visualizations
BCL-2 and IAP Regulation Pathway
Cytochrome c Release Assay Workflow
The interplay between BCL-2-mediated blockade of MOMP and IAP-mediated caspase inhibition represents a formidable challenge in oncology. The strategic development of BH3 mimetics and SMAC mimetics has provided powerful tools to dissect and dismantle these resistance mechanisms. The future of overcoming apoptotic resistance lies in the sophisticated use of functional assays like BH3 profiling to guide patient selection, coupled with the deployment of next-generation agents like PROTACs and rational combination therapies that simultaneously target multiple nodes within the apoptotic signaling network. Continued research into the dynamic regulation of the BCL-2 family and IAP proteins is essential to further refine these strategies and expand the therapeutic benefit to patients with resistant cancers.
The release of cytochrome c from the mitochondrial intermembrane space into the cytosol is a definitive biochemical hallmark of the intrinsic apoptosis pathway [5]. This event triggers the assembly of the apoptosome and the subsequent activation of caspase cascades that orchestrate cellular dismantling [121] [5]. Accurate quantification of cytochrome c release is therefore paramount for research in cell biology, cancer biology, and drug development. However, the scientific community faces significant challenges in standardizing these measurements across diverse experimental systems. Discrepancies in cell type-specific death signaling, variations in sample preparation, and the application of distinct quantification technologies collectively hinder the direct comparison of data and the establishment of universal benchmarks. This whitepaper examines the core technical challenges in standardizing cytochrome c release measurements, provides a detailed comparison of prevailing quantitative methods, and outlines standardized protocols to enhance reproducibility and data fidelity in apoptosis research.
Core Challenges in Standardizing Cytochrome c Release Measurements
The quantitative analysis of cytochrome c release is confounded by several intrinsic and methodological variables that researchers must navigate.
- Cell Type-Specific Variations in Apoptotic Signaling: A fundamental challenge lies in the divergence of cell death pathways. Cells are broadly classified as Type I or Type II based on their reliance on mitochondrial amplification of death receptor signals. Type II cells require mitochondrial outer membrane permeabilization (MOMP) and cytochrome c release for apoptosis to proceed, whereas Type I cells can bypass this requirement [122]. This biological difference means that an identical apoptotic stimulus can yield vastly different magnitudes of cytochrome c release in different cell lines, making cross-system comparisons problematic.
- Temporal Dynamics and "All-or-Nothing" Commitment: Cytochrome c release is not always a synchronous, all-or-nothing event within a cell population. Single-cell studies reveal considerable heterogeneity in the timing of MOMP following a pro-apoptotic stimulus [121]. Furthermore, recent evidence suggests that sub-lethal cytochrome c release can occur, facilitating non-apoptotic functions such as cellular differentiation [5]. Standard bulk measurement techniques often average these dynamics, potentially obscuring critical early or partial release events that could have significant biological consequences.
- Technical and Methodological Disparities: The choice of sample preparation and detection technology directly influences quantitative outcomes. For instance, the use of isolated mitochondria versus permeabilized cells versus intact cell systems can yield different results due to the loss of, or alteration in, cytosolic regulatory components [123] [124]. Similarly, the selectivity of permeabilizing agents like digitonin is concentration-dependent; sub-optimal concentrations can lead to incomplete cytosolic protein washout or unintended organelle damage, compromising the assay's accuracy [53].
Comparative Analysis of Quantitative Methodologies
Researchers employ a variety of techniques to measure cytochrome c release, each with distinct advantages, limitations, and optimal applications. The table below provides a structured comparison of the primary methods.
Table 1: Comparison of Quantitative Methods for Cytochrome c Release
| Method | Principle | Quantitative Output | Key Advantages | Key Limitations |
|---|---|---|---|---|
| Spectrophotometric Assay [123] [124] | Measures absorbance change at the Soret peak (∼414 nm) due to cytochrome c redox state or release. | Concentration of cytochrome c in solution. | - Rapid and simple- Does not require antibodies- Suitable for kinetic studies | - Lower sensitivity- Requires large sample sizes (isolated mitochondria)- Susceptible to spectral interference |
| Flow Cytometry (Immunodetection) [53] | Selective plasma membrane permeabilization, immunostaining of retained mitochondrial cytochrome c. | Percentage of cells with released cytochrome c. | - Single-cell resolution- High-throughput- Distinguishes heterogeneity in cell populations | - Semi-quantitative for amount released- Relies on antibody specificity- Complex sample processing |
| Western Blotting | Fractionates cytosolic and mitochondrial fractions, detects cytochrome c via immunoblotting. | Relative band intensity of cytochrome c in cytosolic fraction. | - Confirms protein identity by size- Widely accessible technology | - Semi-quantitative- Time-consuming- Poor resolution of cellular heterogeneity |
| ApoqPCR [125] | Quantifies apoptotic DNA fragmentation, a downstream, irreversible consequence of cytochrome c-induced caspase activation. | Picograms of apoptotic DNA per cell population. | - Extreme sensitivity (works with <100 cells)- Absolute quantification- Wide dynamic range- Uses stable DNA | - Indirect measure of cytochrome c release- Measures a late, post-commitment event |
The following diagram illustrates the logical decision-making process for selecting an appropriate quantification method based on key experimental requirements.
Detailed Experimental Protocols
To improve reproducibility, detailed protocols for two key quantitative methods are outlined below.
Spectrophotometric Assay for Isolated Mitochondria
This protocol allows for the rapid, quantitative determination of cytochrome c release from isolated mitochondria or permeabilized cells, capitalizing on the distinct spectral properties of cytochrome c [123] [124].
- Sample Preparation: Isolate mitochondria from target tissues or cells via differential centrifugation. Alternatively, use digitonin-permeabilized cells, optimizing the digitonin concentration to permeabilize the plasma membrane without disrupting mitochondrial integrity.
- Induction of Release: Incubate the mitochondrial or permeabilized cell sample with a pro-apoptotic stimulus (e.g., recombinant tBid, Bax protein, or calcium). Include a negative control (no stimulus) and a positive control (e.g., Triton X-100 to cause complete release).
- Spectrophotometric Measurement:
- Differential Spectroscopy: Record the absorbance spectrum (400-450 nm) of the sample supernatant after centrifugation to pellet mitochondria. The characteristic Soret (γ) peak for cytochrome c is at approximately 414 nm [124].
- Kinetic Measurement: Monitor the change in absorbance at 414 nm (A414) in real-time upon addition of the apoptotic stimulus. The decrease in A414 in the supernatant fraction correlates with cytochrome c release.
- Quantification: Quantify cytochrome c concentration using the extinction coefficient ε ≈ 106,000 M⁻¹cm⁻¹ at 414 nm for the reduced form. Validate the assay by correlating the results with functional readouts such as cytochrome c-dependent respiration measured by oxygraphy [123].
Flow Cytometric Immunodetection for Intact Cells
This method enables the high-throughput, quantitative analysis of cytochrome c release at the single-cell level, preserving information about population heterogeneity [53].
- Cell Treatment and Fixation: Induce apoptosis in cultured cells (e.g., HL-60 cells or thymocytes) using a relevant stimulus (e.g., staurosporine, dexamethasone). At designated time points, harvest cells and wash with PBS.
- Selective Permeabilization and Staining:
- Permeabilization: Gently resuspend the cell pellet in a solution containing a low, optimized concentration of digitonin (e.g., 0.005%) for a brief period. This selectively permeabilizes the plasma membrane, allowing cytosolic cytochrome c to diffuse out of the cell while the mitochondrial pools remain intact and contained.
- Fixation and Blocking: After washing out the cytosolic fraction, fix the cells with paraformaldehyde to immobilize the remaining mitochondrial cytochrome c. Permeabilize the membranes further with a detergent like saponin and block with serum to prevent non-specific antibody binding.
- Immunolabeling: Incubate cells with a primary antibody specific for cytochrome c, followed by a fluorescently conjugated secondary antibody.
- Flow Cytometric Analysis: Analyze the cells using a flow cytometer. Cells that have undergone cytochrome c release will exhibit low fluorescence intensity, while cells with intact mitochondria will form a highly fluorescent population. The data is presented as the percentage of cells in the low-fluorescence (cytochrome c-released) population over time.
The workflow for this method is detailed in the following diagram.
The Scientist's Toolkit: Essential Research Reagents
Successful and reproducible quantification of cytochrome c release relies on a suite of critical reagents. The table below lists key solutions and their specific functions in experimental workflows.
Table 2: Key Research Reagent Solutions for Cytochrome c Release Studies
| Reagent / Material | Function / Application | Key Considerations |
|---|---|---|
| Digitonin | Selective permeabilization of the plasma membrane for cytosolic protein washout prior to immunostaining or in permeabilized cell models [53]. | Concentration is critical; must be optimized for each cell type to avoid mitochondrial damage. |
| Pro-apoptotic Proteins (tBid, Bax) | Direct inducers of MOMP in experiments using isolated mitochondria or permeabilized cells to study the core release mechanism [121] [5]. | Recombinant, active proteins are required. Quality control via functional assays is recommended. |
| Cytochrome c Antibody | Primary reagent for immunodetection methods (flow cytometry, western blotting) [53]. | Specificity for native cytochrome c must be validated. Clone 7H8.2C12 is commonly used. |
| Caspase Inhibitors (e.g., z-VAD-fmk) | Pan-caspase inhibitor used to dissect direct MOMP/cytochrome c release from downstream caspase-driven feedback amplification [121]. | Helps isolate the primary release event from secondary effects. |
| BH3 Peptides (e.g., Bim) | Used in functional assays like BH3 profiling to measure mitochondrial priming and sensitivity to apoptosis [122]. | Indicates the dependency of a cell line on the intrinsic pathway. |
| Fluorescent Protein Reporters (e.g., IMS-RP) | Live-cell reporters for MOMP, composed of RFP fused to a mitochondrial import signal; diffusion upon MOMP signals release [121]. | Allows for kinetic, single-cell analysis without the need for fixation. |
Pathway Integration and Regulatory Logic
The release of cytochrome c is a pivotal event within the broader context of the intrinsic apoptotic pathway, which is subject to complex regulation. The following diagram synthesizes the key steps and regulatory nodes leading to and following cytochrome c release.
A critical regulatory concept is the distinction between Type I and Type II cells. In Type II cells, death receptor signaling leads to initial caspase-8 activation, which cleaves Bid to tBid. tBid then activates Bax/Bak to induce MOMP and cytochrome c release, which is essential for full apoptosis commitment. In these cells, high levels of XIAP prevent effective caspase activation without mitochondrial amplification. In Type I cells, death receptor signaling generates such robust caspase-8 activation that it can directly activate effector caspases without requiring mitochondrial cytochrome c release [122]. This fundamental difference in cell death circuitry directly impacts the observed magnitude and requirement for cytochrome c release in different experimental systems.
Standardizing the quantitative measurement of cytochrome c release across experimental systems remains a formidable but essential challenge in cell death research. The variability inherent in biological models, compounded by the technical specificities of different detection platforms, necessitates a rigorous and deliberate approach to experimental design. Researchers must explicitly account for the apoptotic signaling type (I vs. II) of their model systems, select quantification methods aligned with their specific biological questions (e.g., kinetic release vs. population heterogeneity), and adhere to detailed, standardized protocols for sample preparation and analysis. The integration of multiple orthogonal methods, such as correlating early cytochrome c release events with downstream apoptotic DNA fragmentation, can provide a more robust and comprehensive assessment of cell death commitment. As the field advances, the development of novel, highly sensitive live-cell reporters and the establishment of community-wide reference standards and data reporting guidelines will be critical steps toward achieving true quantification standardization, thereby accelerating the translation of basic apoptosis research into effective therapeutic strategies.
Comparative Pathway Analysis and Validation of Cytochrome c Release Mechanisms
Apoptosis, or programmed cell death, is a fundamental process essential for normal cellular physiology and development across metazoans [126]. The evolutionary origins of the apoptotic machinery, particularly the mitochondrial (intrinsic) pathway, provide critical insight into universal regulatory mechanisms of cell death. A core thesis is that the fundamental mechanisms governing intrinsic apoptosis, specifically mitochondrial cytochrome c release, are evolutionarily conserved from simple eukaryotes to humans, tracing back to the initial domestication of mitochondria [127]. This conservation underscores the functional importance of this pathway and establishes a framework for using diverse model organisms in biomedical research, particularly in drug development targeting cell death.
This whitepaper synthesizes current evidence on the deep evolutionary conservation of core apoptotic factors. It provides a technical guide detailing key experimental methodologies and reagents, serving as a resource for researchers and scientists investigating mitochondrial-regulated cell death.
The Deep Evolutionary Conservation of Apoptotic Machinery
The "endosymbiotic hypothesis" proposes that apoptosis originated from antagonistic interactions between the proto-eukaryotic host and its protomitochondrial endosymbiont [127]. According to this model, bacterial toxins used in this ancient struggle eventually evolved into the core components of the modern apoptotic pathway.
Functional Conservation from Bacteria to Metazoa
Strong evidence for this hypothesis comes from complementation studies in yeast (Saccharomyces cerevisiae). Researchers replaced yeast apoptotic genes with orthologs from distantly related eukaryotes (plants, protists) and even eubacteria. The study found that orthologs of remotely related eukaryotic and even eubacterial proteins can initiate apoptosis in yeast when triggered by chemical stresses [127]. Table 1 summarizes key findings from this cross-species functional replacement.
Table 1: Functional Complementation of Yeast Apoptotic Factors by Orthologs from Diverse Species
| Yeast Gene | Ortholog Source | Ortholog Gene/Protein Name | Sequence Identity (%) | Apoptotic Function Conserved? |
|---|---|---|---|---|
| MCA1 (Metacaspase) | Arabidopsis thaliana (Plant) | MCA1 | 37.0% | Yes [127] |
| Bacillus cereus (Bacteria) | bcere0018_55570 | 30.4% | Yes [127] | |
| NMA111 (Protease) | Arabidopsis thaliana (Plant) | DEGP7 | 31.7% | Yes [127] |
| Rickettsia australis (Bacteria) | MC5_06825 | 23.0% | Yes [127] | |
| NDI1 (Flavoprotein) | Dictyostelium discoideum (Slime mold) | DDB0168392 | 34.8% | Yes [127] |
| Actinomyces urogenitalis (Bacteria) | HMPREF0058_0119 | 25.8% | Yes [127] | |
| NUC1 (DNase) | Homo sapiens (Human) | NUCG_HUMAN | 42.9% | Yes [127] |
| Leishmania major (Protist) | LMJF100610 | 23.3% | Yes [127] |
This demonstrates that the pro-apoptotic function of these factors has been maintained for approximately 1,800 million years, since mitochondrial domestication, and supports the hypothesis that some apoptotic factors are modified eubacterial toxins [127].
Conservation in Basal Metazoans
Research in cnidarians, such as the coral Acropora millepora, reveals that the complex apoptotic networks involving multiple Bcl-2 family members and caspases were already present in the common ancestor of cnidarians and bilaterians [128]. Functional studies show that coral Bcl-2 proteins can regulate cell death in mammalian cells, implying functional conservation of the effector machinery despite limited sequence conservation [128]. This confirms that the basic mechanisms of both intrinsic and extrinsic apoptotic pathways were established early in animal evolution.
The Central Role of Mitochondrial Cytochrome c Release
The release of cytochrome c from the mitochondrial intermembrane space is a pivotal event in the intrinsic apoptotic pathway. Once in the cytosol, cytochrome c binds to Apaf-1, forming the "apoptosome" and triggering caspase-9 and downstream effector caspase activation, leading to orderly cellular dismantling [129] [130].
A Two-Step Release Mechanism
The process is not a simple passive release following outer membrane permeabilization. Research using isolated rat liver mitochondria demonstrates that cytochrome c release is a distinct two-step process [129]:
- Detachment: Cytochrome c must first be detached from its binding to cardiolipin, an anionic phospholipid on the inner mitochondrial membrane. This interaction involves both loose (electrostatic) and tight (hydrophobic) conformations.
- Permeabilization: Following solubilization, permeabilization of the outer mitochondrial membrane by pro-apoptotic proteins like Bax allows cytochrome c to escape into the extramitochondrial environment [129].
Neither step alone is sufficient to trigger release. This mechanism is relevant in various contexts, including myocardial ischaemia, where prolonged ischaemia leads to cytochrome c release and caspase-3 activation, contributing to apoptosis [130].
The following diagram illustrates the key steps and evolutionary conservation of this central pathway.
Diagram 1: The evolutionarily conserved intrinsic apoptosis pathway. The release of cytochrome c from mitochondria is a central and highly conserved step triggered by cellular stress and regulated by Bcl-2 family proteins.
Key Experimental Methodologies and Protocols
Studying apoptosis and its conservation requires robust, quantitative methods. Below are detailed protocols for key techniques used in the cited research.
Assaying Cytochrome c Release from Isolated Mitochondria
This protocol is adapted from studies investigating the two-step release mechanism [129].
Principle: The release of cytochrome c from the intermembrane space of isolated mitochondria can be induced by various stimuli and quantified by western blotting of mitochondrial pellets and supernatants.
Procedure:
- Mitochondrial Isolation: Homogenize rat liver tissue in MSH buffer (210 mM mannitol, 70 mM sucrose, 5 mM HEPES, pH 7.5) supplemented with 1 mM EDTA. Centrifuge the homogenate at 600 × g for 8 min at 4°C to remove nuclei and cell debris. Collect the supernatant and centrifuge at 5,500 × g for 15 min to pellet mitochondria. Resuspend the final mitochondrial pellet in MSH buffer without EDTA.
- Induction of Release: Incubate isolated mitochondria (1 mg/mL protein concentration) in appropriate buffers (e.g., MSH, KCl, or mixed buffer) with continuous stirring to prevent anoxia. Induce cytochrome c release by adding:
- Ca²⁺ (150 nmol/mg protein) + Pi (5 mM): To induce the Mitochondrial Permeability Transition (MPT) and subsequent swelling.
- Recombinant Bax protein (e.g., 50-100 nM): To study the Bcl-2 family-regulated pathway of outer membrane permeabilization.
- Include control incubations without inducers.
- Fraction Separation: At the end of the incubation period, centrifuge mitochondrial suspensions at 10,000 × g for 5 min at 4°C. Carefully separate the supernatant (released fraction) from the pellet (mitochondrial fraction).
- Detection and Quantification:
- Mix supernatant and pellet samples with Laemmli's loading buffer and boil for 5 min.
- Subject samples to SDS/15% PAGE, followed by electroblotting to a nitrocellulose membrane.
- Probe the membrane with an anti-cytochrome c primary antibody (e.g., 1:2,500 dilution), followed by a horseradish-peroxidase-conjugated secondary antibody.
- Detect bound antibodies using enhanced chemiluminescence and quantify band densities using appropriate software (e.g., QUANTISCAN).
Quantitative Assay for Cytochrome c Release in Apoptotic Cells
This method addresses limitations of cellular fractionation and immunocytochemistry by providing a quantitative flow cytometry-based approach [54].
Principle: Selective permeabilization of the plasma membrane allows antibodies to access cytochrome c in the cytosol while intact mitochondria remain impermeable. Cells with released cytochrome c can be quantified by flow cytometry.
Procedure:
- Induce Apoptosis in adherent or non-adherent cells using a chosen stimulus (e.g., UV irradiation, chemical agents like staurosporine).
- Harvest and Permeabilize: Harvest cells gently (use trypsin-free methods for adherent cells). Wash cells and permeabilize them with a mild detergent (e.g., digitonin, 0.025% in PBS) for 5 min on ice. This selectively perforates the plasma membrane.
- Stain and Fix: Incubate cells with a fluorescently-labeled anti-cytochrome c antibody (e.g., FITC-conjugated) for 20-30 min on ice. This antibody will bind only to cytochrome c that has been released into the cytosol.
- Fix and Analyze: Fix the cells with a cross-linking agent like formaldehyde (e.g., 4% for 20 min) to trap the signal. Analyze the cells by flow cytometry. A shift in fluorescence intensity identifies the population of cells that have undergone cytochrome c release.
Yeast Ortholog Complementation Assay
This functional assay directly tests the evolutionary conservation of apoptotic factors [127].
Principle: If apoptotic function is conserved, an ortholog from a distant species should be able to replace the function of the native yeast protein and restore the apoptotic response to stress.
Procedure:
- Strain Construction: Select a yeast gene encoding an apoptotic factor (e.g., MCA1, NMA111, NUC1). Replace the native gene in the diploid BY4743 strain with an ortholog from a target organism (e.g., plant, human, bacteria) via homologous recombination.
- Sporulation and Selection: Sporulate the resulting heterozygous diploid and dissect tetrads. Select haploid offspring strains carrying the ortholog allele.
- Viability Check: Confirm that the presence of the ortholog does not cause lethality under normal conditions.
- Apoptosis Induction and Assessment: Treat the ortholog-bearing strains with pro-apoptotic chemical stresses (e.g., hydrogen peroxide, acetic acid).
- Assess Apoptosis: Use annexin V staining (for phosphatidylserine externalization) followed by flow cytometry to quantify the percentage of apoptotic cells.
- Compare: Compare the apoptotic response of the ortholog-bearing strain to both the wild-type strain and a knockout strain (lacking the apoptotic gene).
The Scientist's Toolkit: Key Research Reagents and Models
Table 2: Essential Reagents and Models for Studying Apoptotic Conservation
| Category / Name | Function / Description | Application Example |
|---|---|---|
| Chemical Inhibitors/Inducers | ||
| Antimycin A | Inhibits mitochondrial electron transport chain Complex III. | Used to study ROS-mediated apoptosis; shown to have anti-apoptotic effects in certain contexts [131]. |
| Rotenone | Inhibits mitochondrial electron transport chain Complex I. | Used to study mitochondrial ROS generation and its role in apoptotic signaling [131]. |
| Staurosporine | Broad-spectrum protein kinase inhibitor. | Common positive control for inducing intrinsic apoptosis in various cell types [126]. |
| zVAD-FMK | Pan-caspase inhibitor. | Used to confirm caspase-dependent apoptosis (e.g., inhibited heat-induced bleaching in corals) [128]. |
| Recombinant Proteins | ||
| Recombinant Bax | Pro-apoptotic Bcl-2 family protein. | Used with isolated mitochondria to induce outer membrane permeabilization and cytochrome c release [129]. |
| Bcl-2 / Bcl-xL | Anti-apoptotic Bcl-2 family proteins. | Heterologous expression in yeast or other models to study conservation of function and suppress Bax-induced lethality [127]. |
| Biological Models | ||
| Saccharomyces cerevisiae (Yeast) | Unicellular eukaryote with core apoptotic machinery. | Ideal for complementation studies to test functional conservation of apoptotic factors across kingdoms [127]. |
| Acropora millepora (Coral) | Basal metazoan (cnidarian). | Model for studying the ancestral apoptotic repertoire and its role in stress responses like bleaching [128]. |
| H9c2 Cells | Rat cardiac myoblast cell line. | Used to study apoptosis in a heart disease context, including cytochrome c release and caspase activation [131] [130]. |
| Assay Kits & Reagents | ||
| Annexin V Assays | Detects phosphatidylserine exposure on the outer leaflet of the plasma membrane. | Standard flow cytometry method to quantify early-stage apoptotic cells [127] [126]. |
| TUNEL Assay | Detects DNA fragmentation, a late-stage apoptotic hallmark. | Used to confirm apoptotic death in tissues and cell cultures (e.g., in ischaemic myocardium) [130]. |
| Fluorogenic Caspase Substrates (e.g., DEVD-amc) | Synthetic peptides cleaved by specific caspases, releasing a fluorescent group. | Quantitative measurement of caspase-3-like activity in cytosolic extracts or cell lysates [130]. |
The experimental workflow for investigating conserved apoptosis mechanisms often integrates several of these tools and models, as visualized below.
Diagram 2: A generalized experimental workflow for investigating the evolutionary conservation of apoptosis. Studies often begin with an appropriate biological model, apply specific apoptotic stimuli, and employ a suite of assessment techniques to quantify the response.
The integration of intrinsic and extrinsic apoptotic pathways through Bid cleavage represents a critical amplification mechanism that determines cellular commitment to death. This convergence occurs when caspase-8, activated through extrinsic death receptor signaling, proteolytically cleaves the BH3-only protein Bid to generate truncated Bid (tBid), which subsequently translocates to mitochondria to potentiate cytochrome c release and amplify the apoptotic cascade. This review examines the molecular mechanisms of Bid-mediated cross-talk between apoptotic pathways, quantitative aspects of this amplification loop, experimental methodologies for its investigation, and therapeutic implications for cancer drug development. Within the broader context of intrinsic apoptosis pathway mitochondrial cytochrome c release research, understanding Bid integration provides crucial insights for overcoming apoptosis resistance in malignant cells.
Apoptosis, a genetically programmed cell death process, proceeds through two principal signaling routes: the extrinsic pathway initiated by extracellular death ligands binding to cell surface receptors, and the intrinsic pathway activated by intracellular stress signals culminating in mitochondrial outer membrane permeabilization (MOMP) [22] [110]. While these pathways can function independently, their integration through specific molecular bridges significantly enhances apoptotic efficiency, particularly in type II cells where direct caspase activation is insufficient for robust apoptosis induction.
Bid (BH3-interacting domain death agonist) serves as the critical molecular interface between these pathways, with its cleavage representing the definitive point of convergence [110]. Caspase-8-mediated Bid cleavage generates truncated Bid (tBid), which translocates to mitochondria and engages the intrinsic apoptosis machinery through Bcl-2 family interactions, resulting in amplified cytochrome c release and enhanced caspase activation [35] [110]. This review comprehensively examines the molecular architecture, regulatory mechanisms, and experimental analysis of Bid-mediated pathway integration, with emphasis on its implications for targeted cancer therapeutics.
Molecular Mechanisms of Pathway Integration
Extrinsic Pathway Initiation and Caspase-8 Activation
The extrinsic apoptosis pathway initiates when extracellular death ligands such as FasL, TRAIL, or TNF-α bind to their cognate death receptors (Fas, DR4/DR5, or TNFR1, respectively) on the cell surface [35] [110]. This ligand-receptor interaction induces receptor trimerization and recruitment of adapter proteins including FADD (Fas-associated death domain) through shared death domain homotypic interactions. The resulting multiprotein complex, known as the death-inducing signaling complex (DISC), facilitates the auto-proteolytic activation of initiator caspase-8 [110].
Active caspase-8 propagates the death signal through two distinct routes: direct cleavage and activation of executioner caspases (caspase-3/7) in type I cells, or alternatively, through cleavage of the BH3-only protein Bid in type II cells where the direct pathway is insufficient for robust apoptosis induction [110]. The cellular decision between these routes depends on multiple factors including DISC formation efficiency, cellular FLICE-inhibitory protein (c-FLIP) expression levels, and mitochondrial resistance thresholds.
Bid Cleavage and tBid Generation
Bid, a member of the Bcl-2 protein family characterized by containing only the BH3 domain, serves as the critical substrate for caspase-8 at the pathway integration point [110]. Caspase-8-mediated proteolysis occurs at specific aspartic acid residues (position 60 in murine Bid, position 59 in human Bid), generating a C-terminal fragment known as truncated Bid (tBid).
This cleavage event activates Bid's latent pro-apoptotic function through multiple mechanisms:
- Exposure of the BH3 domain: Cleavage induces a conformational change that exposes the BH3 domain, enabling tBid to interact with other Bcl-2 family members.
- Myristoylation site exposure: The nascent N-terminus of tBid contains a myristoylation consensus sequence that, when lipid-modified, enhances mitochondrial targeting.
- Membrane association competence: tBid acquires enhanced affinity for mitochondrial membranes, particularly at contact sites between outer and inner membranes.
The generation of tBid represents a critical amplification step, as a single activated caspase-8 molecule can cleave multiple Bid molecules, thereby dramatically expanding the death signal.
Mitochondrial Engagement and Cytochrome c Release
tBid translocates to the mitochondrial outer membrane where it engages the core apoptosis machinery through two non-mutually exclusive mechanisms:
Direct Activation Model: tBid directly binds and conformationally activates the pro-apoptotic effectors Bax and/or Bak, inducing their oligomerization and formation of proteolipidic pores in the mitochondrial outer membrane [110]. These pores facilitate the release of cytochrome c and other intermembrane space proteins into the cytosol.
Displacement Model: tBid binds to anti-apoptotic Bcl-2 family members (Bcl-2, Bcl-xL, Mcl-1), displacing pre-bound pro-apoptotic proteins such as BIM or BAD. The freed pro-apoptotic activators then directly engage Bax/Bak to induce MOMP [35].
Following MOMP, cytochrome c release enables apoptosome formation with Apaf-1 and caspase-9, initiating the caspase cascade that executes cellular dismantling. Simultaneously, mitochondrial release of SMAC/DIABLO and Omi/HTRA2 neutralizes inhibitor of apoptosis proteins (IAPs), further promoting caspase activation [35] [110].
Quantitative Analysis of Amplification Loops
Table 1: Quantitative Parameters of Bid-Mediated Apoptotic Amplification
| Parameter | Experimental Value | Cellular Context | Measurement Method |
|---|---|---|---|
| Caspase-8 to Bid cleavage rate | ~20 Bid molecules/min/caspase-8 | In vitro recombinant proteins | Fluorescent substrate kinetics |
| tBid mitochondrial translocation half-time | 5-15 minutes | HeLa cells treated with TRAIL | Live-cell imaging with GFP-Bid |
| Bax/Bak activation threshold by tBid | 0.1-0.5 μM tBid | Isolated liver mitochondria | Cytochrome c release assays |
| Cytochrome c release kinetics post-tBid | 30-60 minutes to >70% release | MEFs treated with anti-Fas | Confocal microscopy with fluorescent cyt c |
| Amplification factor (caspase-8 to caspase-3) | 10-100x in type II cells | Jurkat T-cell variants | DEVD-ase activity measurements |
Table 2: Apoptosis Induction by Therapeutic Agents Targeting Pathway Integration
| Therapeutic Agent | Molecular Target | Bid Cleavage Observed | Apoptotic Efficiency | Clinical Status |
|---|---|---|---|---|
| TRAIL/DR5 agonists | Death receptors DR4/DR5 | Yes, in sensitive cells | 40-60% cell death as monotherapy | Phase I/II trials |
| Venetoclax | Bcl-2 | Not directly, but enhances tBid effect | 70-90% in CLL, lower in solid tumors | FDA-approved |
| ONC201 | TRAIL/DR5 pathway inducer | Yes, in combination settings | Synergistic with TRAIL analogues | Clinical trials |
| TLY012 | PEGylated TRAIL | Variable depending on cellular IAP levels | Enhanced with IAP inhibitors | Preclinical/Orphan drug designation |
| SMAC mimetics | IAP proteins | Enhances downstream of tBid | Moderate monotherapy, strong combination | Phase I/II trials |
Experimental Protocols for Analysis
Detection of Bid Cleavage and tBid Generation
Western Blot Analysis of Bid Processing:
- Cell lysis: Harvest cells after apoptotic stimulus and lyse in RIPA buffer (50 mM Tris-HCl pH 7.4, 150 mM NaCl, 1% NP-40, 0.5% sodium deoxycholate, 0.1% SDS) supplemented with protease inhibitors (1 mM PMSF, 10 μg/mL leupeptin, 10 μg/mL aprotinin).
- Electrophoresis: Resolve 30-50 μg total protein on 4-20% gradient SDS-PAGE gels for optimal separation of full-length Bid (22 kDa) and tBid (15 kDa).
- Immunoblotting: Transfer to PVDF membrane and probe with anti-Bid antibodies (e.g., mouse monoclonal AF860 from R&D Systems). Use chemiluminescent detection with appropriate HRP-conjugated secondary antibodies.
- Controls: Include positive control (recombinant active caspase-8 + cell lysate) and caspase inhibitor control (z-VAD-fmk pretreated cells).
Immunofluorescence Assessment of tBid Translocation:
- Cell preparation: Plate cells on glass coverslips and treat with apoptotic inducers. Fix with 4% paraformaldehyde for 15 minutes at room temperature.
- Permeabilization and blocking: Permeabilize with 0.2% Triton X-100 for 10 minutes, then block with 5% normal goat serum for 1 hour.
- Staining: Incubate with primary anti-Bid antibody (1:100) and mitochondrial marker (e.g., anti-COX IV, 1:500) overnight at 4°C. Follow with species-appropriate fluorescent secondary antibodies (e.g., Alexa Fluor 488 and 594).
- Imaging: Acquire images using confocal microscopy. tBid mitochondrial translocation manifests as increased co-localization with mitochondrial markers.
Cytochrome c Release Assays
Subcellular Fractionation and Western Blot:
- Harvesting and homogenization: Collect 2×10^6 cells by gentle scraping and wash with ice-cold PBS. Resuspend in isotonic mitochondrial buffer (210 mM mannitol, 70 mM sucrose, 1 mM EDTA, 10 mM HEPES, pH 7.5) with protease inhibitors.
- Fraction separation: Homogenize with Dounce homogenizer (30-40 strokes). Centrifuge at 900×g for 5 minutes to remove nuclei and unbroken cells. Collect supernatant and centrifuge at 10,000×g for 30 minutes at 4°C to obtain heavy membrane (mitochondrial) fraction pellet and cytosolic supernatant [33].
- Analysis: Resuspend mitochondrial pellet in lysis buffer. Analyze both fractions by Western blotting using anti-cytochrome c antibody (e.g., clone 6H2.B4 from BD Biosciences). Increased cytochrome c in cytosolic fraction indicates MOMP.
Live-Cell Imaging of Cytochrome c Release:
- Transfection: Transfect cells with cytochrome c-GFP fusion construct using appropriate transfection reagent.
- Image acquisition: Use time-lapse confocal microscopy with environmental control (37°C, 5% CO2) to monitor GFP distribution. Initiate apoptotic stimulus after establishing baseline.
- Quantification: Cytochrome c release manifests as transition from punctate mitochondrial pattern to diffuse cytosolic fluorescence. Quantify using image analysis software by measuring coefficient of variation of fluorescence intensity.
Functional Caspase Activity Assays
Fluorogenic Substrate Cleavage Assays:
- Lysate preparation: Harvest cells and lyse in caspase assay buffer (100 mM HEPES, pH 7.4, 10% sucrose, 0.1% CHAPS, 10 mM DTT).
- Reaction setup: Incubate 50 μg cell lysate with 50 μM caspase-specific fluorogenic substrates (IETD-afc for caspase-8, LEHD-afc for caspase-9, DEVD-afc for caspase-3/7) in 96-well plates.
- Measurement: Monitor fluorescence emission (excitation 400 nm, emission 505 nm) every 5 minutes for 1-2 hours using plate reader. Calculate enzyme activity from linear phase of reaction.
Research Reagent Solutions
Table 3: Essential Research Reagents for Bid-Cytochrome c Pathway Analysis
| Reagent Category | Specific Examples | Experimental Function | Key Suppliers |
|---|---|---|---|
| Death receptor agonists | Recombinant TRAIL, Anti-Fas agonist antibodies | Extrinsic pathway activation | R&D Systems, PeproTech |
| Caspase inhibitors | z-VAD-fmk (pan-caspase), z-IETD-fmk (caspase-8 specific) | Pathway mechanism determination | BioVision, MedChemExpress |
| Bid antibodies | Anti-Bid (clone-specific for full-length vs tBid) | Cleavage and translocation assessment | Cell Signaling Technology, Santa Cruz |
| Mitochondrial dyes | MitoTracker Red CMXRos, TMRM | Membrane potential and localization | Thermo Fisher Scientific |
| Apoptosis inducers | Staurosporine, Actinomycin D, Etoposide | Intrinsic pathway activation | Sigma-Aldrich, Tocris |
| BCL-2 family modulators | ABT-737 (Bcl-2/Bcl-xL inhibitor), Venetoclax (Bcl-2 specific) | Mitochondrial priming assessment | Selleckchem, AbbVie |
| Cytochrome c detection | Anti-cytochrome c antibodies, Cytochrome c GFP constructs | MOMP quantification | BD Biosciences, Addgene |
Visualization of Signaling Pathways
Pathway Integration Through Bid Cleavage: This diagram illustrates the molecular events connecting extrinsic death receptor signaling to intrinsic mitochondrial apoptosis through caspase-8-mediated Bid cleavage. The dashed lines indicate amplification loops and cell-type-specific pathways.
Experimental Analysis Methodology: This workflow outlines the sequential molecular events in Bid-mediated pathway integration and corresponding experimental approaches for their detection, including specific inhibitors used to establish mechanistic relationships.
The strategic importance of Bid-mediated pathway integration extends beyond basic biological understanding to therapeutic applications, particularly in oncology. Many cancer cells develop resistance to apoptosis through various mechanisms, including DISC complex inhibition, Bcl-2 family protein imbalance, or IAP protein overexpression [35]. Targeting the Bid interface offers opportunities to overcome this resistance.
Combination therapies that simultaneously engage both apoptotic pathways demonstrate enhanced efficacy through Bid-mediated amplification. For instance, DR5 agonist antibodies combined with Bcl-2 inhibitors like venetoclax produce synergistic killing in preclinical models of pancreatic and colorectal cancers [35]. Similarly, TRAIL receptor engagement combined with SMAC mimetics to counter IAP-mediated caspase inhibition leverages the Bid amplification loop while removing inhibitory brakes.
The development of direct Bid mimetics or compounds that enhance Bid cleavage and mitochondrial targeting represents an emerging therapeutic strategy. Additionally, assessing Bid activation status may serve as a predictive biomarker for response to death receptor-targeted therapies, enabling patient stratification.
In conclusion, Bid cleavage represents the critical molecular bridge between extrinsic and intrinsic apoptosis pathways, serving as a potent amplification mechanism that determines cellular commitment to death. Within the broader context of intrinsic apoptosis pathway mitochondrial cytochrome c release research, understanding Bid's role provides fundamental insights into apoptotic regulation and reveals therapeutic opportunities for overcoming apoptosis resistance in cancer. Future research directions include developing more precise tools for monitoring Bid activation in vivo, designing Bid-based combination therapies, and exploring tissue-specific regulation of this critical pathway integration point.
Mitochondrial outer membrane permeabilization (MOMP) is a decisive event in the intrinsic apoptosis pathway, functioning as a point of no return for cell demise [90] [9]. This process enables the release of several proteins normally confined to the mitochondrial intermembrane space (IMS) into the cytosol, where they activate various cell death mechanisms [38]. Among these proteins, cytochrome c is the most extensively studied for its central role in caspase activation. However, other IMS factors, including SMAC/DIABLO (Second Mitochondria-derived Activator of Caspases/Direct IAP-Binding Protein with Low pI), AIF (Apoptosis-Inducing Factor), and EndoG (Endonuclease G), perform critical and distinct functions in coordinating apoptotic signaling [132] [133]. This technical review provides a detailed comparison of the release mechanisms and molecular functions of these key IMS factors, offering standardized experimental methodologies for their study and highlighting their relevance in therapeutic development.
Key Intermembrane Space (IMS) Proteins in Apoptosis
The following table summarizes the core characteristics, release triggers, and primary functions of the four major IMS proteins discussed in this review.
Table 1: Key Intermembrane Space (IMS) Proteins in Apoptosis
| Protein | Primary Function | Release Trigger | Downstream Effect | Regulation |
|---|---|---|---|---|
| Cytochrome c [6] [5] [1] | Electron shuttle in ETC; Apoptosome activation | MOMP (BAX/BAK pores) [9] | Binds APAF-1 to form apoptosome, activating caspase-9 [6] | Regulated by BCL-2 family; post-translational modifications [6] [1] |
| SMAC/DIABLO [132] [134] | Neutralizes IAPs | MOMP; caspase-dependent release [134] | Binds IAPs (e.g., XIAP), relieving caspase inhibition [132] | Requires dimerization for full activity [132] |
| AIF [133] | Oxidoreductase; Caspase-independent death | Processed and released after MOMP [133] | Chromatin condensation, large-scale DNA fragmentation (parthanatos) [133] | Cleavage, redox state (NAD(P)H binding) [133] |
| EndoG [38] | DNase | Released during apoptosis [38] | DNA fragmentation in caspase-independent cell death [38] | - |
Comparative Release Mechanisms
The release of IMS proteins during apoptosis is primarily governed by mitochondrial outer membrane permeabilization (MOMP), a process tightly regulated by the BCL-2 protein family [90] [9]. While MOMP is a common gateway, the specific release of these factors involves distinct mechanisms and kinetics.
The Central Role of MOMP
MOMP is the crucial event that permits the egress of IMS proteins. It is controlled by the balance between pro-apoptotic (e.g., BAX, BAK) and anti-apoptotic (e.g., BCL-2, BCL-XL) proteins [9]. During cellular stress, activated BH3-only proteins (e.g., Bid, Bim) either directly or indirectly activate BAX and BAK, which oligomerize to form pores in the outer mitochondrial membrane [90] [9]. Anti-apoptotic BCL-2 proteins preserve mitochondrial integrity by sequestering these pro-apoptotic activators and effectors [9]. The formation of these pores allows the diffusion of IMS proteins from the mitochondria to the cytosol.
Cytochrome c Release
Cytochrome c release is a direct consequence of MOMP. Its liberation is a hallmark of intrinsic apoptosis initiation. Once in the cytosol, cytochrome c binds to APAF-1, triggering ATP/dATP-dependent apoptosome formation, which then recruits and activates procaspase-9 [6] [5] [1]. This cascade ultimately leads to the execution of apoptosis via effector caspases. The release of cytochrome c is considered a point-of-no-return in most apoptotic scenarios.
SMAC/DIABLO Release
SMAC/DIABLO is also released through MOMP, but evidence suggests its efflux can be regulated differently from cytochrome c. While BCL-2 overexpression inhibits the release of both proteins, studies indicate that SMAC/DIABLO release can be blocked by broad-spectrum caspase inhibitors, whereas cytochrome c release in response to the same stimuli remains largely caspase-independent [134]. This positions SMAC/DIABLO release as a caspase-catalyzed event that may occur downstream of cytochrome c release and initial caspase activation [134]. Furthermore, SMAC/DIABLO functions as a dimer to neutralize Inhibitor of Apoptosis Proteins (IAPs) like XIAP, thereby removing the brake on active caspases and promoting cell death [132].
AIF and EndoG Release
The release mechanisms for AIF and EndoG are less clearly defined but are known to be associated with MOMP. AIF, in particular, requires proteolytic processing to become a soluble form that can translocate to the cytosol and nucleus [133]. In the nucleus, AIF induces chromatin condensation and large-scale DNA fragmentation in a caspase-independent process known as parthanatos [133]. Similarly, EndoG is released during apoptosis and contributes to DNA fragmentation in caspase-independent cell death pathways [38].
Table 2: Comparative Analysis of Protein Release Mechanisms
| Feature | Cytochrome c | SMAC/DIABLO | AIF | EndoG |
|---|---|---|---|---|
| Primary Release Gate | MOMP (BAX/BAK) [9] | MOMP (BAX/BAK) [134] | MOMP [133] | MOMP [38] |
| Caspase Dependence | Independent [134] | Dependent (in some contexts) [134] | - | - |
| BCL-2 Sensitivity | Inhibited [134] | Inhibited [134] | - | - |
| Key Functional Form | Monomer [1] | Dimer [132] | Processed monomer [133] | - |
| Downstream Process | Caspase-dependent apoptosis [6] | IAP inhibition & caspase potentiation [132] | Caspase-independent death (Parthanatos) [133] | Caspase-independent DNA fragmentation [38] |
The following diagram illustrates the interconnected release pathways and functional roles of these IMS proteins during intrinsic apoptosis.
Core Experimental Protocols for Studying IMS Protein Release
To ensure reproducibility in apoptosis research, this section outlines standardized protocols for investigating the release of IMS proteins.
Subcellular Fractionation and Immunoblotting
This foundational protocol separates mitochondrial and cytosolic fractions to track protein translocation.
- Principle: Using differential centrifugation and selective plasma membrane permeabilization to isolate cytosolic fractions free of mitochondrial contamination, followed by immunoblotting to detect IMS proteins.
- Procedure:
- Cell Harvesting & Permeabilization: Harvest apoptotic and control cells. Wash with PBS and gently permeabilize with a low concentration of digitonin (e.g., 0.05% in isotonic sucrose buffer) to selectively release cytosolic contents without disrupting mitochondrial membranes [134].
- Cytosolic Fraction Collection: Centrifuge cells at high speed (e.g., 16,000 × g for 10-15 min). The supernatant (S) contains the cytosolic fraction.
- Mitochondrial Fraction Collection: The pellet (P) contains mitochondria and other organelles. It can be lysed with RIPA buffer for analysis.
- Immunoblotting: Resolve proteins from both fractions by SDS-PAGE. Transfer to a membrane and probe with antibodies against:
RNA Interference (RNAi) for Functional Studies
RNAi is used to determine the specific function of an IMS protein in apoptosis.
- Principle: Introducing double-stranded small interfering RNA (siRNA) into cells to degrade complementary mRNA, thereby knocking down the expression of a target protein.
- Procedure (e.g., for CgSmac in oyster hemocytes) [132]:
- dsRNA Preparation: Design and synthesize dsRNA targeting the gene of interest (e.g., CgSmac) and a control (e.g., dsEGFP).
- Cell Transfection: Introduce dsRNA into primary cultured hemocytes using an appropriate transfection reagent.
- Induction of Apoptosis: After a suitable period for knockdown (e.g., 24-48 hrs), induce apoptosis with a stimulus like LPS.
- Functional Assay: Measure caspase-3 activity using a fluorogenic substrate (e.g., Ac-DEVD-AFC). Compare activity between target-knockdown and control groups to assess the protein's role [132].
Caspase Activity Assay
This protocol measures the enzymatic activity of caspases, which are key effectors downstream of cytochrome c release.
- Principle: Using caspase-specific peptides conjugated to a fluorescent or colorimetric reporter. Cleavage by the active caspase releases the reporter, generating a detectable signal.
- Procedure (for Caspase-3) [132]:
- Prepare Cell Lysate: Lyse control and apoptotic cells in a suitable buffer.
- Incubate with Substrate: Mix the lysate with the caspase-3 substrate Ac-DEVD-AFC.
- Measure Fluorescence: Monitor the increase in fluorescence (AFC emission) over time using a plate reader.
- Calculate Activity: Normalize fluorescence to protein concentration and express activity as fold-change over control.
The Scientist's Toolkit: Research Reagent Solutions
The following table compiles key reagents and their applications for studying IMS protein release and function.
Table 3: Essential Research Reagents for IMS Protein Studies
| Reagent / Tool | Primary Function | Example Application |
|---|---|---|
| Digitonin [134] | Selective plasma membrane permeabilization | Isolation of cytosolic fractions for immunoblotting without mitochondrial rupture. |
| Anti-Cytochrome c Antibody [5] | Immunodetection | Detecting cytochrome c release in subcellular fractions or by immunofluorescence. |
| Anti-SMAC/DIABLO Antibody [134] | Immunodetection | Monitoring SMAC/DIABLO translocation from mitochondria to cytosol via Western blot. |
| Anti-AIF Antibody [133] | Immunodetection | Assessing AIF processing and subcellular localization (mitochondrial vs. nuclear). |
| Caspase-3 Fluorogenic Substrate (Ac-DEVD-AFC) [132] | Enzymatic activity measurement | Quantifying downstream caspase activation following cytochrome c release. |
| BCL-2 Inhibitors (e.g., Venetoclax) [9] | Pharmacological induction of MOMP | Tool for triggering intrinsic apoptosis and subsequent IMS protein release in sensitive cells. |
| siRNA / dsRNA [132] | Gene knockdown | Studying the functional consequence of specific IMS protein loss-of-function (e.g., Smac). |
| JC-1 / TMRM Dyes [135] | Mitochondrial membrane potential (ΔΨm) sensing | Correlating MOMP and IMS protein release with the loss of ΔΨm. |
The workflow for a typical integrated experiment, from cell treatment to data analysis, is summarized below.
The release of IMS proteins is a coordinated, multi-faceted process central to executing intrinsic apoptosis. Cytochrome c is the primary initiator of caspase-dependent apoptosis, while SMAC/DIABLO amplifies this signal by antagonizing IAPs. In parallel, AIF and EndoG provide a caspase-independent cell death pathway, ensuring the elimination of damaged cells even when the canonical caspase pathway is compromised. Understanding the nuances of their release mechanisms—shared dependence on MOMP, but with potential differences in kinetics and regulatory checkpoints—is crucial for a complete picture of mitochondrial apoptosis. The experimental frameworks and tools detailed herein provide a foundation for ongoing research, which continues to uncover the complex regulation of these proteins and their profound implications in cancer and other human diseases.
Target validation is a critical foundation of modern biomedical research, particularly in the study of complex processes like the intrinsic apoptosis pathway. The release of cytochrome c from mitochondria represents a pivotal, often irreversible commitment to programmed cell death and serves as a key regulatory point investigated in cancer research, neurodegenerative diseases, and drug development [9]. The central goal of target validation is to establish a causal relationship between a specific biomolecule and a biological phenotype, moving beyond mere correlation to demonstrate that modulating the target directly affects the disease process [136] [137]. In the context of cytochrome c release, this involves confirming that candidate proteins genuinely regulate mitochondrial outer membrane permeabilization (MOMP) and subsequent apoptotic cascade activation [9]. The convergence of genetic, pharmacological, and biochemical validation approaches provides orthogonal evidence that significantly strengthens confidence in a target's therapeutic relevance before committing substantial resources to drug discovery campaigns.
The intrinsic apoptosis pathway is primarily regulated by the BCL-2 protein family, which includes both pro-apoptotic (e.g., BAX, BAK) and anti-apoptotic (e.g., BCL-2, BCL-XL, MCL-1) members [9]. During apoptosis induction, activated pro-apoptotic proteins facilitate MOMP, leading to cytochrome c release into the cytosol [138]. Once in the cytosol, cytochrome c nucleates the formation of the apoptosome complex, activating caspase-9 and initiating the caspase cascade that executes cell death [9] [139]. This intricate protein network presents multiple validation candidates, from the core apoptosis machinery to more recently discovered regulators such as LACTB, a serine protease tumor suppressor that promotes cytochrome c release through inner mitochondrial membrane remodeling [24]. The following sections detail the principal methodologies employed to validate such targets in cytochrome c release research, providing technical protocols and analytical frameworks for researchers in this field.
Core Validation Methodologies
Genetic Knockdown Approaches
Genetic knockdown techniques reduce target gene expression to investigate the consequent phenotypic effects, establishing functional relationships between genes and biological processes. These approaches are particularly valuable for validating targets involved in cytochrome c release, as they can demonstrate necessity—whether reducing target expression impedes the apoptotic process.
RNA Interference (RNAi) utilizes small interfering RNA (siRNA) or short hairpin RNA (shRNA) to achieve sequence-specific degradation of target mRNA. The RNAi mechanism involves introducing double-stranded RNA (dsRNA) into cells, which is recognized by the ribonuclease protein Dicer and cleaved into 21-25 base pair siRNA fragments [136]. These siRNAs are incorporated into the RNA-induced silencing complex (RISC), guiding it to complementary mRNA sequences for cleavage and degradation [136]. In practice, researchers designing RNAi experiments should select target sequences following established guidelines, ensure proper control designs including non-targeting scrambled sequences, and validate knockdown efficiency through Western blotting or quantitative PCR. A representative application of this methodology demonstrated that LACTB knockdown significantly reduced cytochrome c release and decreased apoptosis in HeLa cells treated with staurosporine or ABT-737/S63845 combination [24]. The limitation of off-target effects remains a consideration, necessitating validation with multiple distinct targeting sequences.
Antisense Oligonucleotides represent another knockdown strategy employing chemically modified oligonucleotides complementary to target mRNA sequences. These bind to their target mRNAs and prevent translation machinery binding, thereby blocking protein synthesis [136]. A notable example includes Abbott Laboratories researchers using antisense probes against the rat P2X3 receptor, which demonstrated potent anti-hyperalgesic activity when administered via intrathecal minipump [136]. While offering reversible effects compared to genetic knockouts, antisense oligonucleotides face challenges including limited bioavailability, pronounced toxicity with certain chemistries, and potential non-specific actions [136].
CRISPR-Based Knockdown using catalytically dead Cas9 (dCas9) fused to transcriptional repressors enables targeted gene suppression without altering DNA sequence. This approach benefits from the precise targeting of CRISPR systems while avoiding permanent genetic changes. Although not explicitly detailed in the search results for cytochrome c studies, this methodology has revolutionized functional genomics and represents a state-of-the-art approach for validation studies [137].
Table 1: Genetic Knockdown Techniques in Cytochrome c Research
| Technique | Mechanism of Action | Key Applications in Apoptosis Research | Advantages | Limitations |
|---|---|---|---|---|
| RNA Interference (siRNA/shRNA) | Dicer-mediated siRNA generation guides RISC to degrade target mRNA | LACTB validation; reduced cytochrome c release upon apoptosis induction [24] | Reversible, high specificity with proper design | Potential off-target effects, transient nature (siRNA) |
| Antisense Oligonucleotides | Chemically modified oligonucleotides block translation | P2X3 receptor validation in pain models [136] | Reversible effects, continued presence required | Limited bioavailability, toxicity concerns |
| CRISPR Interference (dCas9) | dCas9-repressor fusion binds promoter to block transcription | Modern target validation [137] | High precision, reversible, minimal off-target effects | Requires specialized vector design |
Pharmacological Inhibition Strategies
Pharmacological inhibition uses small molecules or bioactive compounds to directly modulate protein function, establishing a causal relationship between target activity and biological phenotype. These approaches are particularly valuable in drug discovery as they often more closely resemble therapeutic intervention than genetic methods.
Small Molecule Inhibitors represent the most direct pharmacological approach, employing chemically synthesized compounds that bind to and inhibit specific protein targets. The development of BH3-mimetics exemplifies this strategy in cytochrome c release research. These compounds target the hydrophobic groove of anti-apoptotic BCL-2 family proteins, displacing pro-apoptotic proteins to trigger MOMP [9]. Notable examples include ABT-737 (developed through NMR-based screening and structure-based design) and its clinical derivative venetoclax (ABT-199), which selectively inhibits BCL-2 with nanomolar affinity [9]. The key advantage of small molecule inhibitors is their temporal control and dose-titratability, allowing researchers to establish concentration-response relationships. However, challenges include ensuring target specificity and potential off-target effects at higher concentrations, necessitating careful control experiments with structurally distinct inhibitors against the same target.
Tool Compounds and Chemical Probes are highly characterized small molecules used to investigate specific biological targets rather than as therapeutic candidates. These reagents undergo rigorous validation to establish their selectivity, potency, and cellular activity [136]. The GOT-IT framework emphasizes the importance of using well-characterized chemical probes with defined mechanisms of action, potency, selectivity, and appropriate control compounds to ensure experimental rigor [137]. In cytochrome c research, tool compounds might include BH3-mimetics with varying selectivity profiles across BCL-2 family members to dissect the contributions of specific anti-apoptotic proteins.
Antibody-Based Inhibition utilizes monoclonal antibodies to neutralize specific extracellular domains or soluble ligands. Antibodies offer exceptional specificity, able to discriminate between even closely related protein family members by binding to unique epitopes rather than conserved active sites [136]. For example, the function-neutralizing anti-TrkA antibody MNAC13 has been shown to reduce neuropathic pain and inflammatory hypersensitivity by inhibiting NGF signaling [136]. While particularly useful for extracellular targets, this approach is generally unsuitable for intracellular proteins like those directly regulating cytochrome c release, unless using specialized delivery systems.
Table 2: Pharmacological Inhibition Approaches
| Approach | Molecular Target | Key Reagents | Experimental Readouts | Considerations |
|---|---|---|---|---|
| BH3-Mimetics | Anti-apoptotic BCL-2 proteins (BCL-2, BCL-XL, MCL-1) | ABT-737, venetoclax, S63845 [9] | Cytochrome c release, caspase activation, apoptosis markers | Selectivity profiling across BCL-2 family, concentration optimization |
| Ion Channel Modulators | Mitochondrial ion channels | Various channel-specific inhibitors | Membrane potential, cytochrome c localization, calcium flux | Target accessibility, specificity confirmation |
| Metabolic Inhibitors | Electron transport chain complexes | Rotenone, antimycin A, oligomycin | ROS production, ATP levels, cytochrome c release | Compensatory mechanisms, secondary effects |
Overexpression Studies
Overexpression experiments increase target protein levels to examine gain-of-function phenotypes, providing complementary evidence to knockdown studies. These approaches are particularly useful for establishing whether a target is sufficient to induce a biological process like cytochrome c release.
Transient Transfection involves introducing expression plasmids encoding the target gene into cells using chemical, lipid-based, or physical methods. This approach achieves high but temporary expression levels, ideal for rapid assessment of acute effects. For example, researchers investigating LACTB generated stable and transient overexpression models in HeLa cells, demonstrating that LACTB overexpression promoted cytochrome c release and accelerated apoptosis upon staurosporine treatment [24]. Transient transfection is particularly suitable for toxic proteins or rapid screening applications, though it suffers from variable efficiency between cells and experiments.
Stable Cell Line Generation creates populations of cells that permanently express the target gene through integration into the host genome, typically using lentiviral or retroviral delivery systems. This approach provides consistent, long-term expression ideal for repeated experiments and in vivo studies. The process involves transducing cells with viral vectors containing the gene of interest coupled to a selectable marker (e.g., antibiotic resistance), followed by selection to eliminate non-transduced cells. Researchers validated LACTB's pro-apoptotic role by establishing stable LACTB-overexpressing HeLa cells, which showed increased sensitivity to cell death inducers compared to control cells [24]. The key advantages include uniform expression across cell populations and suitability for long-term studies, though the potential for non-physiological expression levels requires careful interpretation.
Inducible Expression Systems provide temporal control over target gene expression using chemically inducible promoters (e.g., tetracycline-regulated systems). These enable researchers to initiate overexpression at specific timepoints, distinguishing primary from secondary effects and studying toxic targets that would preclude cell line establishment. After generating inducible cell lines, researchers typically perform time-course experiments to correlate target expression kinetics with phenotypic readouts like cytochrome c release. While not explicitly detailed in the cytochrome c studies reviewed, this approach represents a gold standard for overexpression validation when precise temporal control is required.
Experimental Protocols for Cytochrome c Release Assessment
Subcellular Fractionation and Western Blotting
The subcellular fractionation method enables quantitative assessment of cytochrome c localization by separating cytosolic and mitochondrial compartments followed by immunoblot detection. This approach provides objective, quantitative data on cytochrome c redistribution during apoptosis.
Protocol:
- Cell Harvesting: Collect approximately 1-5×10⁷ cells by gentle scraping or trypsinization, followed by centrifugation at 600×g for 5 minutes at 4°C.
- Permeabilization: Resuspend cell pellet in 5 volumes of Buffer A (250 mM sucrose, 20 mM HEPES-KOH [pH 7.4], 10 mM KCl, 1.5 mM Na-EGTA, 1.5 mM Na-EDTA, 1 mM MgCl₂, 1 mM DTT, plus protease inhibitors). Incubate on ice for 15-20 minutes with occasional gentle mixing.
- Homogenization: Pass cells through a 22-gauge needle 10-15 times or until >90% cells are permeabilized (verify by trypan blue exclusion).
- Fraction Separation: Centrifuge homogenate at 12,000×g for 15 minutes at 4°C. The supernatant (cytosolic fraction) contains released cytochrome c. Transfer to a fresh tube.
- Mitochondrial Isolation: Resuspend the pellet (crude heavy membrane fraction) in Buffer B (50 mM HEPES [pH 7.4], 1% NP-40, 10% glycerol, 1 mM EDTA, 2 mM DTT, plus protease inhibitors) to solubilize mitochondrial proteins.
- Western Blot Analysis: Separate 20-50 μg protein from each fraction by SDS-PAGE, transfer to PVDF membrane, and probe with anti-cytochrome c antibody (1:1000). Use compartment-specific markers like COX IV (mitochondria) and β-tubulin (cytosol) to validate fractionation purity [138].
Applications: This method was employed to demonstrate that LACTB knockdown reduced cytoplasmic levels of cytochrome c and other mitochondrial proteins (SMAC/Diablo, AIF, HTRA2/Omi) upon staurosporine or ABT-S treatment [24]. Conversely, LACTB overexpression enhanced release of these factors even in the presence of caspase inhibitor Q-VD-OPh, indicating its action upstream of caspase activation [24].
Immunofluorescence Microscopy
Immunofluorescence microscopy enables qualitative, single-cell assessment of cytochrome c localization while preserving spatial context, allowing researchers to correlate cytochrome c release with other apoptotic markers.
Protocol:
- Cell Seeding and Treatment: Plate cells on sterile glass coverslips and apply experimental treatments.
- Fixation: Aspirate media and add 3% paraformaldehyde in PBS (pre-warmed to 37°C). Incubate for 30 minutes at room temperature.
- Permeabilization and Blocking: Rinse with PBS, then permeabilize with 0.1% Triton X-100 in PBS for 5 minutes. Block with 5% normal serum in PBS for 1 hour.
- Antibody Staining: Incubate with anti-cytochrome c antibody (1:200-1:500) in blocking buffer overnight at 4°C. After PBS washes, apply fluorophore-conjugated secondary antibody (1:1000) for 1 hour at room temperature.
- Counterstaining and Mounting: Stain mitochondria with MitoTracker (100-200 nM, 30 minutes) or immunolabel with Tom20 antibody. Include DAPI for nuclear visualization. Mount coverslips using antifade mounting medium.
- Image Acquisition and Analysis: Capture images using confocal or super-resolution microscopy. Analyze cytochrome c distribution patterns: punctate mitochondrial staining versus diffuse cytoplasmic pattern indicates release [138].
Applications: Researchers used this approach to show that in control HeLa cells, cytochrome c staining was concentrated in mitochondria but translocated to cytosol after 30 minutes of ABT-S treatment, while LACTB knockdown significantly reduced this translocation [24]. Airyscan microscopy further revealed LACTB localization to the inner mitochondrial membrane, particularly enriched in cristae, suggesting its proximity to cytochrome c storage sites [24].
In Vitro Cytochrome c Release Assay
The in vitro reconstitution assay isolates mitochondria to directly test the capacity of specific stimuli to induce cytochrome c release, eliminating confounding cellular processes.
Protocol:
- Mitochondria Isolation: Homogenize cells in Mitochondria Isolation Buffer (MIB: 220 mM mannitol, 68 mM sucrose, 10 mM KCl, 1 mM EDTA, 1 mM EGTA, 10 mM HEPES-KOH [pH 7.4], 0.1% BSA, plus protease inhibitors) using a Dounce homogenizer. Centrifuge at 800×g for 10 minutes at 4°C to remove nuclei and unbroken cells. Collect supernatant and centrifuge at 12,000×g for 15 minutes to pellet mitochondria.
- Mitochondria Resuspension: Wash mitochondrial pellet twice with MIB, then resuspend in Mitochondria Resuspension Buffer (MRB: 200 mM mannitol, 50 mM sucrose, 10 mM succinate, 5 mM potassium phosphate [pH 7.4], 10 mM HEPES-KOH [pH 7.4], 0.1% BSA) to 1 mg/ml protein concentration.
- Release Induction: Incubate mitochondria (100-200 μg) with experimental treatments (recombinant proteins, calcium, peptides, etc.) in MRB for 30-60 minutes at 30°C with gentle shaking.
- Separation and Detection: Centrifuge at 12,000×g for 10 minutes to pellet mitochondria. Collect supernatant (released fraction) and analyze cytochrome c content by Western blotting [138].
Applications: This method is particularly valuable for characterizing direct effects of recombinant proteins (e.g., cleaved BID, BAX, BAK) or small molecules on mitochondrial permeability, independent of upstream signaling events. It can also be adapted to investigate novel regulators like LACTB by incorporating recombinant protein into the system.
Integrated Data Analysis and Interpretation
Effective interpretation of validation experiments requires integrating data from multiple approaches to build a compelling case for target involvement in cytochrome c release. The convergence of evidence from genetic knockdown, pharmacological inhibition, and overexpression studies provides the strongest validation foundation.
Establishing Mechanism of Action: Beyond simply demonstrating that a target affects cytochrome c release, well-designed validation studies should investigate where in the apoptotic pathway the target acts. For example, research on LACTB demonstrated that it does not affect BAX recruitment to mitochondria but is required for apoptosis-induced mitochondrial remodeling independent of OPA1 processing [24]. Furthermore, purified LACTB directly remodeled cardiolipin-enriched membrane nanotubes in biochemical assays, suggesting a precise mechanism through inner mitochondrial membrane restructuring [24]. Such multi-level mechanistic insight significantly strengthens validation conclusions.
Contextualizing with Pathway Knowledge: Interpreting validation data within the existing framework of intrinsic apoptosis regulation is essential. The BCL-2 family represents the core regulatory machinery, with pro-apoptotic members BAX and BAK executing MOMP, while anti-apoptotic members (BCL-2, BCL-XL, MCL-1) sequester activators and effectors [9]. New candidate regulators should be evaluated for potential interactions with this established network. For instance, TRIM59 was found to suppress mitochondrial-associated apoptosis in papillary renal cell carcinoma by promoting ubiquitination and degradation of ACAT1, thereby disrupting cardiolipin metabolism and inhibiting cytochrome c release [140]. This places TRIM59 upstream of mitochondrial membrane regulation rather than as a direct component of the core apoptosis machinery.
Quantitative Assessment: Whenever possible, validation experiments should include quantitative measures of cytochrome c release and apoptotic progression. The subcellular fractionation method enables quantification of cytosolic versus mitochondrial cytochrome c by densitometry, while flow cytometry-based approaches can quantify the percentage of cells with cytochrome c release in large populations. Additional apoptotic markers including caspase activation (e.g., cleaved caspase-3), PARP cleavage, and phosphatidylserine externalization (annexin V staining) provide complementary data to confirm the functional consequences of cytochrome c release [24] [141].
Signaling Pathways and Experimental Workflows
Intrinsic Apoptosis Pathway Regulating Cytochrome c Release
Diagram 1: Intrinsic Apoptosis Pathway and Cytochrome c Release Regulation. This diagram illustrates the core intrinsic apoptosis pathway, highlighting key regulatory steps and experimental targets. Cellular stresses activate BH3-only proteins that neutralize anti-apoptotic BCL-2 family members and activate pro-apoptotic effectors BAX and BAK. These effectors oligomerize to cause mitochondrial outer membrane permeabilization (MOMP), enabling cytochrome c release and subsequent caspase activation. Recently identified regulators like LACTB promote inner mitochondrial membrane (IMM) remodeling to facilitate cytochrome c release, while TRIM59 suppresses apoptosis by degrading ACAT1 and disrupting cardiolipin metabolism [24] [140] [9].
Experimental Workflow for Target Validation
Diagram 2: Comprehensive Workflow for Validating Cytochrome c Release Regulators. This workflow outlines a systematic approach for validating targets involved in mitochondrial cytochrome c release. The process begins with target identification through literature mining, OMICs analyses, or functional screens, followed by designing a validation strategy incorporating genetic, pharmacological, and overexpression approaches. Experimental implementation includes specific methodologies detailed in this review, with subsequent phenotypic assessment of cytochrome c release and apoptosis. Mechanistic studies investigate how targets influence the pathway, culminating in data integration to establish therapeutic potential [136] [137].
Research Reagent Solutions
Table 3: Essential Research Reagents for Cytochrome c Release Studies
| Reagent Category | Specific Examples | Key Applications | Technical Considerations |
|---|---|---|---|
| Cell Lines | HeLa, U2-OS, B16-F10, primary cells | Apoptosis induction, transfection efficiency, pathway competence | Select lines with intact apoptosis machinery; verify cytochrome c release competence |
| Apoptosis Inducers | Staurosporine, ABT-737/S63845 combination, TNF-α with cycloheximide | Trigger intrinsic apoptosis pathway with varying mechanisms | Optimize concentration and timing for specific cell type; include controls |
| BCL-2 Family Inhibitors | Venetoclax (BCL-2), A-1331852 (BCL-XL), S63845 (MCL-1) | Selective targeting of anti-apoptotic proteins | Confirm selectivity for intended target; potential compensatory mechanisms |
| Caspase Inhibitors | Q-VD-OPh, Z-VAD-FMK | Distinguish upstream cytochrome c release from downstream execution | Use pan-caspase inhibitors to block downstream effects |
| Antibodies | Cytochrome c, COX IV (mitochondrial marker), β-tubulin (cytosolic marker) | Subcellular localization, Western blotting, immunofluorescence | Validate specificity; optimize dilution for each application |
| Mitochondrial Dyes | MitoTracker, TMRM, JC-1 | Assess mitochondrial mass, membrane potential, morphology | Use fresh solutions; optimize concentration and loading time |
| siRNA/shRNA Libraries | Custom or commercial sequences targeting candidate genes | Genetic knockdown studies | Include multiple distinct sequences; verify knockdown efficiency |
| Expression Vectors | Lentiviral, retroviral, plasmid systems for overexpression | Gain-of-function studies | Select appropriate promoter; consider inducible systems for toxic targets |
| Fractionation Buffers | Sucrose/HEPES-based mitochondrial isolation buffers | Subcellular fractionation | Prepare fresh with protease inhibitors; maintain cold temperature |
The rigorous validation of targets regulating cytochrome c release requires a multifaceted approach integrating genetic, pharmacological, and overexpression methodologies. Each technique provides complementary evidence, with genetic knockdown establishing necessity, pharmacological inhibition demonstrating druggability, and overexpression confirming sufficiency. The convergence of findings from these orthogonal approaches builds the compelling evidence chain needed to confidently advance targets in drug discovery pipelines. As the field progresses, emerging technologies including CRISPR-based functional genomics, advanced proteomics, and high-content imaging will further refine these validation paradigms. However, the fundamental principles outlined in this review—strategic experimental design, appropriate controls, multiple orthogonal methods, and quantitative assessment—will remain essential for generating robust, reproducible validation data in intrinsic apoptosis research.
While the intrinsic apoptosis pathway is canonically defined by mitochondrial cytochrome c release and caspase activation, emerging research reveals significant cell death mechanisms that function independently of caspases. This whitepaper examines the alternative functions of mitochondrial factors released during caspase-independent cell death processes. We explore how proteins and nucleic acids liberated from mitochondria—including AIF, EndoG, mtDNA, and oxidized cardiolipin—orchestrate cell death through diverse molecular pathways when caspase activity is impaired or absent. Beyond detailing the mechanisms of these alternative pathways, this technical guide provides validated experimental protocols for studying caspase-independent death, visualizes key signaling networks, and catalogues essential research reagents. This knowledge is crucial for understanding pathological resistance in conditions ranging from neurodegeneration to cancer, where conventional apoptotic signaling is compromised.
The intrinsic apoptosis pathway, initiated by mitochondrial outer membrane permeabilization (MOMP) and cytochrome c release, represents a fundamental cell death mechanism in physiological homeostasis and disease pathogenesis [100] [26]. Cytochrome c triggers apoptosome formation and caspase activation, culminating in the classical hallmarks of apoptosis [26]. However, accumulating evidence demonstrates that mitochondrial permeabilization releases multiple factors that can execute cell death through caspase-independent mechanisms [60] [14].
Caspase-independent cell death pathways represent crucial backup mechanisms that ensure cellular elimination when caspase activity is compromised, whether through pharmacological inhibition, pathophysiological suppression, or genetic mutations [26] [14]. These alternative pathways are increasingly recognized for their roles in neurodegenerative diseases, cancer resistance, and ischemic injury, where they may either compensate for failed apoptosis or contribute to pathological outcomes [142] [14]. Mitochondria serve as central hubs in these processes, releasing multiple factors that can activate various death programs independently of caspase activity [14].
This technical guide examines the specific mitochondrial factors released during MOMP that mediate caspase-independent cell death, with particular focus on their molecular functions, interconnected signaling pathways, and methodological approaches for their investigation within the broader context of intrinsic apoptosis research.
Mitochondrial Factors in Caspase-Independent Cell Death
Following MOMP, mitochondria release numerous proteins and nucleic acids from the intermembrane space that can activate alternative cell death pathways when caspases are inhibited. The table below summarizes key mitochondrial factors, their mechanisms of action, and their roles in specific cell death pathways.
Table 1: Mitochondrial Factors in Caspase-Independent Cell Death
| Mitochondrial Factor | Release Trigger | Mechanism of Action | Resulting Cell Death Type |
|---|---|---|---|
| Apoptosis-Inducing Factor (AIF) | MOMP, calpain activation | Translocates to nucleus, induces chromatin condensation and large-scale DNA fragmentation | Caspase-independent apoptosis-like death [14] |
| Endonuclease G (EndoG) | MOMP | Nuclear translocation, DNA degradation without caspase requirement | Caspase-independent DNA fragmentation [14] |
| Mitochondrial DNA (mtDNA) | MOMP, BAX/BAK pores | Activates TLR9/STING pathways, initiates inflammasome assembly | Pyroptosis, necroptosis, sterile inflammation [142] [14] |
| Oxidized Cardiolipin | Mitochondrial stress, peroxidase activity | Externalization to outer membrane, acts as DAMP, recruits pro-death proteins | PANoptosis, inflammasome activation [100] [14] |
| Reactive Oxygen Species (mtROS) | Electron transport chain disruption | Oxidative damage to cellular components, activates stress kinases | Ferroptosis, oxeiptosis, necroptosis [142] [14] |
| SMAC/DIABLO | MOMP | Inhibits IAP proteins, relieves caspase inhibition, enables alternative death | Apoptosis potentiation, necroptosis enhancement [100] [26] |
These mitochondrial factors can activate multiple cell death pathways either independently or in concert, creating a robust cellular suicide system that ensures elimination even when primary apoptotic machinery is compromised. The specific death modality activated depends on cellular context, energy availability, and the combination of factors released.
Molecular Mechanisms and Pathway Interconnections
Caspase-independent cell death pathways exhibit extensive cross-talk, with mitochondria serving as the central organizing platform. The following diagram illustrates the key molecular relationships and signaling pathways:
Diagram 1: Signaling pathways in caspase-independent mitochondrial cell death. MOMP triggers release of multiple factors that activate distinct death programs through interconnected mechanisms.
Integrated Death Pathways: PANoptosis
Beyond discrete death pathways, mitochondria facilitate PANoptosis—an integrated cell death pathway that combines features of apoptosis, necroptosis, and pyroptosis [14]. This unified cell death network is particularly relevant in caspase-deficient conditions, where mitochondrial components serve as critical triggers:
- mtDNA release activates the NLRP3 inflammasome and cGAS-STING pathway, driving inflammatory cell death even without caspase activity [14]
- Oxidized cardiolipin externalization recruits and activates multiple pro-death proteins, including BAX and components of the inflammasome complex [100]
- Metabolic dysregulation through loss of mitochondrial membrane potential and OXPHOS collapse depletes ATP, shifting cell fate toward necrotic-like death [14]
The PANoptosis concept explains how mitochondrial factors can activate a redundant, robust cell death network that resists therapeutic inhibition of single pathway components, with significant implications for overcoming treatment resistance in cancer [14].
Experimental Approaches and Methodologies
Research into caspase-independent cell death requires specific methodological approaches that differentiate these pathways from canonical apoptosis. The following section details key experimental protocols and reagents for investigating alternative mitochondrial death mechanisms.
Research Reagent Solutions
Table 2: Essential Research Reagents for Studying Caspase-Independent Mitochondrial Death
| Reagent/Category | Specific Examples | Research Application | Mechanistic Insight |
|---|---|---|---|
| Caspase Inhibitors | Z-VAD-FMK (pan-caspase), Q-VD-OPh | Confirm caspase-independent death; use alongside death inducers | Distinguishes caspase-dependent vs. independent mechanisms [48] |
| BAX/BAK Activators | BIM SAHB, ABT-737 (BH3 mimetics) | Induce MOMP without direct caspase activation | Studies on MOMP-initiated caspase-independent death [100] [14] |
| ROS Modulators | Necroptosis inducers (TSZ), FCCP (mitochondrial uncoupler) | Activate alternative death via oxidative stress | Investigates mtROS-mediated death pathways [142] [14] |
| AIF Inhibitors | AIF-neutralizing antibodies, harperidone derivatives | Block mitochondrial factor function | Validates AIF-specific contributions to death [14] |
| mtDNA Targeting | TFAM knockdown/knockout, ethidium bromide | Deplete mtDNA, test DAMP function | Studies on immunogenic aspects of mtDNA release [142] [14] |
| Detection Reagents JC-1 (ΔΨm), MitoSOX (mtROS), DAPI (nuclear morphology) | Assess mitochondrial function and death phenotypes | Identifies characteristic caspase-independent morphology [48] |
Experimental Workflows
The following diagram outlines a standardized experimental workflow for investigating caspase-independent cell death:
Diagram 2: Experimental workflow for caspase-independent cell death research. Comprehensive approach combines functional assays, biochemical analyses, and genetic validation.
Detailed Methodological Protocols
MOMP Induction with Caspase Inhibition
Purpose: To induce mitochondrial factor release while blocking canonical apoptosis. Procedure:
- Plate cells at 50-60% confluence in appropriate growth medium 24 hours pre-treatment
- Pre-treat with 20-50 μM Z-VAD-FMK (pan-caspase inhibitor) for 1 hour
- Apply MOMP inducer (e.g., 10 μM BIM SAHB, 1 μM ABT-737, or 100 nM staurosporine) for 4-24 hours
- Include controls: caspase inhibitor only, MOMP inducer only, and vehicle
- Assess viability via CCK-8 assay at 450nm, with parallel samples for morphological analysis [48]
Validation: Confirm caspase inhibition by Western blot for absence of caspase-3 cleavage (17/19 kDa fragments) despite MOMP induction [14].
Subcellular Fractionation for Mitochondrial Factor Translocation
Purpose: To track movement of AIF, EndoG, and cytochrome c during caspase-independent death. Procedure:
- Harvest cells by gentle scraping (avoid trypsinization)
- Resuspend in isotonic mitochondrial buffer (225 mM mannitol, 75 mM sucrose, 10 mM HEPES, 1 mM EGTA, pH 7.4) with protease inhibitors
- Dounce homogenize (20-30 strokes), monitor cell breakage (>90% trypan blue positive)
- Centrifuge at 800 × g, 10 min to remove nuclei and unbroken cells
- Collect supernatant, centrifuge at 10,000 × g, 15 min to pellet mitochondria
- Collect cytosolic fraction (supernatant), wash mitochondrial pellet twice
- Analyze fractions by Western blot: AIF (67 kDa), EndoG (33 kDa), cytochrome c (15 kDa), with compartment-specific markers (HSP90 for cytosol, COX IV for mitochondria) [14]
Nuclear Fraction: Pellet from step 4 can be further purified for nuclear extraction to confirm AIF/EndoG nuclear translocation.
mtDNA Release Quantification
Purpose: To measure mtDNA leakage as a DAMP in caspase-independent death. Procedure:
- Collect cell culture supernatant, centrifuge at 2,000 × g to remove cells and debris
- Concentrate extracellular medium using 30 kDa centrifugal filters
- Extract DNA from concentrated medium and corresponding cell pellets using silica-membrane kits
- Perform qPCR with human mtDNA primers (ND1, ND6, CYTB) and nuclear DNA control (β-globin)
- Calculate extracellular mtDNA ratio relative to nuclear DNA and total cellular mtDNA [142] [14]
Application: This protocol is particularly relevant for investigating inflammatory aspects of caspase-independent death, as mtDNA activates TLR9 and cGAS-STING pathways.
Discussion and Research Implications
The investigation of caspase-independent cell death pathways reveals a sophisticated backup system that ensures cellular elimination when canonical apoptosis fails. The alternative functions of mitochondrial factors released during MOMP represent a critical layer of cell death regulation with broad implications for biomedical research and therapeutic development.
From a drug development perspective, understanding these alternative pathways provides opportunities to overcome treatment resistance in cancer, where caspase inhibition frequently develops [14]. Strategies that simultaneously target multiple mitochondrial death pathways—such as BH3 mimetics to induce MOMP combined with ferroptosis inducers—may provide more durable therapeutic responses than single-pathway approaches [14] [143].
In neurodegenerative diseases, where caspase-independent mechanisms contribute to neuronal loss, modulating the activity of specific mitochondrial factors like AIF may offer neuroprotective strategies [14] [144]. The inflammatory consequences of mtDNA release also highlight the importance of these pathways in chronic inflammatory conditions and aging-related pathologies [142].
Future research directions should focus on elucidating the precise molecular mechanisms governing the choice between different caspase-independent death modalities, developing more specific inhibitors and activators of these pathways, and exploring the therapeutic window for targeting these processes in various disease contexts.
Mitochondria serve as central hubs not only for caspase-dependent apoptosis but also for multiple caspase-independent cell death pathways. Through the regulated release of factors like AIF, EndoG, mtDNA, and oxidized cardiolipin, mitochondria can activate redundant death programs that ensure cellular elimination when primary apoptotic machinery fails. The intricate cross-talk between these pathways, exemplified by the PANoptosis concept, highlights the evolutionary importance of maintaining robust cell death mechanisms.
For researchers investigating the intrinsic apoptosis pathway, consideration of these caspase-independent mechanisms is essential for comprehensive understanding of cell fate decisions following mitochondrial permeabilization. The experimental methodologies and reagents detailed in this technical guide provide a foundation for exploring these alternative death pathways, with significant implications for understanding disease mechanisms and developing novel therapeutic strategies.
The intrinsic apoptosis pathway is a genetically regulated process of cell elimination, essential for development, tissue homeostasis, and disease pathogenesis. Central to this pathway is the release of cytochrome c (cyt c) from the mitochondrial intermembrane space into the cytosol, an event often considered a point of no return in the cell death cascade [7] [9]. While this core mechanism is conserved, emerging evidence reveals significant variations in its regulation and execution across different cell types. These tissue-specific differences influence cellular susceptibility to apoptosis, impact disease development, and determine responses to therapeutic agents. This whitepaper synthesizes current research to elucidate the distinct mechanisms governing cyt c release in neuronal, epithelial, and immune cells, providing a framework for researchers and drug development professionals working within the context of intrinsic apoptosis pathway research.
Core Mechanism of Cytochrome c Release
In the canonical intrinsic apoptosis pathway, diverse apoptotic stimuli, such as DNA damage or cellular stress, converge on mitochondria. This leads to mitochondrial outer membrane permeabilization (MOMP), which facilitates the release of cyt c and other pro-apoptotic factors from the intermembrane space into the cytoplasm [5] [9]. Once in the cytosol, cyt c binds to Apaf-1 (apoptotic protease-activating factor 1) in the presence of dATP/ATP, forming a complex known as the apoptosome. The apoptosome serves as a activation platform for caspase-9, which in turn activates the effector caspases-3 and -7, ultimately dismantling the cell through cleavage of key structural and repair proteins like PARP [6] [7].
The B-cell lymphoma 2 (BCL-2) protein family is the principal regulator of MOMP. The family comprises both pro-apoptotic (e.g., BAX, BAK, BID, BIM) and anti-apoptotic members (e.g., BCL-2, BCL-XL, MCL1). Cellular stress signals activate pro-apoptotic BH3-only proteins, which inhibit the anti-apoptotic proteins and directly activate the executioner proteins BAX and BAK. Activated BAX and BAK oligomerize to form pores in the mitochondrial outer membrane, allowing for the efflux of cyt c [9] [38]. The functional status of this protein network, influenced by expression levels, post-translational modifications, and subcellular localization, varies significantly between cell types, forming the basis for tissue-specific regulation of apoptosis.
Tissue-Specific Variations in Cytochrome c Release
Neuronal Cells
Neuronal cells exhibit a unique apoptotic regulation, heavily influenced by metabolic constraints and specialized regulatory molecules. Research indicates that the long non-coding RNA LOC339803 plays a critical role in maintaining mitochondrial integrity in neurons by regulating hexokinase 2 (HK2) levels. A depletion of LOC339803, as observed in the cortical neurons of multiple sclerosis patients, is associated with mitochondrial dysfunction, suggesting a compromised apoptotic threshold [145]. HK2, which tethers to the outer mitochondrial membrane, contributes to apoptosis suppression by coupling glycolysis to mitochondrial metabolism, and its destabilization can predispose neurons to cyt c release.
Furthermore, the classification of cells into Type I and Type II apoptosis pathways has implications for neuronal sensitivity. In Type II cells, which include many neuronal populations, efficient apoptosis requires mitochondrial amplification through BID cleavage. Caspase-8 activated at death-inducing signaling complexes (DISC) is insufficient to directly activate effector caspases and must cleave the BH3-only protein BID to tBID. tBID then activates BAX/BAK to trigger MOMP and cyt c release [103]. This reliance on mitochondrial amplification may render neurons particularly vulnerable to perturbations in the BCL-2 family balance.
Table 1: Key Characteristics of Cytochrome c Release in Neuronal Cells
| Feature | Characteristic in Neuronal Cells | Functional Implication |
|---|---|---|
| Key Regulator | lncRNA LOC339803 (maintains HK2 levels) [145] | Protects mitochondrial integrity; downregulation linked to MS pathogenesis. |
| Apoptosis Pathway | Primarily Type II (mitochondrial amplification required) [103] | Increased dependence on BID cleavage and BAX/BAK activation. |
| Metabolic Context | High oxidative phosphorylation; sensitivity to bioenergetic collapse | Cyt c release disrupts ATP production, exacerbating cell death. |
Epithelial Cells
In epithelial tissues, such as those in the breast, the dynamics of cell proliferation and apoptosis are crucial for tissue remodeling and homeostasis. In breast cancer, the status of cyt c is a core factor in tumor pathogenesis and treatment response. Studies show that in breast tumor samples, cyt c is often released from epithelial cells into the ductal lumen, and a redox imbalance—where reduced cyt c is unable to induce apoptosis—is frequently observed and upregulated during cancer progression [7]. This suggests that in addition to the regulation of its release, the post-release functionality of cyt c can be a cell-type-specific determinant of apoptotic efficacy.
The sensitivity of epithelial cells to cyt c-mediated apoptosis is a key factor in cancer therapy. Treatments like chemotherapy and radiotherapy exert their effects, at least partially, by inducing cyt c release and activating the intrinsic apoptosis pathway in epithelial cancer cells [7]. Consequently, mechanisms that reduce cyt c expression or prevent its release are associated with treatment resistance and lower patient survival rates. For instance, some intracellular proteins can competitively bind to cyt c, preventing its interaction with Apaf-1 and thereby inhibiting apoptosis execution in breast cancer cells [7].
Table 2: Key Characteristics of Cytochrome c Release in Epithelial Cells (e.g., Breast)
| Feature | Characteristic in Epithelial Cells | Functional Implication |
|---|---|---|
| Cyt c Status in Cancer | Redox imbalance; release into ductal lumen [7] | Loss of pro-apoptotic function contributes to tumor survival. |
| Therapeutic Role | Core target for chemo/radiotherapy-induced apoptosis [7] | Resistance linked to reduced cyt c expression/impaired release. |
| Inhibition Mechanisms | Competitive binding of cyt c by other proteins [7] | Prevents apoptosome formation, blocks apoptosis execution. |
Immune Cells
Immune cells, particularly T cells in the tumor microenvironment (TME), exhibit a unique and recently discovered vulnerability related to cyt c release and mitochondrial regulation. Cancer cells can evade immune attack by transferring mitochondria with mutated mitochondrial DNA (mtDNA) to tumor-infiltrating T lymphocytes (TILs) [146]. This transfer occurs via direct cell-cell contacts like tunneling nanotubes (TNTs) and indirectly through small extracellular vesicles (EVs). Crucially, these transferred mitochondria, carrying mtDNA mutations, do not undergo normal mitophagy due to co-transferred mitophagy-inhibitory molecules.
The acquisition of these dysfunctional mitochondria by T cells leads to metabolic abnormalities, senescence, and impaired effector function. This process effectively compromises antitumour immunity. The presence of such mtDNA mutations in TILs is a poor prognostic factor for patients with melanoma or non-small-cell lung cancer undergoing immune checkpoint inhibitor therapy [146]. This mechanism represents a non-cell-autonomous form of regulating the intrinsic apoptosis pathway, where the susceptibility of immune cells to cyt c release and metabolic failure is dictated by the tumor cells.
Table 3: Key Characteristics of Cytochrome c Release and Mitochondrial Dysfunction in Immune Cells
| Feature | Characteristic in Immune Cells (TILs) | Functional Implication |
|---|---|---|
| External Influence | Mitochondrial transfer from cancer cells [146] | Leads to acquisition of mutated mtDNA and metabolic defects. |
| Transfer Mechanism | Tunneling nanotubes (TNTs) and small Extracellular Vesicles (EVs) [146] | Facilitates intercellular mitochondrial exchange in TME. |
| Functional Outcome | Metabolic insufficiency, senescence, defective memory formation [146] | Impairs antitumour immunity and response to immunotherapy. |
Experimental Protocols for Studying Cytochrome c Release
Assessing Cytochrome c Release and Apoptosis
Immunofluorescence Microscopy: This is a direct method to visualize cyt c release. Cells are stained with antibodies against cyt c and a mitochondrial marker (e.g., TOM20). In healthy cells, the staining patterns colocalize. Upon induction of apoptosis, the diffuse cytosolic pattern of cyt c indicates release. Protocol: 1) Culture cells on glass coverslips. 2) Induce apoptosis. 3) Fix cells with 4% paraformaldehyde. 4) Permeabilize with 0.1% Triton X-100. 5) Block with BSA. 6) Incubate with anti-cytochrome c and anti-TOM20 antibodies. 7) Incubate with fluorescently-labeled secondary antibodies. 8) Mount and visualize by confocal microscopy [5] [38].
Subcellular Fractionation and Western Blotting: This biochemical method quantifies cyt c distribution. Protocol: 1) Harvest cells and wash with PBS. 2) Resuspend in isotonic buffer and disrupt cells with a homogenizer. 3) Centrifuge at low speed (e.g., 1,000 x g) to remove nuclei and unbroken cells. 4) Centrifuge the supernatant at high speed (e.g., 10,000 x g) to pellet the heavy membrane fraction (enriched in mitochondria). 5) The resulting supernatant is the cytosolic fraction. 6) Analyze both mitochondrial and cytosolic fractions by Western blotting using antibodies against cyt c. Purity of fractions should be confirmed with markers like COX IV (mitochondria) and β-tubulin (cytosol) [5] [27].
Flow Cytometry with APOPCYTO Assay: For quantitative analysis of cyt c release in a population of cells. Protocol: 1) Permeabilize cells with digitonin to selectively perforate the plasma membrane without damaging mitochondria. 2) Stain with an anti-cytochrome c antibody. 3) Because the cytosol is accessible, only cells that have released cyt c from mitochondria will show high intracellular staining. 4) Analyze by flow cytometry. The percentage of cyt c-positive cells corresponds to the fraction undergoing MOMP [27].
Investigating Tissue-Specific Mechanisms
Studying Mitochondrial Transfer in Immune Cells: To model the immune evasion mechanism observed in TILs [146]. Protocol: 1) Label cancer cell mitochondria with a fluorescent protein (e.g., MitoDsRed). 2) Coculture labeled cancer cells with T cells (e.g., TILs) for several days. 3) To distinguish transfer mechanisms, use specific inhibitors: Cytochalasin B (inhibits TNT formation), GW4869 (inhibits small EV release), and Y-27632 (inhibits larger microEVs). 4) Analyze T cells by flow cytometry or microscopy for the presence of the DsRed signal to quantify mitochondrial transfer. 5) Sort T cells that have acquired mitochondria and sequence their mtDNA to assess homoplasmy.
Functional Studies with lncRNA in Neuronal Cells: To elucidate the role of LOC339803 in neuronal mitochondrial integrity [145]. Protocol: 1) Use human neuronal cell lines (e.g., SH-SY5Y). 2) Modulate LOC339803 expression via siRNA-mediated knockdown or overexpression vectors. 3) Assess impact on mitochondrial integrity by measuring HK2 protein levels (Western blot), mitochondrial membrane potential (JC-1 or TMRM staining), and sensitivity to apoptotic stimuli (e.g., staurosporine). 4) Quantify cyt c release using the methods described above.
The Scientist's Toolkit: Key Research Reagents
Table 4: Essential Reagents for Studying Cytochrome c Release
| Reagent / Tool | Function / Application | Example Use Case |
|---|---|---|
| Anti-Cytochrome c Antibody | Detects cyt c localization via IF, WB, or flow cytometry. | Differentiating cytosolic vs. mitochondrial cyt c in apoptotic cells [5] [27]. |
| BCL-2 Family BH3 Mimetics | Small molecules that inhibit anti-apoptotic BCL-2 proteins. | Probing dependency on specific anti-apoptotic proteins (e.g., Venetoclax for BCL-2) [9]. |
| Mitochondrial Dyes (e.g., MitoTracker) | Live-cell staining of mitochondria. | Visualizing mitochondrial morphology and mass before and after apoptotic insult [146]. |
| Digitonin | Mild detergent for selective plasma membrane permeabilization. | Used in APOPCYTO flow cytometry assay to detect cyt c release [27]. |
| Caspase Inhibitors (e.g., Z-VAD-FMK) | Pan-caspase inhibitor. | Determining if cyt c release is upstream or independent of caspase activity [38]. |
| TNT & EV Inhibitors (Cytochalasin B, GW4869) | Inhibits tunneling nanotubes and extracellular vesicle release. | Investigating mechanisms of mitochondrial transfer in coculture systems [146]. |
Visualizing the Signaling Pathways and Experimental Workflows
The intrinsic apoptosis pathway, a genetically regulated form of programmed cell death, is critically controlled by mitochondrial events, with cytochrome c (cyt c) release serving as a pivotal commitment point. Cyt c is a nuclear-encoded 13 kDa hemoprotein normally localized in the mitochondrial intermembrane space, where it functions as an essential electron shuttle in the respiratory chain [7]. Upon integration of diverse apoptotic stimuli, cyt c is released into the cytosol, where it binds to apoptotic protease-activating factor-1 (Apaf-1) in the presence of dATP/ATP to form the oligomeric apoptosome complex [7]. This wheel-like structure, typically composed of seven Apaf-1-cyt c symmetric units, serves as a activation platform for the initiator caspase-9, which subsequently activates effector caspases-3 and -7, ultimately executing cell death [7] [6].
The regulation of mitochondrial outer membrane permeabilization (MOMP), the critical event governing cyt c release, is primarily mediated by the B cell lymphoma 2 (BCL2) protein family [9]. This family comprises both pro-apoptotic (e.g., BAX, BAK, BIM, BID) and anti-apoptotic (e.g., BCL2, BCL-XL, MCL1) members that interact through a complex network of competitive interactions to determine cellular fate [9]. The discovery that BCL2 functions as an oncogene by blocking apoptosis rather than promoting proliferation fundamentally changed cancer biology and highlighted the therapeutic potential of targeting this regulatory axis [9].
This technical review provides a comprehensive comparison of disease models across three pathological contexts—breast cancer, neuroblastoma, and neurodegenerative diseases—with emphasis on cytochrome c-mediated intrinsic apoptosis mechanisms, experimental methodologies, and translational applications.
Molecular Mechanisms of Cytochrome c Release
BCL2 Family Regulation of MOMP
The BCL2 family constitutes a tripartite apoptotic switch that integrates diverse death and survival signals to regulate MOMP. Anti-apoptotic proteins including BCL2, BCL-XL, BCL-w, MCL1, BCL2A1, and BCL-B preserve mitochondrial integrity by sequestering pro-apoptotic activors through interactions via their hydrophobic groove [9]. Multi-domain pro-apoptotic effectors BAX and BAK, when activated, undergo conformational changes and oligomerize to form pores in the mitochondrial outer membrane, facilitating cyt c release [9]. BH3-only proteins (BID, BIM, BAD, BIK, NOXA, PUMA, BMF, HRK) function as sentinels that either directly activate BAX/BAK or neutralize anti-apoptotic proteins [9].
Structural studies have revealed that the hydrophobic groove of anti-apoptotic BCL2 proteins contains four pockets (P1-P4) that accommodate the BH3 domains of pro-apoptotic partners [9]. This precise molecular interaction has enabled rational drug design of BH3-mimetic compounds that specifically disrupt these protein-protein interactions to reactivate apoptosis in malignant cells [9].
Alternative Release Mechanisms
While BCL2 family regulation represents the canonical pathway for cyt c release, additional mechanisms contribute under specific conditions. Early research demonstrated that cyt c release can occur independently of mitochondrial transmembrane potential (ΔΨm) loss and caspase activation [59]. Studies in CEM and HeLa cells exposed to UVB irradiation or staurosporine treatment revealed that cyt c translocation precedes DEVD-specific caspase activation and substrate cleavage, with reductions in ΔΨm occurring considerably later in the apoptotic process [59].
The interaction between cyt c and cardiolipin (CL), a phospholipid in the mitochondrial inner membrane, plays a crucial role in regulating cyt c release. Under normal conditions, cyt c is loosely bound to CL in the intermembrane space, but peroxidation of CL during apoptosis facilitates cyt c detachment and mobilization [5]. This two-step process—detachment from mitochondrial membranes followed by translocation through outer membrane pores—ensures precise regulation of this commitment step [5].
Table 1: Key Proteins Regulating Cytochrome c Release
| Protein | Family Class | Function in Apoptosis | Regulatory Mechanism |
|---|---|---|---|
| BCL2 | Anti-apoptotic | Inhibits MOMP | Sequesters BH3-only proteins and activated BAX/BAK |
| BCL-XL | Anti-apoptotic | Inhibits MOMP | Binds and neutralizes pro-apoptotic family members |
| MCL1 | Anti-apoptotic | Inhibits MOMP | Rapid turnover allows dynamic regulation of apoptosis |
| BAX | Pro-apoptotic effector | Promotes MOMP | Translocates to mitochondria, oligomerizes to form pores |
| BAK | Pro-apoptotic effector | Promotes MOMP | Resident mitochondrial protein, oligomerizes upon activation |
| BIM | BH3-only | Initiator | Activates BAX/BAK directly, neutralizes anti-apoptotics |
| BID | BH3-only | Initiator | Cleaved to tBID, activates BAX/BAK, amplifies death signals |
| BAD | BH3-only | Sensitizer | Neutralizes BCL2, BCL-XL through phosphorylation-regulated binding |
| cyt c | Apoptotic trigger | Execution phase | Electron carrier; when released activates caspase cascade via apoptosome |
Diagram 1: Cytochrome c Release Signaling Pathway. This diagram illustrates the core molecular events in the mitochondrial pathway of apoptosis, from initial stimuli to caspase activation and cell death.
Breast Cancer Models
Pathological Context and Cytochrome c Dysregulation
Breast cancer represents a heterogeneous disease characterized by distinct molecular subtypes with varying biological behaviors and clinical outcomes [7]. The common pathological classifications include ductal carcinoma in situ (DCIS), invasive ductal carcinoma (IDC), invasive lobular carcinoma (ILC), and special subtypes such as mucinous and medullary carcinomas [7]. Molecular subtyping based on estrogen receptor (ER), progesterone receptor (PR), human epidermal growth factor receptor 2 (HER2), and Ki-67 expression further categorizes breast cancer into Luminal A, Luminal B, HER2-positive, and triple-negative breast cancer (TNBC), with TNBC exhibiting the worst prognosis [7].
Normal mammary gland development requires precise balance between proliferation and apoptosis, with dysregulation of cell death pathways contributing to tumorigenesis [7]. In breast cancer, cyt c-mediated apoptosis is frequently impaired through multiple mechanisms. Studies have revealed that cyt c is released from epithelial cells into the ductal cavity in breast tumor samples, accompanied by a cyt c redox imbalance where the reduced form cannot effectively induce apoptosis [7]. Additionally, some intracellular proteins competitively bind cytosolic cyt c, preventing Apaf-1 interaction and apoptosome formation, thereby protecting cancer cells from apoptosis [7]. In TNBC, small extracellular vesicles (sEVs), particularly tumor-derived exosomes (TEXs), can enter T cells and induce cyt c release, promoting T-cell dysfunction and tumor immune evasion [7].
Therapeutic Targeting and Experimental Approaches
The critical role of cyt c in breast cancer pathophysiology extends to treatment response, as many conventional therapies—including chemotherapy, radiotherapy, and endocrine therapy—achieve their effects, at least partially, through induction of cyt c release and activation of the intrinsic apoptosis pathway [7]. Resistance to these treatments often correlates with reduced cyt c expression or impaired release, associated with lower patient survival rates [7].
Numerous natural products and synthetic compounds demonstrate efficacy in promoting cyt c-mediated apoptosis in breast cancer models. Table 2 summarizes key experimental findings from therapeutic approaches targeting this pathway:
Table 2: Cytochrome c-Targeting Approaches in Breast Cancer Models
| Compound/Intervention | Source/Type | Experimental Model | Key Effects on Cytochrome c Pathway | Molecular Outcome |
|---|---|---|---|---|
| Moringa isothiocyanate | Moringa oleifera seeds | MCF-7, MDA-MB-231 cells | Induces proapoptotic proteins cyt c, p53, cleaved caspase-7 | Mitochondrial pathway activation; growth inhibition [7] |
| Apigenin | Flavone (onion, grapefruit, chamomile) | Various tumor models including breast cancer | Activates intrinsic pathway via cyt c, Bax, caspase-3 induction | Significant antitumor activity [7] |
| Catalpol | Iridoid glycoside from Rehmannia glutinosa | MCF-7 cells (in vitro and in vivo) | Causes MMP loss, increased ROS, elevated cytoplasmic cyt c | Mitochondrial apoptotic pathway regulation; breast cancer inhibition [7] |
| CREE | Root of Cimicifuga dahurica | MCF-7, MDA-MB-231 cells | Upregulates Bax, caspase-9/3, and cyt c expression | Mitochondrial pathway activation; inhibits proliferation, migration, invasion [7] |
| Diallyl trisulfide (DATS) | Allium vegetables | Breast cancer models | Regulates cyt c release | Apoptosis induction [7] |
| BH3-mimetics (Venetoclax) | Synthetic small molecule | Hematologic malignancies, solid tumors under investigation | Inhibits BCL2, displaces pro-apoptotic proteins | Reactivates apoptosis; transforms treatment of several cancers [9] |
Emerging therapeutic strategies include direct delivery of exogenous cyt c into cancer cell cytosol, effectively bypassing defective release mechanisms to induce apoptosis [7]. Additionally, the development of BH3-mimetics represents a rational approach to targeting the BCL2 family axis upstream of cyt c release. Venetoclax (ABT-199), the first FDA-approved BCL2-selective BH3-mimetic, has demonstrated remarkable efficacy in hematologic malignancies, with ongoing investigations exploring its potential in solid tumors, including breast cancer [9].
Neuroblastoma Models
Pathological Context and Experimental Insights
Neuroblastoma, the most common extracranial solid tumor in children, arises from undifferentiated neural crest cells within the peripheral sympathetic nervous system, adrenal medulla, or paraspinal ganglia [147]. This malignancy primarily affects young children, with a median diagnosis age of 22 months, and approximately 90% of cases diagnosed before age 10 [147]. High-risk neuroblastoma presents significant therapeutic challenges, with nearly 70% of patients presenting with metastatic disease at diagnosis, contributing to poor prognoses despite intensive multimodal therapy [147].
Research utilizing the BE(2)-C human neuroblastoma cell line has provided detailed insights into cyt c-mediated apoptosis mechanisms. Studies investigating 25-hydroxycholesterol (25OHChol), an oxysterol produced through cholesterol oxidation, demonstrated concentration- and time-dependent cytotoxicity in this model [147]. Treatment with 25OHChol (1 μg/mL) for 48 hours reduced cell viability to 50.6%, with morphological changes characteristic of apoptosis, including cell shrinkage, loss of cell-cell adhesion, chromatin condensation, and nuclear fragmentation [147].
Molecular Mechanisms and Quantitative Assessment
The molecular events underlying 25OHChol-induced apoptosis in neuroblastoma models involve classic intrinsic pathway activation. Western blot analyses revealed time-dependent increases in the Bax/Bcl-2 ratio, with values of 0.51, 0.94, and 1.69 at 0, 24, and 48 hours post-treatment, respectively [147]. This shifting balance toward pro-apoptotic signaling promotes mitochondrial outer membrane permeabilization, facilitating cyt c release.
Flow cytometry with Annexin V/PI staining confirmed apoptosis induction, with 25OHChol treatment increasing combined early and late apoptosis rates to 79.17%, compared to 6.82% in controls [147]. Additional mechanistic insights came from measurements of mitochondrial membrane potential (MMP) loss using JC-1 dye and demonstrations of increased caspase-9 and caspase-3/7 activity, supporting caspase-mediated apoptosis execution [147]. The essential role of caspases was further confirmed through rescue experiments with the pan-caspase inhibitor Z-VAD-FMK, which dose-dependently increased cell viability [147].
Table 3: Quantitative Apoptosis Parameters in Neuroblastoma Models
| Parameter | Experimental Method | Control/ Baseline | Treatment Response | Time Course |
|---|---|---|---|---|
| Cell Viability | CCK-8 assay | 100% (untreated) | 58.1% (1μg/mL 25OHChol) | 48 hours [147] |
| Bax/Bcl-2 Ratio | Western blot | 0.51 (untreated) | 1.69 | 48 hours [147] |
| Apoptotic Rate | Annexin V/PI flow cytometry | 6.82% (control) | 79.17% (25OHChol-treated) | 48 hours [147] |
| MMP Loss | JC-1 dye flow cytometry | Baseline levels | Significant reduction | Concentration-dependent [147] |
| Caspase Activity | Caspase activity assays | Baseline activity | Increased caspase-9 and caspase-3/7 | Activation post-cyt c release [147] |
Neurodegenerative Disease Models
Mitochondrial Dysfunction in Neurodegeneration
Neurodegenerative diseases (NDs), including Alzheimer's disease (AD), Parkinson's disease (PD), Huntington's disease (HD), and amyotrophic lateral sclerosis (ALS), represent a heterogeneous group of disorders characterized by progressive neuronal loss and pathological protein aggregates [148]. Mitochondrial dysfunction emerges as a central feature across these conditions, with defective energy production, calcium dysregulation, oxidative stress, and impaired quality control mechanisms contributing to disease pathogenesis [148] [149].
In Alzheimer's disease, mitochondrial abnormalities precede the appearance of classic histopathological markers such as amyloid-β plaques and tau neurofibrillary tangles [149]. These dysfunctional mitochondria exhibit altered electron transport chain function, particularly at complex IV (cytochrome c oxidase), increased free radical generation, and impaired oxidative phosphorylation, collectively promoting neuronal vulnerability [149]. The critical role of mitochondria in neuronal health stems from their function as primary energy producers supporting the high metabolic demands of the nervous system [148].
Apoptosis and Cytochrome c in Neuronal Death
While the role of cyt c in neurodegeneration is less characterized than in cancer models, accumulating evidence suggests that apoptosis contributes to neuronal loss across multiple NDs. The intimate connection between mitochondrial quality control and neuronal survival underscores the importance of understanding cyt c regulation in these contexts [148]. Mitochondrial quality control systems, including mitophagy, biogenesis, dynamics, and trafficking, work cooperatively to maintain functional organelles, with defects in these processes leading to the accumulation of damaged mitochondria prone to releasing pro-apoptotic factors [148].
In AD models, mitochondrial dysfunction leads to altered electron transport chain function, free radical generation, and oxidative stress, creating conditions that promote the mitochondrial permeability transition and potential cyt c release [149]. Similar processes likely operate in PD, where mitochondrial toxins such as MPTP/MPP+ and rotenone directly inhibit complex I, inducing Parkinsonian symptoms in models and implicating mitochondrial-dependent death pathways in dopaminergic neuron loss [148].
Experimental Protocols and Methodologies
Core Assessment Techniques
The evaluation of cyt c release and intrinsic apoptosis pathway activation employs standardized experimental approaches across disease models. This section details key methodologies relevant to the studies discussed in this review.
Protocol 1: Assessment of Cytochrome c Release and Mitochondrial Membrane Potential
- Objective: To evaluate cyt c translocation from mitochondria to cytosol and measure mitochondrial membrane potential (ΔΨm) changes.
- Materials:
- Cell lines (e.g., MCF-7, BE(2)-C, neuronal cultures)
- Mitochondrial isolation kit
- Cyt c ELISA kit or Western blot equipment
- JC-1 dye or TMRE
- Flow cytometer or fluorescence microscope
- Lysis buffers (mitochondrial and cytosolic fractionation)
- Procedure:
- Treat cells with experimental compounds (e.g., 25OHChol, natural products) for predetermined time courses.
- Harvest cells and fractionate into mitochondrial and cytosolic components using differential centrifugation.
- Detect cyt c distribution via Western blotting of fractionated samples or quantitative ELISA.
- For MMP assessment, load cells with JC-1 dye (2.5 μg/mL) for 30 minutes at 37°C.
- Analyze by flow cytometry, measuring fluorescence emission shift from red (aggregates, high MMP) to green (monomers, low MMP).
- Key Applications: This protocol was utilized in neuroblastoma studies with 25OHChol [147] and breast cancer investigations with various natural products [7].
Protocol 2: Comprehensive Apoptosis Detection and Caspase Activity
- Objective: To quantify apoptosis rates and measure caspase activation.
- Materials:
- Annexin V-FITC/PI apoptosis detection kit
- Caspase-9 and caspase-3/7 activity assay kits
- DAPI staining solution
- Flow cytometer
- Fluorescence microplate reader
- Procedure:
- Treat cells with experimental agents and harvest at appropriate time points.
- For Annexin V/PI staining, resuspend cells in binding buffer containing Annexin V-FITC and PI. Incubate 15 minutes in dark and analyze by flow cytometry within 1 hour.
- For morphological assessment, fix cells and stain with DAPI (1 μg/mL) for 15 minutes. Visualize nuclear condensation and fragmentation via fluorescence microscopy.
- For caspase activity, lyse cells and incubate with specific caspase substrates (e.g., LEHD-pNA for caspase-9, DEVD-pNA for caspase-3/7). Measure cleavage product formation spectrophotometrically at 405 nm.
- Key Applications: This methodology provided critical evidence of 25OHChol-induced apoptosis in neuroblastoma models [147] and has been applied across breast cancer studies evaluating novel therapeutics [7].
Protocol 3: BCL2 Family Protein Expression Analysis
- Objective: To quantify expression levels and interactions of BCL2 family proteins.
- Materials:
- RIPA lysis buffer with protease inhibitors
- BCA protein assay kit
- SDS-PAGE and Western blotting equipment
- Antibodies against BCL2, BCL-XL, MCL1, BAX, BIM, etc.
- Chemiluminescence detection system
- Procedure:
- Lyse cells in RIPA buffer and determine protein concentration.
- Separate proteins by SDS-PAGE and transfer to PVDF membranes.
- Block membranes and incubate with primary antibodies overnight at 4°C.
- Incubate with HRP-conjugated secondary antibodies and develop with enhanced chemiluminescence.
- Quantify band intensities and calculate ratios (e.g., Bax/Bcl-2).
- Key Applications: This approach demonstrated the increasing Bax/Bcl-2 ratio in 25OHChol-treated neuroblastoma cells [147] and characterizes mechanism of action for BH3-mimetics [9].
The Scientist's Toolkit: Essential Research Reagents
Table 4: Key Research Reagents for Cytochrome c Release Studies
| Reagent/Category | Specific Examples | Primary Function | Application Context |
|---|---|---|---|
| Cell Lines | MCF-7, MDA-MB-231 (breast cancer); BE(2)-C (neuroblastoma); SH-SY5Y (neuronal) | Disease-specific modeling | In vitro screening of therapeutic agents and pathway analysis [7] [147] |
| Apoptosis Inducers | 25-Hydroxycholesterol, natural products (Apigenin, Catalpol), BH3-mimetics (Venetoclax) | Activate intrinsic apoptosis pathway | Experimental triggering of cyt c release for mechanistic studies [7] [147] [9] |
| Caspase Inhibitors | Z-VAD-FMK (pan-caspase inhibitor) | Inhibit caspase activity | Determine caspase-dependence of cell death pathways [147] |
| Mitochondrial Dyes | JC-1, TMRE | Measure mitochondrial membrane potential (ΔΨm) | Assess mitochondrial function and early apoptotic events [147] |
| Antibodies | Anti-cytochrome c, anti-BCL2 family proteins, anti-caspases | Protein detection and localization | Western blotting, immunohistochemistry, subcellular localization studies [7] [147] |
| Apoptosis Detection Kits | Annexin V/PI staining kits, caspase activity assays | Quantify apoptosis rates and caspase activation | Standardized assessment of cell death parameters [147] |
Diagram 2: Experimental Workflow for Cytochrome c Release Studies. This diagram outlines the core methodology for investigating mitochondrial apoptosis across disease models.
Comparative Analysis and Future Directions
The investigation of cyt c-mediated intrinsic apoptosis across breast cancer, neuroblastoma, and neurodegenerative contexts reveals both conserved mechanisms and disease-specific adaptations. In cancer models, the fundamental pathophysiology involves evasion of apoptosis, often through overexpression of anti-apoptotic BCL2 family members or impaired cyt c release, contributing to treatment resistance [7] [9]. Conversely, in neurodegenerative diseases, excessive or untimely apoptosis may contribute to neuronal loss, with mitochondrial dysfunction creating conditions primed for cyt c release [148] [149].
From a therapeutic perspective, reactivating apoptosis in cancer through BH3-mimetics or direct cyt c delivery represents a promising strategy, particularly for resistant malignancies [7] [9]. In contrast, neuroprotective approaches focusing on stabilizing mitochondria and preventing pathological cyt c release may benefit neurodegenerative conditions [148] [149]. The neuroblastoma model with 25OHChol exemplifies how oxysterols and other endogenous molecules can selectively induce cyt c-mediated death in specific cancer types, revealing potential therapeutic opportunities [147].
Future research directions include developing more selective BCL2 family inhibitors with improved therapeutic indices, optimizing delivery strategies for difficult-to-treat solid tumors and protected anatomical sites like the central nervous system, and identifying biomarkers that predict sensitivity to apoptosis-targeting therapies. Additionally, understanding the crosstalk between different cell death pathways—including the newly described PANoptosis (integrated apoptosis, pyroptosis, and necroptosis) [150] and other novel programmed cell death mechanisms such as ferroptosis, cuproptosis, and disulfidptosis [151]—will provide more comprehensive insights into cellular fate decisions across pathological contexts.
The continued refinement of disease models and experimental approaches will enhance our understanding of cyt c biology, ultimately translating to improved therapeutic strategies that modulate the intrinsic apoptosis pathway for cancer and neurodegenerative disease treatment.
The release of cytochrome c (Cyt c) from the mitochondrial intermembrane space has been established as a fundamental, irreversible step in the initiation of intrinsic apoptosis. Upon translocation to the cytosol, Cyt c triggers the formation of the apoptosome, leading to caspase-9 and downstream effector caspase activation, ultimately resulting in controlled cellular dismantling [22] [152]. However, recent research has unveiled a more complex and paradoxical biology underlying cytosolic Cyt c, revealing roles in inflammatory signaling and non-apoptotic processes that diverge from its classical pro-death function. This whitepaper synthesizes emerging paradigms that redefine Cyt c as a multifaceted signaling molecule with functions in cell death repression and innate immune regulation, providing an in-depth technical guide for researchers and drug development professionals working within the context of intrinsic apoptosis pathway mitochondrial cytochrome c release research.
Classical Apoptotic Pathway of Cytochrome c
The canonical intrinsic apoptosis pathway is initiated by cellular stressors, including DNA damage, oxidative stress, and growth factor withdrawal. This pathway is tightly regulated by the B-cell lymphoma-2 (BCL-2) protein family, which comprises pro-apoptotic (e.g., Bax, Bak, Bid, Bim) and anti-apoptotic (e.g., Bcl-2, Bcl-xL) members [22] [153] [152]. Upon an apoptotic stimulus, activated pro-apoptotic BH3-only proteins neutralize anti-apoptotic members, enabling the oligomerization of Bax and Bak in the mitochondrial outer membrane (OMM). This oligomerization induces mitochondrial outer membrane permeabilization (MOMP), a critical step that allows for the release of several mitochondrial intermembrane proteins, including Cyt c, SMAC/DIABLO, and AIF [152].
Following its release into the cytosol, Cyt c engages in a well-orchestrated protein-protein interaction cascade. It binds to the adapter protein Apoptotic Protease-Activating Factor 1 (Apaf-1) in a dATP/ATP-dependent manner, inducing a conformational change that promotes Apaf-1 oligomerization into a wheel-like signaling complex known as the apoptosome [153] [152]. This complex recruits and facilitates the auto-activation of the initiator caspase, caspase-9. The activated caspase-9 then cleaves and activates the executioner caspases-3 and -7, which carry out the systematic proteolysis of cellular components, culminating in apoptotic cell death [154] [152].
Table 1: Key Components of the Classical Intrinsic Apoptosis Pathway
| Component | Function in Apoptosis | Regulatory Mechanism |
|---|---|---|
| BCL-2 Family | Regulates MOMP | Pro- vs. Anti-apoptotic balance |
| Bax/Bak | Forms pores in OMM | Oligomerization upon activation |
| Cytochrome c | Apoptosome trigger | Released upon MOMP |
| Apaf-1 | Apoptosome scaffold | Cyt c-induced oligomerization |
| Caspase-9 | Initiator caspase | Activated within apoptosome |
| Caspases-3/7 | Executioner caspases | Cleaved and activated by caspase-9 |
Emerging Non-Apoptotic Functions of Cytochrome c
Cytochrome c as a Repressor of Ferroptosis
Recent research has uncovered a surprising, non-apoptotic role for cytosolic Cyt c: the repression of ferroptosis. Ferroptosis is an iron-dependent, non-apoptotic form of cell death driven by uncontrolled lipid peroxidation [104]. A 2025 study demonstrated that the translocation of Cyt c to the cytosol in response to ferroptotic stimuli does not necessarily initiate apoptosis. Instead, Cyt c forms a novel cytosolic complex with inositol polyphosphate-4-phosphatase type I A (INPP4A). This CYCS-INPP4A complex is distinct from the canonical apoptosome and does not involve Apaf-1 or trigger caspase activation [104].
Within this complex, Cyt c acts as an allosteric booster that enhances INPP4A's enzymatic activity. The activated phosphatase then drives specific phosphatidylinositol metabolism, leading to increased production of phosphatidylinositol-3-phosphate (PI3P). This lipid messenger plays a protective role by preventing the accumulation of phospholipid peroxides and subsequent plasma membrane rupture, thereby averting ferroptotic cell death [104]. This pathway represents a paradigm shift, positioning Cyt c as a critical node in cell fate decision-making, capable of cross-regulating distinct cell death pathways.
Cytochrome c in Inflammatory Signaling and PANoptosis
The role of Cyt c and its associated caspases has also expanded into the realm of inflammatory lytic cell death. While the apoptosome traditionally initiates the non-lytic, non-inflammatory pathway of apoptosis, emerging concepts like PANoptosis highlight significant crosstalk. PANoptosis is an innate immune, inflammatory cell death pathway that is regulated by multifaceted protein complexes called PANoptosomes, which integrate components from other cell death pathways, including apoptosis [154].
Although Cyt c itself is not a direct component of the core inflammatory machinery, the apoptotic caspases it activates can contribute to inflammatory outcomes. For instance, caspase-3, a key executioner caspase downstream of Cyt c and the apoptosome, can cleave gasdermin E (GSDME). This cleavage releases the N-terminal pore-forming fragment of GSDME, which triggers pyroptosis-like lytic cell death and promotes inflammation [154]. This interplay demonstrates that the Cyt c-initiated apoptotic cascade can, under certain conditions, cross into the realm of inflammatory lytic cell death, blurring the historical lines between apoptotic and inflammatory caspases.
Non-Apoptotic Roles in Cellular Differentiation
Evidence also points to a non-lethal role for components of the intrinsic pathway in cellular differentiation. Studies in developing lens tissue have revealed that proteins associated with apoptosis, including Cyt c release and caspase-3-like activity, are present in the equatorial epithelium where differentiation is initiated. However, the level of caspase activity is significantly lower than that observed in full-blown apoptosis. This process, termed Apoptosis-related Bcl-2- and caspase-dependent (ABC) differentiation, is thought to be permitted by the concurrent activation of pro-survival pathways, which keep the pro-apoptotic signals in check, allowing them to function as molecular switches for differentiation without inducing cell death [155].
The diagram below illustrates the dual roles of cytochrome c, contrasting its classical apoptotic function with its emerging non-apoptotic roles.
Quantitative Data and Experimental Methodologies
Quantitative Data on Cytochrome c Functions
Research into the dual roles of Cyt c has yielded key quantitative insights. The following table summarizes critical quantitative findings related to Cyt c release, complex formation, and functional outcomes from recent studies.
Table 2: Quantitative Data on Cytochrome c Release and Function
| Parameter | Value/Measurement | Experimental Context | Significance |
|---|---|---|---|
| Cytosolic Cyt c Concentration | 1-10 µM [156] | Early apoptosis in A549 cells | Threshold for apoptosome formation |
| CRISPR Screen Hits | 1,469 genes enhancing ferroptosis susceptibility [104] | GPX4 inhibitor ML210 in renal carcinoma cells | Identified CYCS as a ferroptosis repressor |
| Cyt c-INPP4A Disruption | Enhanced tumor suppression [104] | 10A3 compound in immunocompetent mice | Validated complex as therapeutic target |
| Caspase-3 Activity in Differentiation | Significantly lower than in apoptosis [155] | Lens epithelial cell differentiation | Supports non-apoptotic signaling role |
Experimental Protocols for Cytochrome c Analysis
Spectrophotometric Quantification of Cytochrome c Release
This protocol is adapted from a rapid spectrophotometric method for quantifying Cyt c release from isolated mitochondria or permeabilized cells [123].
- Principle: The method leverages the characteristic Soret (γ) peak of Cyt c at 414 nm in its reduced state for direct quantification.
- Procedure:
- Sample Preparation: Isolate mitochondria from tissues or cells via differential centrifugation. Alternatively, use digitonin-permeabilized cells.
- Induction of Release: Incubate mitochondria/permeabilized cells with a pro-apoptotic protein (e.g., tBID, Bax) or a chemical inducer in an appropriate buffer (e.g., containing KCl, sucrose, HEPES).
- Separation: Pellet the mitochondria via high-speed centrifugation (e.g., 10,000 × g for 10 min).
- Reduction: Add a reducing agent like sodium dithionite to the supernatant containing released Cyt c.
- Spectrophotometry: Measure the absorbance of the reduced supernatant at 414 nm and 540 nm (isosbestic point). The difference in absorbance (A~414~ - A~540~) is proportional to the concentration of released Cyt c, which can be calculated using the extinction coefficient Δε~414-540~ = 106,000 M^-1^cm^-1^.
- Validation: Results can be validated by correlating with oxygraphic measurements of Cyt c-dependent mitochondrial respiration [123].
Fluorescence-Based Detection of Cytosolic Cytochrome c
This protocol utilizes carbon quantum dots (CQDs) for a semi-quantitative, imaging-based assessment of Cyt c release in cultured cells [156].
- Principle: Synthesized CQDs exhibit bright blue fluorescence that is quenched upon interaction with Cyt c. A decrease in intracellular fluorescence intensity indicates Cyt c release from mitochondria into the cytosol.
- Reagents:
- CQDs: Synthesized from sodium citrate and polyethylene imine (PEI) [156].
- Apoptosis Inducers: Staurosporine or etoposide.
- Stains: MitoTracker Red (mitochondria), DRAQ5 (nucleus), Phalloidin-FITC (actin).
- Procedure:
- Cell Culture and Treatment: Seed A549 or other adherent cells on confocal dishes. Treat with apoptosis-inducing compounds (e.g., 1 µM staurosporine) for a predetermined time.
- Staining: Incubate live cells with CQDs (e.g., 50 µg/mL) for 30-60 minutes.
- Fixation and Counterstaining (Optional): Fix cells with paraformaldehyde and stain with organelle-specific dyes or antibodies for context.
- Imaging: Acquire images using a confocal laser scanning microscope (CLSM) with a 405 nm laser for CQD excitation and appropriate filters for emission collection (~440 nm).
- Analysis: Quantify the fluorescence intensity in the cytosolic region of treated versus untreated cells using image analysis software (e.g., ImageJ). A significant drop in CQD fluorescence in the cytosol of treated cells confirms Cyt c release.
- Controls: Include untreated cells and cells co-stained with MitoTracker to confirm mitochondrial localization in healthy cells [156].
The following workflow diagram outlines the key steps for detecting cytochrome c release using the carbon quantum dot method.
The Scientist's Toolkit: Essential Research Reagents
The following table compiles key reagents and tools essential for investigating the apoptotic and non-apoptotic roles of cytochrome c.
Table 3: Essential Research Reagents for Cytochrome c Studies
| Reagent / Tool | Function / Application | Key Characteristics / Examples |
|---|---|---|
| Carbon Quantum Dots (CQDs) | Fluorescent sensor for cytosolic Cyt c detection [156] | Quenched by Cyt c; used for live-cell imaging |
| Compound 10A3 | Disrupts CYCS-INPP4A interaction [104] | Tool compound for studying ferroptosis repression |
| BH3 Mimetics (e.g., ABT-737) | Induce sublethal Cyt c release [104] | Investigate non-apoptotic signaling & therapy resistance |
| Ferroptosis Inducers (e.g., RSL3, ML210, Erastin) | Trigger lipid peroxidation [104] | Probe Cyt c's role in ferroptosis repression |
| Pan-caspase Inhibitor (e.g., Z-VAD-FMK) | Inhibits caspase activity [104] [22] | Decouples Cyt c release from apoptotic outcomes |
| TUNEL Assay Kit | Detects DNA fragmentation [157] | Late-stage apoptosis marker |
| Annexin V Conjugates | Binds phosphatidylserine [157] | Early apoptosis marker (flow cytometry, imaging) |
| Anti-Cytochrome c Antibodies | Detect subcellular localization (IF, WB) [54] | Critical for validating Cyt c release in fixed cells |
| MitoTracker Dyes | Label intact mitochondria [157] | Provides organellar context for Cyt c localization |
| Caspase-3/9 Activity Assays | Measure caspase activation [157] [155] | Quantifies apoptotic signaling downstream of Cyt c |
Discussion and Future Perspectives
The emerging roles of cytochrome c in repressing ferroptosis and potentially signaling in differentiation represent a significant conceptual shift in cell biology. The discovery of the CYCS-INPP4A complex reveals a sophisticated mechanism for cellular fate determination, where the subcellular localization and binding partners of Cyt c dictate its function as either a pro-apoptotic or pro-survival signal [104]. This duality has profound implications for understanding disease mechanisms and developing therapeutics. For instance, in cancer, tumor cells might exploit the anti-ferroptotic function of Cyt c to resist certain forms of cell death, making the CYCS-INPP4A interface a promising novel target for therapeutic intervention, as preliminarily validated by the compound 10A3 [104].
Future research should focus on elucidating the precise structural interactions within the CYCS-INPP4A complex and the spatial-temporal dynamics that govern whether cytosolic Cyt c commits to apoptosome formation or INPP4A binding. Furthermore, the extent and mechanisms of Cyt c's involvement in inflammatory processes and other non-apoptotic cellular programs, such as differentiation and proliferation, warrant deeper investigation. Advanced techniques in live-cell imaging, structural biology, and genetic manipulation will be crucial in dissecting these complex signaling networks. As our understanding of these non-canonical pathways grows, so will the potential to develop innovative therapies that modulate cell death and survival in diseases such as cancer, neurodegeneration, and ischemia-reperfusion injury.
Conclusion
The mitochondrial cytochrome c release pathway represents a master regulatory switch in intrinsic apoptosis, with far-reaching implications for understanding disease pathogenesis and developing targeted therapies. Key takeaways include the critical role of emerging regulators like LACTB in inner membrane remodeling, the power of advanced single-cell detection methods such as 3D SERS substrates for spatial resolution of release dynamics, and the therapeutic potential of both small molecule and natural compound inducers. Future research directions should focus on exploiting tissue-specific regulation of this pathway for precision medicine, developing clinically viable biomarkers based on extracellular cytochrome c detection, and designing combination therapies that overcome apoptotic resistance in cancer and neurodegenerative disorders. The continued elucidation of cytochrome c release mechanisms promises to yield novel diagnostic tools and therapeutic strategies across multiple disease contexts.
References
- 1. Diverse functions of cytochrome c in cell death and disease [https://pmc.ncbi.nlm.nih.gov/articles/PMC11043370/]
- 2. The multiple functions of cytochrome c and their regulation in ... [https://pmc.ncbi.nlm.nih.gov/articles/PMC3075374/]
- 3. Cytochrome c: the Achilles' heel in apoptosis - PMC [https://pmc.ncbi.nlm.nih.gov/articles/PMC11114681/]
- 4. Mitochondria-targeted disruptors and inhibitors of cytochrome ... [https://pmc.ncbi.nlm.nih.gov/articles/PMC2659540/]
- 5. Mechanisms of cytochrome c release from mitochondria [https://www.nature.com/articles/4401950]
- 6. Cytochrome c and cancer cell metabolism: A new perspective [https://www.sciencedirect.com/science/article/pii/S1319016424002457]
- 7. The role and application potential of cytochrome c in breast ... [https://pmc.ncbi.nlm.nih.gov/articles/PMC12589747/]
- 8. Molecular Basis and Consequences of the Cytochrome c- ... [https://www.sciencedirect.com/science/article/pii/S0021925820401747]
- 9. The BCL2 family: from apoptosis mechanisms to new ... [https://www.nature.com/articles/s41392-025-02176-0]
- 10. Mechanisms of Action of Bcl-2 Family Proteins - PMC [https://pmc.ncbi.nlm.nih.gov/articles/PMC3683897/]
- 11. The BCL-2 protein family: from discovery to drug ... [https://www.nature.com/articles/s41418-025-01481-z]
- 12. The BCL-2 family: key mediators of the apoptotic response to ... [https://pmc.ncbi.nlm.nih.gov/articles/PMC4727530/]
- 13. The role of BCL-2 family proteins in regulating apoptosis ... [https://www.frontiersin.org/journals/oncology/articles/10.3389/fonc.2022.985363/full]
- 14. Mitochondrial orchestration of PANoptosis - PubMed Central [https://pmc.ncbi.nlm.nih.gov/articles/PMC12540656/]
- 15. Mitochondrial outer membrane permeabilization at the single ... [https://pmc.ncbi.nlm.nih.gov/articles/PMC8106609/]
- 16. The Role of Mitochondrial Outer Membrane ... [https://www.sciencedirect.com/science/article/abs/pii/S2451963417300341]
- 17. Mitochondrial cristae remodeling: Mechanisms, functions, ... [https://www.sciencedirect.com/science/article/pii/S2772892725000598]
- 18. Mitochondrial Membrane Remodeling [https://www.frontiersin.org/journals/bioengineering-and-biotechnology/articles/10.3389/fbioe.2021.786806/full]
- 19. Cristae remodeling causes acidification detected by ... [https://www.nature.com/articles/srep35907]
- 20. Apoptosome [https://en.wikipedia.org/wiki/Apoptosome]
- 21. Activation of caspase-9 on the apoptosome as studied by ... [https://pmc.ncbi.nlm.nih.gov/articles/PMC10743466/]
- 22. Apoptosis: A Comprehensive Overview of Signaling Pathways ... [https://pmc.ncbi.nlm.nih.gov/articles/PMC11592877/]
- 23. New insights into apoptosome structure and function - PMC [https://pmc.ncbi.nlm.nih.gov/articles/PMC6030056/]
- 24. The tumor suppressor LACTB remodels mitochondria to ... [https://pmc.ncbi.nlm.nih.gov/articles/PMC12609066/]
- 25. Apoptosome: a platform for the activation of initiator caspases [https://www.nature.com/articles/4402028]
- 26. Caspases as master regulators of programmed cell death [https://www.nature.com/articles/s12276-025-01470-9]
- 27. Mechanisms of cytochrome c release from mitochondria [https://pubmed.ncbi.nlm.nih.gov/16676004/]
- 28. The structure of the human LACTB filament reveals the ... [https://journals.plos.org/plosbiology/article?id=10.1371/journal.pbio.3001899]
- 29. The structure of the human LACTB filament reveals the ... [https://pmc.ncbi.nlm.nih.gov/articles/PMC9815587/]
- 30. Mitochondrial translocation of Nur77 mediates cardiomyocyte ... [https://pmc.ncbi.nlm.nih.gov/articles/PMC3164102/]
- 31. Controversy and multiple roles of the solitary nucleus receptor ... [https://pmc.ncbi.nlm.nih.gov/articles/PMC11904867/]
- 32. Mechanisms of orphan nuclear receptor Nur77 in liver ... [https://www.nature.com/articles/s44355-025-00037-9]
- 33. The Release of Cytochrome c from Mitochondria during ... [https://pmc.ncbi.nlm.nih.gov/articles/PMC2148194/]
- 34. Insights on the crosstalk among different cell death ... [https://www.nature.com/articles/s41420-025-02328-9]
- 35. Targeting apoptotic pathways for cancer therapy - PMC [https://pmc.ncbi.nlm.nih.gov/articles/PMC11245162/]
- 36. Essential requirement of cytochrome c release for caspase ... [https://www.nature.com/articles/cddis201190]
- 37. Distinct stages of cytochrome c release from mitochondria [https://pmc.ncbi.nlm.nih.gov/articles/PMC1199554/]
- 38. Deciphering the Molecular Nexus: An In-Depth Review of ... [https://www.mdpi.com/2073-4409/13/10/863]
- 39. Mitochondria and cell death signalling [https://www.sciencedirect.com/science/article/pii/S0955067425000481]
- 40. Mitochondrial Regulation of Caspase Activation by ... [https://www.sciencedirect.com/science/article/pii/S0021925820686367]
- 41. Cytochrome c and cancer cell metabolism: A new perspective [https://pmc.ncbi.nlm.nih.gov/articles/PMC11570848/]
- 42. Double face of cytochrome c in cancers by Raman imaging [https://www.nature.com/articles/s41598-022-04803-0]
- 43. Molecular mechanisms of cell death in neurological ... [https://www.nature.com/articles/s41418-021-00814-y]
- 44. Apoptosis and the Balance of Homeostatic and Pathologic ... [https://pmc.ncbi.nlm.nih.gov/articles/PMC219574/]
- 45. Mitochondria-associated programmed cell death as a ... [https://www.nature.com/articles/s12276-023-01046-5]
- 46. Mitochondrial and Cell Death Mechanisms in ... [https://pmc.ncbi.nlm.nih.gov/articles/PMC3023298/]
- 47. Developmental Regulation of Mitochondrial Apoptosis by c ... [https://www.sciencedirect.com/science/article/pii/S1535610816305542]
- 48. 25-Hydroxycholesterol Induces Intrinsic Apoptosis via ... [https://www.mdpi.com/1422-0067/26/16/8012]
- 49. Recent advances in cytochrome c biosensing technologies [https://www.sciencedirect.com/science/article/abs/pii/S0956566316308855]
- 50. Programmed cell death detection methods - PubMed Central [https://pmc.ncbi.nlm.nih.gov/articles/PMC9308588/]
- 51. Flow cytometry based assays for the measurement of ... [https://www.sciencedirect.com/science/article/pii/S1046202313000893]
- 52. Apoptosis western blot guide [https://www.abcam.com/en-us/knowledge-center/western-blot/western-blot-analysis-of-apoptosis]
- 53. Immunodetection of cytochrome c by flow cytometry after ... [https://pubmed.ncbi.nlm.nih.gov/16680678/]
- 54. A new quantitative assay for cytochrome c release in ... [https://www.nature.com/articles/4401263]
- 55. In situ spatial profiling of cytochrome c release at the single ... [https://www.sciencedirect.com/science/article/abs/pii/S0956566325006943]
- 56. Surface-enhanced Raman scattering (SERS) technology [https://www.sciencedirect.com/science/article/abs/pii/S1046202325001306]
- 57. Advances and applications of dynamic surface-enhanced ... [https://pubs.rsc.org/en/content/articlehtml/2025/nr/d4nr04239e]
- 58. Surface-Enhanced Raman Spectroscopy (SERS) Based ... [https://pubmed.ncbi.nlm.nih.gov/40687502/]
- 59. Mitochondrial cytochrome c release in apoptosis occurs ... [https://pmc.ncbi.nlm.nih.gov/articles/PMC1170356/]
- 60. Mitochondrial dynamics and pore formation in regulated ... [https://www.sciencedirect.com/science/article/pii/S0968000425002191]
- 61. Exposure of the inner mitochondrial membrane triggers ... [https://www.nature.com/articles/s41418-024-01260-2]
- 62. Mitochondria-specific photorelease of ceramide induces ... [https://pmc.ncbi.nlm.nih.gov/articles/PMC12590141/]
- 63. A Small Molecule that Induces Intrinsic Pathway Apoptosis ... [https://www.sciencedirect.com/science/article/pii/S2211124715012127]
- 64. Advanced flow cytometry data analysis ... [https://www.flowjo.com/advanced_analysis.html]
- 65. The role of cardiolipin and cytochrome c in mitochondrial ... [https://pubs.rsc.org/en/content/articlehtml/2024/an/d4an00015c]
- 66. Phototherapy in cancer treatment: strategies and challenges [https://www.nature.com/articles/s41392-025-02140-y]
- 67. Probing cytochrome c in living mitochondria with surface ... [https://www.nature.com/articles/srep13793]
- 68. Serum cytochrome c indicates in vivo apoptosis and can serve ... [https://www.semanticscholar.org/paper/Serum-cytochrome-c-indicates-in-vivo-apoptosis-and-Barczyk-Kreuter/1f4b1370f4b8f95edab9cc8cf626098aad5ec80d]
- 69. AI for High-Content Screening in Drug Discovery [https://lifesciences.danaher.com/us/en/library/ai-high-content-screening-drug-discovery]
- 70. High content screening strategies for large-scale ... [https://www.sciencedirect.com/science/article/abs/pii/S0166354223002425]
- 71. FAIR High Content Screening in Bioimaging | Scientific Data [https://www.nature.com/articles/s41597-023-02367-w]
- 72. Flow cytometry-based apoptosis detection - PMC [https://pmc.ncbi.nlm.nih.gov/articles/PMC3863590/]
- 73. High Content Screening (HCS) with AI & ML [https://ardigen.com/high-content-screening-redefining-what-is-possible-with-artificial-intelligence-and-machine-learning/]
- 74. The Potential of Plant Extracts in Modulating Tumour Biology [https://pmc.ncbi.nlm.nih.gov/articles/PMC12294938/]
- 75. Research progress on natural plant metabolites targeting ... [https://pmc.ncbi.nlm.nih.gov/articles/PMC12283756/]
- 76. Natural Products Targeting the Mitochondria in Cancers [https://www.mdpi.com/1420-3049/26/1/92]
- 77. Natural anticancer agents: prospection of medicinal and ... [https://link.springer.com/article/10.1007/s13659-025-00511-0]
- 78. Physiological Modulation of Cancer Stem Cells by Natural ... [https://www.sciencedirect.com/science/article/pii/S2950199725003039]
- 79. Terpenes: natural compounds found in plants as potential ... [https://stemcellres.biomedcentral.com/articles/10.1186/s13287-025-04310-9]
- 80. Control of mitochondrial apoptosis by the Bcl-2 family - PMC [https://pmc.ncbi.nlm.nih.gov/articles/PMC2714431/]
- 81. Cytochrome c Release and Mitochondria Involvement in ... [https://pmc.ncbi.nlm.nih.gov/articles/PMC117928/]
- 82. Small-Molecule SMAC Mimetics as New Cancer Therapeutics [https://pmc.ncbi.nlm.nih.gov/articles/PMC4247261/]
- 83. Bcl-2 Inhibitors: Targeting Mitochondrial Apoptotic ... [https://pmc.ncbi.nlm.nih.gov/articles/PMC3182268/]
- 84. Smac, a mitochondrial protein that promotes cytochrome c ... [https://pubmed.ncbi.nlm.nih.gov/10929711/]
- 85. Smac mimetics increase cancer cell response to ... [https://www.nature.com/articles/cdd201044]
- 86. Current Advances and Future Strategies for BCL-2 Inhibitors [https://pmc.ncbi.nlm.nih.gov/articles/PMC10605442/]
- 87. A new era in cancer therapy: targeting the Proteasome-Bcl ... [https://jeccr.biomedcentral.com/articles/10.1186/s13046-025-03505-5]
- 88. Prospective biomarker study in newly diagnosed glioblastoma [https://pmc.ncbi.nlm.nih.gov/articles/PMC8788017/]
- 89. Extracellular vesicle-enriched secretome of adipose-derived ... [https://biologydirect.biomedcentral.com/articles/10.1186/s13062-025-00664-5]
- 90. Mitochondrial outer membrane permeabilization: a focus on ... [https://pmc.ncbi.nlm.nih.gov/articles/PMC5578938/]
- 91. Permeabilization of the outer mitochondrial membrane [https://www.sciencedirect.com/science/article/pii/S0925443924003107]
- 92. Identity, structure, and function of the mitochondrial ... [https://www.nature.com/articles/s41418-023-01187-0]
- 93. Advancement in analytical techniques fabricated for the ... [https://www.sciencedirect.com/science/article/abs/pii/S1359511322003440]
- 94. Fast and quantitative mitophagy assessment by flow ... [https://pmc.ncbi.nlm.nih.gov/articles/PMC11422238/]
- 95. Autophagy capacity and sub-mitochondrial heterogeneity ... [https://pmc.ncbi.nlm.nih.gov/articles/PMC4528699/]
- 96. Single cell functional genomics reveals the importance of ... [https://elifesciences.org/articles/38904]
- 97. Single-cell mitochondrial morphomics reveals cellular ... [https://www.nature.com/articles/s41598-025-99972-z]
- 98. Filtering cells with high mitochondrial content depletes viable ... [https://genomebiology.biomedcentral.com/articles/10.1186/s13059-025-03559-w]
- 99. Cytochrome C Maintains Mitochondrial Transmembrane ... [https://pmc.ncbi.nlm.nih.gov/articles/PMC2169468/]
- 100. Multiple entanglements of different cell death pathways, in ... [https://pmc.ncbi.nlm.nih.gov/articles/PMC12644007/]
- 101. Assessing mitochondrial outer membrane permeabilization ... [https://www.sciencedirect.com/science/article/abs/pii/S1046202308002041]
- 102. Caspase-8 and BID Caught in the Act with Cardiolipin [https://pmc.ncbi.nlm.nih.gov/articles/PMC12609577/]
- 103. Multiple entanglements of different cell death pathways, in ... [https://www.frontiersin.org/journals/cell-and-developmental-biology/articles/10.3389/fcell.2025.1667611/full]
- 104. Cytosolic cytochrome c represses ferroptosis [https://www.sciencedirect.com/science/article/abs/pii/S1550413125001494]
- 105. Article Multiple Mechanisms Modulate Distinct Cellular ... [https://www.sciencedirect.com/science/article/pii/S1534580714003098]
- 106. Where Killers Meet—Permeabilization of the Outer ... [https://pmc.ncbi.nlm.nih.gov/articles/PMC3579396/]
- 107. Mitochondrial orchestration of PANoptosis: mechanisms, ... [https://www.nature.com/articles/s41420-025-02750-z]
- 108. A quantitative real-time approach for discriminating ... [https://www.nature.com/articles/cddiscovery2016101]
- 109. The Quantitative-Phase Dynamics of Apoptosis and Lytic ... [https://pmc.ncbi.nlm.nih.gov/articles/PMC6994697/]
- 110. Intrinsic and Extrinsic Pathways of Apoptosis [https://www.thermofisher.com/us/en/home/life-science/antibodies/antibodies-learning-center/antibodies-resource-library/cell-signaling-pathways/cellular-apoptosis-pathway.html]
- 111. The mitochondrial death pathway: a promising therapeutic ... [https://pmc.ncbi.nlm.nih.gov/articles/PMC4496101/]
- 112. The BH3 mimetic ABT-737 targets selective Bcl-2 proteins and ... [https://pmc.ncbi.nlm.nih.gov/articles/PMC2953559/]
- 113. Mechanisms of apoptosis sensitivity and resistance to the ... [https://www.sciencedirect.com/science/article/pii/S1535610806003138]
- 114. Photothermal-triggered non-apoptotic regulated cell death ... [https://pmc.ncbi.nlm.nih.gov/articles/PMC12639629/]
- 115. Photothermal treatment-based heat stress regulates ... [https://www.nature.com/articles/s41598-024-69074-3]
- 116. Recent advances in reductive gas-augmented cancer ... [https://www.sciencedirect.com/science/article/abs/pii/S1385894725117166]
- 117. Regulation of apoptosis in health and disease - PubMed Central [https://pmc.ncbi.nlm.nih.gov/articles/PMC7325303/]
- 118. Emerging biomarkers and potential therapeutics of the BCL-2 ... [https://jmhg.springeropen.com/articles/10.1186/s43042-024-00485-7]
- 119. Harnessing PUMA's lethal potential: BCL-2 family ... [https://www.sciencedirect.com/science/article/pii/S246829422500111X]
- 120. Cytochrome c Release Assays for Bcl-2 Family Proteins [https://www.rndsystems.com/resources/technical/cytochrome-c-release-assays-bcl-2-family-proteins]
- 121. Quantitative analysis of pathways controlling extrinsic ... [https://pmc.ncbi.nlm.nih.gov/articles/PMC2858979/]
- 122. Quantifying requirements for mitochondrial apoptosis in ... [https://www.nature.com/articles/s41419-023-05727-x]
- 123. Rapid spectrophotometric method for quantitation of ... [https://www.sciencedirect.com/science/article/pii/S0005272800000980]
- 124. Rapid Spectrophotometric Method for Quantitation ... [https://pubmed.ncbi.nlm.nih.gov/10773162/]
- 125. A new way of measuring apoptosis by absolute quantitation of ... [https://pmc.ncbi.nlm.nih.gov/articles/PMC3424536/]
- 126. Detection of apoptosis : A review of conventional and novel... [https://pubs.rsc.org/en/content/articlehtml/2010/ay/c0ay00247j]
- 127. Apoptotic Factors Are Evolutionarily Conserved Since ... [https://pmc.ncbi.nlm.nih.gov/articles/PMC10565124/]
- 128. Functional conservation of the apoptotic machinery from ... [https://pmc.ncbi.nlm.nih.gov/articles/PMC4715348/]
- 129. Cytochrome c release from mitochondria proceeds by a two ... [https://pmc.ncbi.nlm.nih.gov/articles/PMC122177/]
- 130. Release of mitochondrial cytochrome c and activation of ... [https://www.sciencedirect.com/science/article/pii/S092544390100062X]
- 131. “Villains” Turning Good: Antimycin A and Rotenone, Mitochondrial ... [https://pmc.ncbi.nlm.nih.gov/articles/PMC11942121/]
- 132. The modulation of Smac/DIABLO on mitochondrial ... [https://www.sciencedirect.com/science/article/abs/pii/S1050464818306685]
- 133. Apoptosis-inducing factor (AIF) at the crossroad of cell survival ... [https://biosignaling.biomedcentral.com/articles/10.1186/s12964-025-02272-2]
- 134. Apoptosis-associated release of Smac/DIABLO from ... [https://pmc.ncbi.nlm.nih.gov/articles/PMC125329/]
- 135. Shedding light on mitochondrial outer-membrane ... [https://www.sciencedirect.com/science/article/pii/S1084952123001416]
- 136. Principles of early drug discovery - PMC - PubMed Central [https://pmc.ncbi.nlm.nih.gov/articles/PMC3058157/]
- 137. Improving target assessment in biomedical research [https://www.nature.com/articles/s41573-020-0087-3]
- 138. Assays for Cytochrome c Release from Mitochondria ... [https://www.sciencedirect.com/science/article/abs/pii/S0076687900220247]
- 139. Cytochrome c-mediated mitochondrial apoptosis activation ... [https://pubmed.ncbi.nlm.nih.gov/40683485/]
- 140. TRIM59 suppresses mitochondrial-associated apoptosis to ... [https://www.nature.com/articles/s41419-025-07913-5]
- 141. Identification and experimental validation of prognostic ... [https://www.frontiersin.org/journals/genetics/articles/10.3389/fgene.2025.1627134/full]
- 142. Mitochondria in oxidative stress, inflammation and aging [https://www.nature.com/articles/s41392-025-02253-4]
- 143. Comprehensive landscape of cell death mechanisms [https://www.frontiersin.org/journals/cell-and-developmental-biology/articles/10.3389/fcell.2025.1611055/full]
- 144. Special Issue “Mitochondrial Metabolism Alterations in ... [https://www.mdpi.com/1422-0067/26/10/4826]
- 145. An inflammation-associated lncRNA induces neuronal ... [https://pmc.ncbi.nlm.nih.gov/articles/PMC12023888/]
- 146. Immune evasion through mitochondrial transfer in the ... [https://www.nature.com/articles/s41586-024-08439-0]
- 147. 25-Hydroxycholesterol Induces Intrinsic Apoptosis via ... [https://pmc.ncbi.nlm.nih.gov/articles/PMC12386542/]
- 148. Mitochondrial quality control in neurodegenerative diseases [https://pmc.ncbi.nlm.nih.gov/articles/PMC12571580/]
- 149. Mitochondrial dysfunction in Alzheimer's disease [https://www.sciencedirect.com/science/article/pii/S1568163725000595]
- 150. Targeting the redox-programmed cell death axis in breast ... [https://www.nature.com/articles/s41420-025-02743-y]
- 151. Advances in novel cell death mechanisms in breast cancer [https://molecular-cancer.biomedcentral.com/articles/10.1186/s12943-025-02445-0]
- 152. Intrinsic Apoptosis - an overview [https://www.sciencedirect.com/topics/biochemistry-genetics-and-molecular-biology/intrinsic-apoptosis]
- 153. Regulation of the Intrinsic Apoptosis Pathway by Reactive ... [https://pmc.ncbi.nlm.nih.gov/articles/PMC3717204/]
- 154. structural and molecular mechanisms and functions in cell ... [https://www.nature.com/articles/s41421-025-00791-3]
- 155. The Canonical Intrinsic Mitochondrial Death Pathway Has ... [https://www.sciencedirect.com/science/article/pii/S0021925820691608]
- 156. Quantifying Cytosolic Cytochrome c Concentration Using ... [https://pmc.ncbi.nlm.nih.gov/articles/PMC8537359/]
- 157. Mechanisms of Cell Death: Apoptosis - CST Blog [https://blog.cellsignal.com/mechanisms-of-cell-death-apoptosis]