Resolving Inconsistent Cytochrome c Release Data: A Troubleshooting Guide for Apoptosis Researchers
This article provides a comprehensive framework for researchers and drug development professionals grappling with the challenge of inconsistent cytochrome c release measurements, a critical step in assessing mitochondrial apoptosis.
Resolving Inconsistent Cytochrome c Release Data: A Troubleshooting Guide for Apoptosis Researchers
Abstract
This article provides a comprehensive framework for researchers and drug development professionals grappling with the challenge of inconsistent cytochrome c release measurements, a critical step in assessing mitochondrial apoptosis. It explores the fundamental biological and chemical variables that govern cytochrome c release and detection, details advanced methodological approaches, offers a systematic troubleshooting protocol for common experimental pitfalls, and presents rigorous validation techniques. By synthesizing foundational knowledge with practical optimization strategies, this guide aims to enhance the reliability, reproducibility, and interpretation of cytochrome c release data in both basic research and preclinical drug efficacy studies.
Understanding the Core Biology: What Governs Cytochrome c Release?
Foundational Concepts: Cytochrome c in Life and Death Decisions
What is the primary function of cytochrome c in healthy cells?
In viable, healthy cells, cytochrome c is an essential electron carrier protein located in the intermembrane space of mitochondria. Its primary and vital role is as a component of the mitochondrial respiratory chain, where it shuttles electrons between Complex III (cytochrome bc1 complex) and Complex IV (cytochrome c oxidase). This electron transfer is a critical step in the process of oxidative phosphorylation, which ultimately leads to the production of adenosine triphosphate (ATP), the main energy currency of the cell.
How does cytochrome c transition from a life-sustaining to a death-signaling molecule?
The transition is triggered by mitochondrial membrane permeabilization. In response to various cellular stresses (e.g., DNA damage, oxidative stress), the mitochondrial outer membrane can become permeable. This allows cytochrome c to escape from the mitochondrial intermembrane space into the cytosol. Once in the cytosol, cytochrome c takes on a completely different role. It binds to Apoptotic Protease-Activating Factor-1 (Apaf-1) and, in the presence of dATP/ATP, forms a complex called the apoptosome. The apoptosome then recruits and activates caspase-9, which in turn activates downstream executioner caspases, initiating a cascade that leads to apoptotic cell death [1] [2].
Can cytochrome c release occur without triggering immediate cell death?
Yes, recent research has revealed a more nuanced role. Sublethal cytochrome c release can occur, where the release is insufficient to trigger full-blown apoptosis. This sublethal release can activate different signaling pathways, such as the Integrated Stress Response (ISR) via the kinase HRI and subsequent synthesis of the transcription factor ATF4. This can generate drug-tolerant persister cells, which survive treatment and can contribute to cancer therapy resistance and metastatic potential [3].
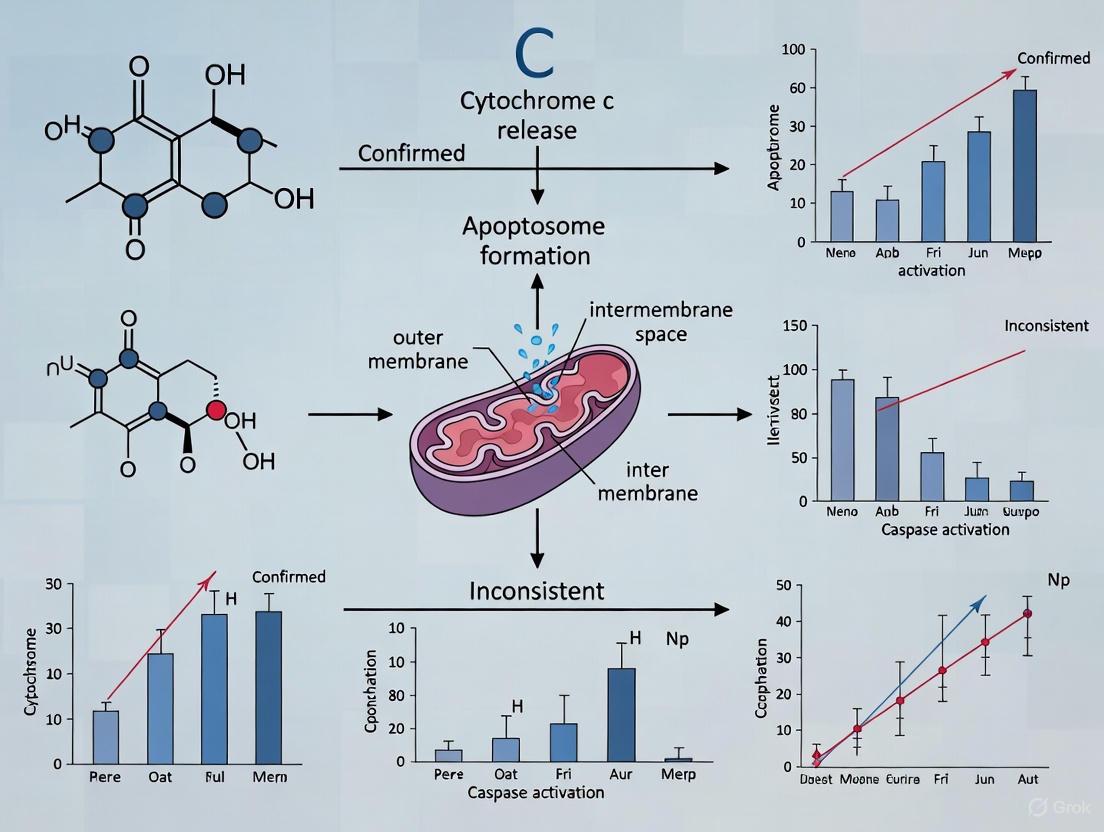
The following diagram illustrates the dual role of cytochrome c and the key regulatory checkpoint:
Methodologies and Measurement Techniques
What are the primary methods for detecting cytochrome c release?
Several techniques are commonly used, each with advantages and limitations. The table below summarizes the key methods for researchers.
| Method | Key Principle | Key Advantages | Key Limitations/Sample Requirements |
|---|---|---|---|
| Electrochemiluminescence Immunoassay (ECL) [4] | Detection of cytochrome c using capture/detection antibodies and an electrochemiluminescent readout. | High sensitivity (2-1200 ng/mL range), high reproducibility (inter-assay CV <6%), broad dynamic range. | Requires specialized equipment (MSD imager). |
| Flow Cytometry [5] | Selective plasma membrane permeabilization allows immunodetection of mitochondrial cytochrome c in single cells. | Rapid, quantitative, single-cell resolution, high-throughput capability. | Requires optimization of permeabilization conditions. |
| Western Blotting [1] | Separation of cytosolic and mitochondrial fractions via electrophoresis, followed by immunodetection. | Widely accessible, semi-quantitative, allows confirmation of protein size. | Semi-quantitative, time-consuming, lower throughput, requires larger cell numbers. |
| High-Content Screening (Dye Drop) [6] | Multiplexed, high-throughput immunofluorescence imaging using sequential density displacement for minimal cell loss. | High-content, single-cell resolution, multiplexed, highly reproducible. | Complex setup, requires specialized equipment and analysis pipelines. |
Detailed Protocol: Immunodetection of Cytochrome c by Flow Cytometry [5]
This protocol is ideal for rapid, quantitative analysis of cytochrome c release in a large number of cells.
- 1. Induction of Apoptosis: Treat cells (e.g., HL-60, thymocytes) with your apoptotic stimulus (e.g., staurosporine, dexamethasone).
- 2. Selective Permeabilization: Harvest cells and wash. Incubate cell pellets with a low concentration of digitonin (e.g., 0.005% in a sucrose-based buffer) for a few minutes on ice. This selectively permeabilizes the plasma membrane while leaving mitochondrial membranes intact.
- 3. Washout of Cytosolic Cytochrome c: Centrifuge the cells. The cytosolic fraction, containing any released cytochrome c, will be in the supernatant. The pellet contains mitochondria with retained cytochrome c.
- 4. Fixation and Staining: Fix the cell pellet with paraformaldehyde. Then, permeabilize the cells thoroughly (e.g., with Triton X-100) to allow antibody access to the mitochondria. Incubate with an anti-cytochrome c primary antibody, followed by a fluorescently-labeled secondary antibody.
- 5. Flow Cytometry Analysis: Analyze the cells by flow cytometry. Cells that have retained cytochrome c will show high fluorescence intensity, while cells that have released their cytochrome c will appear as a population with low fluorescence intensity.
Detailed Protocol: Plasma Cytochrome c Measurement via ECL Immunoassay [4]
This protocol is suitable for highly sensitive and reproducible measurement of cytochrome c in plasma or serum.
- 1. Plate Coating: Coat a 96-well MSD plate with a capture antibody specific for cytochrome c overnight.
- 2. Blocking: Block the plate with a blocking agent (e.g., Blocker A, BSA) to prevent non-specific binding.
- 3. Sample and Standard Incubation: Add plasma samples or cytochrome c standards to the wells and incubate to allow the antigen to bind to the capture antibody.
- 4. Detection Antibody Incubation: Add a biotinylated detection antibody specific for cytochrome c.
- 5. Signal Amplification: Add a streptavidin-conjugated sulfo-tag reagent.
- 6. Reading: Add MSD Read Buffer and place the plate in the MSD Imager. The instrument applies an electrical stimulus, and the emitted light from the sulfo-tag is measured, providing a quantitative readout of cytochrome c levels.
Troubleshooting Guide: Resolving Inconsistent Measurements
Inconsistent results in cytochrome c release assays are a common challenge. The table below outlines frequent problems and their solutions, framed within the context of a thesis on troubleshooting this very issue.
| Problem Phenomenon | Potential Root Cause | Recommended Solution | Thesis Context & Rationale |
|---|---|---|---|
| Weak or No Signal | Antibody degradation or suboptimal concentration [7]. | Titrate antibodies; ensure proper storage; use fresh aliquots. | Validates the critical need for reagent optimization as a primary confounder in reproducible quantification. |
| Loss of epitope due to fixation [7]. | Optimize fixation protocol (e.g., avoid prolonged fixation >15 min, use 1% PFA). | Highlights how sample preparation artifacts can mask true biological phenomena. | |
| Transient, short pore openings not leading to full commitment to death [8] [9]. | Correlate with other death markers (e.g., TMRM for depolarization); extend stressor exposure time. | Directly investigates the core hypothesis that pore open duration is a key variable causing measurement inconsistency. | |
| High Background/ Non-specific Staining | Inadequate washing or blocking [7]. | Include Fc receptor blocking step; increase number/frequency of washes; optimize blocking buffer. | Emphasizes the need for standardized protocols to reduce noise, a key factor in data reliability. |
| Presence of dead cells and debris [7]. | Include a viability dye (e.g., PI, 7-AAD) to gate out dead cells during flow analysis. | Proposes that pre-analytical sample quality is a major source of inter-experimental variance. | |
| High Variability Between Replicates | Uneven cell loss during washing steps, especially of dying cells [6]. | Adopt gentle wash methods like the Dye Drop technique that uses density displacement. | Introduces a novel methodological improvement to mitigate technical variability in sample processing. |
| Inconsistent instrument settings (PMT voltage, compensation) [7]. | Use standardized instrument settings and calibration beads; run controls with every experiment. | Underscores instrument calibration as a foundational element for a reproducible thesis dataset. | |
| Signal Inconsistency with Cell Death Readouts | Sublethal cytochrome c release [3]. | Measure downstream events (caspase-3 activation) and persister cell markers (ATF4) in parallel. | Expands the thesis scope beyond full apoptosis, exploring sublethal signaling as a source of "inconsistency". |
The Scientist's Toolkit: Key Research Reagent Solutions
| Reagent / Kit | Primary Function in Cytochrome c Research | Key Features / Applications |
|---|---|---|
| Digitonin [5] | Selective permeabilization of the plasma membrane. | Enables specific immunostaining of mitochondrial cytochrome c by washing out the cytosolic fraction for flow cytometry. |
| Cyclosporin A (CsA) [8] [2] [9] | Inhibitor of cyclophilin D (CypD). | A key pharmacological tool to inhibit the mitochondrial permeability transition pore (mPTP), thereby preventing cytochrome c release. |
| Tetramethylrhodamine Methyl Ester (TMRM) [8] [9] | Fluorescent dye for measuring mitochondrial membrane potential (ΔΨm). | Used to correlate cytochrome c release with mitochondrial depolarization, a key event in apoptosis. |
| ZVAD-fmk [1] | Pan-caspase inhibitor. | Used to distinguish caspase-dependent apoptosis from other forms of cell death and to study caspase-independent effects of cytochrome c release. |
| Meso Scale Discovery (MSD) ECL Plates [4] | Platform for high-sensitivity immunoassays. | Used for developing highly sensitive and reproducible electrochemiluminescence assays for quantifying plasma cytochrome c. |
| Apoptosis Antibody Array Kits [10] | Multiplexed detection of apoptosis-related proteins. | Allows screening for cytochrome c and dozens of other apoptotic markers simultaneously to place its release in a broader signaling context. |
Advanced Research FAQs
What is the precise molecular identity of the pore that releases cytochrome c?
The exact molecular composition of the pore responsible for mitochondrial outer membrane permeabilization has been intensely debated. Strong evidence implicates the Bcl-2 family proteins Bax/Bak in forming the pores for the intrinsic apoptosis pathway. Additionally, the mitochondrial permeability transition pore (mPTP), a non-selective channel in the inner membrane, can cause swelling and outer membrane rupture, leading to cytochrome c release. The molecular identity of the mPTP is still being defined, with recent research pointing to components of the mitochondrial F-ATP synthase and the adenine nucleotide translocase (ANT) as critical players [2]. The interplay between these different permeabilization mechanisms is an area of active research.
How can I distinguish between cytochrome c release via mPTP versus MOMP?
The duration of pore opening and specific inhibitors can help differentiate the mechanisms. Sustained mPTP opening leads to mitochondrial depolarization (measurable with TMRM) and is inhibited by Cyclosporin A (CsA). mPTP is often associated with necrotic cell death but can also promote apoptosis. In contrast, Mitochondrial Outer Membrane Permeabilization (MOMP), governed by Bax/Bak, is a committed step in the intrinsic apoptotic pathway. It can occur without immediate full depolarization and is not inhibited by CsA. Measuring multiple parameters—cytochrome c release, membrane potential, and caspase activation—in the presence and absence of CsA can help delineate the primary pathway [8] [2] [9].
Why do I detect cytochrome c in the cytosol, but my cells are not dying?
This observation is consistent with the phenomenon of sublethal cytochrome c release [3]. In this scenario, the amount of cytochrome c released, or the duration of the release signal, may be insufficient to fully activate the apoptotic caspase cascade. Instead, the cytosolic cytochrome c can activate non-apoptotic pathways, such as the Integrated Stress Response (ISR), leading to transcription factor ATF4 synthesis. This can promote survival, cellular adaptation, and a drug-tolerant persister state, which is highly relevant in cancer biology and therapy resistance.
Frequently Asked Questions (FAQs)
Q1: What are the core proteins in the BCL-2 family and their primary roles in apoptosis? The BCL-2 protein family is the fundamental regulator of intrinsic apoptosis, primarily controlling mitochondrial outer membrane permeabilization (MOMP), which leads to the release of cytochrome c. The family is divided into three functional groups [11] [12] [13]:
- Anti-apoptotic proteins (e.g., BCL-2, BCL-xL, MCL-1): They preserve mitochondrial integrity by binding and inhibiting pro-apoptotic members. They typically contain four BH domains (BH1-BH4) that form a hydrophobic groove, which is the critical binding site for their function [13].
- Pro-apoptotic effector proteins (e.g., BAX, BAK): These are multi-domain proteins that, when activated, form pores in the mitochondrial outer membrane, directly mediating the release of cytochrome c [12] [14].
- BH3-only proteins (e.g., BIM, tBID, PUMA, BAD): These proteins act as sensors of cellular stress. They promote apoptosis by either activating BAX/BAK directly or by neutralizing the anti-apoptotic proteins [11] [13].
Q2: My measurements of cytochrome c release are inconsistent. What could be the primary biological reasons for this variability? Inconsistent cytochrome c release can stem from the complex and dynamic nature of the BCL-2 family protein interactions. Key factors include [11] [15] [16]:
- Variable Expression of BCL-2 Family Proteins: The relative ratios of pro- and anti-apoptotic proteins create a rheostat that determines cellular commitment to death. Small changes in the expression levels of proteins like MCL-1 or BCL-xL can significantly alter the threshold for MOMP [11].
- Non-canonical Functions of Proteins: Some BCL-2 family proteins have roles beyond direct apoptosis regulation, such as in mitochondrial dynamics, autophagy, and calcium signaling, which can indirectly influence cytochrome c release kinetics [11].
- Direct Pore Formation by tBID: Recent evidence shows that tBID can induce cytochrome c release independently of BAX and BAK under specific conditions, a pathway that depends on its helix 6. This BAX/BAK-independent pathway may be active in your system, especially if they are absent or inactive [15].
- Interplay between BAX and BAK: BAX and BAK have distinct oligomerization kinetics and co-assemble into apoptotic pores. Their relative availability and interaction dynamically control the growth rate of mitochondrial pores, directly impacting the kinetics and extent of cytochrome c release [16].
Q3: Are there alternative mechanisms for cytochrome c release beyond direct Bax/Bak pore formation? Yes, research indicates at least two other potential mechanisms:
- Direct Action of tBID: As mentioned, tBID can function in a BAX/BAK-like manner to permeabilize the mitochondrial membrane. This activity requires its α-helix 6 and can be blocked by anti-apoptotic BCL-2 proteins. This pathway is physiologically relevant in contexts like anti-bacterial immunity and killing venetoclax-resistant leukemia cells [15].
- Regulation of VDAC: Early studies suggested that pro-apoptotic Bax and Bak can accelerate the opening of the mitochondrial voltage-dependent anion channel (VDAC), while Bcl-xL can close it. This regulation could facilitate cytochrome c passage, though this mechanism is distinct from the direct pore formation by Bax/Bak oligomers [17].
Troubleshooting Guide: Inconsistent Cytochrome c Release
This guide addresses common experimental issues leading to variable cytochrome c release data.
| Problem Description | Possible Causes | Recommended Solutions |
|---|---|---|
| High variability in release kinetics between experimental replicates | 1. Fluctuating expression levels of anti-apoptotic proteins (e.g., MCL-1, BCL-xL).2. Heterogeneous cellular states (e.g., cell cycle, metabolism).3. Inconsistent activation of BAX/BAK, which co-assemble with variable kinetics [16]. | 1. Pre-profile protein levels via Western blot across replicates.2. Synchronize cells if possible and ensure consistent culture conditions.3. Use BH3 profiling to assess mitochondrial priming and functional protein balance. |
| Unexpected cytochrome c release in BAX/BAK deficient cells | 1. Effector-like activity of tBID via its helix 6, acting independently of BAX/BAK [15].2. Non-apoptotic mitochondrial membrane disruption. | 1. Genetically or chemically inhibit tBID (e.g., mutating helix 6) to confirm its role.2. Use caspase inhibitors and cell death markers to confirm apoptotic death. |
| Weak or no cytochrome c signal in assays | 1. Inefficient cell permeabilization for antibody access.2. Sub-optimal antibody affinity or concentration.3. Loss of cytochrome c due to rapid cell death and membrane rupture. | 1. Optimize permeabilization protocol (e.g., concentration/duration of detergents like saponin or Triton X-100) [18] [19].2. Titrate the cytochrome c antibody; use a bright fluorochrome (e.g., PE) for flow cytometry [19].3. Include a positive control (e.g., cells treated with a potent BH3-mimetic like ABT-737) and fix cells promptly after induction. |
| High background signal in control samples | 1. Presence of dead cells which non-specifically bind antibodies.2. Inadequate blocking leading to non-specific antibody binding.3. Autofluorescence from cells or contaminants [18] [19]. | 1. Include a viability dye (e.g., PI, 7-AAD) to gate out dead cells during flow analysis [19].2. Optimize blocking with agents like BSA or normal serum; include an isotype control.3. Use an unstained control to set baselines; for highly autofluorescent cells, use red-shifted fluorochromes like APC [19]. |
Experimental Protocols & Data
Key Quantitative Data on Apoptotic Pores
The following table summarizes structural and functional data related to key apoptotic pores, based on in vitro and computational studies.
| Protein / Pore Type | Pore Diameter / Size | Key Structural Elements | Core Regulatory Mechanism |
|---|---|---|---|
| BAX Oligomeric Pore | Inner cavity ~48 Å [20] | Formed by oligomerization of BAX dimers with α3:α3' and α5:α5' interfaces; pore surface is hydrophilic and negatively charged [20]. | Activated by BH3-only proteins (e.g., tBID, BIM); inhibited by direct binding of anti-apoptotic proteins (e.g., BCL-xL) to the hydrophobic groove [11] [14]. |
| tBID (BAX/BAK-independent pore) | Not fully characterized | Function depends on α-helix 6, homologous to the pore-forming helix 5 of BAX/BAK [15]. | Induces MOMP independently of BAX/BAK; activity can be blocked by anti-apoptotic BCL-2 proteins [15]. |
| BAK Oligomer | Forms smaller structures than BAX [16] | Oligomerizes faster than BAX into lines, arcs, and rings [16]. | Recruits and co-assembles with BAX; the BAX/BAK ratio tunes pore growth kinetics and content release [16]. |
Essential Research Reagent Solutions
| Reagent / Tool | Primary Function in Research | Key Application Notes |
|---|---|---|
| ABT-737 / Venetoclax | Small-molecule BH3-mimetics that selectively inhibit BCL-2 and BCL-xL by occupying their hydrophobic groove [11] [13]. | Used to sensitize cells to apoptosis; Venetoclax is clinically approved. Ineffective against MCL-1 [11]. |
| Recombinant BAX Protein | Used in in vitro assays with isolated mitochondria to study direct cytochrome c release mechanisms [14]. | Submicromolar concentrations can induce cytochrome c release without triggering mitochondrial swelling [14]. |
| Recombinant BCL-xL Protein | Used as a direct inhibitor of BAX- and BAK-mediated cytochrome c release in in vitro systems [14]. | Abrogates BAX-induced cytochrome c release from isolated mitochondria [14]. |
| zVAD-fmk | A broad-spectrum caspase inhibitor [14]. | Used to distinguish upstream mitochondrial events (zVAD-insensitive) from downstream caspase-dependent amplification (zVAD-sensitive) [14]. |
Core Signaling Pathway
The following diagram illustrates the core intrinsic apoptosis pathway regulated by the BCL-2 family.
Experimental Workflow for Mechanistic Dissection
This workflow provides a methodology for determining the mechanism of cytochrome c release in a given experimental system.
Inconsistent cytochrome c (cyt c) release measurements present a significant challenge in apoptosis research, often leading to contradictory results and flawed experimental conclusions. A primary, yet frequently overlooked, source of this inconsistency is the ionic strength of the experimental buffer. Cyt c is a highly basic, peripheral membrane protein that localizes to the mitochondrial intermembrane space, where its binding to the inner mitochondrial membrane (IMM) is electrostatically regulated. Its interaction with the IMM, rich in the anionic phospholipid cardiolipin (CL), is governed by a delicate balance of electrostatic attraction and hydrophobic forces [21]. This technical support article provides a targeted troubleshooting guide to help researchers identify, understand, and resolve the confounding effects of ionic strength in their cyt c binding and release assays.
Key Concepts: The Science of Ionic Regulation
The Molecular Basis of Electrostatic Binding
Cyt c binding to membranes is not a simple process. Research indicates the existence of distinct binding sites on the protein surface (A-site and C-site) that interact with CL [21]. The A-site involves electrostatic interactions with deprotonated CL, while the C-site is stabilized by a combination of hydrogen bonding and electrostatic contacts [21]. Furthermore, it is hypothesized that cyt c can adopt an "extended lipid conformation," where one acyl chain of CL is pulled out of the bilayer and accommodated in a hydrophobic crevice of the protein, a state that may facilitate its release during apoptosis [21].
How Ionic Strength Modulates Interactions
Ionic strength directly impacts the electrostatic component of cyt c membrane binding. The dissolved ions in the buffer, particularly salts like NaCl, create a shielding effect that screens the attractive forces between the positively charged residues on cyt c and the negatively charged phosphate groups of CL [21] [22]. As ionic strength increases:
- The electrostatic attraction is weakened.
- The binding affinity of cyt c for the membrane decreases.
- The associated conformational changes in both the protein and the lipid membrane are altered.
The effect of ionic strength is cooperative, meaning small changes can trigger significant and sometimes abrupt transitions in binding behavior and protein conformation [22] [23].
Troubleshooting Guide: Common Problems and Solutions
Inconsistent Cyt c Release Assays
| Problem Description | Root Cause | Solution |
|---|---|---|
| Variable cyt c release across experimental replicates. | Uncontrolled or varying salt concentrations in isolation or assay buffers. | Standardize buffer recipes precisely. Use high-purity salts and perform conductivity checks. |
| Incomplete or insufficient cyt c release from isolated mitochondria. | High ionic strength in the release buffer, preventing cyt c dissociation from CL. | Titrate the ionic strength (e.g., KCl concentration) to find the optimal release window (e.g., 40-100 mM). |
| Spontaneous cyt c release in control samples. | Excessively low ionic strength causing non-physiological disruption of membrane binding. | Include an ionic strength control (e.g., 150 mM KCl) to establish a baseline and ensure release is specific to the apoptotic trigger. |
Atypical Protein-Lipid Complex Formation
| Problem Description | Root Cause | Solution |
|---|---|---|
| Inability to reproduce cyt c-induced lipid domain formation. | Incorrect CL-to-PC ratio or non-physiological ionic strength failing to trigger lipid segregation. | Systematically vary the CL content (e.g., 2.5-20 mol%) and ionic strength to map the conditions that promote domain formation [21]. |
| Unexpected precipitation or aggregation in binding assays. | Cyt c undergoing conformational changes (e.g., to a molten globule state) at low pH and specific ionic strengths, leading to non-specific aggregation [22]. | Maintain pH at neutral levels (pH 7.4) and avoid low-pH, low-salt conditions that favor unfolding. |
Frequently Asked Questions (FAQs)
Q1: Why does my buffer's salt concentration affect cyt c release, if the release is governed by pore formation in the outer membrane? The permeability transition pore (PTP) can facilitate cyt c release, but cyt c must first dissociate from the inner membrane. Even with PTP opening, high ionic strength can inhibit the initial detachment of cyt c from CL, thereby blocking release. Studies show that the duration of PTP openings correlated with cyt c release and cell death, highlighting that dissociation from the membrane is a critical step [9].
Q2: I'm studying the apoptosome formation in cytosolic extracts. Could ionic strength be affecting my results downstream of cyt c release? Absolutely. Physiological concentrations of K+ (~150 mM) are known to directly inhibit the formation of the Apaf-1/caspase-9 apoptosome complex, even in the presence of released cyt c and dATP [24]. The efflux of intracellular K+ is a prerequisite for apoptosome assembly. Therefore, the ionic composition of your cytosolic extract assay buffer is critical for observing downstream caspase activation.
Q3: How can I accurately determine the binding constant of cyt c to lipid membranes without interference from ionic strength? You cannot eliminate the effect, but you can characterize it. Techniques like Pressure-Assisted Capillary Electrophoresis Frontal Analysis (PACE-FA) are excellent for studying these interactions in free solution without immobilization, allowing you to determine binding constants under different, controlled ionic strength conditions [25]. The key is to report the binding constant with the exact buffer composition used.
Q4: Are there any specific cations I should be cautious of, besides K+ and Na+? Yes, divalent cations like Ca2+ can have profound effects. Ca2+ is a known inducer of the mitochondrial permeability transition and can also directly block apoptosome formation by preventing nucleotide exchange in Apaf-1 [24]. Always account for and control the concentration of divalent cations in your experiments.
Essential Experimental Protocols
Protocol: Determining the Ionic Strength Optimum for Cyt c Release from Isolated Mitochondria
This protocol is designed to systematically troubleshoot the effect of ionic strength on cyt c release.
- Mitochondria Isolation: Isolate intact mitochondria from rat liver or a relevant cell line using standard differential centrifugation in an isotonic buffer (e.g., 250 mM sucrose, 10 mM HEPES, pH 7.4).
- Buffer Preparation: Prepare a series of release buffers with identical pH (e.g., 20 mM HEPES, pH 7.4) and composition, but with varying concentrations of KCl (e.g., 0, 40, 80, 100, 150, 200 mM).
- Release Reaction: Incubate equal aliquots of mitochondria (e.g., 0.5 mg protein) in the different release buffers for a fixed time (e.g., 15 minutes) at 30°C. Include a positive control (e.g., buffer with 100 µM Ca2+).
- Separation and Detection: Pellet the mitochondria by high-speed centrifugation (13,000 x g, 10 min). Collect the supernatant (cytosolic fraction) and analyze the cyt c content via Western blotting or ELISA.
- Analysis: Plot the amount of cyt c released against the KCl concentration to identify the optimal and inhibitory ionic strength ranges for your system.
Protocol: Characterizing Cyt c-Lipid Binding Affinity via PACE-FA
This label-free method allows for accurate determination of binding constants under different ionic conditions [25].
- Sample Preparation: Prepare a pre-equilibrated mixture of cyt c and its DNA aptamer (e.g., Apt76) or lipid vesicles in the background electrolyte (BGE) of desired ionic strength (e.g., ammonium acetate buffer).
- Capillary Electrophoresis: Inject a nanoliter-scale sample into a neutrally coated capillary. Apply a separation voltage along with pressure assistance (PACE-FA) to decrease analysis time.
- Data Acquisition: The unbound aptamer or ligand migrates as a distinct plateau. The height of this plateau is proportional to the free ligand concentration.
- Data Analysis: Using the measured free ligand concentration at different initial concentrations, apply a nonlinear curve-fitting to obtain the binding constant (K) and stoichiometry. Repeat at different ionic strengths to build a comprehensive binding profile.
The Scientist's Toolkit: Key Research Reagents
Table 1: Essential Reagents for Investigating Cyt c Electrostatic Interactions.
| Reagent | Function/Description | Key Consideration for Electrostatic Studies |
|---|---|---|
| Cardiolipin (CL) | Key anionic phospholipid from the inner mitochondrial membrane; primary binding partner for cyt c [21]. | Use defined lipid compositions (e.g., PC/CL mixtures). The mol% of CL (e.g., 2.5 vs. 20%) dramatically affects outcomes [21]. |
| Potassium Chloride (KCl) | Used to precisely modulate ionic strength in buffers. | Preferred over NaCl for physiological relevance, as K+ is the major intracellular cation. Its efflux is a key apoptotic event [24]. |
| HEPES Buffer | A zwitterionic buffer for maintaining pH 7.0-7.4 without forming complexes with metal ions. | Avoid phosphate buffers if varying ionic strength, as the buffer's own ionic contribution will change with pH. |
| Cyclosporin A | Inhibitor of the permeability transition pore (PTP) [9]. | A critical control to distinguish between specific cyt c release and general membrane rupture due to PTP opening. |
| Cyt c-specific Aptamers (e.g., Apt76) | Single-stranded DNA molecules that bind cyt c with high specificity (Kd ~ µM range) [25]. | Useful as recognition elements in biosensors for detecting released cyt c. Their binding can also be characterized by PACE-FA. |
Visualizing the Signaling Pathway and Experimental Workflow
The diagram above illustrates how ionic strength and K+ concentration are critical regulatory checkpoints in the mitochondrial apoptosis pathway. High ionic strength can block the initiation of the pathway by preventing cyt c release, while high intracellular K+ can block its execution by inhibiting apoptosome formation.
This workflow provides a systematic approach to troubleshooting ionic strength effects by empirically determining the optimal salt concentration for cyt c release in a specific experimental setup.
Data Presentation: Quantitative Effects of Ionic Strength
Table 2: Experimentally Observed Effects of Ionic Strength and Lipid Composition on Cyt c-Membrane Interactions. Data synthesized from [21].
| Lipid Composition (PC:CL) | Ionic Strength (mM) | Observed Phenomenon | Biological Implication |
|---|---|---|---|
| 97.5:2.5 mol% (CL2.5) | 20 (Low) | Deviation from homogeneous lipid distribution; tendency for non-lamellar (HII) phase. | Membrane becomes primed for structural reorganization. |
| 95:5 mol% (CL5) | 40 (Medium) | Transformation from lamellar to hexagonal (HII) phase upon cyt c adsorption. | Favors cyt c release and amplification of apoptotic signal. |
| 80:20 mol% (CL20) | 40 (Medium) | Transition of CL into an "extended conformation" becomes favorable. | Stabilizes a cyt c conformation that may be primed for release from the membrane. |
| Various | ≥ 150 (High) | Significant shielding of electrostatic interactions; reduced cyt c binding affinity. | Can artificially inhibit cyt c release, leading to false negatives in apoptosis assays. |
Table 3: Impact of Ionic Strength on Cytochrome c Conformation and Surface Activity. Data synthesized from [22].
| pH Condition | Ionic Strength | Cyt c Conformational State | Surface Activity / Steady-State Surface Tension |
|---|---|---|---|
| Neutral (pH 7) | Low (e.g., 0-50 mM) | Native Globular State | Lower surface activity, higher steady-state surface tension. |
| Acidic (pH ~3.6) | High (e.g., ≥ 150 mM) | Molten Globule State | Higher surface activity, lower steady-state surface tension (cooperative transition). |
| Acidic (pH ~2.5) | Very Low | Unfolded State | High surface activity, extensive unfolding at interface. |
Cellular Redox State and Its Impact on Release Kinetics
Inconsistent measurement of cytochrome c release is a common challenge in apoptosis research. A critical, yet often overlooked, factor contributing to this variability is the dynamic cellular redox state. The redox environment governs not only the initiation of mitochondrial outer membrane permeabilization (MOMP) but also the biochemical behavior of cytochrome c itself after its release into the cytosol. This guide addresses the specific experimental issues arising from this interplay, providing targeted troubleshooting strategies to ensure reliable and reproducible data.
Troubleshooting Guides & FAQs
FAQ 1: Why are my measurements of released cytochrome c so inconsistent, even between technical replicates?
A: Inconsistency often stems from a failure to account for the rapid redox changes cytochrome c undergoes immediately after release. Cytochrome c is released from the mitochondrial intermembrane space in a partially oxidized state but becomes almost fully reduced within the cytosol [26]. This shift impacts its detection and function.
- Underlying Mechanism: The cytosol possesses a powerful reducing environment, maintained by systems like the thioredoxin and glutathione pathways, which rapidly reduce cytochrome c [27] [26]. The rate of this reduction can vary based on the metabolic state of the cell, leading to measurement inconsistencies.
- Primary Issue: If your assay is sensitive to the oxidation state of cytochrome c, differential reduction rates will cause variable signals.
FAQ 2: My data suggests only a fraction of cytochrome c is released, but my cell death readouts are robust. Is this a measurement error?
A: Not necessarily. This observation may be biologically accurate and reflects a key regulatory point. The permeability of the mitochondrial outer membrane after MOMP is extremely high, allowing cytochrome c to diffuse freely back into the mitochondria [26]. The cell may maintain a steady state where a small, but biologically active, fraction of cytochrome c in the cytosol is sufficient to drive apoptosome formation.
- Underlying Mechanism: A simple diffusion model can describe this, where the efflux of cytochrome c from the mitochondria is balanced by its influx from the cytosol [26]. The system can reach equilibrium without complete depletion of mitochondrial cytochrome c.
- Primary Issue: Assuming that 100% of cytochrome c must be released to fully activate apoptosis is a conceptual error. Measurements are tracking a dynamic equilibrium, not a one-way transfer.
FAQ 3: Could my apoptosis inducer itself be affecting the cellular redox state and confounding my results?
A: Yes, absolutely. Many stressors and chemotherapeutic agents directly influence the cellular redox environment. For example, agents that cause lysosomal photodamage can trigger the release of cathepsins, which subsequently cleave and activate the pro-apoptotic protein Bid, leading to cytochrome c release [28]. This pathway is distinct from inducers that directly target mitochondria and may involve different redox dynamics.
- Underlying Mechanism: Dysregulated redox signaling can disrupt insulated electron transfer pathways, a core principle of the "redox hypothesis" of cellular stress [27]. Different inducers disrupt different redox circuits.
- Primary Issue: Using a single measurement protocol for cytochrome c release across different classes of apoptosis inducers can yield non-comparable results.
The following tables consolidate key quantitative findings from the literature to aid in experimental design and data interpretation.
Table 1: Cytochrome c Oxidation State During MOMP Data obtained from visible spectroscopy measurements in HL-60 cells undergoing anisomycin-induced apoptosis [26].
| Compartment | Condition | Oxidation State | Key Finding |
|---|---|---|---|
| Mitochondria | Pre-MOMP | ~62% oxidized | Baseline state in the electron transport chain. |
| Mitochondria | Post-MOMP | ~70% oxidized | Becomes more oxidized upon release initiation. |
| Cytosol | Post-MOMP | Nearly fully reduced | Cytosolic reducing environment rapidly reduces cytochrome c. |
Table 2: Key Kinetic Parameters of Post-MOMP Dynamics Calculated values from diffusion modeling and respirometry in living cells [26].
| Parameter | Value | Experimental Implication |
|---|---|---|
| Outer Membrane Permeability | Very High | Cytochrome c release and back-diffusion are rapid. |
| Release Time Constant | < 1 second | The release process is too fast for manual sampling. Real-time methods are required for accurate kinetics. |
| Flux Equilibrium | Efflux ≈ Influx | Measurements reflect a dynamic steady-state, not total depletion. |
Experimental Protocols
Protocol 1: Real-Time Monitoring of Cytochrome c Oxidation State
This protocol uses visible spectroscopy to track the oxidation state of cytochrome c in living cells, crucial for capturing its rapid post-release reduction [26].
- Cell Preparation: Culture cells in phenol-red free RPMI medium. Harvest and resuspend at a high concentration (e.g., 2.0 × 10⁷ cells/mL) in a suitable buffer.
- Instrument Setup: Use a spectrophotometer with a stirred, temperature-controlled cuvette (37°C). An oxygen optode is recommended for simultaneous monitoring of oxygen consumption.
- Data Collection: Collect continuous attenuation spectra across the visible range (520-630 nm). The differential pathlength should be calibrated (e.g., using the water absorption band at 740 nm).
- Induction of Apoptosis: Introduce your apoptosis inducer (e.g., anisomycin) directly to the cuvette.
- Spectral Analysis: Fit the time-dependent spectral changes using a least-squares minimization against the known oxidized-reduced extinction spectra of cytochrome c and other relevant cytochromes. This quantifies oxidation changes in real-time.
Protocol 2: Validating Apoptotic Signaling Downstream of Cytochrome c Release
Confirm that released cytochrome c is functionally activating the apoptotic cascade, regardless of its oxidation state.
- Induction & Lysis: Treat cells with your apoptotic stimulus. At various time points, harvest cells and prepare cytosolic fractions (S-100) free of mitochondria.
- Western Blot Analysis: Probe the cytosolic fractions for:
- Cytochrome c: Confirms release.
- Cleaved Caspase-9: Indicates apoptosome formation.
- Cleaved Caspase-3: Confirms execution-phase apoptosis.
- Truncated Bid (tBid): If your inducer works via lysosomal disruption (e.g., NPe6-PDT), this is a key upstream signal [28].
- Activity Assay: Supplementally, use a fluorometric caspase-3/7 activity assay to quantitatively measure downstream apoptotic activation.
The Scientist's Toolkit: Research Reagent Solutions
Table 3: Essential Reagents for Investigating Redox-Dependent Cytochrome c Release
| Reagent / Tool | Function & Application in This Context |
|---|---|
| NPe6 (Lysosomal Sensitizer) | A photosensitizer used in photodynamic therapy research to induce lysosome-specific damage, triggering Bid-dependent cytochrome c release [28]. |
| Anisomycin | A protein synthesis inhibitor commonly used to induce MOMP and cytochrome c release in model systems like HL-60 cells [26]. |
| Redox Western Blotting | A technique to measure the redox state of specific proteins, such as Thioredoxin (Trx), which could be adapted to assess global cytosolic redox capacity [27]. |
| Visible Spectroscopy Setup | For real-time, continuous measurement of cytochrome oxidation states in living cells, essential for capturing rapid post-release kinetics [26]. |
| Caspase-3/9 Activity Assays | Fluorometric or colorimetric assays to confirm the functional consequence of cytochrome c release, independent of its oxidation state. |
| Antimycin A | An inhibitor of mitochondrial complex III used to experimentally manipulate the oxidation state of the mitochondrial cytochrome c pool [26]. |
Measuring the Signal: From Established Assays to Cutting-Edge Platforms
Western Blot (WB) Troubleshooting
Question: I am not detecting any signal for cytochrome c in my western blot. What could be wrong?
A lack of signal can stem from issues at various stages of the workflow, from sample preparation to detection. The table below outlines common causes and their solutions.
Table: Troubleshooting Low or No Signal in Western Blot
| Problem Area | Possible Cause | Recommended Solution |
|---|---|---|
| Sample & Protein | Low protein expression or degradation [29]. | Use a positive control (e.g., cells treated with a known apoptosis inducer). Add fresh protease inhibitors to lysis buffer [29] [30]. |
| Incomplete cell lysis (cytochrome c is mitochondrial) [29]. | Ensure complete lysis by using sonication (e.g., 3 x 10-second bursts on ice) or repeated passage through a fine-gauge needle [29]. | |
| Gel & Transfer | Inefficient transfer to membrane [30] [31]. | Verify transfer efficiency with Ponceau S staining. For low MW proteins like cytochrome c (~12 kDa), use a 0.2 µm pore size nitrocellulose membrane and optimize transfer time to prevent "blow-through" [29] [30]. |
| Antibodies & Detection | Antibody concentration too low or inactive [30] [31]. | Increase primary antibody concentration or incubation time. Use a fresh antibody aliquot and ensure proper storage to avoid freeze-thaw cycles [30] [31]. |
| HRP enzyme inhibition [30] [31]. | Do not use sodium azide in any buffers, as it inhibits HRP activity. Use fresh, uncontaminated ECL reagent [30] [31]. |
Question: My western blot shows high background. How can I improve the signal-to-noise ratio?
High background is often related to antibody specificity, blocking efficiency, and washing stringency.
Table: Troubleshooting High Background in Western Blot
| Problem Area | Possible Cause | Recommended Solution |
|---|---|---|
| Blocking & Antibodies | Incomplete or incompatible blocking [29] [30]. | Optimize blocking conditions; use 5% BSA or serum from the secondary antibody species. Avoid non-fat dry milk if detecting phospho-proteins or using a biotin-streptavidin system [29] [30] [31]. |
| Primary or secondary antibody concentration too high [30] [31]. | Titrate both primary and secondary antibodies to find the optimal dilution that minimizes background [30] [31]. | |
| Washing & Detection | Insufficient washing [30]. | Increase wash frequency and duration (e.g., 5 washes for 5 minutes each). Ensure Tween-20 is added to the wash buffer (0.1%) [29] [30]. |
| Over-exposure during detection [30]. | Reduce the exposure time to the chemiluminescent substrate [30]. |
Experimental Workflow: Western Blot for Cytochrome c Release
The following diagram outlines a standard workflow for detecting cytochrome c release during apoptosis, highlighting key decision points.
ELISA Troubleshooting
Question: The signal in my ELISA is too weak, or I have no signal at all. What should I check?
Weak or absent signal in ELISA often results from improper reagent handling or protocol deviations.
Table: Troubleshooting Weak or No Signal in ELISA
| Problem Area | Possible Cause | Recommended Solution |
|---|---|---|
| Reagent Handling | Reagents not at room temperature [32]. | Allow all reagents to equilibrate at room temperature for 15-20 minutes before starting the assay [32]. |
| Incorrect reagent storage or expired reagents [32]. | Confirm storage conditions (typically 2-8°C) and check expiration dates on all reagents [32]. | |
| Protocol Execution | Insufficient detector antibody or avidin-HRP [32] [33]. | Ensure all reagents, especially the detection antibody and avidin-HRP, were added and prepared to the correct dilution [32] [33]. |
| Plate washing too vigorous or wells scratched [32]. | Use caution when pipetting and washing to avoid scratching the well bottom. Calibrate automated plate washers [32]. | |
| Buffers | Sodium azide in wash buffer [33]. | HRP conjugates are inhibited by sodium azide; ensure it is absent from all buffers [33]. |
Question: My ELISA has a high background across all wells. How can I reduce it?
High background is frequently caused by non-specific binding and inadequate washing.
Table: Troubleshooting High Background in ELISA
| Problem Area | Possible Cause | Recommended Solution |
|---|---|---|
| Washing | Insufficient washing [32] [33]. | Follow the recommended washing procedure precisely. Invert the plate onto absorbent paper and tap firmly to remove residual fluid after each wash [32]. |
| Incubation | Incubation times too long [32] [33]. | Adhere strictly to the recommended incubation times. Over-incubation can lead to excessive signal [32] [33]. |
| Plate sealers not used or reused [32] [33]. | Always use a fresh, clean plate sealer during incubation steps to prevent well-to-well contamination [32] [33]. | |
| Reagents | Substrate exposure to light [32] [33]. | Protect the substrate solution from light before use, as premature exposure can cause high background [32] [33]. |
Immunofluorescence (IF) Troubleshooting
Question: I see weak or no staining in my immunofluorescence experiment for cytochrome c. What are the potential issues?
Weak signal in IF can be due to problems with fixation, antibody penetration, or the target itself.
Table: Troubleshooting Weak or No Staining in Immunofluorescence
| Problem Area | Possible Cause | Recommended Solution |
|---|---|---|
| Sample Preparation | Inadequate fixation or permeabilization [34] [35]. | For cytochrome c, use 4% formaldehyde for fixation. Ensure cells are permeabilized with 0.2% Triton X-100 if using formaldehyde [34] [35]. |
| Signal fading (fluorophore bleaching) [34] [35]. | Perform all incubations in the dark. Mount samples in an anti-fade mounting medium and image immediately [34] [35]. | |
| Antibodies | Antibody concentration too low or inactive [34] [35]. | Optimize the primary antibody dilution. For many antibodies, incubation at 4°C overnight yields optimal results [34]. |
| Incompatible primary-secondary antibody pair [35]. | Confirm the secondary antibody is raised against the host species of the primary antibody (e.g., anti-rabbit secondary for a rabbit primary) [35]. | |
| Microscopy | Incorrect microscope filter sets [35]. | Ensure the microscope's filter sets are matched to the excitation and emission spectra of the fluorophore being used [35]. |
Question: The background in my immunofluorescence images is too high. How can I make my specific signal clearer?
High background is typically a consequence of non-specific antibody binding or sample autofluorescence.
Table: Troubleshooting High Background in Immunofluorescence
| Problem Area | Possible Cause | Recommended Solution |
|---|---|---|
| Sample & Blocking | Insufficient blocking [34] [35]. | Increase the blocking incubation time and/or use a charge-based blocker like Image-iT FX Signal Enhancer [34]. |
| Sample autofluorescence [34] [35]. | Include an unstained control to check for autofluorescence. Use glutaraldehyde-free fixatives and consider treating samples with Sudan Black or sodium borohydride to reduce autofluorescence [34] [35]. | |
| Antibodies | Antibody concentration too high [34] [35]. | Titrate both primary and secondary antibodies to find the lowest concentration that gives a specific signal [34] [35]. |
| Washing | Insufficient washing [34]. | Increase the number and duration of washes after each antibody incubation step to remove loosely bound antibodies [34]. |
Experimental Workflow: Immunofluorescence for Cytochrome c Localization
This workflow for IF can be used to visually monitor the translocation of cytochrome c from mitochondria to the cytosol during apoptosis.
The Scientist's Toolkit: Key Reagents for Apoptosis and Cytochrome c Research
The following table lists essential reagents used in experiments studying cytochrome c release, along with their critical functions.
Table: Essential Research Reagents for Cytochrome c Release Studies
| Reagent | Function/Application | Key Consideration |
|---|---|---|
| Protease Inhibitor Cocktail | Added to lysis buffer to prevent protein degradation, preserving cytochrome c levels for accurate detection [29] [30]. | Essential for obtaining clean, reproducible results in both WB and IF [29]. |
| Cytochrome c Release Inducers | Chemical agents (e.g., Staurosporine, Actinomycin D) used to trigger the intrinsic apoptotic pathway and mitochondrial outer membrane permeabilization (MOMP) [36] [37]. | Required to create a positive control for cytochrome c release experiments [36]. |
| Apoptosis Inhibitors | Compounds like Z-VAD-FMK (pan-caspase inhibitor) or N-acetylcysteine (antioxidant) used to probe mechanisms of cytochrome c release [37]. | Useful for determining caspase-dependence or the role of redox signaling in release [37]. |
| Phospho-specific Antibody Diluent | A specialized buffer (often BSA-based) for diluting primary antibodies, crucial for maintaining antibody specificity, especially for phospho-targets upstream of cytochrome c release [29]. | Using an incompatible diluent (e.g., milk) can severely compromise signal [29]. |
| Polymer-based Detection Reagents | Highly sensitive detection systems for western blot and IHC that avoid biotin, which is present in milk and can cause high background [38]. | Provide superior sensitivity over traditional biotin-based systems [38]. |
| Anti-fade Mounting Medium | Used in immunofluorescence to slow the photobleaching of fluorophores during microscopy and storage [34]. | Critical for preserving signal intensity, especially for low-abundance targets or during long imaging sessions [34]. |
Kinetic Analysis of Release in Isolated Mitochondria
Frequently Asked Questions (FAQs)
FAQ 1: Why are my measurements of cytochrome c release from isolated mitochondria inconsistent or irreproducible?
Inconsistent cytochrome c release can stem from several factors related to mitochondrial preparation and experimental conditions. Key issues and their solutions are outlined below.
- Cause: Variable Mitochondrial Quality. The integrity of the outer mitochondrial membrane prior to experimentation is critical. Damage during isolation can lead to premature cytochrome c release.
- Solution: Always validate the quality of your mitochondrial preparation. Measure the release of cytochrome c (or another intermembrane space protein) in the absence of any inducing stimulus (e.g., tBid). A high basal release indicates a damaged preparation, and the mitochondria should not be used. Use a standardized, gentle isolation protocol and perform experiments with fresh mitochondria immediately after isolation [39].
- Cause: Inconsistent Stimulus Concentration. The effective concentration of an inducing agent like tBid is proportional to the amount of mitochondrial protein present.
- Solution: Ensure stimuli are calibrated to mitochondrial protein concentration. For instance, the half-maximal release (EC50) for tBid increases linearly with the amount of mitochondrial protein. Titrate your stimulus (e.g., tBid) for each new mitochondrial preparation and express the concentration relative to mg of mitochondrial protein (e.g., pmol tBid / mg protein) [40].
- Cause: Unaccounted for Feedback Loops. In a cellular context, an initial, low-level release of cytochrome c can activate caspases, which then feedback to amplify mitochondrial permeabilization and cause a massive secondary release.
- Solution: In isolated mitochondrial systems, this loop is broken. However, if using cytosolic extracts, be aware that caspase activity could influence results. To isolate the primary release event, consider using caspase inhibitors like zVAD to prevent amplification [41].
- Cause: Contamination with Other Cell Death Proteins. Isolated mitochondria can be contaminated with other organelles or cytosolic components, such as Bax, which can confound results.
- Solution: Characterize your mitochondrial preparation. Use Western blotting to confirm the presence of mitochondrial markers (e.g., Tom20, COX IV) and the absence of contaminants. Using mitochondria from cells that lack Bax can help isolate the specific role of Bak [40].
FAQ 2: How can I differentiate between the initial pore formation in the outer membrane and the downstream changes in cytochrome c diffusibility within the intermembrane space?
This is a central challenge in kinetic analysis. The processes can be dissected by measuring two distinct events in parallel on the same mitochondrial sample.
- Solution: Parallel Measurement of Pore Formation and Cytochrome c Efflux. Monitor the activation of a pore-forming protein like Bak concurrently with the release of cytochrome c.
- Measure Bak Conformation Change: This indicates pore formation. Treat mitochondria with your stimulus and then, at specific time points, subject them to limited trypsin digestion. A conformational change in Bak exposes a cryptic trypsin cleavage site. The disappearance of the full-length Bak protein on a Western blot indicates activation [40].
- Measure Cytochrome c Release: From the same mitochondrial pellet used for the Bak assay, separate the mitochondrial fraction from the supernatant via centrifugation. Use Western blotting to quantify the amount of cytochrome c remaining in the mitochondrial pellet and released into the supernatant [40] [41].
- Interpretation: A delay between Bak activation and the bulk of cytochrome c release suggests that factors within the intermembrane space, such as cristae remodeling, may be limiting the diffusion of cytochrome c to the pores. Kinetic modeling of this delay can be used to estimate the basal diffusibility of cytochrome c [40].
FAQ 3: My data shows cytochrome c release, but I do not observe a corresponding loss of mitochondrial membrane potential (ΔΨm). Is this expected?
Yes, this is a possible and mechanistically informative result. Cytochrome c release and loss of ΔΨm are not always coupled and can occur independently.
- Explanation: Staged Release and Functional Compartmentalization. Research has shown that cytochrome c release can occur in distinct stages [41].
- Early Stage: An initial, limited release of cytochrome c can happen through pores in the outer membrane without affecting the integrity of the inner membrane. The electron transport chain can remain functional, and ΔΨm can be maintained, especially if the released cytochrome c is only a small fraction of the total pool [41].
- Late Stage: A massive, secondary release of cytochrome c, often amplified by caspase activity, can lead to the depletion of mitochondrial cytochrome c. This compromises electron transport and oxidative phosphorylation, resulting in a collapse of ΔΨm and a drop in ATP levels [41].
- Investigation: To probe this further, you can correlate the kinetics of cytochrome c release with measurements of ΔΨm (using dyes like TMRM or Rhodamine 123) and cellular ATP levels. The use of caspase inhibitors can help isolate the early phase of release [9] [41].
Quantitative Data Tables
Table 1: Kinetic Parameters of tBid-Induced Cytochrome c Release in Isolated Mitochondria
This table summarizes key quantitative findings from a kinetic analysis of tBid-induced cytochrome c release, highlighting the relationship between stimulus concentration and release kinetics [40].
| Parameter | Value / Measurement | Experimental Context |
|---|---|---|
| Basal Cytochrome c Diffusibility | ~0.2 min⁻¹ | Isolated B50 cell mitochondria in the absence of tBid [40] |
| Calculated Half-time for Release | ~3.4 min | Based on basal diffusibility, sufficient for rapid release [40] |
| tBid Potency (EC₅₀) | 10 nM | Concentration for half-maximal release after 30 min (varies with protein) [40] |
| tBid vs. Bid Potency | ~14-fold more potent | tBid is significantly more effective than full-length Bid [40] |
| High [tBid] Effect | ~2-fold increase in diffusibility | Attributed to Permeability Transition at 100 pmol/mg protein [40] |
Table 2: Characteristics of Distinct Cytochrome c Release Stages in Cellular Apoptosis
This table contrasts the features of the early and late phases of cytochrome c release, a phenomenon observed in cellular models of genotoxic stress-induced apoptosis [41].
| Parameter | Early Stage Release | Late Stage Release |
|---|---|---|
| Cytochrome c Amount | Low level released into cytosol [41] | Massive, depleting mitochondrial stores [41] |
| Caspase Activation | Precedes activation; initiator [41] | Follows activation; amplified by caspases [41] |
| ATP Levels | Maintained [41] | Drastically reduced [41] |
| Mitochondrial Membrane Potential (ΔΨm) | Maintained [41] | Significantly reduced [41] |
| Effect of Caspase Inhibitor (zVAD) | Not prevented [41] | Prevented [41] |
| Bcl-2 Overexpression | Prevents release [41] | Prevents release [41] |
Experimental Protocols
Protocol 1: Differentiating Bak Activation from Cytochrome c Release
This protocol allows for the parallel measurement of Bak conformational change (a marker for pore formation) and cytochrome c release from the same sample of isolated mitochondria [40].
Key Materials:
- Isolated mitochondria (e.g., from B50 cells)
- Recombinant tBid
- Trypsin
- Soybean Trypsin Inhibitor
- Lysis Buffer (with protease inhibitors)
- Antibodies: Anti-Bak, Anti-cytochrome c
Methodology:
- Induction: Incubate isolated mitochondria with your chosen stimulus (e.g., tBid) at a controlled temperature (e.g., 25-30°C). Remove aliquots at specific time points.
- Stop Reaction & Digest Bak: Place aliquots immediately on ice to halt reactions. Treat with a standardized concentration of trypsin (e.g., 80 µg/mL) for 10 minutes on ice. This digests only Bak that has undergone a conformational change.
- Stop Digestion: Add a excess of soybean trypsin inhibitor to quench trypsin activity.
- Fractionation: Centrifuge the mitochondria at high speed (e.g., 10,000 x g) to separate the mitochondrial pellet (containing un-released cytochrome c) from the supernatant (containing released cytochrome c).
- Analysis:
- Bak Conformation: Solubilize the mitochondrial pellet in lysis buffer and perform Western blotting for Bak. The disappearance of the full-length band indicates active, "open" Bak.
- Cytochrome c Release: Analyze both the pellet and supernatant fractions by Western blotting for cytochrome c to quantify the proportion released.
Protocol 2: Measuring Real-Time Mitochondrial Bioenergetics in Response to Stress
This protocol outlines a general approach for using a real-time respirometer (e.g., Resipher system) to assess mitochondrial function, which can be correlated with cytochrome c release endpoints [42].
Key Materials:
- Cells or isolated mitochondria
- Real-time respirometry system (e.g., Resipher)
- Mitochondrial modulators: Oligomycin (ATP synthase inhibitor), FCCP (uncoupler), Rotenone & Antimycin A (Complex I & III inhibitors)
- Assay medium
Methodology:
- Optimization: Determine the optimal cell density or mitochondrial concentration for your assay. Titrate the concentrations of all mitochondrial modulators to ensure robust and specific responses.
- Basal Measurement: Seed cells or isolate mitochondria in the assay plate and record the baseline Oxygen Consumption Rate (OCR).
- Sequential Inhibition: Inject modulators sequentially to dissect different parts of the electron transport chain:
- Oligomycin: Inhibits ATP synthase. The drop in OCR represents ATP-linked respiration.
- FCCP: Uncouples mitochondria, collapsing the proton gradient and forcing the electron transport chain to operate at maximum capacity (maximal respiration). The difference between maximal and basal respiration is the spare respiratory capacity.
- Rotenone & Antimycin A: Shut down the electron transport chain completely. The remaining OCR is non-mitochondrial respiration.
- Data Correlation: Correlate changes in these bioenergetic parameters (e.g., loss of spare capacity, coupling efficiency) with measurements of cytochrome c release taken from parallel experiments.
Signaling Pathway and Experimental Workflow Diagrams
The Scientist's Toolkit: Research Reagent Solutions
Table 3: Essential Reagents for Investigating Cytochrome c Release
| Reagent / Material | Function / Application in Cytochrome c Release Studies |
|---|---|
| Recombinant tBid | A potent direct activator used to induce Bak/Bax-dependent cytochrome c release from isolated mitochondria [40]. |
| Cyclosporin A (CsA) | An inhibitor of cyclophilin D, used to determine if the Permeability Transition (PT) pore is contributing to cytochrome c release or increased diffusibility [40] [9]. |
| Caspase Inhibitors (e.g., zVAD-fmk) | A broad-spectrum caspase inhibitor. Used to distinguish between the initial release of cytochrome c and the secondary, caspase-amplified release in cellular models [41]. |
| Bak Inhibitory Antibody (e.g., G-23) | Used to confirm the specific role of Bak in cytochrome c release by blocking its interaction with activators like tBid [40]. |
| Mitochondrial Dyes (TMRM, Rhodamine 123) | Fluorescent dyes used to measure mitochondrial membrane potential (ΔΨm). A collapse in ΔΨm often correlates with the late stage of cytochrome c release and mitochondrial dysfunction [9] [41]. |
| Trypsin | A protease used in a controlled assay to detect the conformational change of Bak. The exposure of a cryptic trypsin site indicates Bak activation [40]. |
| Oligomycin, FCCP, Rotenone | Pharmacological modulators of mitochondrial respiration used in real-time bioenergetic assays (e.g., Seahorse, Resipher) to profile mitochondrial function alongside release assays [42]. |
Real-Time Monitoring with Quartz Crystal Microbalance with Dissipation (QCM-D)
Troubleshooting Guide: Achieving a Stable Baseline
A stable baseline is the foundation for reliable QCM-D data, especially when detecting subtle signals like those from cytochrome c interactions. The following table summarizes common issues and their solutions.
| Problem Area | Specific Issue | Recommended Solution | Target Stability (in water, at RT) |
|---|---|---|---|
| Bubbles | Bubble formation on sensor surface | Use properly degassed liquids. Risk increases with low salt concentration and rising temperature. [43] | — |
| Temperature | Large environmental temperature variations | Ensure instrument temperature controller is on. Protect from drafts, sunlight, and ensure constant room temperature. [43] [44] | — |
| Mode interference from unwanted resonances | Slightly adjust the set temperature to move away from the interfering mode. [43] | — | |
| Sensor & Mounting | Reactions or humidity changes on sensor backside | Ensure no leaks and that the dew point is significantly higher than the measurement temperature. [43] [44] | — |
| Stresses from improper sensor mounting | Ensure the sensor is mounted correctly and without introducing mechanical stress. [44] | — | |
| Bad electrical contact | Check for secure contact between sensor and gold contact wires. [44] | — | |
| Fluidic System | Swelling or shrinkage of O-rings | Be aware of O-ring material compatibility when switching solvents. [44] | — |
| Leaks in tubing or measurement chamber | Check all connections and ensure the sensor is properly mounted and not cracked. [44] | — | |
| Pressure changes from flow system | Stabilize pressure in the measurement environment; be aware of peaks from syringe pumps. [45] [44] | — | |
| Performance | General Baseline Drift | Address all physical factors above to eliminate uncontrolled changes. [44] | Frequency drift: < 1 Hz/h; Dissipation drift: < 0.15 x 10⁻⁶/h [44] |
Troubleshooting Guide: Addressing Signal Instability and Noise
Even after securing a stable baseline, signal instability can occur during measurements. The table below addresses challenges related to data quality and external disturbances.
| Problem | Possible Cause | Solution & Advanced Techniques |
|---|---|---|
| High Noise | Electronic noise or environmental vibrations. | Evaluate instrument specifications for noise and long-term stability, not just theoretical frequency resolution. [46] |
| Signal Drift During Experiment | Concurrent external factors (temperature, pressure, flow rate) and intrinsic sensor setup noise. [45] | Apply signal processing methods like Discrete Wavelet Transform (DWT) to differentiate noise from signal in real-time, improving the Limit of Detection (LoD). [45] |
| Difficulty Resolving Small Signals | Signal of interest is smaller than or comparable to the noise level. [46] | Use a reference resonator on the same MQCM chip. The DWT-based method can extract and cancel correlated noise patterns between sensor and reference resonators. [45] |
Experimental Protocol: QCM-D Analysis of Cytochrome c Interactions
This protocol provides a methodology for studying cytochrome c (cyt c) interactions, relevant to troubleshooting inconsistent release measurements, based on a published QCM-D study. [47]
Background and Principle
Cytochrome c is a positively charged, small heme protein that plays a key role in apoptosis. Its release from mitochondria is a critical event that can be studied using model membrane systems. QCM-D allows for real-time, label-free monitoring of cyt c adsorption to surfaces like supported lipid bilayers and its subsequent interaction with DNA aptamers or other molecules, providing simultaneous data on adsorbed mass (via frequency, Δf) and structural/viscoelastic properties (via dissipation, ΔD). [47]
Materials and Reagents
| Research Reagent | Function/Explanation in the Experiment |
|---|---|
| DMPC/DMPG (1:1 molar ratio) Liposomes | Forms a negatively charged supported lipid bilayer on the QCM-D sensor, mimicking the inner mitochondrial membrane and allowing for electrostatic adsorption of cyt c. [47] |
| Cytochrome c (cyt c) | The target protein. Its adsorption to the lipid layer and subsequent interactions are the core processes monitored. [47] |
| NH2-Apt-cytc (DNA Aptamer) | A single-stranded DNA molecule with a specific sequence that binds to cyt c. Used here as a recognition element; its binding or displacement of cyt c can be detected. [47] |
| 11-mercapto-1-undecanoic acid (MUA) | Forms a self-assembled monolayer (SAM) on the gold sensor surface with terminal carboxyl groups. Cyt c can be covalently immobilized onto this surface for controlled studies. [47] |
| EDC/NHS | Cross-linking agents used to activate the carboxyl groups of MUA for the covalent binding of cyt c. [47] |
| Gold Nanowires (AuNWs) | Nanostructures that can be functionalized with DNA aptamers. They are used for signal amplification or as drug carriers in targeted delivery studies. [47] |
| Phosphate Buffered Saline (PBS) | Standard buffer solution used to maintain a physiological pH and ionic strength during experiments. [47] |
Step-by-Step Procedure
Sensor Preparation and Baseline Establishment:
- Clean the gold QCM-D sensors using a standard protocol (e.g., UV/Ozone, plasma cleaning).
- Mount the sensor in the QCM-D chamber and set the temperature to the desired setpoint (e.g., 23°C or 37°C). Allow the system to thermally equilibrate for at least 30 minutes after any temperature change. [43]
- Flow PBS buffer through the chamber at a constant flow rate until a stable baseline is achieved for both frequency (f) and dissipation (D) at multiple overtones. Verify stability against the target values (drift < 1 Hz/h and < 0.15 x 10⁻⁶/h). [44]
Surface Formation (Choose A or B):
- A. Supported Lipid Bilayer Formation:
- Prepare small unilamellar vesicles (SUVs) from a 1:1 molar mixture of DMPC and DMPG in PBS.
- Inject the SUV solution into the chamber and monitor the f and D shifts. A successful formation is indicated by a rapid decrease in f and an increase in D, followed by a stabilization and slight recovery as the vesicles rupture and form a planar bilayer. [47]
- Rinse extensively with PBS to remove any loosely adhered vesicles.
- B. MUA SAM with Covalent Cyt c Immobilization:
- Inject an ethanol solution of MUA to form a SAM on the gold sensor.
- Rinse with ethanol and PBS.
- Activate the carboxyl groups by injecting a mixture of EDC and NHS in MES buffer.
- Inject a solution of cyt c (e.g., 0.5 µM) to covalently bind to the activated surface. [47]
- Rinse with PBS to remove physically adsorbed protein.
- A. Supported Lipid Bilayer Formation:
Cytochrome c Adsorption:
- Inject a solution of cyt c (e.g., in PBS) over the prepared surface.
- Monitor the decrease in f and the increase in D, which indicate mass adsorption and the possible formation of a viscoelastic layer.
- Rinse with buffer to remove unbound protein. The remaining signal corresponds to the stably adsorbed cyt c layer. [47]
Aptamer Interaction Study:
- Inject a solution of the DNA aptamer specific to cyt c.
- Observation on Lipid Bilayer: You may observe an increase in f and a decrease in D, indicating the removal of cyt c from the surface by the aptamer. [47]
- Observation on Covalently Bound Cyt c: You will observe a decrease in f, indicating the binding of the aptamer to the immobilized cyt c. [47]
Data Analysis:
- Analyze the Δf and ΔD shifts from the stabilized baselines before each injection.
- For rigid, thin layers, use the Sauerbrey equation to estimate adsorbed mass.
- For soft, thick layers (indicated by large ΔD changes), use the Kelvin-Voigt model for viscoelastic modeling to determine mass, thickness, and shear rigidity. [47]
The following workflow diagram illustrates the key experimental steps and decision points in this protocol:
Advanced Technique: Real-Time Signal Processing for Improved Stability
For researchers using monolithic QCM (MQCM) arrays or dealing with particularly challenging environmental noise, advanced signal processing can be implemented.
DWT-Based Noise Correction Principle
The Discrete Wavelet Transform (DWT) method leverages the high similarity in noise patterns between neighboring resonators on the same MQCM chip. Environmental disturbances affect these resonators in a correlated way, while the specific binding signal is localized to the sensor resonator. [45]
- Signal Decomposition: The raw frequency/dissipation signals from both a "sensor" and a "reference" resonator are decomposed using DWT into approximation (low-frequency) and detail (high-frequency) coefficients.
- Correlation Analysis: The time derivatives of the approximation coefficients from both resonators are highly linearly correlated when only environmental noise is present.
- Noise Cancellation: An algorithm extracts and cancels out these correlated components, leaving behind the cleaned signal of interest. This method works for both frequency (Δf) and dissipation (ΔD) in real-time with low computational cost. [45]
The following diagram illustrates the logic flow of this advanced signal correction method:
Frequently Asked Questions (FAQs)
Q1: My baseline is unstable, with constant drifting. What are the first things I should check? Start with the most common culprits: temperature and bubbles. Ensure your instrument's temperature controller is active and that the room temperature is constant, protecting the instrument from drafts. Always use degassed liquids to prevent bubble formation on the sensor, which causes significant drift in both f and D. [43] [44]
Q2: Why should I care about dissipation (D) if I'm only interested in mass changes? The dissipation factor provides critical information about the viscoelastic properties of the adsorbed layer. If you measure a large frequency shift (Δf) with a significant dissipation shift (ΔD), the Sauerbrey equation will underestimate the mass because the layer is soft and water-trapped. Measuring D tells you whether your film is rigid (small ΔD, Sauerbrey valid) or soft (large ΔD, viscoelastic modeling required) for accurate quantification. [48]
Q3: I see a large signal shift when I start flowing a sample. How can I tell if it's binding or just a stabilization issue? A true binding event typically shows a smooth, monotonic change in f and D that eventually stabilizes if the surface saturates. A stabilization artifact, often from a temperature mismatch between the sample and the chamber, will appear as a sharp shift upon injection that slowly drifts back toward the original baseline as the system re-equilibrates. Always ensure your samples are at the same temperature as the measurement chamber. [43]
Q4: Can the QCM-D signal be affected by something other than mass adsorption on the front of the sensor? Yes. The backside of the sensor is equally sensitive. If there is a leak, or if the humidity in the lab changes dramatically, it can alter the amount of water adsorbed on the sensor's back, causing drift. Also, bad electrical contacts or mechanical stress from improper mounting can severely degrade signal stability. [43] [44]
Q5: My research involves detecting small signals. What instrument specifications are most important? Do not focus solely on theoretical "frequency resolution." The key parameters that determine your ability to detect small changes are noise and long-term drift. Request these values from the supplier, ideally measured under conditions similar to your experiments (e.g., in liquid at your working temperature). [46]
Frequently Asked Questions (FAQs)
Q1: Why are my SERS measurements for cytochrome c release so inconsistent between experiments? Inconsistency in SERS measurements often stems from variations in SERS substrates and instrumental setups. A major multi-laboratory study found that even when using identical samples and protocols, differences in SERS substrates accounted for the most significant variation, with prediction errors sometimes too high to meet quantitative standards [49]. Furthermore, the localized nature of SERS "hotspots"—nanoscale gaps and crevices with extremely high electromagnetic enhancement—means that small differences in the number of molecules occupying these spots can cause large intensity variations [50].
Q2: How can I confirm that my SERS signal is specifically from cytochrome c and not other cellular components? You can identify cytochrome c through its unique vibrational fingerprint. SERS spectra of c-type cytochromes show a characteristic peak at 1313 cm⁻¹, which is a signature not present in b-type cytochromes, myoglobin, or hemoglobin [51]. To further validate your findings, you can perform a control experiment by adding sodium dithionite (SDT) to your mitochondria sample. This chemical fully reduces electron carriers, causing a signature shift in the SERS peaks sensitive to the redox state of the iron atom in cytochrome c, which should match the spectrum of purified, reduced cytochrome c [51].
Q3: What is the optimal laser power to use for live-cell SERS to avoid damaging mitochondria? Use the lowest laser power sufficient to obtain a quality spectrum. In a specific study probing cytochrome c in living mitochondria, the SERS spectra were stable over time when recorded with a low-power laser, indicating no photodamage. Photodamage, evidenced by the broadening of SERS peaks, was only observed when the laser power was increased 10-fold above the working level [51]. Always perform a power-dependent time study on your specific system to establish a safe threshold.
Q4: My SERS signal is weak from intracellular compartments. How can I improve the signal? Signal strength is highly dependent on the distance between the analyte and the SERS-active surface. The SERS effect is a very short-range phenomenon, with signal enhancement decaying within a few nanometers [50]. To target cytochrome c within mitochondria, ensure you use functionalized nanoparticles with appropriate localization signals. For example, ligands with a mitochondrial localization signal (MLS) can help bring the SERS-active nanoparticles closer to the target, significantly improving the signal from inner mitochondrial membrane components [52].
Troubleshooting Guides
Issue: Low or No SERS Signal from Cytochrome c
| # | Possible Cause | Diagnostic Steps | Solution |
|---|---|---|---|
| 1 | Non-optimal SERS substrate | Characterize substrate with a standard analyte like Rhodamine 6G (10⁻⁸ M). Check Enhancement Factor (EF) [53]. | Switch to a substrate with a higher EF. Substrates with controllable nanogaps (6-8 nm) can provide EFs >10⁶ [54]. |
| 2 | Nanoparticles not internalized or localized near mitochondria | Perform control experiments with MLS-functionalized nanoparticles [52]. | Functionalize Au/Ag nanoparticles with a Mitochondrial Localization Signal (MLS) to ensure proper targeting. |
| 3 | Laser wavelength not optimal for substrate | Check the Localized Surface Plasmon Resonance (LSPR) peak of your substrate via UV-Vis spectroscopy [55]. | Match the laser excitation wavelength to the LSPR peak of your substrate for maximum enhancement [55] [56]. |
| 4 | Analyte too far from enhancing surface | Review experimental design; SERS enhancement is effective only within a few nanometers [50]. | Use label-free SERS on substrates where mitochondria are directly adhered, or ensure nanoparticle-analyte contact is forced. |
Issue: Poor Reproducibility of SERS Intensity
| # | Possible Cause | Diagnostic Steps | Solution |
|---|---|---|---|
| 1 | Inhomogeneous substrate or nanoparticle aggregation | Take SEM images of the substrate. Perform SERS mapping; variations >10% are common [53] [50]. | Measure multiple spots (e.g., >100) to average out heterogeneity [50]. Use internal standards for correction [49] [50]. |
| 2 | Uncontrolled aggregation of colloidal nanoparticles | Monitor aggregation state via UV-Vis spectroscopy; a shift and broadening of the LSPR peak indicates aggregation [55]. | Standardize the type and concentration of aggregating agent (e.g., NaCl) and the time allowed for aggregation to occur [55]. |
| 3 | Variations in spectrometer performance | Participate in interlaboratory studies or use internal calibration standards [49]. | Implement a daily calibration procedure for your Raman spectrometer using a standard like paracetamol or silicon [49] [53]. |
| 4 | Inconsistent cell culture or mitochondria isolation | Ensure consistent protocols for cell passage number, confluence, and mitochondrial integrity assays (e.g., response to FCCP) [51]. | Strictly standardize biological sample preparation protocols. Validate mitochondrial function for each preparation. |
Key Experimental Protocols
Protocol for SERS-based Detection of Cytochrome c in Living Mitochondria
This protocol is adapted from a study that successfully probed cytochrome c in living mitochondria [51].
1. SERS Substrate Preparation:
- Use hierarchically structured silver-ring substrates (AgNSS). These can be fabricated via techniques like displacement Talbot lithography and ion beam etching to create nanogaps with high enhancement factors [54].
- Alternatively, use commercially available SERS substrates with chaotic, fractal structures that often provide high enhancement due to numerous small interstructural distances [53].
2. Mitochondria Isolation and Placement:
- Isolate mitochondria from your cell model using standard differential centrifugation.
- Confirm mitochondrial integrity by verifying a coupled response to the protonophore FCCP (e.g., increased O₂ consumption) [51].
- Place a droplet of the mitochondrial suspension onto the SERS substrate and allow it to settle.
3. SERS Measurements:
- Laser Power: Use low laser power (typically ≤ 1 mW at the sample) to avoid photodamage and heating, which can alter cytochrome c conformation [51] [50].
- Acquisition: Collect spectra from multiple spots (≥15-20) to account for spatial heterogeneity.
- Control for Redox State: To obtain a reference spectrum for fully reduced cytochrome c, add sodium dithionite (SDT) to the mitochondrial sample.
4. Data Analysis:
- Identify cytochrome c by its characteristic peak at 1313 cm⁻¹.
- Monitor the redox state by observing the shift in key peaks, such as the one near 748 cm⁻¹, which increases in relative intensity in the reduced state [51].
Workflow Diagram: SERS Analysis of Cytochrome c Release
The following diagram visualizes the experimental workflow and the key decision points for troubleshooting.
The Scientist's Toolkit: Research Reagent Solutions
The table below lists essential materials and their functions for SERS-based single-cell analysis, particularly in the context of cytochrome c studies.
| Item | Function & Rationale |
|---|---|
| Gold (Au) Nanoparticles | Biocompatible SERS substrate, ideal for intracellular and in vivo studies. Can be synthesized in various shapes (nanostars, rods) for tunable plasmonic properties [52] [56]. |
| Silver (Ag) Nanoparticles | Provides superior SERS enhancement compared to Au but can be cytotoxic. Often used for in vitro ultrasensitive detection [52]. |
| Mitochondrial Localization Signal (MLS) | A peptide ligand used to functionalize nanoparticles, ensuring their targeting and proximity to mitochondria, which is crucial for enhancing signals from inner membrane components like cytochrome c [52]. |
| FCCP (Carbonyl cyanide-p-trifluoromethoxyphenylhydrazone) | A protonophore used to uncouple oxidative phosphorylation. It dissipates the proton gradient, altering the redox state of cytochrome c. Used as a control to validate mitochondrial function and probe dynamic changes [51]. |
| Sodium Dithionite (SDT) | A strong reducing agent. Used to artificially fully reduce cytochrome c and other electron carriers in mitochondria, providing a characteristic reference SERS spectrum for the reduced state [51]. |
| Rhodamine 6G (R6G) | A common Raman reporter molecule with a high cross-section. Used as a standard analyte to characterize the enhancement factor and performance of a SERS substrate [53] [57]. |
| Internal Standard (e.g., Isotope-Labeled Analyte) | A compound with a nearly identical chemical structure to the target analyte but with a distinct Raman shift (e.g., from isotope labeling). Added to correct for variations in SERS intensity and enable reliable quantification [50]. |
Aptamer-Based Biosensors for Specific Detection
Frequently Asked Questions (FAQs) & Troubleshooting Guides
FAQ 1: Why is my aptamer-based biosensor showing low sensitivity for cytochrome c detection?
Answer: Low sensitivity can stem from several factors related to the aptamer, sensor surface, or detection conditions. The affinity and specificity of your DNA aptamer are paramount. Furthermore, the orientation of the aptamer on the biosensor surface and the density of its immobilization can dramatically impact the binding efficiency and subsequent signal generation. Non-optimal conditions, such as an unsuitable buffer pH or ionic strength, can also hinder the aptamer's ability to fold into its correct, target-binding conformation. For cytochrome c detection, note that its positively charged surface in physiological conditions requires careful management to avoid non-specific electrostatic interactions with negatively charged DNA backbones. [47]
Troubleshooting Guide:
- Check Aptamer Affinity: Verify the binding affinity (K_D) of your aptamer batch via an independent method like isothermal titration calorimetry.
- Optimize Immobilization: If using a gold surface, ensure a clean Au-S bond formation for thiolated aptamers. Experiment with different spacer lengths (e.g., poly-T sequences) to improve accessibility. [47]
- Adjust Buffer Conditions: Systematically vary the pH and Mg²⁺ concentration to find the optimal folding and binding conditions for your specific aptamer sequence.
- Confirm Target Integrity: Ensure the cytochrome c is in its native, functional state and has not undergone degradation or denaturation.
FAQ 2: How can I reduce non-specific binding in complex samples like serum?
Answer: Non-specific binding (NSB) is a common challenge when moving from buffer to complex matrices like serum, where many extraneous proteins can foul the sensor surface. A highly effective strategy is to incorporate an antifouling layer on your sensor surface. Research has shown that zwitterionic peptides can form a hydrated membrane via hydrogen bonding, which effectively resists the adsorption of proteins due to hydrophobic interactions. Electrically neutral peptides are particularly effective at preventing the adsorption of both positively and negatively charged proteins. Alternatively, you can use passivating agents like bovine serum albumin (BSA) to block uncovered active sites on the sensor surface. [58]
Troubleshooting Guide:
- Implement an Antifouling Layer: Modify your electrode with an amphoteric ionic peptide layer before aptamer immobilization. [58]
- Include a Blocking Step: After aptamer immobilization, incubate the sensor with a solution of BSA or casein to block non-specific sites.
- Use a Control Aptamer: Employ a random-sequence DNA aptamer as a negative control to quantify and subtract the signal from non-specific binding.
- Wash and Regenerate: As demonstrated in a study for dopamine detection in serum, a simple immersion in PBS for 10 minutes after assaying can help eliminate interference from adsorbed proteins and cells. [58]
FAQ 3: My aptamer is degrading during experiments or storage. How can I improve its stability?
Answer: The rapid degradation of aptamers, particularly RNA aptamers, by nucleases in biological media is a well-documented problem that can limit their practical application. Several proven methods can significantly enhance aptamer stability. [59]
Troubleshooting Guide:
- Use Chemically Modified Nucleotides: Incorporate modified nucleotides (e.g., 2'-fluoropyrimidines, 2'-O-methyl purines/pyrimidines) during the chemical synthesis of the aptamer. These modifications are resistant to nuclease cleavage. The only FDA-approved aptamer drug, Macugen, uses this approach. [59]
- Terminal Modifications: Modify the 3' and 5' termini of the aptamer to protect against exonucleases. A common practice is to cap the 3'-end with an inverted deoxythymidine.
- Consider Spiegelmers: Investigate the use of "mirror" aptamers (Spiegelmers) composed of L-ribose or L-deoxyribose. These unnatural oligonucleotides are virtually impervious to degradation by nucleases that are specific for D-oligonucleotides. [59]
Performance Data & Experimental Protocols
The following table summarizes key performance metrics for different types of aptamer-based biosensors, which can be used for benchmarking your own cytochrome c detection system.
Table 1: Performance Comparison of Aptamer-Based Biosensors
| Target Analyte | Biosensor Type | Aptamer Type | Detection Range | Limit of Detection (LOD) | Reference |
|---|---|---|---|---|---|
| Cytochrome c | Fluorescent (PDANTs/Exo I) | DNA | 0.01 - 100 µM | 0.003 µM (3 nM) | [60] |
| Arginine (L-Arg) | Electrochemical (DPV) | Peptide | 0.0001 - 10 µM | 31 pM | [58] |
| Arginine (L-Arg) | Electrochemical (EIS) | Peptide | 0.1 pM - 0.1 mM | 0.01 pM | [58] |
| Human Norovirus | Electrochemical (EIS) | Peptide | 10 - 10^5 copies/mL | 2.47 copies/mL | [58] |
| NGAL | Electrochemical (SWV) | Peptide | 0.0001 - 7.5 µg/mL | 3.93 ng/mL | [58] |
| SARS-CoV-2 | SERS Aptasensor | DNA | N/A | Pooled Sens: 0.97, Spec: 0.98 | [61] |
Detailed Experimental Protocol: QCM-D for Cytochrome c - Aptamer Interaction
This protocol is adapted from research that studied the interaction between cytochrome c and DNA aptamers on lipid films, providing a method to monitor binding in real-time. [47]
Objective: To monitor the specific binding of cytochrome c to a DNA aptamer immobilized on a sensor surface and to study the viscoelastic properties of the formed layers using Quartz Crystal Microbalance with Dissipation Monitoring (QCM-D).
Materials:
- QCM-D Sensor Chips: Gold-coated quartz crystals.
- Aptamer: DNA aptamer specific to cytochrome c, modified with a 5'-amino group and a 10-mer thymidine spacer (sequence: 5'-NH2-TTTTTTTTTTATCGATAAGCTTCCAGAGCCGTGTCTGGGGCCGACCGGCGCATTGGGTACGTTGTTGCCGTAGAATTCCTGCAGCC-3'). [47]
- Lipids: 1,2-dimyristoyl-sn-glycero-3-phosphocholine (DMPC) and 1,2-dimyristoyl-sn-glycero-3-phospho-rac-(1-glycerol) sodium salt (DMPG) at a molar ratio of 1:1 for creating a supported lipid film. [47]
- Chemical Linkers: 11-mercapto-1-undecanoic acid (MUA), N-(3-Dimethylaminopropyl)-N′-ethylcarbodiimide hydrochloride (EDC), N-Hydroxysuccinimide (NHS).
- Buffers: Phosphate Buffered Saline (PBS, pH 7.4), MES buffer.
Procedure:
- Sensor Surface Preparation:
- Clean the gold sensor chips thoroughly with a piranha solution (Caution: highly corrosive), followed by UV-ozone treatment.
- Option A (Lipid Film): Fuse small unilamellar vesicles (SUVs) composed of DMPC:DMPG (1:1) onto the gold surface in PBS to form a stable, negatively charged supported lipid bilayer.
- Option B (MUA SAM): Immerse the clean gold chip in an ethanol solution of 1 mM MUA for at least 12 hours to form a self-assembled monolayer (SAM). Rinse with ethanol and dry under a nitrogen stream.
Aptamer Immobilization (for MUA SAM):
- Activate the terminal carboxylic acid groups of the MUA SAM by injecting a mixture of EDC and NHS in MES buffer for 15-30 minutes.
- Rinse with MES buffer to remove excess EDC/NHS.
- Inject the amino-modified DNA aptamer solution and allow it to covalently couple to the activated surface for several hours.
- Rinse with PBS to remove unbound aptamers.
- Deactivate any remaining active esters by injecting a 1 M ethanolamine solution (pH 8.5).
Cytochrome c Binding Assay:
- Establish a stable baseline by flowing PBS buffer through the QCM-D chamber.
- Inject a solution of cytochrome c (e.g., 0.5 µM in PBS) and monitor the changes in resonance frequency (Δf) and energy dissipation (ΔD) in real-time. A decrease in frequency indicates mass adsorption.
- Continue until the signal stabilizes, indicating binding saturation.
Specificity and Regeneration Test:
- Rinse with PBS to remove weakly bound protein.
- To test specificity, inject a solution of a non-target protein (e.g., BSA) and observe any non-specific binding.
- For regeneration, you may apply a low-pH buffer or a high-ionic-strength solution to dissociate the cytochrome c-aptamer complex, checking for signal recovery.
Data Analysis:
- The Kelvin-Voigt model can be applied to the QCM-D data (multiple overtones) to evaluate the viscoelastic properties (shear modulus, viscosity) of the adsorbed layers, providing insights beyond simple mass adsorption. [47]
The Scientist's Toolkit: Research Reagent Solutions
Table 2: Essential Reagents for Aptamer-Based Cytochrome c Biosensing
| Reagent / Material | Function / Explanation |
|---|---|
| DNA Aptamer (Cyt c specific) | The primary recognition element. Its sequence determines the specificity and affinity for cytochrome c. A 5'-modification (e.g., thiol or amino group) allows for controlled immobilization. [47] |
| Amino Modifier (e.g., 5'-NH2) | Enables covalent conjugation to sensor surfaces (e.g., COOH-functionalized surfaces via EDC/NHS chemistry), offering stable and oriented immobilization. [47] |
| Thiol Modifier (e.g., 5'-ThiolC6 S-S) | Facilitates self-assembly on gold surfaces via strong Au-S bonds, a standard and robust method for electrochemical and QCM-D sensors. |
| 11-Mercapto-1-undecanoic acid (MUA) | Forms a self-assembled monolayer (SAM) on gold, providing carboxylic acid groups for subsequent covalent attachment of amino-modified aptamers. [47] |
| EDC / NHS Crosslinkers | Activates carboxyl groups on surfaces (like MUA SAMs) to form reactive esters that readily form amide bonds with amino-modified aptamers. [47] |
| Zwitterionic Peptides | Serves as an antifouling layer to resist non-specific protein adsorption from complex samples like serum, improving signal-to-noise ratio. [58] |
| Gold Nanowires (AuNWs) | Nanostructures that can be functionalized with aptamers. They act as signal amplifiers or nanocarriers in enhanced detection schemes. [47] |
| Exonuclease I (Exo I) | An enzyme used in signal amplification strategies. It can digest aptamers not bound to the target, recycling the target for repeated binding and signal generation. [60] |
Signaling Pathways & Experimental Workflows
Aptamer-Based Detection Workflow
Cytochrome c in Cell Death Pathways
Diagnosing and Solving Common Cytochrome c Measurement Problems
Frequently Asked Questions (FAQs)
Q1: My measurements of cytochrome c release are inconsistent between experiments. Could my buffer be the cause?
Yes, the ionic strength of your isolation and assay buffers is a very likely cause. Research has demonstrated that cytochrome c binds to mitochondrial membranes via electrostatic interactions [62]. At low ionic strengths (e.g., in sucrose-based buffers without KCl), these interactions are strong, artificially retaining cytochrome c on the mitochondria even after the outer membrane has been permeabilized. One study found that the release of endogenous cytochrome c after permeabilization by tBid required 50-80 mM of a salt like KCl, NaCl, or LiCl to dissociate it from the membrane [63]. Always confirm the ionic composition of your buffers and ensure consistency.
Q2: I can detect the release of other proteins like Smac/DIABLO, but not cytochrome c, under the same apoptotic conditions. Why is this?
This specific discrepancy points directly to an ionic strength issue. Unlike cytochrome c, the release of proteins such as Smac/DIABLO and Omi/HtrA2 is independent of ionic strength [63]. This is because their release is governed purely by the physical permeabilization of the outer mitochondrial membrane, while cytochrome c requires an additional step of electrostatic dissociation. If your buffer has low salt concentration, cytochrome c will remain bound while other proteins are released, giving you a false negative for cytochrome c release.
Q3: How does pH influence cytochrome c's interaction with the mitochondrial membrane?
pH influences the protonation state of key amino acids on cytochrome c, which alters its affinity for anionic phospholipids like cardiolipin in the inner mitochondrial membrane. At a more acidic pH (e.g., ~6.5), a specific binding site on cytochrome c known as the L-site becomes active [64] [65]. This site involves lysine residues (K22, K25, K27) and histidine residues (H26, H33). Protonation of these histidines increases the positive charge of this region, strengthening the electrostatic binding to the negatively charged cardiolipin. This enhanced binding at lower pH can make cytochrome c more difficult to release during apoptosis.
Q4: Can altering pH and ionic strength help me study different pools of cytochrome c?
Absolutely. Cytochrome c exists in different functional states within mitochondria. A fraction is loosely bound to the membrane via electrostatic interactions, while the majority is tightly bound via hydrophobic interactions with cardiolipin [66]. You can exploit buffer conditions to study these pools:
- High Ionic Strength (~150 mM KCl): Displaces electrostatically bound cytochrome c, releasing the "loose" pool.
- Low Ionic Strength: Preserves electrostatic binding; release of cytochrome c under these conditions indicates genuine outer membrane permeabilization.
- Oxidizing Conditions + High Ionic Strength: The tightly bound pool requires peroxidation of cardiolipin by cytochrome c's peroxidase activity (often enhanced by H₂O₂) before it can be liberated by high salt [66].
Troubleshooting Guide: Inconsistent Cytochrome c Release
Problem: Failure to Detect Cytochrome c Release Despite Apoptotic Induction
Potential Cause 1: Low Ionic Strength Buffer
- Description: The buffer used for mitochondrial isolation or the release assay lacks sufficient salt concentration, preventing the dissociation of cytochrome c from the membrane after pore formation.
- Solution: Add KCl or NaCl to your assay buffer to a final concentration of 50-150 mM and repeat the experiment [63].
- Prevention: Standardize your mitochondrial isolation and assay buffers to include 100-150 mM KCl. Always specify the ionic strength in your methods section.
Potential Cause 2: Active L-Site Binding at Lower pH
- Description: If your experimental conditions or buffer systems cause a local drop in pH towards 6.5, it can activate the L-site binding motif, strengthening cytochrome c's attachment to cardiolipin and resisting release.
- Solution: Check and calibrate the pH of all your buffer solutions. For standard assays, maintain a pH of 7.4 to minimize L-site binding [64].
- Prevention: Use robust, well-buffered systems at pH 7.4 and be cautious when studying processes that might acidify the mitochondrial environment.
Problem: High Background Release of Cytochrome c from Control Mitochondria
Potential Cause: High Ionic Strength or Osmotic Stress
- Description: Overly high ionic strength or osmotic shock can cause non-specific rupture of the mitochondrial outer membrane, leading to cytochrome c release in the absence of any apoptotic trigger.
- Solution: Titrate the salt concentration to find the optimal level that allows for dissociation without causing mechanical damage. Ensure your isolation buffer is isotonic.
- Prevention: Avoid using potassium salts above 150 mM in your standard assay buffers. Always include a no-stimulus control to monitor baseline integrity.
The following tables summarize key experimental findings on how ionic strength and pH impact cytochrome c behavior.
Table 1: Impact of Ionic Strength on Cytochrome c Release and Function
| Parameter | Low Ionic Strength Effect | High Ionic Strength Effect | Key Evidence |
|---|---|---|---|
| Release from Mitochondria | Artificial retention; incomplete release after OMM permeabilization [63] | Complete dissociation from membranes; can cause non-specific release if too high [63] | Release required 50-80 mM KCl [63] |
| Binding to Cytochrome c Oxidase (Complex IV) | Increased affinity, but can form a less active complex [67] [68] | Decreased affinity, allowing for faster turnover [67] [68] | Optimal activity at intermediate ionic strength [67] |
| Dissociation Constant (Kd) | High-affinity site: ~0.6 nM; Low-affinity site: ~20 µM (at 8.8 mM ionic strength) [67] | Affinity decreases significantly as ionic strength increases [67] | Measured for cytochrome c - cytochrome c oxidase complex [67] |
Table 2: Role of pH in Cytochrome c-Membrane Interactions
| pH | Primary Binding Site | Interaction Mechanism | Physiological Consequence |
|---|---|---|---|
| pH 7.4 (Neutral) | A-site (e.g., K72, K73) [64] | Mostly electrostatic, with some hydrophobic penetration [64] | Supports electron transport; initial engagement for peroxidase function. |
| pH ~6.5 (Acidic) | L-site (e.g., K22, K25, K27, H26, H33) [65] | Strong electrostatic binding driven by histidine protonation [64] [65] | May facilitate membrane fusion; could resist release during early apoptosis. |
| Inhibition Method | Not applicable | Addition of 50 mM NaCl can inhibit L-site binding [64] | Restricts cytochrome c to A-site binding mode. |
Experimental Protocols for Key Findings
Protocol 1: Demonstrating Ionic Strength Dependence of Release
This protocol is adapted from studies showing that cytochrome c remains membrane-bound at low ionic strength after apoptotic triggering [63].
- Mitochondrial Isolation: Isolate mitochondria from rat liver or a relevant cell line using a standard homogenization buffer (e.g., 250 mM sucrose, 10 mM HEPES, 1 mM EGTA, pH 7.4).
- Treatment Groups: Resuspend mitochondrial pellets in two different release assay buffers:
- Low Ionic Strength: 250 mM sucrose, 10 mM HEPES, pH 7.4.
- High Ionic Strength: 250 mM sucrose, 10 mM HEPES, 125 mM KCl, pH 7.4.
- Induction of Permeabilization: Add a known inducer of outer membrane permeabilization, such as recombinant tBid protein (e.g., 50 nM) or a Bax oligomer, to both groups. Include a no-inducer control for each buffer.
- Incubation: Incubate at 30°C for 20-30 minutes.
- Separation: Centrifuge at high speed (e.g., 12,000 x g for 10 min) to separate the mitochondrial pellet (containing bound cytochrome c) from the supernatant (containing released cytochrome c).
- Analysis: Analyze the supernatant and pellet fractions by Western blotting for cytochrome c. Expect to see cytochrome c in the supernatant of the high ionic strength group only.
Protocol 2: Investigating pH-Dependent Membrane Binding
This protocol is based on research using turbidimetry to measure cytochrome c-induced vesicle fusion via the L-site [65].
- Liposome Preparation: Prepare mitochondrial mimetic liposomes composed of 1,2-dipalmitoyl-sn-glycero-3-phosphocholine, 1,2-dipalmitoyl-sn-glycero-3-phosphoethanolamine, and heart cardiolipin (e.g., 40:40:20 molar ratio) in buffers of varying pH (e.g., 6.2, 6.8, 7.4).
- Measurement: Place the liposome solution in a spectrophotometer and monitor the turbidity (optical density at 540 nm) over time.
- Stimulation: Add purified, oxidized cytochrome c (e.g., 5 µM final concentration) to the liposome suspension and mix rapidly.
- Data Collection: Continue recording turbidity for 10-20 minutes. A rapid increase in turbidity indicates liposome fusion, which is mediated by cytochrome c's bidentate binding via the A- and L-sites.
- Inhibition Control: Repeat the experiment at pH 6.5 in the presence of 50 mM NaCl, which should suppress the pH-dependent L-site binding and thus inhibit fusion [64].
Research Reagent Solutions
Table 3: Essential Reagents for Studying Cytochrome c Release
| Reagent | Function/Description | Critical Consideration |
|---|---|---|
| KCl / NaCl | Used to adjust the ionic strength of buffers. | KCl is physiologically more relevant; a concentration of 100-150 mM is often sufficient to dissociate cytochrome c [63]. |
| HEPES Buffer | A common pH buffer for biochemical assays. | Maintain a stable pH (typically 7.4) to prevent activation of the low-pH L-site [64]. |
| Cardiolipin-containing Liposomes | Mitochondrial membrane mimetic for in vitro binding studies. | Use a physiologically relevant composition (e.g., 20% cardiolipin) to study authentic interactions [64] [65]. |
| Recombinant tBid / Bax Proteins | Pro-apoptotic proteins used to induce specific outer mitochondrial membrane permeabilization. | Preferred over non-physiological agents like Ca²⁺ to study the regulated release pathway [66] [63]. |
| Cytochrome c Antibody | For detection and quantification of cytochrome c via Western blot or ELISA. | Ensure the antibody recognizes both native and denatured cytochrome c for detecting released (supernatant) and bound (pellet) protein. |
Signaling Pathways and Experimental Workflows
Frequently Asked Questions (FAQs) on MOMP Efficiency
FAQ 1: Why is my measured cytochrome c release incomplete or inconsistent, even with a strong apoptotic stimulus?
Incomplete cytochrome c release often stems from issues related to cytochrome c's mitochondrial binding or inefficient Bak/Bax activation.
- Problem: Cytochrome c is not freely soluble in the intermembrane space; a large fraction (∼85%) is electrostatically bound to the inner membrane phospholipid cardiolipin [66]. Complete release requires a two-step process: 1) detachment from cardiolipin, and 2) permeabilization of the outer membrane [66].
- Solution: Ensure your experimental buffers contain sufficient ionic strength (50-80 mM KCl, NaCl, or LiCl). Low ionic strength buffers can prevent the dissociation of cytochrome c from the membrane, leading to underestimation of release [63].
FAQ 2: How can I confirm that Bak and Bax are fully activated in my experimental system?
Efficient Mitochondrial Outer Membrane Permeabilization (MOMP) requires the oligomerization of the pro-apoptotic proteins Bak and Bax [69] [70].
- Problem: Bak/Bax activation can be incomplete due to insufficient signaling from BH3-only proteins or overexpression of anti-apoptotic Bcl-2 family members (e.g., Bcl-2, Bcl-xL, Mcl-1) that sequester activators [71].
- Solution:
- Use BH3 mimetics (e.g., ABT-737) to inhibit anti-apoptotic proteins and probe the cell's "mitochondrial priming" [71] [72].
- Assess Bak/Bax oligomerization status via crosslinking or native gel electrophoresis [70].
- As a control, consider using a direct activator like Raptinal, which can induce cytochrome c release independently of Bak/Bax, helping to pinpoint the problem to the Bak/Bax activation step itself [72].
FAQ 3: Could the mitochondrial membrane composition itself be affecting Bak/Bax pore activity?
Yes, recent evidence shows the lipid environment directly regulates Bak/Bax function.
- Problem: The mitochondrial outer membrane's lipid composition influences the efficiency of pore formation by Bak/Bax. Membranes enriched in saturated lipids may resist pore formation [73].
- Solution: Modulating lipid unsaturation can sensitize cells to apoptosis. The enzyme FADS2, which generates polyunsaturated fatty acids, enhances Bak/Bax pore activity. Correlating FADS2 levels or dietary unsaturated fatty acids with apoptosis sensitivity can provide insights [73].
Troubleshooting Guide: Key Issues and Experimental Solutions
Table 1: Common Problems and Verification Methods in Cytochrome c Release Assays
| Problem Area | Specific Issue | Experimental Verification Method | Expected Outcome for Successful MOMP |
|---|---|---|---|
| Cytochrome c State | Incomplete detachment from cardiolipin [66] [63] | Vary ionic strength (KCl 0-150 mM) in release assay buffer [63]. | Significant increase in cytochrome c release at 50-80 mM KCl. |
| Effector Activation | Inefficient Bak/Bax oligomerization [69] [70] | Perform crosslinking (e.g., with BMH or DSS) followed by SDS-PAGE and immunoblotting for Bak/Bax [70]. | Detection of high molecular weight Bak/Bax oligomers. |
| Regulatory Balance | Dominance of anti-apoptotic proteins (Bcl-2, Bcl-xL, Mcl-1) [71] | Treat with specific BH3 mimetics (e.g., ABT-199, S63845) prior to apoptotic stimulus [71] [72]. | Enhanced cytochrome c release and caspase activation. |
| Mitochondrial Architecture | Altered cristae structure trapping cytochrome c [66] | Visualize mitochondrial ultrastructure using electron microscopy. | Widening of cristae junctions (from ~18 nm to ~57 nm) during apoptosis. |
Essential Experimental Protocols
Protocol 1: Spectrophotometric Quantification of Cytochrome c Release
This protocol provides a rapid, quantitative method for measuring cytochrome c release from isolated mitochondria or permeabilized cells [74].
- Isolate Mitochondria: Prepare mitochondria from tissues or cells using standard differential centrifugation in isotonic buffer (e.g., 250 mM sucrose, 10 mM HEPES, pH 7.4).
- Induce MOMP: Incubate mitochondria (0.5-1 mg/mL protein) with your apoptotic stimulus (e.g., recombinant tBid, Bax protein, calcium, etc.) in release buffer (e.g., 125 mM KCl, 10 mM HEPES, pH 7.4, 5 mM succinate). Always include a negative control (no stimulus) and a positive control (e.g., 0.1% Triton X-100).
- Separate Fractions: Centrifuge the samples at high speed (e.g., 12,000 x g for 10 min) to pellet the mitochondria. Carefully collect the supernatant (released fraction).
- Spectrophotometric Measurement:
- Obtain the absorbance spectrum of the supernatant from 350 to 450 nm.
- The characteristic Soret (γ) peak of cytochrome c is at 414 nm [74].
- The height of this peak is proportional to the concentration of cytochrome c in the supernatant.
- Quantification: Calculate the percentage of cytochrome c released by comparing the absorbance of the test sample to the positive control (100% release).
Protocol 2: Assessing Bak/Bax Activation via Crosslinking
This method detects the formation of Bak/Bax oligomers, a key step in MOMP [70].
- Treat Cells: Apply your apoptotic stimulus to cells for the desired time.
- Harvest and Permeabilize: Collect cells and wash in PBS. Permeabilize cells with a mild digitonin-containing buffer (e.g., 0.025% digitonin) for 5-10 min on ice to access mitochondrial proteins.
- Crosslinking:
- Add a membrane-permeable, thiol-cleavable crosslinker like BMH (Bismaleimidohexane) or DSS (Disuccinimidyl suberate) to a final concentration of 0.1-1 mM.
- Incubate for 30 minutes at room temperature.
- Quench the reaction by adding excess free cysteine or glycine.
- Analysis:
- Lyse cells and run the protein lysates on non-reducing SDS-PAGE.
- Perform immunoblotting for Bak or Bax.
- Interpretation: Monomeric Bak/Bax runs at ~25-30 kDa. Activated, oligomerized Bak/Bax appears as higher molecular weight complexes (dimers, trimers, and larger species) [70].
Visualization of Key Concepts
Diagram 1: The Intrinsic Apoptotic Pathway and Cytochrome c Release
Diagram 2: Experimental Workflow for Troubleshooting Incomplete Release
The Scientist's Toolkit: Key Research Reagents
Table 2: Essential Reagents for Investigating MOMP
| Reagent / Tool | Primary Function | Example Application in Troubleshooting |
|---|---|---|
| BH3 Mimetics (e.g., ABT-263/Navitoclax, ABT-199/Venetoclax) [71] [72] | Inhibit anti-apoptotic Bcl-2 proteins (Bcl-2, Bcl-xL, Bcl-w). | Determine if incomplete release is due to dominant anti-apoptotic activity. |
| Recombinant BH3-only proteins/peptides (e.g., tBid, BimBH3 peptide) [66] [75] | Directly activate Bak/Bax or neutralize anti-apoptotic proteins. | Used in isolated mitochondria experiments to directly trigger and study the core MOMP machinery. |
| Crosslinkers (e.g., BMH, DSS) [70] | Covalently link proteins in close proximity. | Detect and confirm Bak/Bax oligomerization, a key marker of activation. |
| Raptinal [72] | Small molecule inducer of BAX/BAK/BOK-independent MOMP. | A control compound to bypass Bak/Bax activation and test if the downstream release mechanism is intact. |
| Ionic Strength Buffers (KCl-based) [63] | Disrupt electrostatic interactions between cytochrome c and cardiolipin. | Critical for ensuring complete cytochrome c detachment and accurate measurement of release. |
Controlling for the Permeability Transition (MPT) in Release Assays
Troubleshooting Guide: Common Issues and Solutions
This guide addresses specific challenges you might encounter when working with Mitochondrial Permeability Transition (MPT)-dependent cytochrome c release assays.
Table 1: Troubleshooting Common MPT and Cytochrome c Release Assay Problems
| Problem | Potential Cause | Solution | Preventive Measures |
|---|---|---|---|
| High background cytochrome c release | Mitochondrial damage during isolation [76] | Include protease inhibitors (e.g., PMSF) during isolation; Assess membrane potential with Rhodamine-123 [76] | Optimize homogenization steps; Use isotonic buffers [76] |
| Inconsistent MPT induction by Ca2+ | Variable mitochondrial quality; Inaccurate Ca2+ quantification [76] | Standardize Ca2+ additions using a calibrated fluorescent dye (e.g., Calcium Green-1); Include a positive control (e.g., known MPT inducer) | Perform BCA protein assay to normalize mitochondrial load; Confirm functionality via oxygen consumption rate (OCR) [76] |
| Inhibition by CsA is ineffective | Compromised Cyclophilin D (CypD) activity; Non-MPT mediated release pathway [77] [2] | Verify CsA and mitochondrial stock viability; Test if release is blocked by Bcl-2 overexpression or occurs without swelling [77] [2] | Use fresh aliquots of CsA; Confirm the role of mPTP in your model system |
| Lack of correlation between cytochrome c release and swelling | Activation of alternative release pathways (e.g., Bax/Bak pores) [77] [36] | Perform parallel assays: measure cytochrome c (immunoblot) and swelling (light scattering) simultaneously [76] [77] | Characterize the dominant cell death pathway (e.g., via Bax/Bak knockout cells) |
| Incomplete cytochrome c release | Heterogeneous mitochondrial populations; Sub-populations resistant to MPT [77] | Analyze subcellular fractions (HM and cytosolic) by Western blot; Use immunocytochemistry to visualize release in single cells [77] [36] | Use a highly specific stimulus; Ensure adequate induction time |
Frequently Asked Questions (FAQs)
FAQ 1: What are the primary triggers and inhibitors of the MPT that I should use as experimental controls?
The MPT is primarily triggered by elevated matrix Ca2+ and oxidative stress [78] [2]. The most critical pharmacological inhibitor is Cyclosporin A (CsA), which acts by binding to Cyclophilin D (CypD) and desensitizing the pore to Ca2+ [76] [2]. Other inhibitors include adenine nucleotides (e.g., ADP) and divalent cations like Mg2+ [2]. A well-designed experiment should always include a vehicle control, a robust MPT trigger (e.g., a Ca2+ bolus), and the trigger plus CsA to confirm MPT-specific effects.
FAQ 2: My data shows cytochrome c release, but I don't observe mitochondrial swelling. Does this mean the MPT is not involved?
Not necessarily. While sustained MPT opening leads to massive swelling and outer membrane rupture, cytochrome c can be released through other mechanisms that do not involve the classical, swelling-dependent MPT [77]. These include the formation of pores in the outer mitochondrial membrane by pro-apoptotic Bcl-2 family proteins like Bax and Bak [77] [36]. Your observation suggests that the release may be independent of the MPT or involve a transient MPT opening that does not cause gross morphological changes. You should investigate Bax/Bak activation or use genetic models to distinguish between these pathways.
FAQ 3: How can I distinguish between MPT-dependent and MPT-independent cytochrome c release in my experiments?
The gold standard is to use the inhibitor Cyclosporin A (CsA). A release that is significantly inhibited by CsA is considered MPT-dependent [76] [2]. Furthermore, you can monitor for mitochondrial swelling via light scattering, which is a hallmark of full MPT opening [76] [77]. MPT-independent pathways, often mediated by Bax/Bak, can release cytochrome c without causing large-amplitude swelling [77] [36]. Using a combination of pharmacological inhibition (CsA) and morphological assessment (swelling) provides the strongest evidence.
FAQ 4: Why are my isolated mitochondria unresponsive to Ca2+ challenge?
This is often a sign of poor mitochondrial quality or damage during the isolation procedure [76]. To troubleshoot:
- Check Integrity: Measure the mitochondrial membrane potential (ΔΨm) using a fluorescent dye like Rhodamine-123. Healthy, coupled mitochondria will maintain a high potential [76].
- Check Function: Assess the Oxygen Consumption Rate (OCR) with a Clark-type electrode. Functional mitochondria will show a predictable response to substrates and ADP [76].
- Optimize Protocol: Ensure all steps are performed on ice or at 4°C using pre-chilled buffers, and avoid overly vigorous homogenization [76].
FAQ 5: Is MPT opening always a "point of no return" that leads to cell death?
No. This is a key advancement in the field. While sustained, long-lasting MPT opening does lead to bioenergetic collapse and necrotic or apoptotic cell death, evidence now supports the existence of transient MPT opening [2]. These brief openings may involve sub-conductance states of the pore and are thought to play physiological roles in regulating mitochondrial Ca2+ efflux, reactive oxygen species (ROS) signaling, and metabolic homeostasis [2]. The duration of pore opening determines the cellular outcome.
Experimental Protocols & Data Presentation
Core Protocol: Isolating Functional Mitochondria from Tissue
This protocol is critical for obtaining reliable results in all subsequent assays [76].
- Sacrifice the animal using an institutionally approved procedure.
- Dissect the target tissue (e.g., liver) and place it in ice-cold isolation buffer.
- Mince and Rinse the tissue thoroughly in DPBS to remove blood.
- Homogenize the tissue in isolation buffer using a motor-driven Potter-Elvehjem homogenizer. Perform slow, even strokes (10-20 plunges) to avoid damaging the mitochondria.
- Differential Centrifugation:
- Centrifuge the homogenate at 800 × g for 10 min at 4°C to pellet nuclei and cell debris.
- Transfer the supernatant to a new tube and centrifuge at 10,300 × g for 10 min at 4°C to pellet the crude mitochondrial fraction.
- Resuspend the mitochondrial pellet gently in a small volume of isolation buffer.
- Quantify the mitochondrial protein concentration using a BCA Protein Assay Kit.
Assessing MPT and Cytochrome c Release
The following diagram illustrates the core workflow for conducting and interpreting an MPT-focused cytochrome c release assay.
The Scientist's Toolkit: Research Reagent Solutions
Table 2: Essential Reagents for MPT and Cytochrome c Release Studies
| Reagent | Function/Brief Explanation | Key Considerations |
|---|---|---|
| Cyclosporin A (CsA) | Gold-standard inhibitor of MPT; binds to Cyclophilin D (CypD) [76] [2] | Use fresh aliquots; Test multiple concentrations; Confirm its efficacy in your system. |
| Ca2+ Chelators (EGTA) | Controls extra-mitochondrial Ca2+; used to establish baseline and confirm Ca2+ dependence. | Distinguish between EGTA (extracellular) and BAPTA-AM (intracellular). |
| Rhodamine-123 / JC-1 | Fluorescent dyes to monitor mitochondrial membrane potential (ΔΨm) [76]. | Loss of ΔΨm can be a consequence of MPT, but is not required for all cytochrome c release [36]. |
| Adenine Nucleotides (e.g., ADP) | Physiological inhibitors of MPT opening [2]. | Can be used to demonstrate physiological regulation of the pore. |
| Cytochrome c Antibodies | Critical for detecting release via Western Blot (WB) or Immunocytochemistry (ICC) [77]. | Validate antibody for specific application (WB vs. ICC). Use for both heavy membrane and cytosolic fractions. |
| Bax/Bak Activators/Inhibitors | Tools to probe MPT-independent release pathways [77]. | Helps dissect the contribution of alternative apoptotic pathways. |
Visualizing the MPT's Role in Cell Death Pathways
The following diagram outlines the key decision points in the mitochondrial pathway of cell death, highlighting the role of the MPT and alternative cytochrome c release mechanisms.
Optimizing Detergent Use for Mitochondrial Fractionation without Artefacts
Frequently Asked Questions
1. Why is the choice of detergent so critical in mitochondrial fractionation? The choice of detergent is critical because overly harsh detergents can compromise mitochondrial integrity, leading to the artefactual release of cytochrome c and other intermembrane space proteins. This can cause false positives in apoptosis assays. Mild non-ionic detergents are preferred as they effectively solubilize the plasma membrane while leaving mitochondrial membranes intact [79] [80].
2. What is the recommended working concentration range for detergents? For cell lysis during mitochondrial isolation, the optimal detergent concentration is typically between 0.05% and 0.4% [81]. Using digitonin, effective concentrations can range from 0.05% to 0.5%, with the optimal concentration being cell-type dependent and requiring empirical determination [80].
3. How can I verify that my mitochondrial fraction is pure and intact? You should perform Western blot analysis using specific organelle markers. Beta-actin serves as a cytoplasmic marker, while VDAC1 is a recommended mitochondrial marker. The absence of beta-actin in your mitochondrial fraction and the absence of VDAC1 in your cytosolic fraction indicate minimal cross-contamination [82]. Additionally, cytochrome c should be predominantly detected in the mitochondrial fraction in non-apoptotic samples [83] [82].
4. What are the signs of detergent-induced artefacts? The primary sign is the unexpected presence of cytochrome c in the cytosolic fraction under control conditions where apoptosis has not been induced. This indicates that the detergent has damaged the outer mitochondrial membrane, leading to artefactual release [84] [82]. Microscopic examination of homogenized samples can also reveal excessive disruption of cellular structures [85] [82].
5. Are there alternatives to detergents for mitochondrial isolation? Yes, effective alternatives include the hypotonic swelling method. This technique uses a hypotonic buffer to cause cells to swell, followed by mechanical disruption with a Dounce homogenizer. This method can minimize potential detergent-related artefacts and has been shown to yield highly pure mitochondrial fractions [85].
Troubleshooting Guides
Problem: Inconsistent Cytochrome c Release Measurements
Potential Causes and Solutions:
Cause: Inconsistent Cell Lysis Efficiency
- Solution: Standardize homogenization. Use a pre-chilled Dounce homogenizer and perform a consistent number of passes (e.g., 30-50 for cells). Check efficiency microscopically by ensuring 70-80% of nuclei lack a shiny ring. Avoid both under- and over-homogenization [82].
Cause: Suboptimal Detergent Type or Concentration
- Solution: Titrate detergent concentration for your specific cell type. Consider using digitonin for its selectivity for the plasma membrane over mitochondrial membranes. For digitonin, a working range of 0.05-0.5% is a good starting point for optimization [80].
Cause: Contamination of Fractions
- Solution: Implement rigorous centrifugation steps. After initial low-speed spins to remove nuclei and debris (e.g., 700-800 × g), perform an intermediate-speed centrifugation (e.g., 10,000 × g) to pellet the mitochondrial fraction. Wash the mitochondrial pellet with extraction buffer to remove residual cytosolic components [85] [82].
Cause: Proteolytic Degradation
- Solution: Always work on ice or at 4°C and include protease inhibitors (e.g., PMSF, cocktail tablets) in all buffers immediately before use. This preserves protein integrity, including that of cytochrome c [82].
Problem: Low Mitochondrial Yield or Integrity
Potential Causes and Solutions:
Cause: Excessive Homogenization
- Solution: Avoid excessive passes with the Dounce homogenizer. As recommended, 30-50 passes for cells is often sufficient. Verify efficiency under a microscope and do not proceed beyond 80% cell breakage [82].
Cause: Impure Mitochondrial Fraction
- Solution: Combine differential centrifugation with a hypotonic swelling step. The swelling helps weaken the plasma membrane, making homogenization more efficient and yielding purer mitochondria with less mechanical force required [85].
Cause: Inappropriate Buffer Composition
- Solution: Use validated buffer recipes. A common Isolation Buffer contains 0.225 M mannitol, 0.075 M sucrose, 10 mM MOPS (pH 7.2), and 1 mM EGTA. Sucrose and mannitol maintain osmotic pressure, while EGTA chelates calcium to prevent mitochondrial permeability transition [85].
Detergent Properties and Optimization Data
Table 1: Common Detergents Used in Mitochondrial Fractionation
| Detergent | Type | Critical Micelle Concentration (CMC) | Relative Harshness | Recommended Use |
|---|---|---|---|---|
| Digitonin | Non-ionic | ~0.1-0.5% (varies) | Mild | Selective plasma membrane permeabilization [79] [80] |
| DDM (n-Dodecyl-β-D-maltoside) | Non-ionic | ~0.0087% | Mild | General use; membrane protein stabilization [79] |
| LMNG (Lauryl Maltose Neopentyl Glycol) | Non-ionic | Very Low (~0.0002%) | Mild | Advanced alternative to DDM [79] |
| Triton X-100 | Non-ionic | ~0.02% | Harsh | Complete membrane dissolution; avoid for intact organelles [79] |
| SDS (Sodium Dodecyl Sulphate) | Ionic | ~0.23% | Very Harsh | Denatures proteins; not for functional organelle isolation [79] |
Table 2: Troubleshooting Detergent-Related Artefacts
| Observed Problem | Potential Cause | Suggested Solution |
|---|---|---|
| Cytochrome c in cytosolic fraction of control cells | Detergent too harsh or concentration too high | Switch to a milder detergent (e.g., digitonin) or titrate to a lower concentration [80] [82] |
| Low mitochondrial yield | Insufficient cell lysis | Optimize homogenization passes; empirically determine optimal digitonin concentration [80] [82] |
| Contaminated fractions (e.g., cytosolic markers in mitochondria) | Incomplete centrifugation | Add a wash step to the mitochondrial pellet; use a hypotonic swelling method for cleaner separation [85] [82] |
| Protein degradation | Missing protease inhibitors | Add fresh protease inhibitors to all buffers immediately before use [82] |
Experimental Protocols
Detailed Protocol: Mitochondrial Fractionation Using a Hybrid Hypotonic-Detergent Approach
This protocol combines the purity of the hypotonic swelling method with the efficiency of mild detergent use.
1. Reagent Preparation:
- Hypotonic Buffer: 10 mM MOPS (pH 7.2), 100 mM Sucrose, 1 mM EGTA. Add protease inhibitors immediately before use [85].
- Hypertonic Buffer: 10 mM MOPS (pH 7.2), 1.25 M Sucrose [85].
- Isolation Buffer-2: 10 mM MOPS (pH 7.2), 0.225 M Sucrose, 0.075 M Mannitol, 1 mM EGTA. Add protease inhibitors [85].
- Digitonin Stock (5%): Prepare in DMSO or water.
2. Cell Harvest and Homogenization:
- Harvest approximately 5 x 10⁷ to 1 x 10⁸ cells by scraping and centrifugation at 600 × g for 5 min at 4°C [85] [82].
- Resuspend the cell pellet in a measured volume of ice-cold Hypotonic Buffer (e.g., 5 mL per gram of cells) [85].
- Incubate on ice for 10 min to allow cells to swell. Verify swelling under a phase-contrast microscope.
- Add 0.1 mL of Hypertonic Buffer per 1 mL of cell suspension to restore tonicity [85].
- Add digitonin to a final concentration of 0.05%-0.1% from the stock solution.
- Homogenize immediately with a pre-chilled Dounce homogenizer using 10-30 tight pestle strokes [85]. Check homogenization efficiency microscopically.
3. Mitochondrial Isolation:
- Transfer the homogenate to a tube and centrifuge at 800 × g for 10 min at 4°C to pellet nuclei and unbroken cells [85].
- Transfer the supernatant (post-nuclear supernatant, PNS) to a new tube. To ensure a clean PNS, repeat the 800 × g centrifugation step [82].
- Transfer the supernatant to an ultracentrifuge tube and centrifuge at 10,000 × g for 20-30 min at 4°C [85] [82].
- The resulting pellet is the enriched mitochondrial fraction. The supernatant is the cytosolic fraction.
- For higher purity, gently resuspend the mitochondrial pellet in Isolation Buffer-2 and re-pellet by centrifuging at 10,000 × g for 10-15 min [82].
4. Fraction Analysis:
- Resuspend the final mitochondrial pellet in a suitable buffer (e.g., SOL buffer: 50 mM Tris-HCl, pH 6.8, 1 mM EDTA, 0.5% Triton X-100) for protein analysis [85].
- Analyze 10-20 µg of protein from both cytosolic and mitochondrial fractions by SDS-PAGE and Western blotting.
- Probe membranes with antibodies against cytochrome c, a mitochondrial marker (e.g., VDAC1), and a cytosolic marker (e.g., beta-actin) to assess fraction purity and cytochrome c localization [82].
The Scientist's Toolkit
Table 3: Essential Reagents for Mitochondrial Fractionation
| Reagent / Tool | Function / Purpose | Example / Note |
|---|---|---|
| Digitonin | Mild detergent for selective plasma membrane permeabilization. | Preferable over harsher detergents; requires concentration optimization [80]. |
| Dounce Homogenizer | Mechanical disruption of swollen cells. | Essential for effective and controllable cell lysis [85] [82]. |
| Protease Inhibitor Cocktail | Prevents proteolytic degradation of proteins during isolation. | Must be added fresh to all buffers before the procedure [82]. |
| Sucrose/Mannitol | Osmotic stabilizers in isolation buffers. | Maintain mitochondrial structure and function by preventing osmotic shock [85]. |
| VDAC1 Antibody | Validated marker for the mitochondrial fraction. | Confirms enrichment and purity of mitochondria in Western blot analysis [82]. |
| Beta-actin Antibody | Validated marker for the cytosolic fraction. | Detects contamination of the mitochondrial fraction with cytosol [82]. |
| Cytochrome c Antibody | Key readout for apoptosis and artefact detection. | Detects its release from mitochondria; use to validate fractionation integrity [83] [82]. |
Workflow and Pathway Diagrams
Diagram Title: Mitochondrial Fractionation Workflow and Outcome
Diagram Title: Cytochrome c Release Pathways in Apoptosis and Artefacts
Mitigating Interference from Cellular Components like K+ and Redox Agents
Frequently Asked Questions
FAQ 1: What are the common cellular components that can interfere with cytochrome c release measurements? The most common interfering factors are fluctuations in intracellular potassium (K+) levels and changes in the cellular redox state, particularly involving reactive oxygen species (ROS) and antioxidants like glutathione (GSH). A decrease in intracellular K+ is an early, necessary event for the activation of caspases and nucleases during apoptosis [86]. Simultaneously, a pro-oxidant state with elevated ROS is often required for cytochrome c release, and this can be neutralized by high levels of GSH [37].
FAQ 2: How can I confirm that my cytochrome c measurement is accurate and not an artifact? Always perform fractionation controls. After separating the cytosolic and mitochondrial fractions, probe your Western blots with specific organelle markers to confirm the purity and integrity of your fractions. Recommended markers include beta-actin for the cytoplasmic fraction and VDAC1 for the mitochondrial fraction [87]. The absence of cross-contamination ensures that cytochrome c detected in the cytosol is due to release and not caused by mitochondrial rupture during homogenization.
FAQ 3: My results are inconsistent even with controls. What experimental parameters should I re-examine? Inconsistencies often stem from the methods of apoptosis induction and cell homogenization.
- Induction Specificity: Different apoptotic stimuli (e.g., chemical, UV) engage the intrinsic pathway with varying kinetics and dependencies. Confirm that your chosen stimulus effectively induces cytochrome c release in your specific cell type [88].
- Homogenization Efficiency: Under-homogenization leaves cells intact, skewing results, while over-homogenization can mechanically damage mitochondria and cause artifactual release [87]. Use a microscope to check that 70-80% of nuclei lack a shiny ring, indicating proper breakage [87].
FAQ 4: Can antioxidant treatments like N-acetylcysteine (NAC) really prevent cytochrome c release? Yes. Antioxidants such as N-acetylcysteine (NAC) can increase cellular glutathione (GSH) levels, which neutralizes elevated hydrogen peroxide and other ROS [37]. By restoring a more reduced cellular redox state, these compounds can inhibit the ROS burst that is coincident with and necessary for cytochrome c release, thereby blocking apoptosis [37].
Troubleshooting Guide: Inconsistent Cytochrome c Release
The table below outlines common problems, their potential causes, and verified solutions.
| Problem | Possible Cause | Troubleshooting Solution | Underlying Principle |
|---|---|---|---|
| High background cytochrome c in control cytosolic fractions. | Mechanical rupture of mitochondria during cell homogenization [87]. | Optimize homogenization technique; use a pre-chilled Dounce grinder and perform 30-50 passes on ice. Check efficiency microscopically [87]. | Physical integrity of mitochondria must be preserved until the apoptotic trigger induces permeabilization. |
| Variable release between experiments or cell types. | 1) Inconsistent apoptosis induction.2) Uncontrolled cellular redox state.3) Differences in intracellular K+ levels [37] [86]. | 1) Standardize the concentration and duration of the apoptotic stimulus.2) Use antioxidants (e.g., NAC) or pro-oxidants as controls to manipulate redox state [37].3) Monitor or clamp intracellular K+ levels. | Cytochrome c release is regulated by multiple converging signals, including redox state and ion homeostasis [37] [86]. |
| Weak or absent cytochrome c signal in Western blot. | 1) Insufficient protein loading.2) Inefficient antibody binding. | 1) Load at least 10-30 µg of cytosolic or mitochondrial fraction protein [88] [87].2) Validate antibody specificity; use a positive control (e.g., camptothecin-treated Jurkat cells) [88]. | The 12 kDa cytochrome c protein must be present in sufficient quantity for detection by the antibody. |
| Failed separation of cytosolic and mitochondrial fractions. | Incorrect centrifugation speed or time [87]. | Follow a validated step-by-step protocol: centrifuge at 700 x g to remove nuclei, then 10,000 x g to pellet mitochondria [87]. | Subcellular components are separated based on size and density using differential centrifugation. |
Detailed Experimental Protocol: Subcellular Fractionation & Detection
This protocol is adapted from commercial cytochrome c release assay kits and scientific literature [88] [87].
1. Cell Culture and Apoptosis Induction
- Culture approximately (5 \times 10^7) cells (e.g., Jurkat cells) and induce apoptosis with your chosen stimulus (e.g., 2 µM Camptothecin for 24 hours). Include a vehicle-treated negative control [88].
2. Cell Harvesting and Washing
- Collect cells by centrifugation at (200 \times g) for 5 minutes at 4°C.
- Wash the cell pellet with 10 mL of ice-cold PBS.
- Centrifuge again at (600 \times g) for 5 minutes at 4°C. Remove the supernatant completely [87].
3. Cell Permeabilization and Homogenization
- Resuspend the cell pellet in 1 mL of pre-chilled Cytosol Extraction Buffer Mix (containing DTT and Protease Inhibitors).
- Incubate on ice for 15 minutes.
- Homogenize the cells in a pre-chilled Dounce tissue grinder. Perform 30-50 passes while keeping the grinder on ice.
- Critical Step: Check homogenization efficiency by placing 2-3 µL of the homogenate on a coverslip and viewing under a microscope. Proceed when 70-80% of nuclei lack a shiny ring [87].
4. Differential Centrifugation
- Transfer the homogenate to a microcentrifuge tube and centrifuge at (700 \times g) for 10 minutes at 4°C. The pellet contains nuclei and unbroken cells.
- Transfer the supernatant to a fresh tube and centrifuge again at (700 \times g) for 10 minutes to remove residual nuclei.
- Transfer the resulting supernatant to a fresh tube and centrifuge at (10,000 \times g) for 30 minutes at 4°C.
- The new supernatant is the Cytosolic Fraction.
- The pellet is the Mitochondrial Fraction. Resuspend it in 0.1 mL of Mitochondrial Extraction Buffer Mix [87].
5. Western Blot Analysis
- Load 10-30 µg of protein from each cytosolic and mitochondrial fraction onto a 12% SDS-PAGE gel.
- Perform a standard Western blot transfer.
- Probe the membrane with an anti-cytochrome c antibody (recommended working concentration ~1 µg/mL) [87].
- To confirm fraction purity, re-probe the blot with antibodies for organelle markers: beta-actin (cytoplasmic) and VDAC1 or COX IV (mitochondrial) [88] [87].
The Scientist's Toolkit: Essential Research Reagents
This table lists key reagents used in studying cytochrome c release and mitigating interference.
| Research Reagent | Function / Role in Experiment |
|---|---|
| N-acetylcysteine (NAC) | An antioxidant that boosts cellular glutathione (GSH) levels. Used to investigate/inhibit the role of redox state in cytochrome c release [37]. |
| Cell Permeable GSH | A membrane-permeant form of glutathione. Directly manipulates the intracellular antioxidant capacity to suppress the ROS burst and block cytochrome c release [37]. |
| Cytosol Extraction Buffer | Used to gently lyse cells while keeping organelles intact for subsequent fractionation [87]. |
| Boc-aspartyl(OMe)-fluoromethylketone (BAF) | A broad-spectrum caspase inhibitor. Used to dissect the role of caspase activity in the ROS burst and to confirm the apoptotic pathway [37]. |
| Anti-Cytochrome c Antibody | A monoclonal antibody for the specific detection of cytochrome c in Western blots, typically detecting the protein at 12 kDa [88]. |
| Potassium Channel Modulators | Drugs that alter K+ flux across membranes. Used to study how a decrease in intracellular K+ concentration serves as an early, necessary signal for apoptosis activation [86]. |
Signaling Pathways and Experimental Workflow
The following diagrams, generated using the specified color palette, illustrate the key regulatory pathways and the experimental workflow for detecting cytochrome c release.
Diagram 1: Regulatory Pathways in Cytochrome c Release.
Diagram 2: Experimental Workflow for Fractionation.
Ensuring Data Fidelity: Cross-Validation and Specificity Controls
Correlating Cytochrome c Release with Downstream Apoptosome Formation and Caspase Activation
Core Concepts FAQ
1. What is the core sequence of events linking cytochrome c release to caspase activation? The core intrinsic apoptosis pathway follows a specific sequence: Cytochrome c Release → Apoptosome Formation → Caspase-9 Activation → Effector Caspase Activation. During intrinsic apoptosis, cytochrome c is released from the mitochondrial intermembrane space into the cytosol. Once in the cytosol, cytochrome c binds to the protein Apaf-1. This binding, in the presence of ATP/dATP, triggers Apaf-1 to oligomerize into a wheel-like complex called the apoptosome. The apoptosome then recruits and activates the initiator caspase, procaspase-9. Activated caspase-9 subsequently cleaves and activates effector caspases, such as caspase-3 and caspase-7, which execute the final stages of cell death [89] [90].
2. What are the key technical challenges in measuring cytochrome c release and apoptosome formation? The main challenges include the transient nature of cytochrome c release, the potential for rapid caspase-dependent feedback loops that can obscure initial release events, and the critical importance of maintaining cellular redox state during analysis. Furthermore, the heme-containing (holo) form of cytochrome c is required for apoptosome formation; the heme-deficient (apo) form can bind Apaf-1 and act as a competitive inhibitor, preventing apoptosome assembly and leading to false negatives in activation assays [91] [37].
3. My data shows cytochrome c release, but no caspase-3 activation. What could be the reason? This discrepancy can arise from several points of failure downstream of cytochrome c release. Key troubleshooting areas include:
- Inhibitory Proteins: Check for the presence of inhibitor of apoptosis proteins (IAPs) or heat shock protein 70 (Hsp70), which can bind and inhibit caspase activity or prevent procaspase-9 recruitment to the apoptosome.
- Apoptosome Assembly Failure: The presence of apo cytochrome c can inhibit the formation of the functional apoptosome complex.
- Caspase-9 Activation Failure: Ensure that the assay conditions (e.g., the presence of sufficient dATP/ATP) support apoptosome formation and caspase-9 activation.
- Experimental Model: Be aware that in some cellular models of apoptotic resistance, cells can release cytochrome c without subsequent caspase activation due to broader defects in upstream death signaling [91] [92] [84].
4. How can I confirm functional apoptosome formation in my experimental system? Functional apoptosome formation can be confirmed using several complementary techniques:
- Native Gel Electrophoresis: The apoptosome is a large (~1.3 MDa) complex that can be separated and identified on native PAGE gels.
- Size Exclusion Chromatography: This technique can isolate the high molecular weight apoptosome complex from cell lysates, as demonstrated in studies using purified proteins.
- Caspase-9 Activation Assay: The most functional readout is to directly measure the proteolytic activity of caspase-9 after immunoprecipitation of the complex.
- Dynamic BH3 Profiling: This modern functional assay measures changes in mitochondrial priming to apoptosis and can indirectly indicate downstream signaling competence, including apoptosome function [91] [93] [89].
Troubleshooting Guides
Problem: Inconsistent Cytochrome c Release Measurements
Potential Causes and Solutions:
| Potential Cause | Evidence | Recommended Solution |
|---|---|---|
| Incomplete Cell Fractionation | Cytochrome c detected in both cytosolic and mitochondrial fractions. | Optimize digitonin-based permeabilization protocol; use validated fractionation kits with purity controls. |
| Redox State Interference [37] | High basal ROS; results vary with antioxidant pre-treatments. | Use antioxidants like N-acetyl-l-cysteine (NAC) to control for redox-mediated permeability; standardize cellular redox state pre-assay. |
| Inadequate Positive Control | No release even with strong apoptotic inducers. | Include a robust positive control (e.g., UV irradiation, Staurosporine) and a Bax/Bak activator (e.g., BIM peptide) in BH3 profiling. |
| Inhibition by Apo Cytochrome c [91] | Cytochrome c is present cytosolically but apoptosome fails to form. | Use antibodies specific for the holo form of cytochrome c; check the heme status in cytosolic extracts. |
Problem: Failed Caspase Activation Despite Cytochrome c Release
Potential Causes and Solutions:
| Potential Cause | Evidence | Recommended Solution |
|---|---|---|
| Apoptosome Inhibition [91] | Apaf-1 and cytochrome c co-immunoprecipitate, but no caspase-9 is recruited. | Test for the presence of apo cytochrome c; use high-resolution size exclusion chromatography to check for proper oligomerization. |
| Direct Caspase Inhibition | High levels of XIAP or other IAPs detected; caspase-9 is present but inactive. | Co-treat with IAP antagonists (e.g., SMAC mimetics); use caspase activity assays specific for caspase-9. |
| Insufficient dATP/ATP | Assay works in cell extracts supplemented with dATP. | Ensure lysis and assay buffers contain sufficient levels (1-2 mM) of dATP/ATP to support apoptosome formation. |
| Upstream Signaling Defect [92] | Global lack of apoptotic response despite cytochrome c release; metabolic shift observed. | Characterize the metabolic state of cells; ensure the intrinsic pathway is fully engaged and not bypassed due to acquired resistance. |
Table 1: Key Caspases and Their Distinct Roles in Intrinsic Apoptosis [94]
| Caspase | Role in Apoptosis | Key Functions | Impact of Deficiency |
|---|---|---|---|
| Caspase-9 | Initiator Caspase | Cleaves and activates Bid, required for mitochondrial ROS production and morphological changes. | Blocks ROS production and mitochondrial remodeling. |
| Caspase-3 | Effector Caspase | Primary executioner caspase; inhibits ROS production. | Cells are less sensitive to death; ROS production is elevated and prolonged. |
| Caspase-7 | Effector Caspase | Mediates cell detachment from ECM; contributes to ROS production. | No significant resistance to death; cells remain attached. |
Table 2: Comparison of Methods for Detecting Apoptotic Events
| Method | Target | Readout | Key Advantage | Key Limitation |
|---|---|---|---|---|
| Immunoblotting / Fractionation | Cytochrome c | Subcellular localization | Well-established, semi-quantitative. | Disruptive; cannot track dynamics in live cells. |
| BH3 Profiling (Conventional) [93] | Mitochondrial Priming | Cytochrome c release (by flow cytometry) | Functional assessment of upstream state. | Requires permeabilization; complex protocol. |
| BH3 Drug Toolkit [93] | Anti-apoptotic Dependencies | Annexin V/7AAD staining (apoptosis) | Uses commercial drugs; no permeabilization needed; live-cell assay. | Measures late-stage apoptosis, not initial release. |
| Caspase Activity Assays | Caspase-3/7, -9 | Cleavage of fluorescent substrates | Highly sensitive and quantitative. | Does not distinguish upstream triggers. |
Standardized Experimental Protocols
Protocol 1: Detecting Cytochrome c Release via Cell Fractionation and Immunoblotting
Principle: This protocol separates mitochondrial and cytosolic cellular components to determine the localization of cytochrome c.
Procedure:
- Harvesting: Collect 1x10⁷ cells by centrifugation at 500 x g for 5 min at 4°C. Wash once with ice-cold PBS.
- Permeabilization: Resuspend the cell pellet in 1 mL of Digitonin Lysis Buffer (150 mM mannitol, 10 mM HEPES-KOH pH 7.5, 150 mM KCl, 1 mM EGTA, 1 mM EDTA, 0.1% BSA, 5 mM succinate, 0.25% poloxamer 188, and 0.025% digitonin). Incubate on ice for 10 minutes [93].
- Fraction Separation: Centrifuge the lysate at 12,000 x g for 10 minutes at 4°C. The supernatant now contains the cytosolic fraction. The pellet contains the mitochondria-rich fraction.
- Mitochondrial Lysis: Lyse the pellet in RIPA buffer containing protease inhibitors.
- Analysis: Subject both cytosolic and mitochondrial fractions to SDS-PAGE and immunoblotting. Probe for cytochrome c (to assess release), and use markers such as COX IV (mitochondrial) and β-tubulin (cytosolic) to confirm fraction purity.
Protocol 2: Functional Apoptosome Assay via Caspase-9 Activation
Principle: This assay measures the ability of a cell lysate to activate caspase-9, indicating functional apoptosome formation.
Procedure:
- Prepare Lysate: Lyse cells (5x10⁶) in 100 µL of MEB2 Buffer (without digitonin) via freeze-thaw cycles or gentle detergent. Centrifuge at 12,000 x g for 15 min to remove debris.
- Induce Apoptosome Formation: Incubate the supernatant (cytosolic extract) with 1 mM dATP and 10 µM purified cytochrome c for 1 hour at 37°C to promote apoptosome assembly [89].
- Measure Caspase-9 Activity: Add a caspase-9-specific fluorogenic substrate (e.g., LEHD-AFC) to the reaction mixture. Incubate at 37°C for 30-60 minutes.
- Quantification: Measure the fluorescence (excitation 400 nm, emission 505 nm) using a plate reader. Compare to a standard curve and control reactions lacking dATP/cytochrome c.
Pathway and Workflow Visualizations
The Scientist's Toolkit: Key Research Reagents
Table 3: Essential Reagents for Apoptosis Pathway Analysis
| Reagent | Function / Target | Application Example |
|---|---|---|
| Digitonin | Mild detergent for selective plasma membrane permeabilization. | Used in cell fractionation and conventional BH3 profiling to access mitochondria while keeping them intact [93]. |
| BH3 Mimetics (e.g., ABT-199/Venetoclax) | Small molecule inhibitors of anti-apoptotic proteins (BCL-2, MCL-1, BCL-XL). | Used in the BH3 drug toolkit to probe specific anti-apoptotic dependencies and measure mitochondrial priming [93]. |
| z-VAD-fmk | Pan-caspase inhibitor. | Used to block all caspase activity, allowing study of caspase-independent events or early caspase-dependent feedback loops [37] [94]. |
| N-acetylcysteine (NAC) | Antioxidant; boosts glutathione levels. | Used to control for redox-mediated regulation of cytochrome c release and to study the role of ROS in apoptosis [37]. |
| Apo Cytochrome c | Heme-deficient form of cytochrome c. | Used as a control to demonstrate competitive inhibition of apoptosome formation [91]. |
| SMAC Mimetics | Antagonists of IAP proteins. | Used to relieve caspase inhibition by IAPs, rescuing apoptosis in resistant models [84]. |
Implementing Positive and Negative Controls for Apoptotic Induction
Frequently Asked Questions
What are the essential controls for an apoptosis induction experiment? A robust experiment should include both a negative control (untreated healthy cells) and a positive control (cells treated with a known apoptosis inducer). Using a positive control, such as etoposide or cytochrome c, verifies that your detection system is working correctly and that your cells are capable of undergoing apoptosis under your experimental conditions [95].
My positive control is not showing expected apoptosis; what could be wrong? If your positive control fails, first verify the viability and health of your cell culture at the start of the experiment. Unhealthy cells can lead to misleading results. Second, confirm the preparation, concentration, and incubation time of your apoptosis-inducing reagent. For instance, a final concentration of 25 µM etoposide for 5 hours is used to generate a reliable positive control in Jurkat cells [95]. Finally, ensure you are using an appropriate detection method and that your antibodies are specific for the apoptotic markers (e.g., cleaved caspases) you are measuring.
I observe high background apoptosis in my negative control; how can I fix this? Strong staining or high death in negative controls often points to cell damage during harvesting or processing [96]. Handle cells gently, avoid excessive vortexing or centrifugation, and use a freshly prepared, high-quality cell culture. Additionally, ensure that the growth conditions (media, serum, confluence) are optimal to maintain basal cell health.
I've confirmed cytochrome c release, but see no downstream caspase activation. Why? This discrepancy suggests a failure in the intrinsic apoptosis pathway after cytochrome c release. Check for the presence of other necessary components for the apoptosome formation, such as dATP [95]. Furthermore, consider that certain cell lines or primary cells may have high levels of Inhibitor of Apoptosis Proteins (IAPs), which can block caspase activation. The use of caspase control cell extracts can help pinpoint where the pathway is failing [95].
Why are my cytochrome c release measurements inconsistent between experiments? Inconsistency can arise from several factors. Kinetics are critical; cytochrome c release can be very rapid (completed in about 5 minutes in some systems), so your sampling time points may be missing the event [36]. The method of detection is also important. Western blotting of whole-cell lysates may not be sensitive enough compared to flow cytometry or live-cell imaging, which can detect release at a single-cell level [36] [97]. Finally, the morphology of mitochondria and the fraction of cytochrome c that is bound to cardiolipin in the inner membrane can influence its availability for release [66].
Troubleshooting Guide: Cytochrome c Release
| Problem | Potential Cause | Suggested Solution |
|---|---|---|
| No cytochrome c release detected | Inefficient apoptosis induction; Incorrect timing. | Validate inducer efficacy with a positive control caspase assay. Kinetics vary; take frequent early timepoints [36]. |
| High background release in controls | Unhealthy cells; Mechanical damage during processing. | Use low-passage, healthy cells. Handle samples gently; minimize centrifugation steps [96]. |
| Inconsistent results between replicates | Heterogeneous cell population; Variable reagent treatment. | Ensure uniform cell seeding and reagent addition. Use single-cell analysis (flow cytometry) over bulk methods [97]. |
| Cytochrome c release without caspase-3 cleavage | Defective apoptosome formation; High IAP protein levels. | Verify presence of Apaf-1 and dATP/ATP. Consider using SMAC mimetics to antagonize IAPs [98]. |
| Poor signal in Western Blot | Insufficient protein transfer or antibody specificity. | Use control cell extracts (e.g., Caspase-3 Control Cell Extracts) to confirm antibody performance [95]. |
Research Reagent Solutions
The table below lists key reagents essential for studying apoptosis and cytochrome c release.
| Item | Function & Application |
|---|---|
| Etoposide | A chemical inducer of DNA damage, triggering the intrinsic apoptotic pathway. Used to generate positive control extracts (e.g., at 25 µM for 5 hours in Jurkat cells) [95]. |
| Cytochrome c | When added to cell-free systems or the cytoplasm of permeabilized cells, it directly initiates apoptosome formation, serving as a definitive positive control for the intrinsic pathway [95]. |
| Caspase-3 Control Cell Extracts | A ready-to-use lysate from cytochrome c-treated Jurkat cells that contains cleaved caspase-3 and other apoptotic markers, ideal for validating Western blot antibodies and protocols [95]. |
| Fluorochrome-Labeled Inhibitors of Caspases (FLICA) | Cell-permeable probes that bind covalently to active caspases, allowing for real-time detection and quantification of caspase activity in live cells by flow cytometry [97] [99]. |
| Annexin V Conjugates | A protein that binds to phosphatidylserine (PS) exposed on the outer leaflet of the plasma membrane in early apoptosis. Used in combination with viability dyes (like PI) to stage cell death [97] [96]. |
| Tetramethylrhodamine Methyl Ester (TMRM) | A cationic dye that accumulates in active mitochondria based on membrane potential (ΔΨm). Loss of fluorescence signal indicates mitochondrial depolarization, an early apoptotic event [97]. |
Standard Protocol: Induction and Validation of Apoptosis
This protocol provides a framework for inducing apoptosis and validating the process through cytochrome c release and caspase activation.
1. Apoptosis Induction via the Extrinsic Pathway (using Anti-Fas)
- Cell Preparation: Grow Jurkat cells in RPMI-1640 with 10% FBS. Harvest exponentially growing cells (1x10⁵ cells/mL) by centrifugation at 300–350 x g for 5 minutes [100].
- Induction: Resuspend cells in fresh medium to a final concentration of 5x10⁵ cells/mL. Add anti-Fas (anti-CD95) monoclonal antibody to the recommended concentration. Incubate for 2–4 hours in a 37°C, 5% CO₂ incubator [100].
- Controls: Include a negative control (untreated cells) and a positive control (e.g., cells treated with 1-10 µM Staurosporine) [100].
2. Apoptosis Induction via the Intrinsic Pathway (using Chemical Agents)
- Cell Seeding: Inoculate adherent or suspension cells at ~1x10⁶ cells/mL in appropriate culture vessels [100].
- Treatment: Add cellular-damaging agents. For example:
- Harvesting: Harvest cells at multiple time points (e.g., 8, 16, 24, 48 hours) by centrifugation. Wash the cell pellet with PBS before proceeding to analysis [100].
3. Detection of Apoptotic Markers
- Cytochrome c Release: Monitor using live-cell imaging with cytochrome c-GFP constructs or by immunofluorescence in fixed cells. The release is typically rapid and complete within minutes [36].
- Caspase Activation:
- FLICA Assay: Resuspend ~3x10⁵ cells in 100 µL PBS. Add 3 µL of FLICA working solution and incubate for 60 minutes at 37°C, protected from light. Wash with PBS and analyze by flow cytometry [97].
- Western Blotting: Prepare cell lysates. Use control extracts (e.g., #9663 for caspase-3) to detect cleavage of caspases (e.g., caspase-3, -9) and substrates like PARP [95].
- Phosphatidylserine Exposure (Annexin V Assay): Resuspend ~1x10⁵ cells in 100 µL of Annexin V Binding Buffer containing Annexin V conjugate and a viability dye like propidium iodide (PI). Incubate for 15-20 minutes at room temperature in the dark. Analyze by flow cytometry without washing [97] [96].
Apoptosis Signaling Pathway
This diagram illustrates the key steps in the intrinsic apoptosis pathway, culminating in cytochrome c release and caspase activation.
Experimental Workflow for Apoptosis Assays
This workflow outlines the key steps for processing and analyzing cells in an apoptosis experiment.
FAQs on Cytochrome c Release Experiments
Q1: Our cytochrome c release assays are inconsistent, even with Bak/Bax DKO cells. What could be causing this? A primary reason for inconsistent results is the activation of alternative, non-canonical cell death pathways. Research has demonstrated that while Bax/Bak DKO cells are largely resistant to many apoptotic stimuli, they can still undergo cytochrome c release and caspase-dependent death via other mechanisms. One study showed that the combination of a calcium ionophore (A23187) and arachidonic acid could induce this release in DKO mouse embryonic fibroblasts. This Bax/Bak-independent pathway was sensitive to serine protease inhibitors but not to overexpression of anti-apoptotic Bcl-2 proteins, indicating a fundamentally different mechanism [101]. Ensure you are accounting for potential off-target effects of your pharmacological agents and include appropriate controls for these alternative pathways.
Q2: Why does a novel Bcl-2 inhibitor sometimes cause cell death instead of preventing it? The effect of binders targeting the core apoptotic proteins Bak and Bax can be concentration-dependent. Computationally designed protein binders have shown that at low concentrations, they can activate their targets, driving pore formation and cytochrome c release. Inhibition of membrane permeabilization typically occurs only when the binder is present in excess, saturating the binding sites on Bak or Bax and preventing their self-association into pore-forming oligomers [102]. Therefore, titrating your inhibitor and performing careful dose-response studies is crucial. The "inhibitor" may be acting as an activator at lower, non-saturating concentrations.
Q3: What are the essential controls for validating the specificity of a Bcl-2 inhibitor in a cytochrome c release assay? To confidently attribute your results to the specific inhibition of Bcl-2, your experimental design should include the following key controls:
- Genetic Control: Use cells where the target protein (e.g., Bcl-2) has been genetically knocked down or out. The phenotype of these cells should resemble that of inhibitor treatment.
- Positive Functional Control: Use a known, potent inducer of MOMP, such as the recombinant BH3-only protein BIM or a peptide corresponding to its BH3 domain, to confirm your mitochondrial preparations are functional and capable of releasing cytochrome c [103].
- Rescue Control: If using a selective Bcl-2 inhibitor like venetoclax, demonstrate that its effects are diminished in cells overexpressing Bcl-2 [13].
Q4: How can we confirm that Bak/Bax is truly activated in our experiments? Beyond measuring the downstream event of cytochrome c release, you can use specific biochemical assays to probe Bak/Bax activation directly:
- Conformational Change: Immunoprecipitation using antibodies that recognize exposed N-terminal or BH3 domains of Bak or Bax can confirm activation-associated conformational changes [103].
- Oligomerization: Chemical crosslinking followed by western blotting can detect the formation of Bak/Bax higher-order oligomers, which are indicative of their active, pore-forming state [103].
Experimental Protocols for Validation
Protocol 1: In Vitro Cytochrome c Release Assay Using Isolated Mitochondria This assay is ideal for directly testing the functional impact of Bcl-2 family proteins and inhibitors on mitochondria.
- Mitochondrial Isolation: Homogenize cells (e.g., mouse liver or cultured cells) in a detergent-free, isotonic buffer (e.g., containing mannitol and sucrose). Isolate the heavy membrane fraction containing intact mitochondria via differential centrifugation [103].
- Release Reaction: Incubate isolated mitochondria (e.g., 50-100 µg protein) with your experimental components (e.g., recombinant tBid, BIM BH3 peptide, Bcl-2 inhibitor) in a release buffer. A typical reaction is carried out at 30°C for 30-60 minutes [103].
- Termination and Analysis: Stop the reaction by pelleting the mitochondria by centrifugation. Collect the supernatant (containing released cytochrome c) and analyze it by western blotting using an anti-cytochrome c antibody [103] [104].
Protocol 2: Validating Bak Activation via Immunoprecipitation This method assesses Bak activation by detecting its conformational change.
- Cell Treatment and Lysis: Treat cells with your apoptotic stimulus or inhibitor. Lyse cells in a mild, non-denaturing detergent (e.g., CHAPS buffer) to preserve protein interactions and conformations.
- Immunoprecipitation: Incubate the cell lysate with an antibody that specifically recognizes the activated conformation of Bak (often an antibody that binds to an exposed N-terminal epitope). Use protein A/G beads to pull down the antibody-protein complex.
- Detection: Analyze the immunoprecipitate by western blotting using a pan-Bak antibody to confirm the amount of activated Bak that was pulled down [104].
Table 1: Phenotypic Comparison of Bax/Bak Genetically Modified Cells in Response to Apoptotic Stimuli
| Genotype | Response to TNF-α | Response to Etoposide | Response to A23187/ArA | Key Molecular Feature |
|---|---|---|---|---|
| Wild-Type (WT) | Cytochrome c release, Apoptosis [105] | Cytochrome c release, Apoptosis [104] | Cytochrome c release, Apoptosis [101] | Canonical apoptotic pathway intact. |
| Bax-/- | Cytochrome c release, Apoptosis [105] | Not Provided | Not Provided | Functional Bak permits apoptosis. |
| Bak-/- | Cytochrome c release, Apoptosis [105] | Not Provided | Not Provided | Functional Bax permits apoptosis. |
| Bax/Bak DKO | Resistant: No cytochrome c release [105] | Resistant: No Bak activation or cytochrome c release [104] | Sensitive: Cytochrome c release via serine proteases [101] | Lacks core apoptotic executioners but has alternative pathways. |
Table 2: Profile of Selected Pharmacological Agents Targeting BCL-2 Family
| Agent / Tool | Primary Target(s) | Functional Outcome | Critical Consideration |
|---|---|---|---|
| Venetoclax (ABT-199) | BCL-2 (Selective) [13] | Inhibits anti-apoptotic function, promotes apoptosis. | Specific to BCL-2; less effective if MCL-1 or BCL-xL are primary survival proteins. |
| ABT-263 (Navitoclax) | BCL-2, BCL-xL, BCL-w [13] | Inhibits anti-apoptotic function, promotes apoptosis. | On-target thrombocytopenia due to BCL-xL inhibition. |
| Designed Binder (BAK-CDP02) | BAK (High Specificity) [102] | Low Conc.: Activates BAK, pore formation.High Conc.: Inhibits membrane permeabilization. | Effect is strictly concentration-dependent. |
| Designed Binder (BAX-CDP01) | BAX (High Specificity) [102] | Low Conc.: Activates BAX, pore formation.High Conc.: Inhibits membrane permeabilization. | Effect is strictly concentration-dependent. |
| 4-(2-Aminoethyl)benzenesulfonylfluoride | Serine Proteases [101] | Inhibits Bax/Bak-independent cytochrome c release. | Control for alternative death pathways. |
The Scientist's Toolkit
Table 3: Essential Research Reagents for Bak/Bax and Cytochrome c Studies
| Reagent | Function / Application | Example |
|---|---|---|
| Bax/Bak DKO Cells | Definitive genetic model to establish the necessity of Bax/Bak for the intrinsic apoptotic pathway under study [105]. | Mouse embryonic fibroblasts (MEFs). |
| Recombinant BH3-only Proteins/Peptides | Direct activators of Bax/Bak; used as positive controls in cytochrome c release assays [103]. | Recombinant tBid, BIM BH3 peptide. |
| Conformation-Specific Antibodies | Detect activation-induced conformational changes in Bak and Bax (e.g., exposure of N-terminus or BH3 domain) [103]. | Anti-Bak (NT) antibody. |
| BCL-2 Family Inhibitors | Pharmacological tools to inhibit anti-apoptotic proteins and test dependence of a cell system on a specific pro-survival protein [13]. | Venetoclax (BCL-2 inhibitor). |
| Serine Protease Inhibitors | Controls for Bax/Bak-independent, serine protease-mediated cytochrome c release mechanisms [101]. | AEBSF. |
Signaling Pathways and Workflows
Canonical and Alternative Cytochrome c Release Pathways
In Vitro Cytochrome c Release Assay Workflow
Inconsistent results when measuring cytochrome c release are a significant hurdle in apoptosis research, potentially stemming from technical limitations, sample preparation artifacts, or the inherent biological variability of the process. Cytochrome c plays a dual role in cellular fate, functioning as a crucial electron carrier in the mitochondrial respiratory chain under normal conditions and as a key initiator of the intrinsic apoptosis pathway upon its release into the cytosol [106] [107]. Selecting the appropriate detection technique is paramount for obtaining accurate, reliable, and biologically relevant data. This guide compares three core methodologies—Western blotting, biosensors, and live-cell imaging—to help you troubleshoot inconsistencies and choose the optimal approach for your experimental questions.
Technical Comparison at a Glance
The table below summarizes the key characteristics of each technique to aid in selection.
| Feature | Western Blot | Biosensors | Live-Cell Imaging |
|---|---|---|---|
| Key Readout | Semi-quantitative detection of cytochrome c in subcellular fractions [88]. | Real-time, quantitative measurement of concentration, localization, or conformational changes [108] [109]. | Dynamic, spatio-temporal tracking of release in individual living cells [110]. |
| Temporal Resolution | Low (Static, endpoint measurement) [110]. | High (Real-time to near real-time) [108]. | Very High (Continuous real-time tracking) [110]. |
| Spatial Resolution | No spatial context (population average from lysates) [108]. | Good to High (Can achieve subcellular resolution) [108]. | High (Single-cell and subcellular resolution) [110]. |
| Throughput | Medium | Potentially High (Array-based formats) [109]. | Low (Can be scaled but is time-intensive) [110]. |
| Primary Advantage | Well-established, direct protein detection, widely accessible. | High sensitivity and potential for multiplexing. | Reveals cell-to-cell heterogeneity and kinetic profiles [110]. |
| Key Limitation | Provides only a population average, missing single-cell events [110] [108]. | Can require complex development and validation. | Risk of phototoxicity and photobleaching; complex data analysis [110]. |
| Best Suited For | Confirming cytochrome c release and fraction purity in population studies. | Sensitive, quantitative detection of release or conformational states. | Investigating kinetics, variability, and rare events in apoptosis. |
Detailed Experimental Protocols
Western Blot for Cytochrome c Release
This is a standard biochemical method for confirming the translocation of cytochrome c from the mitochondria to the cytosol during apoptosis [111] [88].
Workflow
Key Reagents and Materials
| Research Reagent | Function |
|---|---|
| Cytosol Extraction Buffer | A hypotonic buffer used to swell cells and prepare them for gentle mechanical disruption without damaging mitochondrial membranes [111] [88]. |
| Protease Inhibitor Cocktail | Added freshly to lysis buffers to prevent degradation of cytochrome c and other proteins by cellular proteases during the extraction process [111] [112]. |
| DTT (Dithiothreitol) | A reducing agent that helps maintain a reducing environment and protein stability [88]. |
| Anti-Cytochrome c Antibody | A monoclonal antibody specific for denatured cytochrome c, used for immunodetection on the Western blot [88]. |
| Mitochondrial Extraction Buffer | Used to resuspend and lyse the purified mitochondrial pellet for analysis of the retained cytochrome c [111]. |
| Organelle Markers (e.g., VDAC1, β-actin) | Antibodies against marker proteins (VDAC1 for mitochondria, β-actin for cytosol) are essential controls for assessing fraction purity and cross-contamination [111]. |
Critical Step-by-Step Instructions
- Step 3: Homogenization. Use a pre-chilled Dounce homogenizer and perform 30-50 passes on ice. Troubleshooting Tip: Check homogenization efficiency by mixing 2-3 µL of homogenate with a dye and viewing under a microscope. >70-80% of nuclei should lack a shiny ring; otherwise, perform 10-20 more passes. Avoid excessive homogenization to prevent artificial mitochondrial damage [111].
- Step 6: Fraction Collection. After the final 10,000 x g centrifugation, the supernatant is the cytosolic fraction. The pellet is the mitochondrial fraction. For a cleaner mitochondrial fraction, wash the pellet by resuspending it in extraction buffer and centrifuging again at 10,000 x g for 15 minutes [111].
- Step 8: Controls. Always load and probe both cytosolic and mitochondrial fractions from both untreated (negative control) and apoptosis-induced (positive control) samples simultaneously. Include organelle markers to verify fraction purity [111].
Biosensors for Cytochrome c Detection
Biosensors leverage biological elements combined with a transducer to detect specific analytes. Surface-Enhanced Raman Spectroscopy (SERS) biosensors can detect cytochrome c release with high sensitivity and spatial information [108].
Workflow
Key Reagents and Materials
| Research Reagent | Function |
|---|---|
| 3D Bifunctional SERS Substrate | A engineered nanostructure (e.g., gold octahedral monolayer) that greatly enhances the Raman scattering signal of molecules near its surface, allowing for ultra-sensitive, label-free detection [108]. |
| Mitochondria-Targeting SERS Nanoprobe | A nanoparticle functionalized with a mitochondrial targeting signal (e.g., Mitochondrial Localization Sequence). It is co-released with cytochrome c upon MOMP, serving as a validation tool for the release event [108]. |
| Photothermal Agent | A component (e.g., gold nanorod@palladium cuboid layer) integrated into some bifunctional substrates that can induce localized hyperthermia to trigger apoptosis, simultaneously allowing for the induction of cell death and detection [108]. |
Critical Step-by-Step Instructions
- Step 1: Substrate Fabrication. Engineered 3D bifunctional substrates are synthesized to have both optimized photothermal conversion efficiency and strong SERS enhancement capabilities. This allows for in-situ induction and detection of apoptosis [108].
- Step 5: SERS Measurement. The substrate captures the unique Raman "fingerprint" of cytochrome c. This allows for label-free detection and can map the spatial distribution of cytochrome c around single apoptotic cells with subcellular resolution [108].
Live-Cell Imaging of Cytochrome c Release
This approach uses fluorescent probes to visualize the release of cytochrome c from mitochondria in real-time within individual living cells, capturing dynamic heterogeneity [110].
Workflow
Key Reagents and Materials
| Research Reagent | Function |
|---|---|
| Cytochrome c-Fluorescent Protein Fusion (e.g., Cyt c-GFP) | A genetically encoded reporter where cytochrome c is tagged with a fluorescent protein (e.g., GFP). Its translocation from a punctate mitochondrial pattern to a diffuse cytosolic pattern is visually tracked during apoptosis [110]. |
| Mitochondrial Dye (e.g., TMRM) | A fluorescent dye that accumulates in active mitochondria based on membrane potential (ΔΨm). Used as a counterstain to visualize mitochondrial morphology and health alongside cytochrome c release [110]. |
| Spinning Disc Confocal System | A microscopy system preferable for 4D live-cell imaging. It provides high image acquisition rates, confocal sectioning, and lower phototoxicity compared to conventional laser scanning microscopes, reducing cellular stress during long-term experiments [110]. |
Critical Step-by-Step Instructions
- Step 1: Reporter Selection. Transfect cells with a fluorescent reporter, such as cytochrome c-GFP or Smac-mCherry. Using two colors (e.g., one for cytochrome c and one for a mitochondrial marker) allows for more precise correlation of release events with mitochondrial location [110].
- Step 4-6: Image Acquisition. After acquiring a baseline image, add the apoptotic inducer during ongoing time-lapse acquisition. Use a spinning disc confocal microscope with an environmental chamber (maintaining 37°C and 5% CO₂) to ensure cell viability. Troubleshooting Tip: Use low laser power and minimize acquisition frequency to reduce phototoxicity and photobleaching, which are major pitfalls in live-cell imaging [110].
Frequently Asked Questions (FAQs) for Troubleshooting
Q1: My Western blot shows cytochrome c in the cytosolic fraction of my control, untreated cells. What is the most likely cause?
- A: This typically indicates mitochondrial impairment during sample preparation. The most common causes are overly harsh homogenization or using outdated/warm lysis buffers. Ensure all steps are performed on ice with pre-chilled buffers containing fresh protease inhibitors. Verify homogenization efficiency microscopically and avoid excessive passes. Always include a western blot for a mitochondrial marker (e.g., VDAC1) in your cytosolic fractions to check for purity [111].
Q2: I am using a live-cell imaging approach, but my cells die or show morphological changes before cytochrome c release. What could be wrong?
- A: This is a classic sign of phototoxicity. The high-intensity light from the microscope, especially with lasers, can damage cells and induce artificial stress.
- Solutions: Reduce laser power and exposure time. Increase the interval between time-lapse acquisitions. Use a microscope system designed for live-cell imaging (e.g., spinning disc confocal) that is more light-efficient. Always include control cells that are plated and treated similarly but not imaged, to confirm that the observed cell death is due to the apoptotic stimulus and not the imaging process itself [110].
Q3: My biosensor data is noisy and inconsistent. How can I improve the signal-to-noise ratio?
- A: Inconsistent signals in biosensing, particularly for SERS, can stem from inhomogeneous substrate fabrication or non-specific binding.
- Solutions: Ensure rigorous and reproducible fabrication of the plasmonic nanostructures. Incorporate specific capture elements (e.g., antibodies) if possible, or use label-free internal standards for normalization. For in-cell assays, validate the biosensor readout with a complementary technique, such as using a mitochondria-targeting nanoprobe to confirm co-release with cytochrome c [108].
Q4: I see clear cytochrome c release in single cells via live-cell imaging, but my Western blot from a parallel experiment shows a weak cytosolic signal. Why the discrepancy?
- A: This highlights the critical difference between single-cell and population-averaged measurements. The release event may be asynchronous; at the time of harvesting, only a small percentage of cells may have undergone release, diluting the signal in the bulk population lysate.
- Solutions: Use the live-cell imaging data to determine the precise timing and percentage of responsive cells. For Western blot, you may need to optimize the time point of harvest or use a more synchronized apoptosis induction method. This discrepancy is a key reason why live-cell imaging is superior for capturing heterogeneity [110] [108].
Frequently Asked Questions
FAQ: Is cytochrome c release always a point of no return for the cell? No, cytochrome c release does not always commit a cell to die. Research has shown that cells can recover from near-death states, even after the initiation of apoptotic signaling, through a process called anastasis [113]. The duration of the mitochondrial permeability transition pore (PTP) opening is a critical factor; short openings may be reversible and have little impact on viability, while longer openings correlate with cytochrome c release and cell death [9].
FAQ: Why do I detect inconsistent levels of cytochrome c release in my experiments? Inconsistent measurements can arise from several factors:
- Heterogeneous Mitochondrial Populations: Individual cells can contain a mixed population of mitochondria. Some may release their cytochrome c while others, which maintain respiratory function, do not [114]. This heterogeneity can lead to varying measurements between samples.
- Subcellular Redox Changes: The redox state of cytochrome c itself can change due to signaling molecules like nitric oxide (NO), shifting from ferrous (Fe²⁺) to ferric (Fe³⁺) without immediately triggering apoptosis [115]. This can affect detection assays.
- Incomplete IMM Remodeling: Efficient cytochrome c release requires remodeling of the inner mitochondrial membrane (IMM) to mobilize the protein from cristae. Inefficient remodeling, potentially due to low levels of proteins like LACTB, can lead to incomplete or variable release [116].
FAQ: What are the key regulators of cytochrome c release I should check when my experiments fail? Your experimental checklist should include these key regulators:
- BAX/BAK Pores: The primary drivers of mitochondrial outer membrane permeabilization (MOMP) [106] [116].
- LACTB: A serine protease tumor suppressor that promotes apoptosis by remodeling the inner mitochondrial membrane, facilitating the release of cytochrome c and other factors [116].
- Post-Translational Modifications: Phosphorylation, acetylation, nitration, or oxidation of cytochrome c can alter its function in both electron transport and apoptosis [106].
- Cardiolipin Peroxidation: Cytochrome c must be detached from the inner membrane phospholipid cardiolipin before release, a process regulated by its redox activity [106].
Troubleshooting Guides
Problem: Inconsistent Cytochrome c Release Measurements
Potential Causes and Solutions
| Potential Cause | Supporting Evidence | Recommended Troubleshooting Action |
|---|---|---|
| Heterogeneous Mitochondrial Response | Pre-apoptotic cells display two subsets of mitochondria: one with normal cytochrome c function and another with dysfunctional, orthodox mitochondria [114]. | - Use high-resolution imaging (e.g., Airyscan microscopy) to assess cytochrome c localization in single cells [116].- Correlease measurements with mitochondrial membrane potential dyes (e.g., TMRM) to assess functional heterogeneity [9]. |
| Inefficient IMM Remodeling | LACTB is required for apoptosis-induced remodeling of the inner membrane. Its knockdown reduces cytochrome c release without affecting BAX/BAK recruitment [116]. | - Validate efficiency of apoptotic stimuli to induce IMM remodeling.- Check LACTB expression via Western blot (KD: ~98.5% reduction; OE: stable overexpression) [116]. |
| Transient PTP Opening | Short PTP openings detected by calcein release may not cause depolarization or cytochrome c release, while longer openings correlated with cell death [9]. | - Use multiparameter assays combining calcein quenching with TMRM (depolarization) and cytochrome c immunofluorescence.- Employ caspase inhibitors (e.g., Q-VD-OPh) to distinguish between initial release and full commitment [116]. |
| Altered Cytochrome c Redox State | Nitric oxide (NO) can induce a shift in cytochrome c from the ferrous (CytC-FeII) to ferric (CytC-FeIII) state via peroxynitrite (ONOO−) [115]. | - Use resonance Raman imaging to monitor redox state [115].- Include scavengers (PEG-SOD, NecroX-5) or NOS inhibitors (L-NAME) in experiments involving NO signaling [115]. |
Problem: Poor Apoptotic Response Despite Cytochrome c Release
Potential Causes and Solutions
| Potential Cause | Supporting Evidence | Recommended Troubleshooting Action |
|---|---|---|
| Defective Apoptosome Formation | The K72A mutant of cytochrome c retains electron transfer function but fails to activate APAF1, leading to defective apoptosome formation and disrupted apoptosis [106]. | - Sequence the CYCS gene in your model system to check for mutations that disrupt APAF1 binding.- Confirm apoptosome formation using native gels or size-exclusion chromatography. |
| Sublethal MOMP / Anastasis | Cells can recover after MOMP induction. Cytochrome c translocation to the cytosol in the context of sublethal MOMP can enhance the survival of drug-resistant persister cells [106] [113]. | - Monitor cells over an extended time course to assess long-term viability and potential recovery.- Inhibit pro-survival pathways activated during revival (e.g., NF-κB signaling) [113]. |
| Inadequate ATP Levels | Apoptosis is an energy-dependent process. Maintaining a subset of functional, cytochrome c-containing mitochondria with dilated intracristal spaces may be necessary to produce ATP for the execution of apoptosis [114]. | - Measure intracellular ATP levels during apoptosis induction.- Ensure culture conditions provide adequate energy substrates. |
Experimental Protocols
Protocol 1: Assessing Cytochrome c Release by Subcellular Fractionation and Western Blot
This protocol is adapted from methods used to establish LACTB's role in cytochrome c release [116].
Key Reagents and Solutions
- Staurosporine: 1 µM, prepared in DMSO. A broad-spectrum kinase inducer of intrinsic apoptosis.
- ABT-S Cocktail: Combination of ABT-737 (1 µM, Bcl-2 inhibitor) and S63845 (1 µM, Mcl-1 inhibitor). Specific activator of BAX/BAK pores.
- Q-VD-OPh: 10 µM, prepared in DMSO. Pan-caspase inhibitor for experiments requiring caspase-independent assessment.
- LACTB Antibodies: Validated antibodies for knockdown/overexpression confirmation.
- Mitochondrial Lysis Buffer: Mannitol 220 mM, Sucrose 70 mM, HEPES 5 mM (pH 7.4), EDTA 1 mM, plus fresh protease inhibitors.
Step-by-Step Methodology
- Induce Apoptosis: Treat cells (e.g., HeLa, U2-OS) with chosen apoptotic stimulus (e.g., 1 µM staurosporine or ABT-S cocktail) for desired time (e.g., 30 min to 6 hours). Include a caspase inhibitor like Q-VD-OPh if needed.
- Harvest and Wash: Collect both attached and floating cells by centrifugation (500 x g, 5 min). Wash cell pellet with ice-cold PBS.
- Fractionate Cytosol and Mitochondria:
- Resuspend cell pellet in 5 volumes of ice-cold mitochondrial lysis buffer.
- Homogenize on ice with 20-30 strokes in a Dounce homogenizer. Check for >90% cell lysis by trypan blue staining.
- Centrifuge homogenate at 1,000 x g for 10 min at 4°C to remove nuclei and unbroken cells.
- Transfer supernatant to a new tube and centrifuge at 12,000 x g for 15 min at 4°C.
- The resulting supernatant is the cytosolic fraction. The pellet is the heavy membrane fraction enriched with mitochondria.
- Analyze by Western Blot: Probe cytosolic fractions for cytochrome c, SMAC/Diablo, AIF, and HTRA2/Omi. Use COX IV as a mitochondrial marker to confirm fractionation purity and β-actin as a loading control for the cytosol.
Protocol 2: Immunofluorescence Microscopy for Visualizing Cytochrome c Release
This protocol allows for single-cell analysis of cytochrome c release, capturing heterogeneous responses [114] [116].
Key Reagents and Solutions
- Paraformaldehyde (PFA): 4% in PBS, for cell fixation.
- Triton X-100: 0.1-0.3% in PBS, for permeabilization.
- Primary Antibodies: Anti-cytochrome c antibody (clone 6H2.B4), anti-TOM20 (for outer mitochondrial membrane), anti-ATP synthase β subunit (for inner mitochondrial membrane/cristae).
- Mounting Medium with DAPI: For nuclear counterstaining.
Step-by-Step Methodology
- Culture and Treat Cells: Seed cells on sterile glass coverslips in a culture dish. Induce apoptosis as required.
- Fix and Permeabilize: At the desired time point, carefully rinse cells with warm PBS and fix with 4% PFA for 15 min at room temperature. Rinse and permeabilize with 0.3% Triton X-100 for 10 min.
- Stain and Mount:
- Block with 5% BSA in PBS for 1 hour.
- Incubate with primary antibodies (e.g., cytochrome c and TOM20) diluted in blocking buffer overnight at 4°C.
- Wash and incubate with appropriate fluorescent secondary antibodies for 1 hour at room temperature in the dark.
- Wash and mount coverslips onto glass slides using mounting medium with DAPI.
- Image and Analyze: Image using confocal or super-resolution (e.g., Airyscan) microscopy. A punctate, mitochondrial pattern indicates retention, while a diffuse, cytoplasmic pattern indicates release. Quantify the percentage of cells with diffuse staining across multiple fields.
Signaling Pathways and Workflows
Pathway from Cytochrome c Release to Cell Fate Decision
Troubleshooting Workflow for Inconsistent Data
The Scientist's Toolkit: Key Research Reagents
| Reagent / Tool | Function in Experiment | Key Considerations & Validation |
|---|---|---|
| BAX/BAK Antibodies | Detect pore formation during MOMP, a key upstream event. | Stringent validation is critical [117]. Use knockout cell controls (e.g., Bax⁻/⁻Bak⁻/⁻ MEFs) to confirm specificity [118]. |
| LACTB Modulators | Knockdown (KD) or overexpress (OE) to investigate role in IMM remodeling and cytochrome c release. | Confirm KD efficiency (>98%) via immunofluorescence and Western [116]. Check that LACTB OE does not affect PISD levels [116]. |
| Caspase Inhibitors (Q-VD-OPh) | Pan-caspase inhibitor to dissect caspase-dependent and -independent processes. | Use to prevent cell detachment during imaging and to study events upstream of caspase activation [116]. |
| Membrane Potential Dyes (TMRM) | Assess mitochondrial depolarization, which correlates with prolonged PTP opening and cell death [9]. | Correlate with calcein release assays. Short PTP openings may not cause depolarization [9]. |
| Cytochrome c Redox Probes | Monitor the oxidation state of cytochrome c, which can be an early marker of stress. | Use resonance Raman imaging. Note that NO inducers can shift CytC-FeII to CytC-FeIII via ONOO− [115]. |
| Apoptosis Inducers (Staurosporine, ABT-S) | Activate intrinsic apoptosis pathway to trigger cytochrome c release. | ABT-S cocktail specifically targets Bcl-2 family proteins. Staurosporine is a broader kinase inhibitor [116]. |
Conclusion
Inconsistent cytochrome c release measurements often stem from a complex interplay of biochemical, methodological, and biological variables. A thorough understanding of the foundational science—particularly the critical influence of ionic strength on electrostatic binding and the precise regulation by BCL-2 family proteins—is non-negotiable. Success hinges on meticulous optimization of experimental conditions, especially buffer composition, and the implementation of robust validation strategies that link cytochrome c release to functional apoptotic endpoints. As detection technologies advance towards single-cell spatial resolution, the field moves closer to uncovering cell-to-cell heterogeneity in apoptotic commitment. Embracing these integrated troubleshooting principles will significantly improve data reliability, accelerating research in cancer biology, neurodegenerative diseases, and the development of therapeutics designed to modulate cell death pathways.
References
- 1. Release of Cytochrome c, Bax Migration, Bid Cleavage, and ... [https://pmc.ncbi.nlm.nih.gov/articles/PMC1867016/]
- 2. Identity, structure, and function of the mitochondrial ... [https://www.nature.com/articles/s41418-023-01187-0]
- 3. Sublethal cytochrome c release generates drug-tolerant ... [https://www.sciencedirect.com/science/article/pii/S0092867422009783]
- 4. Plasma Cytochrome c Detection Using a Highly Sensitive ... [https://pmc.ncbi.nlm.nih.gov/articles/PMC5731609/]
- 5. Immunodetection of cytochrome c by flow cytometry after ... [https://pubmed.ncbi.nlm.nih.gov/16680678/]
- 6. Multiplexed and reproducible high content screening of live ... [https://www.nature.com/articles/s41467-022-34536-7]
- 7. Troubleshooting Flow Cytometry Issues [https://www.bosterbio.com/protocol-and-troubleshooting/flow-cytometry-troubleshooting?srsltid=AfmBOor4XsbGpGlG4GCfOfl2uK75Mu-r0Z0lyzkBijIYBx448W9Noj05]
- 8. The mitochondrial permeability transition, release of ... [https://pubmed.ncbi.nlm.nih.gov/11134038/]
- 9. The Mitochondrial Permeability Transition, Release of ... [https://www.sciencedirect.com/science/article/pii/S0021925819460821]
- 10. Apoptosis Assay Kits [https://www.raybiotech.com/assay-kits-products/apoptosis-assays]
- 11. Multiple Functions of BCL-2 Family Proteins - PMC [https://pmc.ncbi.nlm.nih.gov/articles/PMC3552500/]
- 12. Bcl-2 family [https://en.wikipedia.org/wiki/Bcl-2_family]
- 13. The BCL2 family: from apoptosis mechanisms to new ... [https://www.nature.com/articles/s41392-025-02176-0]
- 14. Bax directly induces release of cytochrome c from isolated ... [https://pmc.ncbi.nlm.nih.gov/articles/PMC20202/]
- 15. BCL‐2‐family protein tBID can act as a BAX‐like effector of ... [https://pmc.ncbi.nlm.nih.gov/articles/PMC8762556/]
- 16. The interplay between BAX and BAK tunes apoptotic pore ... [https://www.sciencedirect.com/science/article/pii/S1097276522000089]
- 17. Bcl-2 family proteins regulate the release of apoptogenic ... [https://pubmed.ncbi.nlm.nih.gov/10365962/]
- 18. Troubleshooting Flow Cytometry Issues [https://www.bosterbio.com/protocol-and-troubleshooting/flow-cytometry-troubleshooting?srsltid=AfmBOoqr-PjbdbPqIQDmWoi3pIw2Y18fJemYU2EzoQPqqzUv8rMS-TxR]
- 19. Flow Cytometry Troubleshooting Guide [https://www.cellsignal.com/learn-and-support/troubleshooting/flow-cytometry-troubleshooting-guide?srsltid=AfmBOoqxdIbqhblEoQkgRwn-32xez6ghQhCz-pO5ZxUx5JgfMQr6RT3g]
- 20. Release of Cytochrome C from Bax Pores at the ... [https://www.nature.com/articles/s41598-017-02825-7]
- 21. Cytochrome c-Lipid Interactions: New Insights from ... [https://pmc.ncbi.nlm.nih.gov/articles/PMC2941011/]
- 22. Effect of ionic strength on the interfacial properties ... [https://www.sciencedirect.com/science/article/abs/pii/S0167483899000916]
- 23. Intermolecular Electrostatic Interactions in Cytochrome c ... [https://www.mdpi.com/1422-0067/25/13/6834]
- 24. Intracellular K+ inhibits apoptosis by suppressing the Apaf ... [https://www.nature.com/articles/4402221]
- 25. Characterization of the Specific Binding Between Aptamers ... [https://pmc.ncbi.nlm.nih.gov/articles/PMC12572689/]
- 26. Cytochrome c is rapidly reduced in the cytosol after ... [https://pmc.ncbi.nlm.nih.gov/articles/PMC2863113/]
- 27. Redox compartmentalization and cellular stress - PMC [https://pmc.ncbi.nlm.nih.gov/articles/PMC3052693/]
- 28. Release of cytochrome c and activation of pro-caspase-9 ... [https://pmc.ncbi.nlm.nih.gov/articles/PMC4569095/]
- 29. | Cell Signaling Technology Western Blotting Troubleshooting Guide [https://www.cellsignal.com/learn-and-support/troubleshooting/western-blot-troubleshooting-guide]
- 30. | Boster Bio Western Blot Troubleshooting Guide [https://www.bosterbio.com/protocol-and-troubleshooting/western-blot-troubleshooting]
- 31. - dianova GmbH Western Blot Troubleshooting Guide [https://www.dianova.com/en/faq/western-blot-troubleshooting-guide/]
- 32. ELISA Troubleshooting Guide [https://www.thermofisher.com/us/en/home/life-science/protein-biology/protein-biology-learning-center/protein-biology-resource-library/pierce-protein-methods/overview-elisa/elisa-troubleshooting-guide.html]
- 33. 101 ELISA Troubleshooting Tips for Research in 2024 [https://www.assaygenie.com/101-elisa-troubleshooting-tips?srsltid=AfmBOopDlLao5NtZpIMH22YRNJvZyb_F-HYh50UqmIm-mU-lZqKOROdK]
- 34. Immunofluorescence (IF) Troubleshooting Guide [https://www.cellsignal.com/learn-and-support/troubleshooting/if-troubleshooting-guide?srsltid=AfmBOoobSGXWvOp6L8KgrpRaV9W47NLd08Co2YLF1AHRgjMf7Rln8IQR]
- 35. Immunofluorescence Troubleshooting | Tips & Tricks [https://www.stressmarq.com/support/technical-support/troubleshooting/immunofluorescence-troubleshooting/?srsltid=AfmBOop84cwcAjmbPXk2AmTzyJ8J5aQXp4tRJSLv1D1hWqQpzNS8igBv]
- 36. Cytochrome c is released in a single step during apoptosis [https://www.nature.com/articles/4401596]
- 37. Evidence for Redox Regulation of Cytochrome c Release ... [https://pmc.ncbi.nlm.nih.gov/articles/PMC6762616/]
- 38. Immunohistochemistry (IHC) Troubleshooting Guide & the ... [https://www.cellsignal.com/learn-and-support/troubleshooting/ihc-troubleshooting-guide?srsltid=AfmBOoo3R9sDXv-0fndyEzZo3lC3UPyxGoYvmqIRHqXSa8KG3jKWNptk]
- 39. Protocol for mitochondria lipid encapsulation using a dual ... [https://pmc.ncbi.nlm.nih.gov/articles/PMC12615739/]
- 40. EVALUATING CYTOCHROME C DIFFUSION IN THE INTERMEMBRANE SPACES OF MITOCHONDRIA DURING CYTOCHROME C RELEASE - PMC [https://pmc.ncbi.nlm.nih.gov/articles/PMC2316949/]
- 41. Distinct stages of cytochrome c release from mitochondria: evidence for a feedback amplification loop linking caspase activation to mitochondrial dysfunction in genotoxic stress induced apoptosis - PMC [https://www.ncbi.nlm.nih.gov/pmc/articles/PMC1199554/]
- 42. Protocol for real-time measurement of mitochondrial ... [https://www.sciencedirect.com/science/article/pii/S2666166725000577]
- 43. Factors Influencing the Stability of the QCM-D Baseline [https://qd-europe.com/at/en/news/product-application-news-spectrum/factors-influencing-the-stability-of-the-qcm-d-baseline/]
- 44. Factors that impact the QCM baseline stability and how to ... [https://www.biolinscientific.com/blog/factors-that-impact-the-qcm-baseline-stability-and-how-to-address-them]
- 45. A Real-Time Method for Improving Stability of Monolithic ... [https://pmc.ncbi.nlm.nih.gov/articles/PMC8235264/]
- 46. QCM data quality - the importance of noise and drift [https://www.biolinscientific.com/blog/qcm-data-quality-the-importance-of-noise-and-drift?update_2025=1]
- 47. Analysis of the Interaction between DNA Aptamers and ... [https://pmc.ncbi.nlm.nih.gov/articles/PMC9953847/]
- 48. QCM-D - how does it work? [https://www.biolinscientific.com/blog/qcm-d-how-does-it-work]
- 49. Advancing SERS as a quantitative technique: challenges ... [https://pmc.ncbi.nlm.nih.gov/articles/PMC11330436/]
- 50. A Newcomer's Guide to Using Surface Enhanced Raman ... [https://www.spectroscopyonline.com/view/demystifying-sers-newcomer-s-guide-using-surface-enhanced-raman-scattering]
- 51. Probing cytochrome c in living mitochondria with surface ... [https://www.nature.com/articles/srep13793]
- 52. SERS analysis of single cells and subcellular components [https://pmc.ncbi.nlm.nih.gov/articles/PMC11417266/]
- 53. Experimental and Theoretical Comparison and Analysis of ... [https://www.mdpi.com/2076-3417/14/19/9040]
- 54. Exploring the surface-enhanced Raman scattering (SERS) ... [https://www.sciencedirect.com/science/article/pii/S2352940723001993]
- 55. Achieving optimal SERS through enhanced experimental design [https://pmc.ncbi.nlm.nih.gov/articles/PMC4984853/]
- 56. Surface-enhanced Raman spectroscopy for bioanalysis and ... [https://pubs.rsc.org/en/content/articlehtml/2021/nr/d1nr00708d]
- 57. Theoretical predictions and experimental verifications ... [https://pubs.rsc.org/en/content/articlelanding/2023/ra/d3ra01584j]
- 58. A Brief Review of Aptamer-Based Biosensors in Recent Years [https://pmc.ncbi.nlm.nih.gov/articles/PMC11852377/]
- 59. Aptamers: Problems, Solutions and Prospects - PMC [https://pmc.ncbi.nlm.nih.gov/articles/PMC3890987/]
- 60. A highly sensitive fluorescence biosensor for the detection of ... [https://pubs.rsc.org/en/content/articlelanding/2021/nj/d1nj02112e]
- 61. Diagnostic accuracy of aptamer-based biosensors for the ... [https://www.sciencedirect.com/science/article/pii/S2405844025017463]
- 62. sciencedirect.com/topics/neuroscience/ cytochrome - c [https://www.sciencedirect.com/topics/neuroscience/cytochrome-c]
- 63. Mitochondrial Release of Pro-apoptotic Proteins ... [https://www.sciencedirect.com/science/article/pii/S0021925820764318]
- 64. pH-Induced Switch between Different Modes of ... [https://pmc.ncbi.nlm.nih.gov/articles/PMC6647999/]
- 65. pH-dependent Interaction of Cytochrome c with ... [https://www.sciencedirect.com/science/article/pii/S0021925820639084]
- 66. Elucidating Cytochrome c Release from Mitochondria [https://pmc.ncbi.nlm.nih.gov/articles/PMC2980706/]
- 67. Ionic strength effects on cytochrome aa3 kinetics [https://pubmed.ncbi.nlm.nih.gov/6260160/]
- 68. Ionic strength effects on cytochrome aa3 kinetics [https://www.sciencedirect.com/science/article/pii/0005272881900037]
- 69. Cytochrome c: the Achilles' heel in apoptosis - PMC [https://pmc.ncbi.nlm.nih.gov/articles/PMC11114681/]
- 70. Mechanisms by which Bak and Bax permeabilise mitochondria during... [https://pmc.ncbi.nlm.nih.gov/articles/PMC2736138/]
- 71. Physiological and Pharmacological Control of BAK, BAX, ... [https://pmc.ncbi.nlm.nih.gov/articles/PMC5118054/]
- 72. Raptinal bypasses BAX , BAK , and BOK for mitochondrial outer... [https://www.nature.com/articles/s41419-019-1790-z?error=cookies_not_supported&code=38bf744f-11e4-4f3d-bd4d-c77f5e8406d8]
- 73. Lipid unsaturation promotes BAX and BAK pore activity ... [https://www.nature.com/articles/s41467-024-49067-6]
- 74. Rapid spectrophotometric method for quantitation of ... [https://www.sciencedirect.com/science/article/pii/S0005272800000980]
- 75. The third model of Bax / Bak : a Bcl-2... | F1000Research activation [https://f1000research.com/articles/9-935]
- 76. Investigating the Mitochondrial Permeability Transition Pore in ... [https://pmc.ncbi.nlm.nih.gov/articles/PMC9286464/]
- 77. The Release of Cytochrome c from Mitochondria during ... [https://pmc.ncbi.nlm.nih.gov/articles/PMC2148194/]
- 78. Promising Strategy of mPTP Modulation in Cancer Therapy [https://www.mdpi.com/1422-0067/24/6/5564]
- 79. PMC - PubMed Central [https://pmc.ncbi.nlm.nih.gov/articles/PMC12466997/]
- 80. Rapid enrichment of mitochondria from mammalian cell ... [https://www.sciencedirect.com/science/article/pii/S2215016120304179]
- 81. Article Cryo-EM grid optimization for membrane proteins [https://www.sciencedirect.com/science/article/pii/S2589004221001073]
- 82. PROTOCOL: Western Blot Detection of Cytoplasmic Cytochr [https://www.novusbio.com/support/apoptosis-western-blot-cytochrome-c-protocol?srsltid=AfmBOooEhos75moa6Zp8PkmeRgUnzR2RfTpDlcAsJHEaiYw6zAzqzGE0]
- 83. Release of mitochondrial cytochrome c and activation of ... [https://www.sciencedirect.com/science/article/pii/S092544390100062X]
- 84. The 'harmless' release of cytochrome c | Cell Death & ... [https://www.nature.com/articles/4400782]
- 85. Hypotonic Swelling Method for the Isolation of Pure ... [https://pmc.ncbi.nlm.nih.gov/articles/PMC11745819/]
- 86. Intracellular K+ Suppresses the Activation of Apoptosis in ... [https://www.sciencedirect.com/science/article/pii/S0021925819897557]
- 87. PROTOCOL: Western Blot Detection of Cytoplasmic Cytochr [https://www.novusbio.com/support/apoptosis-western-blot-cytochrome-c-protocol?srsltid=AfmBOooP9Gh5lnc0y_CnJ_F_6o1Vvh0s7gauhmLo7yxWv013r5uI_W5G]
- 88. Cytochrome c Release Assay Kit (AB65311) [https://www.abcam.com/en-us/products/assay-kits/cytochrome-c-release-assay-kit-ab65311]
- 89. - Wikipedia Apoptosome [https://en.wikipedia.org/wiki/Apoptosome]
- 90. Cell death signaling and immune regulation [https://cmbl.biomedcentral.com/articles/10.1186/s11658-025-00784-w]
- 91. Apo cytochrome inhibits c by preventing caspases ... apoptosome [https://pubmed.ncbi.nlm.nih.gov/15184073/]
- 92. T-cell development of resistance to apoptosis is driven by a ... [https://www.nature.com/articles/cdd2015156]
- 93. Development of a robust BH3 drug toolkit for precision ... [https://pmc.ncbi.nlm.nih.gov/articles/PMC12068295/]
- 94. -9, Caspase -3 and caspase -7 have distinct roles during... caspase [https://bmcmolcellbiol.biomedcentral.com/articles/10.1186/1471-2121-14-32]
- 95. How to Control Your Apoptosis, Autophagy & Mitophagy ... [https://blog.cellsignal.com/control-extracts-for-western-blot]
- 96. Apoptosis Protocol & Troubleshooting - Creative Biolabs [https://www.creativebiolabs.net/apoptosis-protocol.htm]
- 97. Flow cytometry-based apoptosis detection - PMC [https://pmc.ncbi.nlm.nih.gov/articles/PMC3863590/]
- 98. In Vitro Cell Death Determination for Drug Discovery [https://pmc.ncbi.nlm.nih.gov/articles/PMC5392044/]
- 99. Measurement and Characterization of Apoptosis by Flow ... [https://www.thermofisher.com/us/en/home/references/newsletters-and-journals/bioprobes-journal-of-cell-biology-applications/bioprobes-75/bioprobes-75-journal-club-apoptosis-flow-cytometry.html]
- 100. Induction of apoptosis in cells [https://www.abcam.com/en-us/technical-resources/protocols/induce-apopotosis]
- 101. A Bax/Bak-independent mechanism of cytochrome c release [https://pubmed.ncbi.nlm.nih.gov/17409097/]
- 102. Computational design of potent and selective binders of BAK ... [https://pmc.ncbi.nlm.nih.gov/articles/PMC12412652/]
- 103. BAK/BAX activation and cytochrome c release assays ... [https://www.sciencedirect.com/science/article/abs/pii/S1046202313000996]
- 104. Caspase-mediated Bak Activation and Cytochrome c ... [https://pmc.ncbi.nlm.nih.gov/articles/PMC2602908/]
- 105. Bax and Bak independently promote cytochrome C release ... [https://pubmed.ncbi.nlm.nih.gov/11836241/]
- 106. Diverse functions of cytochrome c in cell death and disease [https://pmc.ncbi.nlm.nih.gov/articles/PMC11043370/]
- 107. Cytochrome c and cancer cell metabolism: A new perspective [https://www.sciencedirect.com/science/article/pii/S1319016424002457]
- 108. In situ spatial profiling of cytochrome c release at the single ... [https://www.sciencedirect.com/science/article/abs/pii/S0956566325006943]
- 109. Biosensors, Volume 15, Issue 5 (May 2025) – 69 articles [https://www.mdpi.com/2079-6374/15/5]
- 110. Technological advances in real-time tracking of cell death - PMC [https://pmc.ncbi.nlm.nih.gov/articles/PMC3037440/]
- 111. PROTOCOL: Western Blot Detection of Cytoplasmic Cytochr [https://www.novusbio.com/support/apoptosis-western-blot-cytochrome-c-protocol?srsltid=AfmBOooR4nUnWOiSHstzeykaAWYo_gf-5KpywxiB8rgC7DrSZ9-qcZPV]
- 112. Western Blot Protocol & Troubleshooting Guide [https://www.assaygenie.com/western-blot-protocol-troubleshooting-guide?srsltid=AfmBOoptrUNkEWf9KSkRMpXc680mB0v9GqITLZwcUAX7laCaK7hwHGDl]
- 113. Programmed cell revival from imminent cell death enhances ... [https://pmc.ncbi.nlm.nih.gov/articles/PMC12489119/]
- 114. Ultrastructural localization of cytochrome c in apoptosis ... [https://www.nature.com/articles/4400655]
- 115. NO-induced change in the oxidation state of cytochrome c ... [https://www.sciencedirect.com/science/article/pii/S0891584925008792]
- 116. The tumor suppressor LACTB remodels mitochondria to ... [https://pmc.ncbi.nlm.nih.gov/articles/PMC12609066/]
- 117. How a Faulty Bax Antibody May Cost Researchers Millions [https://blog.cellsignal.com/watch-your-bax]
- 118. The formation of the 'footprint of death' as a mechanism for ... [https://www.nature.com/articles/s41467-025-64206-3]