TMRM vs. Rhodamine 123: A Strategic Guide for Acute and Chronic ΔΨm Studies
This guide provides researchers, scientists, and drug development professionals with a comprehensive framework for selecting and applying TMRM and Rhodamine 123 in mitochondrial membrane potential (ΔΨm) studies.
TMRM vs. Rhodamine 123: A Strategic Guide for Acute and Chronic ΔΨm Studies
Abstract
This guide provides researchers, scientists, and drug development professionals with a comprehensive framework for selecting and applying TMRM and Rhodamine 123 in mitochondrial membrane potential (ΔΨm) studies. It covers the foundational principles of how these cationic probes function, detailing specific protocols for both acute dynamic measurements and chronic end-point assessments. The content offers practical troubleshooting advice for common pitfalls, explores advanced validation techniques to ensure data accuracy, and delivers a direct comparative analysis to inform probe selection based on experimental design, ensuring reliable interpretation of mitochondrial function in health and disease.
Understanding Mitochondrial Membrane Potential and the Role of Cationic Probes
Why ΔΨm is a Central Indicator of Cellular Health and Function
The mitochondrial membrane potential (ΔΨm) is a critical parameter of cellular bioenergetics, serving as a central indicator of mitochondrial and overall cell health. Generated by the electron transport chain, this electrochemical gradient not only drives ATP production but also regulates vital processes including metabolite transport, mitochondrial quality control, and cellular signaling. This guide provides a comparative analysis of the fluorescent probes TMRM and Rhodamine 123 for investigating ΔΨm in acute versus chronic studies, supported by experimental data and methodologies relevant to researchers and drug development professionals.
The mitochondrial membrane potential (ΔΨm) is an essential component of the proton-motive force that drives ATP synthesis through oxidative phosphorylation. With a typical value of 100-150 mV (negative inside), ΔΨm is generated by proton pumps of the electron transport chain (Complexes I, III, and IV) and utilized by ATP synthase for energy conservation [1] [2]. Beyond its canonical role in bioenergetics, ΔΨm facilitates critical cellular processes including metabolite transport, protein import, calcium homeostasis, and reactive oxygen species (ROS) production [2]. Perhaps most significantly, ΔΨm serves as a key signal in mitochondrial quality control, determining whether mitochondria are preserved or eliminated via mitophagy [1] [3]. The homeostasis of ΔΨm is therefore crucial for cellular viability, with sustained deviations leading to pathological consequences including neurodegenerative disorders, cancer, and metabolic diseases [1] [2] [4].
ΔΨm in Cellular Homeostasis and Dysfunction
Regulatory Roles in Cellular Function
Energy Production and Beyond: While ΔΨm provides the driving force for ATP synthesis, cells maintain stable ΔΨm and ATP levels despite physiological fluctuations. Sustained perturbations can compromise viability, indicating the importance of ΔΨm homeostasis [1]. The direction of ΔΨm (negative inside) favors inward transport of cations and outward transport of anions, enabling accumulation of essential metals like calcium and iron in mitochondria [1].
Mitochondrial Quality Control: ΔΨm plays a pivotal role in assessing mitochondrial functionality. When ΔΨm drops below a critical threshold, it triggers selective elimination of dysfunctional mitochondria through mitophagy, serving as a key mechanism in cellular quality control [1] [3].
Integrated Stress Response: Recent research demonstrates that elevated ΔΨm drives the integrated stress response (ISR) induced by ATP synthase dysfunction. Genetically encoded tools for ΔΨm manipulation have revealed that hyperpolarization activates stress response pathways and transcriptional changes in mammalian cells [2].
Consequences of ΔΨm Dysregulation
Mitochondrial hyperpolarization has emerged as a significant factor in disease pathogenesis and cellular signaling. Chronic loss of ATP5IF1 (IF1), a natural inhibitor of ATP synthase hydrolytic activity, results in sustained ΔΨm elevation and triggers extensive molecular changes, including nuclear DNA hypermethylation and altered expression of thousands of genes involved in oxidative phosphorylation, lipid metabolism, and cell cycle regulation [4]. These findings provide a framework for understanding how mitochondrial hyperpolarization impacts epigenetics and cellular biology in disease states and environmental exposures.
Table 1: Functional Consequences of ΔΨm Alterations
| ΔΨm Status | Primary Consequences | Cellular Outcomes | Disease Associations |
|---|---|---|---|
| Depletion | Impaired ATP production, disrupted protein import, loss of calcium homeostasis | Bioenergetic failure, initiation of mitophagy, cell death | Neurodegenerative diseases, ischemic injury [1] |
| Hyperpolarization | Increased ROS production, enhanced calcium uptake, phospholipid remodeling | Integrated stress response, transcriptional reprogramming, epigenetic changes | Cancers (glioblastoma, ovarian), pulmonary hypertension [2] [4] |
Comparative Analysis of ΔΨm Measurement Probes
Technical Specifications and Performance Characteristics
The accurate measurement of ΔΨm is methodologically challenging, with fluorescent rhodamine derivatives serving as the primary tools for investigation. The table below summarizes the key characteristics of the most commonly employed probes:
Table 2: Performance Comparison of ΔΨm-Sensitive Fluorescent Probes
| Parameter | Rhodamine 123 (R123) | TMRM | TMRE |
|---|---|---|---|
| Chemical Structure | Lipophilic cation | Tetramethylrhodamine methyl ester | Tetramethylrhodamine ethyl ester |
| Accumulation Mechanism | Nernstian distribution plus membrane binding | Nernstian distribution plus membrane binding | Nernstian distribution plus membrane binding |
| Binding Affinity | Moderate | Lowest | Highest |
| Respiratory Suppression | Moderate | Minimal at low concentrations | Most significant |
| Spectral Shift upon Accumulation | Red shift in absorption and emission | Red shift in absorption and emission | Red shift in absorption and emission |
| Fluorescence Behavior | Concentration-dependent quenching | Concentration-dependent quenching | Concentration-dependent quenching |
| Recommended Application | Endpoint measurements, cancer cell studies | Chronic/long-term studies, kinetic measurements | Acute/short-term studies, isolated mitochondria |
Methodological Considerations for Experimental Design
The selection between TMRM and Rhodamine 123 requires careful consideration of experimental goals and potential artifacts:
TMRM for Chronic Studies: TMRM exhibits the lowest binding affinity and minimal respiratory suppression at low concentrations, making it particularly suitable for long-term imaging experiments and kinetic measurements in live cells [5] [6]. Its reduced interference with mitochondrial function allows for more extended observation periods without significantly altering the biological system under investigation.
Rhodamine 123 for Acute Studies: While widely used, Rhodamine 123 shows greater binding affinity and moderate respiratory suppression. Recent evidence indicates significant intracellular and intramitochondrial modification of Rhodamine 123 over time, potentially leading to artifactual retention and false interpretations of ΔΨm, particularly in tumor cells [3]. This probe is better suited for endpoint measurements rather than chronic studies.
Quantitative Considerations: All three dyes (R123, TMRM, TMRE) bind to the inner and outer aspects of the inner mitochondrial membrane, resulting in accumulation beyond predictions based solely on the Nernst equation. Determination of internal and external partition coefficients is necessary to correct for binding in ΔΨm calculations [5].
Experimental Approaches for ΔΨm Investigation
Standardized Protocol for ΔΨm Measurement in Live Cells
Materials Required:
- Cell culture system (e.g., C2C12, HEK293, or primary cells)
- ΔΨm-sensitive probe (TMRM recommended for chronic studies, Rh123 for acute endpoints)
- Confocal fluorescence microscope or flow cytometer
- Mitochondrial uncoupler (e.g., FCCP, CCCP) for validation
- Buffer system (appropriate for cell type and experimental conditions)
Methodological Workflow:
Cell Preparation and Staining:
- Culture cells under standard conditions appropriate for the cell type
- Load cells with 20-100 nM TMRM or 50-500 nM Rh123 in culture medium for 20-45 minutes at 37°C
- For chronic studies, use lower TMRM concentrations (20-50 nM) to minimize respiratory suppression
Fluorescence Measurement:
- For ratiometric measurements, excite at ~550 nm and detect emission at ~575 nm and ~590 nm
- Monitor fluorescence intensity changes over time using time-lapse microscopy
- Normalize signals to mitochondrial mass using MitoTracker Green (excited at ~490 nm)
Validation and Controls:
- Apply mitochondrial uncoupler (e.g., 10 μM CCCP) at experiment conclusion to dissipate ΔΨm and confirm specificity
- Include vehicle controls for solvent effects
- Use positive controls (e.g., ATP synthase inhibitors) to induce hyperpolarization
The following diagram illustrates the experimental workflow and potential technical artifacts in ΔΨm measurement:
Advanced Genetic Tools for ΔΨm Manipulation
Recent methodological advances have introduced genetic approaches for specific ΔΨm manipulation, complementing chemical tools:
UCP1-Based Uncoupling: Heterologous expression of uncoupling protein 1 (UCP1) from brown adipocytes provides a genetically encoded tool for controlled ΔΨm dissipation. This approach specifically lowers ΔΨm to a similar extent as chemical uncouplers like FCCP, but without inhibiting cell proliferation or causing off-target effects associated with chemical tools [2].
IF1 Manipulation for Hyperpolarization Studies: Deletion of ATP5IF1 (IF1), the natural inhibitor of ATP synthase hydrolytic activity, creates a genetic model of chronic mitochondrial hyperpolarization. IF1-KO cells demonstrate increased resting ΔΨm, enabling investigation of hyperpolarization effects on nuclear DNA methylation, gene expression, and phospholipid remodeling [4].
Table 3: Research Reagent Solutions for ΔΨm Investigation
| Reagent/Category | Specific Examples | Function/Application | Key Considerations |
|---|---|---|---|
| Chemical Uncouplers | FCCP, CCCP, DNP, Bam15 | Dissipate ΔΨm by increasing proton permeability | Multiple cellular targets; can affect plasma membrane potential [2] |
| ATP Synthase Inhibitors | Oligomycin, IF1 knockout models | Induce ΔΨm hyperpolarization by inhibiting hydrolysis | Oligomycin inhibits both synthetic and hydrolytic activity [4] |
| Genetic Uncoupling Tools | Doxycycline-inducible UCP1 expression | Specific ΔΨm dissipation without off-target effects | Requires genetic modification; expression level-dependent effects [2] |
| Validation Reagents | CCCP, antimycin A, rotenone | Confirm specificity of ΔΨm measurements | Essential for proper experimental controls |
Mitochondrial membrane potential serves as a central indicator of cellular health, extending far beyond its traditional role in energy transduction to encompass regulation of mitochondrial quality control, cellular signaling, and epigenetic regulation. The selection of appropriate measurement methodologies, particularly the choice between TMRM for chronic studies and Rhodamine 123 for acute measurements, is critical for accurate ΔΨm assessment. Emerging genetic tools for specific ΔΨm manipulation, including UCP1 expression and IF1 deletion models, provide new opportunities to investigate causal relationships between ΔΨm dynamics and cellular outcomes. For researchers and drug development professionals, understanding these methodologies and their appropriate applications enables more precise investigation of mitochondrial function in health and disease.
The mitochondrial membrane potential (ΔΨm) is a fundamental component of the proton motive force (Δp), the electrochemical gradient that drives ATP synthesis via oxidative phosphorylation [7]. Typically ranging from 150 to 180 mV (negative inside the matrix), ΔΨm constitutes the dominant electrical component of this gradient, while the pH difference (ΔpHm) contributes the remainder [7]. This potential difference is not only crucial for bioenergetics but also plays a vital role in mitochondrial calcium buffering, reactive oxygen species (ROS) regulation, and protein import [7] [3]. To monitor this key indicator of mitochondrial function in living cells, researchers predominantly rely on lipophilic cationic fluorescent probes. These dyes, including tetramethylrhodamine methyl ester (TMRM) and Rhodamine 123 (Rhod123), permeate biological membranes and accumulate within the mitochondrial matrix in a manner directly governed by the Nernst equation, which relates the transmembrane potential to the concentration ratio of a permeant ion across the membrane [7] [3]. The selection of an appropriate probe, however, is critical, as their chemical properties, operating modes, and potential artifacts dictate their suitability for specific experimental paradigms, particularly when distinguishing between chronic long-term studies and acute dynamic investigations [8] [7].
The Electrochemical Principle of Dye Accumulation
The accumulation of lipophilic cations in the mitochondrial matrix is an electrochemical process governed by both the plasma membrane potential (ΔΨp) and the mitochondrial membrane potential (ΔΨm). These dyes are lipophilic cations that passively distribute across phospholipid bilayers down their concentration gradients until they reach an equilibrium defined by the electrical potential across each membrane [7] [9].
The Nernstian Distribution Framework
At equilibrium, the distribution of a permeant cation between two compartments separated by a membrane is described by the Nernst equation:
ΔΨ = − (RT / nF) * ln (C_in / C_out)
where ΔΨ is the membrane potential, R is the gas constant, T is the absolute temperature, n is the charge of the ion (typically +1 for these dyes), F is the Faraday constant, and Cin/Cout is the concentration ratio across the membrane [3]. In a typical mammalian cell with a ΔΨp of approximately -60 mV and a ΔΨm of -180 mV, a monovalent cation can accumulate ~10-fold in the cytoplasm and potentially ~10,000-fold within mitochondria relative to the external medium [9]. This massive accumulation within the mitochondrial matrix is the fundamental principle exploited for fluorescence-based measurements.
From Theory to Practical Measurement
In practice, the distribution of these dyes deviates from ideal Nernstian behavior due to several factors. The dyes can bind to mitochondrial membranes and proteins, a phenomenon that varies between probes—TMRE exhibits greater binding than Rhod123, which in turn shows more binding than TMRM [10]. This binding effectively increases the total dye accumulation beyond what the membrane potential alone would predict [10]. Additionally, at high intramitochondrial concentrations, the fluorescent signal can be affected by self-quenching, where dye aggregation leads to fluorescence attenuation [11]. The transport kinetics of the dyes also influences measurements, particularly during transient potential changes, with slower permeation sometimes being advantageous for resolving rapid dynamics [7]. These practical considerations necessitate careful experimental design and appropriate controls when interpreting fluorescence signals as direct reflections of ΔΨm.
The following diagram illustrates the journey of these cationic probes from the extracellular space to the mitochondrial matrix, highlighting the key steps and governing principles:
Comparative Analysis of TMRM and Rhodamine 123
While both TMRM and Rhodamine 123 are rhodamine-based lipophilic cations used for measuring ΔΨm, their distinct chemical properties make them suitable for different experimental applications. The choice between them depends on multiple factors, including the required temporal resolution, planned duration of imaging, and whether qualitative or semi-quantitative measurements are sufficient.
Table 1: Fundamental Properties of TMRM and Rhodamine 123
| Property | TMRM (Tetramethylrhodamine Methyl Ester) | Rhodamine 123 (Rhod123) |
|---|---|---|
| Chemical Structure | Methyl ester derivative | Primary amine |
| Lipophilicity | Moderate | Lower than TMRM/TMRE [10] |
| Mitochondrial Binding | Low (minimal interference with ETC) [7] [10] | Moderate (more than TMRM, less than TMRE) [7] [10] |
| Respiratory Inhibition | Minimal at low concentrations [10] | Moderate [7] |
| Equilibration Kinetics | Fast [7] | Slower permeation [7] |
| Primary Operational Modes | Non-quenching & Quenching mode [8] [12] | Primarily Quenching mode [8] [7] |
Table 2: Experimental Application Profiles
| Application Parameter | TMRM | Rhodamine 123 |
|---|---|---|
| Ideal Use Case | Chronic/long-term studies; Pre-existing ΔΨm assessment [7] | Acute, fast-resolving dynamic studies [7] |
| Recommended Concentration Range | Non-quenching: ~1-30 nM; Quenching: >50-100 nM [7] | Quenching mode: ~1-10 μM [7] |
| Typical Cell Types Demonstrated | Primary human skin fibroblasts, neuron/astrocyte co-cultures [8], hepatocarcinoma cells [9] | Primary human skin fibroblasts, isolated rat heart mitochondria [8] [10] |
| Sensitivity to ΔΨm Depolarization | High (most sensitive in comparative studies) [12] | Moderate |
| Advantages | Low toxicity, minimal ETC interference, suited for prolonged imaging [7] [12] | Slow permeation beneficial for resolving acute changes via unquenching [7] |
| Limitations | Fast equilibration less suited for some quenching studies [7] | Can inhibit electron transport chain; potential intracellular modification [7] [3] |
Detailed Experimental Protocols
To ensure reliable and reproducible results, researchers must adhere to carefully optimized protocols for using these potentiometric dyes. The following section provides detailed methodologies for both TMRM and Rhodamine 123, as applied in primary human skin fibroblasts and isolated mitochondrial preparations.
TMRM Protocol for Steady-State ΔΨm Assessment in Living Cells
This protocol is designed for semi-quantitative comparison of ΔΨm between different cell populations or treatment conditions, ideal for chronic studies [8] [9].
- Cell Preparation: Plate primary human skin fibroblasts (PHSFs) or other mammalian cells on glass-bottom culture dishes and culture until they reach 70-80% confluence.
- Dye Loading:
- Maintenance and Imaging:
- After loading, wash the cells gently but thoroughly with fresh, pre-warmed medium to remove extracellular dye.
- For maintained equilibrium during imaging, use a low-nanomolar TMRM concentration (e.g., 50 nM) in the imaging buffer to prevent dye loss from mitochondria [9].
- Acquire images using an epifluorescence or confocal microscope with appropriate settings (e.g., 561 nm excitation, 590-610 nm emission) [12] [9].
- Controls and Calibration:
- Full Depolarization Control: Apply the protonophore FCCP (carbonyl cyanide p-trifluoromethoxyphenylhydrazone, 1-2 µM) at the end of the experiment to collapse ΔΨm and record the resulting minimal fluorescence [13] [9].
- Hyperpolarization Control (Optional): Apply the ATP synthase inhibitor oligomycin (1-2 µM), which can cause a slight hyperpolarization of ΔΨm by inhibiting proton re-entry [13].
Rhodamine 123 Protocol for Dynamic ΔΨm Measurements
This protocol leverages Rhodamine 123 in quenching mode to monitor rapid, acute changes in membrane potential, such as in response to pharmacological agents [8] [7].
- Cell Preparation: Use cells under similar conditions as for the TMRM protocol.
- Dye Loading and Washout:
- Prepare a loading solution of Rhodamine 123 at 1-10 µM in pre-warmed serum-free medium or HBSS [7].
- Incubate cells for 15-30 minutes at 37°C.
- After incubation, wash the cells extensively with dye-free buffer to remove all extracellular Rhodamine 123. This step is critical for quenching-mode measurements [7].
- Real-Time Imaging and Perturbation:
- Place the washed cells in a minimal volume of imaging buffer and begin time-lapse acquisition (e.g., 488 nm excitation, 500-550 nm emission) [11].
- After establishing a stable baseline fluorescence recording, introduce the experimental perturbation (e.g., drug addition, metabolic substrate).
- Data Interpretation:
- In this quenching mode, a sudden increase in fluorescence indicates mitochondrial depolarization, as dye releases from the matrix into the cytosol, leading to de-quenching.
- Conversely, a decrease in fluorescence indicates hyperpolarization, with increased dye uptake and quenching in the matrix [7].
- Validate with FCCP and oligomycin controls as described for TMRM.
The workflow for a typical dynamic assay using Rhodamine 123 is summarized below:
Critical Considerations and Potential Artifacts
Interpreting data from ΔΨm probes requires awareness of significant technical pitfalls and confounding factors that can lead to erroneous conclusions.
Dye Modification and Compartmentalization: Rhodamine probes can undergo intracellular and intramitochondrial modification. For instance, Rhodamine 123 can be converted via de-esterification to rhodamine 110, which has different membrane permeability and retention properties [3]. This process can be cell-type dependent, potentially more pronounced in tumor cells, and can be inhibited by compounds like amiodarone, which blocks cytochrome P450 activity and xenobiotic efflux [3]. Such modifications affect dye retention and fluorescence independent of ΔΨm.
Influence of Non-Protonic Cations: ΔΨm dyes measure the total electrical gradient, not specifically the proton gradient. Movements of other ions, particularly calcium (Ca²⁺), can significantly influence the signal. Research has documented cellular insults that simultaneously increase ΔΨm (hyperpolarization) while decreasing the mitochondrial pH gradient, a paradox explained by a massive release of Ca²⁺ from mitochondrial and ER stores [7]. The cationic dye behavior is affected by this net charge transfer, demonstrating that ΔΨm changes do not always correlate directly with changes in the proton motive force or bioenergetic status [7].
Concentration-Dependent Artifacts: Using dyes at excessively high concentrations can introduce multiple artifacts. It can lead to inhibition of the electron transport chain (ETC), particularly with Rhodamine 123 and TMRE [7] [10]. Furthermore, high dye concentrations are necessary for quenching-mode measurements but can also exacerbate non-specific binding to membranes and proteins, distorting the Nernstian relationship [10] [11]. For DiOC₆(3), concentrations must be kept very low (<1 nM) to ensure specificity for ΔΨm over the plasma membrane potential [7].
The Scientist's Toolkit: Essential Research Reagents
Table 3: Key Reagents for Mitochondrial Membrane Potential Assays
| Reagent / Material | Function / Purpose | Example Usage & Notes |
|---|---|---|
| TMRM (Tetramethylrhodamine methyl ester) | Lipophilic cationic dye for ΔΨm measurement in non-quenching or quenching mode. | Use at low nM (non-quenching) for chronic studies or high nM/μM (quenching) for acute shifts. Minimal ETC inhibition [7] [12]. |
| Rhodamine 123 | Lipophilic cationic dye for dynamic ΔΨm assessment, best in quenching mode. | Use at 1-10 μM with washout before acute perturbations. Slower permeation aids temporal resolution [7]. |
| FCCP (Carbonyl cyanide p-trifluoromethoxyphenylhydrazone) | Protonophore uncoupler that collapses the proton gradient and ΔΨm. Used for control depolarization. | Typically used at 1-2 μM to validate dye response and establish minimal fluorescence [12] [9]. |
| Oligomycin | ATP synthase (Complex V) inhibitor. Used to induce hyperpolarization as a control. | Used at 1-2 μM. By blocking proton flow through ATP synthase, it can cause a slight increase in ΔΨm [13]. |
| Carbonyl cyanide 3-chlorophenylhydrazone (CCCP) | Another potent protonophore uncoupler, alternative to FCCP for collapsing ΔΨm. | Used at ~1-10 μM to fully depolarize mitochondria [11] [9]. |
| Primary Human Skin Fibroblasts (PHSFs) | A common and relevant human primary cell model for mitochondrial function studies. | Used in validation studies comparing probe performance and sensitivity [8] [12]. |
| HBSS (Hank's Balanced Salt Solution) with HEPES | Standard imaging buffer for maintaining physiological pH and ion balance during live-cell imaging. | Provides a stable, serum-free environment for fluorescence measurements [9]. |
TMRM and Rhodamine 123 serve as indispensable tools for probing mitochondrial physiology, yet their application must be matched to the specific scientific question. TMRM, with its low toxicity and minimal interference with mitochondrial function, is the probe of choice for chronic studies and for assessing pre-existing ΔΨm across different cell populations or treatment conditions. In contrast, Rhodamine 123, with its slower equilibration kinetics and reliable performance in quenching mode, is ideally suited for capturing acute, dynamic changes in membrane potential. A comprehensive understanding of the electrochemical principles underlying their accumulation, coupled with rigorous experimental design that includes appropriate controls for artifact identification, is paramount for obtaining accurate and biologically meaningful data on mitochondrial membrane potential.
For researchers investigating mitochondrial health and function, Tetramethylrhodamine Methyl Ester (TMRM) and Rhodamine 123 (Rh123) are essential fluorescent dyes for monitoring mitochondrial membrane potential (ΔΨm). While both are lipophilic cations that accumulate in active mitochondria, their distinct chemical properties dictate their optimal applications. TMRM, with its lower binding affinity and minimal impact on electron transport chain function, is the preferred choice for chronic or long-term kinetic studies, particularly in non-quenching mode. In contrast, Rh123, with its slower cellular equilibration, is often better suited for acute, fast-resolving studies, especially when used in quenching mode to monitor rapid changes in ΔΨm. This guide provides a detailed, data-driven comparison to inform your probe selection for more reliable and interpretable experimental outcomes.
Comparative Probe Profiles at a Glance
The table below summarizes the core characteristics and recommended applications for TMRM and Rhodamine 123 based on empirical findings.
Table 1: Direct Comparison of TMRM and Rhodamine 123
| Feature | TMRM | Rhodamine 123 (Rh123) |
|---|---|---|
| Chemical Structure | Tetramethylrhodamine methyl ester | Cationic, green-fluorescent rhodamine derivative |
| Primary Excitation/Emission | ~548 nm / ~573 nm [13] | ~507 nm / ~529 nm [14] [15] |
| Key Strength | Lower mitochondrial binding & minimal respiratory inhibition [5] [7] [10] | Slower equilibration ideal for quenching/unquenching assays [7] |
| Optimal Use Case | Chronic studies; pre-existing ΔΨm measurement; non-quenching mode [7] [13] | Acute, fast-resolving ΔΨm changes; quenching mode [7] |
| Typical Loading Concentration | Non-quenching: ~1-30 nM; Quenching: >50-100 nM [7] | Quenching mode: ~1-10 μM [7] |
| Sensitivity to ΔΨm Loss | High (Greatest release upon FCCP-induced depolarization) [12] | Moderate [12] |
| Impact on Respiration | Minimal to none at low concentrations [5] [10] | Moderate suppression of respiratory control [5] [10] |
Supporting Experimental Data and Validation
The recommendations above are grounded in direct comparative studies and investigations into probe behavior.
- ΔΨm Sensitivity and Depolarization Response: A 2023 open-access study directly compared the performance of TMRM and several Mitotracker dyes in primary human skin fibroblasts. It found that the dyes were "differentially sensitive" to FCCP-induced depolarization, with the mitochondrial signal decreasing in the order: TMRM ≫ CHM2Xros = CMXros = MDR > MG, indicating that TMRM signal is the most responsive to loss of membrane potential [12].
- Respiratory Inhibition and Binding Artifacts: A foundational 1999 study demonstrated that all rhodamine dyes can suppress mitochondrial respiratory control, but to varying degrees. The inhibition was found to be greatest with TMRE, followed by Rh123 and TMRM. Critically, the study noted that when used at low concentrations, TMRM did not suppress respiration. The same study established that the degree of non-Nernstian binding to mitochondrial membranes is in the order of TMRE > R123 > TMRM, making TMRM the least prone to binding artifacts [5] [10] [6].
- Considerations for Accurate Interpretation: A 2022 review highlighted that fluorescent probes like Rh123 and TMRM can undergo intracellular and intramitochondrial modifications, which may lead to false interpretations of ΔΨm. Factors such as conversion to impermeable forms, degradation, and activity of efflux pumps can all influence fluorescence independent of membrane potential [3]. This underscores the necessity of including proper controls, such as validation with the uncoupler FCCP and the ATP synthase inhibitor oligomycin [13] [16].
Essential Methodologies for Reliable Data
TMRM Protocol for Non-Quenching Mode (Chronic/Kinetic Studies)
This protocol is designed for quantifying ΔΨm in real-time with minimal physiological disruption [7] [13] [16].
- Dye Preparation: Prepare a stock solution in DMSO and dilute in your experimental buffer to a final working concentration in the low nanomolar range (e.g., 5-20 nM).
- Cell Loading: Incubate cells with the TMRM-containing buffer for 20-30 minutes at 37°C to allow for equilibration. For sustained kinetic measurements, the dye can be maintained in the bath throughout the imaging period.
- Image Acquisition: Use a fluorescence microscope with appropriate tetramethylrhodamine filter sets. Since the signal is not quenched, the fluorescence intensity of mitochondria is directly proportional to ΔΨm.
- Validation & Controls:
- FCCP (1-2 µM): Apply at the end of the experiment to induce complete depolarization. A loss of mitochondrial signal confirms ΔΨm-dependence.
- Oligomycin (1-2 µM): This ATP synthase inhibitor causes hyperpolarization (increased signal), validating the probe's response to increased ΔΨm [13].
Rhodamine 123 Protocol for Quenching Mode (Acute Changes)
This method leverages dye aggregation and unquenching to monitor rapid depolarization events [7].
- Dye Loading: Load cells with a higher concentration of Rh123 (1-10 µM) for 15-30 minutes at 37°C.
- Washout: Thoroughly wash the cells with a dye-free buffer. This step is critical to remove extracellular and cytosolic dye.
- Image Acquisition: Begin time-lapse imaging. At high matrix concentrations, the dye is quenched. A rapid increase in fluorescence (unquenching) occurs upon depolarization as the dye redistributes from the mitochondria into the cytosol.
- Controls: As with TMRM, validate the system using FCCP to induce depolarization and oligomycin to induce hyperpolarization.
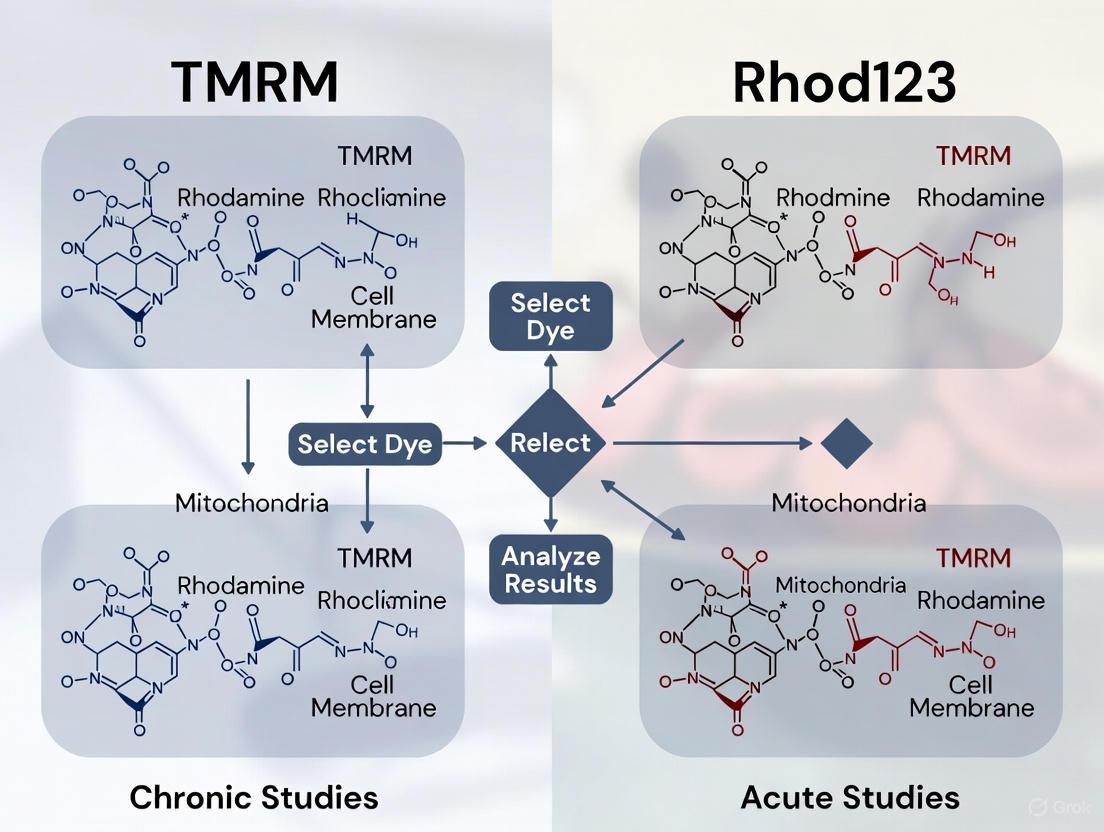
Experimental Workflow Visualization
The diagram below outlines the logical decision process for selecting and applying TMRM or Rhodamine 123 in a study.
The Scientist's Toolkit: Key Research Reagent Solutions
Table 2: Essential Reagents for Mitochondrial Membrane Potential Assays
| Reagent / Material | Function in the Experiment | Key Consideration |
|---|---|---|
| TMRM | The preferred fluorescent probe for most chronic and kinetic studies of ΔΨm. | Use the lowest possible concentration that gives a good signal-to-noise ratio to avoid artifacts [7]. |
| Rhodamine 123 | The preferred probe for acute, fast-resolving studies, often in quenching mode. | Requires careful washout after loading for quenching mode assays [7]. |
| FCCP | Protonophore uncoupler; dissipates ΔΨm by equalizing proton gradient. Used for validation. | A standard control to induce maximal depolarization and confirm ΔΨm-dependence of signal [12] [13]. |
| Oligomycin | ATP synthase inhibitor; causes hyperpolarization by blocking proton re-entry. Used for validation. | Validates the probe's response to increased ΔΨm and tests for "proton-leaky" membranes [13]. |
| Cell-Permeant Plasma Membrane Potential (PMP) Indicator | A dye (e.g., a bis-oxonol) used in parallel to monitor changes in plasma membrane potential (ΔΨp). | Critical for quantitative, absolute ΔΨm assays, as ΔΨp influences the distribution of cationic dyes like TMRM [16]. |
| M-CSF (Macrophage Colony-Stimulating Factor) | For differentiation of human monocytes into macrophages for co-culture studies. | Enables creation of complex models (e.g., tumor cell/macrophage co-cultures) for studying ΔΨm in a tissue-like context [13]. |
The proton motive force (Δp) is the fundamental energy source driving mitochondrial ATP production. It is crucial to understand that this force is not a single entity but a composite of two distinct components: the electrical potential (ΔΨm) and the chemical potential (ΔpHm). These components are related through the equation Δp (mV) = ΔΨm − 60ΔpHm (at 37°C), where ΔΨm represents the electrical gradient (typically -150 to -180 mV), and ΔpHm represents the proton concentration gradient (typically -0.5 to -1.0 pH units, matrix alkaline) [7]. While fluorescent cationic dyes like TMRM and Rhodamine 123 provide excellent measurements of ΔΨm, it is a fundamental misconception that they directly report on ΔpHm. These parameters, though interrelated, can and do change independently under various physiological and pathophysiological conditions, leading to potentially erroneous conclusions if this distinction is not properly recognized [7].
Technical Comparison of ΔΨm and ΔpHm
The table below summarizes the core characteristics of these two distinct parameters.
Table 1: Fundamental Differences Between Mitochondrial Membrane Potential (ΔΨm) and Mitochondrial pH Gradient (ΔpHm)
| Feature | ΔΨm (Mitochondrial Membrane Potential) | ΔpHm (Mitochondrial pH Gradient) |
|---|---|---|
| Nature | Electrical Gradient (Charge Separation) | Chemical Gradient (Proton Concentration) |
| Typical Value | -150 to -180 mV (Matrix Negative) [7] | 0.5 - 1.0 pH units (Matrix Alkaline) [7] |
| Contribution to Δp | ~150-180 mV (Major Contributor) [7] | ~30-60 mV (via Nernst factor) [7] |
| Primary Measurement Tools | Cationic Fluorescent Probes (TMRM, Rhod123, JC-1) [7] | Ratiometric, pH-Sensitive Dyes (e.g., SNARF-1) [7] |
| Key Functional Role | Driving force for ATP synthesis; Mitochondrial Ca²⁺ sequestration [7] [1] | Component of the proton motive force for ATP synthesis; Regulates enzymatic activity |
A Case Study in Divergence: Independent Changes in ΔΨm and ΔpHm
Experimental evidence firmly establishes that ΔΨm and ΔpHm can be dissociated. A pivotal study on rodent cortical neurons demonstrated this critical distinction. Researchers found that exposure to the neurotoxic HIV Tat protein induced mitochondrial hyperpolarization (increased ΔΨm), as measured by both TMRM and Rhod123 [7]. Conventionally, one might interpret this as an increase in the proton gradient and enhanced ATP-generating capacity.
However, when the same cells under identical conditions were assessed with a mitochondrial-targeted pH-sensitive dye (SNARF-1), the results revealed a decrease in mitochondrial pH (increased [H⁺]mito), indicating a loss of the proton gradient [7]. This paradoxical finding—hyperpolarization coinciding with a collapse of the pH gradient—was explained by subsequent experiments showing that Tat induced significant release of Ca²⁺ from mitochondrial and ER stores. The data strongly suggested that the hyperpolarization was driven by these non-protonic cationic charges (Ca²⁺), not by an increase in the proton gradient [7]. This case highlights the critical pitfall of using ΔΨm measurements alone to infer the status of the proton gradient and overall mitochondrial energetic capacity.
The Scientist's Toolkit: Essential Reagents for Mitochondrial Morphofunctional Analysis
Table 2: Key Research Reagents for Investigating Mitochondrial Membrane Potential
| Reagent / Tool | Function / Application | Key Considerations |
|---|---|---|
| TMRM (Tetramethylrhodamine Methyl Ester) | ΔΨm-sensitive fluorescent dye; ideal for chronic studies and measuring pre-existing potential in non-quenching mode [7] [12]. | Lowest mitochondrial binding and minimal ETC inhibition; use in low (non-quenching) or high (quenching) concentrations [7] [5]. |
| Rhodamine 123 (Rhod123) | ΔΨm-sensitive fluorescent dye; best for fast, acute studies in quenching mode [7]. | Slowly permeant; depolarization causes fluorescence unquenching. Less ETC inhibition than TMRE [7]. |
| JC-1 | Ratiometric ΔΨm probe forming J-aggregates; useful for yes/no discrimination of polarization state (e.g., apoptosis) [7] [17]. | Very sensitive to loading concentration; aggregate form can be influenced by factors other than ΔΨm, like mitochondrial volume [7]. |
| FCCP | Protonophore and mitochondrial uncoupler; used as a control to dissipate ΔΨm and validate dye response [12] [18]. | Causes full mitochondrial depolarization, leading to dye release (non-quenching mode) or quenching (quenching mode) [18]. |
| Oligomycin | ATP synthase inhibitor; used as a control to hyperpolarize ΔΨm by inhibiting proton flow through Complex V [18]. | Validates dye response to increased potential; often used to test probe functionality [18]. |
| SNARF-1 | Ratiometric, pH-sensitive fluorescent dye; used to directly measure mitochondrial pH (ΔpHm), not ΔΨm [7]. | Essential for independently assessing the pH gradient component of the proton motive force [7]. |
Experimental Protocols for Reliable ΔΨm Assessment
TMRM in Non-Quenching/Redistribution Mode
This protocol is suited for comparing steady-state ΔΨm between different cell populations or treatments [18].
- Cell Preparation: Seed primary human skin fibroblasts (PHSFs) on glass-bottom dishes and culture until ~80% confluent [18].
- Dye Loading: Load cells with a low concentration of TMRM (e.g., 20-30 nM) in pre-warmed culture medium for 30 minutes at 37°C [18]. Using low concentrations is critical to prevent artifactual quenching [7].
- Image Acquisition: After loading, replace the dye-containing medium with fresh, pre-warmed medium without TMRM (redistribution mode). Image live cells using an epifluorescence or confocal microscope with a 540 nm excitation laser and emission collection above 560 nm [18].
- Data Analysis: Correct images by subtracting background fluorescence from an extracellular region. The fluorescence intensity is proportional to ΔΨm. Include controls with the uncoupler FCCP (1-2 µM) to induce depolarization and oligomycin (1-2 µM) to induce hyperpolarization [18].
Rhodamine 123 in Quenching Mode for Acute Changes
This method is optimal for monitoring rapid, dynamic changes in ΔΨm, such as in response to an acute drug application [7].
- Dye Loading: Load cells with a higher concentration of Rhodamine 123 (e.g., 1-10 µM) for 15-30 minutes to achieve a quenching concentration within mitochondria [7].
- Washout and Setup: Thoroughly wash the cells with dye-free buffer to remove extracellular Rhodamine 123. Place the cells under the microscope in a perfusion system allowing for rapid fluid exchange [7].
- Kinetic Imaging: Begin time-lapse imaging. A mitochondrial depolarization event will cause the dye to be released from the matrix into the cytosol, decreasing its concentration and leading to a transient increase in fluorescence (unquenching). Conversely, hyperpolarization causes increased dye uptake and quenching, decreasing fluorescence [7].
Visualizing the Workflow and Key Distinctions
The following diagram illustrates the logical and experimental workflow for differentiating between ΔΨm and ΔpHm, integrating the tools and protocols described.
The distinction between the mitochondrial membrane potential (ΔΨm) and the mitochondrial pH gradient (ΔpHm) is not merely semantic but foundational to accurate interpretations of mitochondrial function. As demonstrated, these parameters represent different components of the proton motive force and can be independently altered by cellular stressors, with cationic fluxes such as Ca²⁺ being a prime example. The selection of appropriate fluorescent probes—TMRM for stable, chronic studies and Rhod123 for acute kinetic measurements—is crucial for robust data generation. However, these dyes exclusively report on ΔΨm. Therefore, a comprehensive assessment of mitochondrial bioenergetics requires parallel, independent measurements of ΔpHm using specific tools like SNARF-1. Acknowledging and technically addressing this critical distinction prevents misinterpretation and is essential for advancing our understanding of mitochondrial biology in health and disease.
The mitochondrial membrane potential (Δψm) is a key indicator of cellular health and mitochondrial function, reflecting the capacity for ATP production via oxidative phosphorylation [7]. This electrochemical gradient across the inner mitochondrial membrane is fundamentally governed by the Nernst equation, which describes the relationship between ionic concentration gradients and the resulting electrical potential [19] [20]. To study this critical parameter in living cells, researchers predominantly use lipophilic cationic fluorescent probes such as Tetramethylrhodamine Methyl Ester (TMRM) and Rhodamine 123 (Rhod123) [8] [18]. These probes accumulate within the mitochondrial matrix in a Δψm-dependent manner according to Nernstian principles, enabling semi-quantitative assessment of mitochondrial bioenergetic status [7] [18]. This guide provides an objective comparison of TMRM and Rhod123 performance characteristics, supported by experimental data, to inform their application in chronic versus acute mitochondrial membrane potential studies.
Theoretical Foundation: The Nernst Equation
Fundamental Principles and Derivation
The Nernst equation defines the equilibrium potential (Veq) for an ion across a membrane—the electrical potential that exactly balances the chemical concentration gradient [20]. For a cationic species, the equation is expressed as:
E = E° - (RT/nF) ln(Q)
Where E is the actual cell potential, E° is the standard cell potential, R is the gas constant, T is temperature, n is the number of electrons transferred, F is Faraday's constant, and Q is the reaction quotient [19]. At standard biological temperature (37°C), this simplifies to:
E = E° - (0.061 V/n) log(Q) [21]
For mitochondrial studies, the most relevant application is the Nernstian distribution of lipophilic cations like TMRM and Rhod123. These probes accumulate in the mitochondrial matrix in response to the negative internal potential, with the accumulation ratio following the relationship:
Δψm = -59 log([X]in/[X]out) at approximately 25°C [7]
Practical Implications for Probe Behavior
The Nernst equation predicts that a more negative Δψm (hyperpolarized state) will accumulate more cationic dye within the mitochondrial matrix, while depolarization results in probe redistribution into the cytoplasm [7]. This fundamental relationship enables the use of these probes as semi-quantitative indicators of mitochondrial membrane potential, though absolute quantification requires careful calibration for specific experimental conditions [18].
Figure 1: Fundamental relationship between mitochondrial membrane potential and fluorescent probe accumulation as governed by the Nernst equation.
Comparative Analysis: TMRM vs. Rhod123
Performance Characteristics and Experimental Data
Table 1: Direct comparison of TMRM and Rhod123 properties and performance characteristics
| Parameter | TMRM | Rhod123 |
|---|---|---|
| Primary Application | Chronic studies, steady-state measurements [8] [7] | Acute studies, dynamic measurements [8] [7] |
| Recommended Concentration Range | 1-30 nM (non-quenching); >50-100 nM (quenching) [7] | ~1-10 μM (quenching mode) [7] |
| Equilibration Rate | Fast equilibration [7] | Slow equilibration, suited for quenching studies [7] |
| Mitochondrial Binding & ETC Inhibition | Lowest mitochondrial binding and electron transport chain inhibition [7] | Slightly more ETC inhibition than TMRM, slightly less than TMRE [7] |
| Optimal Measurement Mode | Non-quenching/redistribution mode for steady-state [8] [18] | Quenching mode for acute changes [8] [7] |
| Photostability | Good for extended time-lapse studies [12] | Moderate, suitable for acute measurements [7] |
| Sensitivity to Δψm Depolarization | Highest sensitivity to FCCP-induced depolarization [12] | Moderate sensitivity, shows unquenching with depolarization [7] |
Quantitative Performance Data
Table 2: Experimental performance data for TMRM and related probes in mitochondrial morphofunctional analysis
| Probe | Mitochondrial Localization with Normal Δψm | Sensitivity to FCCP-induced Δψm Depolarization | Suited for Automated Morphology Quantification |
|---|---|---|---|
| TMRM | Excellent [12] | Highest (≫ other probes) [12] | Yes [12] |
| Mitotracker Red CMXros | Good [12] | Moderate [12] | Yes [12] |
| Mitotracker Red CMH2Xros | Good [12] | Moderate [12] | Yes [12] |
| Mitotracker Green FM | Good [12] | Lowest sensitivity [12] | Yes [12] |
Experimental Protocols
TMRM Protocol for Steady-State Measurements in Non-Quenching Mode
Method 1: Quantification of mitochondrial membrane potential using TMRM in non-quenching/redistribution mode and epifluorescence microscopy in primary human skin fibroblasts (PHSFs) [18]
Reagent Preparation:
- Prepare TMRM stock solution (1 mM) in dry DMSO, aliquot and store at -20°C
- Prepare TMRM working solution (30 μM) by adding 6 μL TMRM stock solution (1 mM) to 194 μL dry DMSO
- Critical: Always keep TMRM powder and solutions shielded from light
Cell Preparation:
- Low-passage-number PHSFs are seeded on disposable FluoroDishes and cultured in M199 medium in a humidified atmosphere (95% air, 5% CO2, 37°C)
- Culture medium contains Earle's salts, 25 mM HEPES, 100 μg/mL streptomycin, 100 U/mL penicillin, and 10% fetal bovine serum
Staining Protocol:
- Load cells with 30 nM TMRM for 30 minutes at 37°C
- After loading, replace with dye-free medium for imaging (redistribution mode) or maintain low dye concentration (non-quenching mode)
- Visualize using epifluorescence microscopy with excitation at 540 nm
Image Analysis:
- Perform background correction by subtracting mean fluorescence intensity from extracellular region of interest
- Analyze corrected images for mitochondrial fluorescence intensity
- Normalize data to control conditions for comparative studies [18]
Rhod123 Protocol for Dynamic Measurements in Quenching Mode
Method for acute Δψm monitoring using Rhod123 in quenching mode: [7]
Reagent Preparation:
- Prepare Rhod123 stock solution in DMSO according to manufacturer specifications
- Prepare working solution at 1-10 μM concentration in appropriate buffer
Cell Preparation and Staining:
- Load cells with 1-10 μM Rhod123 for optimal quenching conditions
- After loading, wash cells thoroughly to remove extracellular dye
- Perform imaging without dye in bath to monitor redistribution
Data Interpretation in Quenching Mode:
- In quenching mode, higher dye concentrations cause aggregation and fluorescence quenching
- Mitochondrial depolarization causes dye redistribution and unquenching (increased fluorescence)
- Hyperpolarization causes increased dye uptake and quenching (decreased fluorescence) [7]
Figure 2: Decision workflow for selecting appropriate probes and experimental modes based on research objectives.
Research Reagent Solutions
Table 3: Essential materials and reagents for mitochondrial membrane potential studies
| Reagent/Tool | Function/Application | Key Considerations |
|---|---|---|
| TMRM | Lipophilic cationic dye for Δψm measurement | Lowest mitochondrial binding; preferred for chronic studies; use in non-quenching (~1-30 nM) or quenching (>50-100 nM) modes [7] [12] |
| Rhod123 | Lipophilic cationic dye for Δψm measurement | Slower equilibration suited for quenching studies; use at ~1-10 μM for acute measurements [7] |
| FCCP | Mitochondrial uncoupler | Positive control for depolarization; toxic - handle with care [18] [12] |
| Oligomycin | ATP synthase inhibitor | Positive control for hyperpolarization; toxic - handle with care [18] |
| Carbonyl Cyanide-4-Phenylhydrazone (FCCP) | Protonophore uncoupler | Used for validation of Δψm-dependent dye response; complete depolarization indicates healthy mitochondrial preparation [12] |
| Verapamil/Cyclosporin H | Multidrug resistance inhibitors | Prevent export of cationic dyes from cells; use if poor mitochondrial staining observed [18] |
| MitoTracker Green FM | Mitochondrial morphology reference | Δψm-independent staining; 500 nM concentration for SIM imaging; use as spatial reference [22] |
Advanced Applications and Technical Considerations
Super-Resolution Applications
For advanced spatial analysis of mitochondrial membrane potential gradients, TMRM can be combined with structured illumination microscopy (SIM) to differentiate potentials between cristae membranes (CM) and inner boundary membranes (IBM) [22]. This approach reveals that:
- Cristae membranes typically show higher (more negative) membrane potential (ΔΨC) compared to IBM (ΔΨIBM) [22]
- Calcium elevation hyperpolarizes the CM, likely through Ca2+-sensitive increase of TCA cycle and oxidative phosphorylation activity [22]
- Optimal TMRM concentrations for SMPG (spatial membrane potential gradients) analysis range from 1.35-5.4 nM for cristae-selective staining [22]
Critical Experimental Considerations
Quenching vs. Non-Quenching Mode:
- Non-quenching mode (low dye concentrations): Fluorescence intensity directly correlates with Δψm
- Quenching mode (high dye concentrations): Fluorescence inversely correlates with Δψm due to self-quenching at high concentrations [7] [18]
Validation and Controls:
- Include FCCP/uncoupler treatment to confirm Δψm-dependent dye response
- Use oligomycin to induce hyperpolarization as additional control
- Consider multidrug resistance in certain cell types; co-load with verapamil or cyclosporin H if needed [18]
- Account for potential non-protonic charges (e.g., Ca2+) that may affect Δψm without altering proton gradient [7]
The selection between TMRM and Rhod123 for mitochondrial membrane potential studies should be guided by specific experimental requirements. TMRM excels in chronic studies and steady-state measurements due to its low mitochondrial binding, minimal effects on electron transport chain function, and suitability for long-term imaging. Conversely, Rhod123 is optimal for acute dynamic measurements where its slower equilibration and quenching properties enable clear resolution of transient Δψm changes. Both probes operate on the fundamental principle of Nernstian distribution, providing researchers with powerful tools to assess mitochondrial function in living cells, though appropriate controls and validation experiments remain essential for accurate data interpretation.
Protocols in Practice: Applying TMRM and Rhod123 in Quenching and Non-Quenching Modes
The mitochondrial membrane potential (ΔΨm) is a key indicator of mitochondrial health and cellular bioenergetics, serving as the principal driving force for ATP synthesis and playing a vital role in regulating cell fate decisions [7]. Accurate measurement of ΔΨm is therefore essential across diverse research contexts, from fundamental cell biology to drug development. Among the various techniques available, fluorescent cationic dyes represent the most widely employed method for monitoring ΔΨm in living cells. However, the functional performance of these probes varies significantly depending on experimental design, particularly the timeline of investigation.
Two dyes—tetramethylrhodamine methyl ester (TMRM) and rhodamine 123 (Rhod123)—have emerged as particularly valuable tools, each with distinct properties that make them suitable for different experimental scenarios [8] [7]. TMRM is characterized by its low mitochondrial binding and minimal inhibition of the electron transport chain (ETC), while Rhod123 exhibits slightly more ETC inhibition but offers advantages for certain dynamic measurements [7]. This comparison guide provides researchers with evidence-based recommendations for selecting between these probes based on experimental timeline, with a specific focus on matching dye properties to the requirements of both chronic and acute studies.
Technical Comparison: TMRM vs. Rhod123
Fundamental Properties and Operational Characteristics
Table 1: Fundamental Properties of TMRM and Rhod123
| Property | TMRM/TMRE | Rhodamine 123 |
|---|---|---|
| Primary usage context | Best for slow resolving acute studies or measuring pre-existing ΔΨm (non-quenching) [7] | Best for fast resolving acute studies (quenching) [7] |
| Mitochondrial binding & ETC inhibition | Lowest mitochondrial binding and ETC inhibition [7] | Slightly less ETC inhibition and mitochondria binding than TMRE, slightly more than TMRM [7] |
| Equilibration kinetics | Fast equilibration [7] | Slowly permeant means quenching/unquenching changes in fluorescence are easier to spot [7] |
| Standard concentration ranges | Non-quenching: ~1–30 nM (use lowest possible concentration); Quenching: >50–100 nM [7] | Often used in quenching mode (~1–10 μM) [7] |
| Experimental considerations | If test treatment precedes dye loading, dye usually remains in bath for imaging in non-quenching mode; if test treatment succeeds dye loading, dye can remain in bath or not [7] | Often used with dye loading and washout before experimental treatment in quenching mode [7] |
Quantitative Performance Metrics
Table 2: Experimental Performance Characteristics
| Parameter | TMRM | Rhodamine 123 |
|---|---|---|
| Optimal loading concentration | 1-30 nM (non-quenching); >50-100 nM (quenching) [7] | 1-10 μM (quenching mode) [7] |
| Membrane potential sensitivity | High sensitivity to ΔΨm changes, accumulates in matrix in a ΔΨm-dependent manner [8] | High sensitivity to ΔΨm changes, accumulation proportional to ΔΨm [10] |
| Photostability | Moderate to high | Moderate |
| Cellular toxicity | Lower toxicity, minimal ETC inhibition [7] | Moderate toxicity, some ETC inhibition at higher concentrations [7] |
| Signal-to-noise ratio | High in non-quenching mode at appropriate concentrations | High in quenching mode due to aggregation-based fluorescence changes |
Experimental Timelines: Matching Dye to Application
Acute Studies (Seconds to Minutes)
Acute experiments involve monitoring rapid changes in ΔΨm in response to immediate perturbations, such as drug additions, metabolic challenges, or environmental changes.
Recommended Probe: Rhod123 excels in acute studies, particularly when used in quenching mode (~1-10 μM) [7]. Its slower permeation kinetics make fluorescence changes easier to resolve during rapid ΔΨm transitions [7]. In this configuration, dye aggregation within mitochondria quenches fluorescence; mitochondrial depolarization causes dye redistribution and fluorescence unquenching (increased signal), while hyperpolarization enhances quenching (decreased signal) [8].
Protocol for Acute ΔΨm Measurements Using Rhod123 Quenching Mode:
- Culture cells on appropriate imaging chambers until desired confluence is reached
- Load with 1-5 μM Rhod123 in standard buffer for 15-30 minutes at 37°C
- Wash thoroughly with dye-free buffer to remove extracellular Rhod123
- Mount on microscope stage with temperature and CO₂ control maintained
- Establish baseline fluorescence recording (excitation ~503 nm, emission ~527 nm)
- Apply experimental treatment while continuously monitoring fluorescence
- Include control treatments with FCCP/CCCP (uncoupler, 4 μM) to confirm maximal depolarization and oligomycin (ATP synthase inhibitor, 1-5 μg/mL) to induce hyperpolarization [7] [3]
Data Interpretation: In quenching mode, fluorescence intensity increases with depolarization and decreases with hyperpolarization—opposite to the direction of change in non-quenching approaches [7]. This inverse relationship must be considered during analysis.
Chronic Studies (Hours to Days)
Chronic experiments involve extended treatments where ΔΨm assessment occurs after prolonged manipulations, such as genetic modifications, long-term drug exposures, or disease progression studies.
Recommended Probe: TMRM is ideal for chronic studies, typically used in non-quenching mode (1-30 nM) [7]. Its minimal ETC inhibition and low mitochondrial binding reduce cytotoxic effects during extended incubations [7]. In non-quenching mode, higher ΔΨm leads to greater mitochondrial dye accumulation and increased fluorescence, providing a more intuitive signal relationship.
Protocol for Chronic ΔΨm Measurements Using TMRM Non-Quenching Mode:
- Apply chronic experimental treatments (genetic, pharmacological, or environmental) for the desired duration
- Carefully optimize and maintain TMRM concentration at the lowest effective level (typically 1-30 nM) throughout the experiment or load just before measurement [7]
- For endpoint measurements, load cells with TMRM for 20-30 minutes at 37°C
- Image without washing if using very low dye concentrations; otherwise, gentle wash before imaging
- Maintain identical imaging parameters across all experimental conditions
- Include parallel controls for normalization: FCCP/CCCP (4 μM) for minimal ΔΨm and oligomycin (1-5 μg/mL) for maximal ΔΨm [7]
Data Interpretation: In non-quenching mode, fluorescence intensity directly correlates with ΔΨm—higher fluorescence indicates greater polarization. However, careful controls for mitochondrial mass and morphology are essential, as these can influence total signal independent of ΔΨm [7].
Experimental Design and Validation Strategies
Essential Controls and Verification Methods
Regardless of experimental timeline, proper controls are essential for valid ΔΨm interpretation:
Pharmacological Controls:
- FCCP/CCCP (1-10 μM): Protonophores that collapse ΔΨm by increasing membrane permeability to protons, providing a depolarization control [7] [3]
- Oligomycin (1-5 μg/mL): ATP synthase inhibitor that typically hyperpolarizes mitochondria by blocking proton re-entry through F₀ channel [7] [23]
Additional Verification Approaches:
- Monitor plasma membrane potential (ΔΨp) with complementary probes like DiBAC₄(3) to ensure dye distribution reflects ΔΨm rather than ΔΨp changes [7]
- Use Mitotracker dyes (e.g., Mitotracker Green) or mitochondrial-targeted fluorescent proteins to control for variations in mitochondrial mass, morphology, or localization [7]
- Employ numerical analyses such as coefficient of variance of pixel intensities to quantify heterogeneity in ΔΨm [7]
Advanced Technical Considerations
Dye Limitations and Artifacts: Recent research has revealed that rhodamine probes can undergo intracellular modification over time, potentially affecting their fluorescent properties and compartmentalization [3]. These modifications may be particularly relevant in chronic studies and can vary between cell types—for example, tumor cells often exhibit enhanced dye retention compared to normal cells [3]. Additionally, factors beyond protonic charges (such as calcium fluxes) can influence ΔΨm measurements, highlighting that ΔΨm does not always directly reflect changes in mitochondrial pH [7].
Complementary Assays: For comprehensive mitochondrial assessment, combine ΔΨm measurements with additional parameters:
- Cellular ATP/ADP ratios
- Electron transport chain complex activities
- Oxygen consumption rates
- Reactive oxygen species production
- Mitochondrial calcium levels
The Scientist's Toolkit: Essential Research Reagents
Table 3: Key Reagents for ΔΨm Measurements
| Reagent | Function/Purpose | Typical Concentration | Key Considerations |
|---|---|---|---|
| TMRM | ΔΨm measurement in non-quenching mode; minimal toxicity for chronic studies [7] | 1-30 nM (non-quenching); >50-100 nM (quenching) [7] | Lowest mitochondrial binding and ETC inhibition; preferred for many studies [7] |
| Rhodamine 123 | ΔΨm measurement in quenching mode; optimal for acute dynamic studies [7] | 1-10 μM (quenching mode) [7] | Slow permeation facilitates resolution of rapid changes; some ETC inhibition possible [7] |
| FCCP/CCCP | Positive control for mitochondrial depolarization; protonophore uncoupler [7] [3] | 1-10 μM | Collapses proton gradient; validate depolarization response |
| Oligomycin | Positive control for mitochondrial hyperpolarization; ATP synthase inhibitor [7] [23] | 1-5 μg/mL | Blocks proton flow through F₀ channel; may have complex effects in intact cells |
| Mitotracker Green | Mitochondrial mass marker; control for mitochondrial content [7] | Manufacturer recommendation | ΔΨm-independent staining; normalizes for mitochondrial content variations |
| DiBAC₄(3) | Plasma membrane potential (ΔΨp) indicator; control for plasma membrane effects [7] | Manufacturer recommendation | Ensures ΔΨm changes are not confounded by ΔΨp alterations |
Strategic selection between TMRM and Rhod123 based on experimental timeline significantly enhances the reliability and interpretability of mitochondrial membrane potential measurements. For acute studies requiring resolution of rapid ΔΨm dynamics, Rhodamine 123 in quenching mode offers superior performance due to its slower equilibration kinetics and robust fluorescence responses to potential changes. For chronic studies involving extended treatments or prolonged measurements, TMRM in non-quenching mode provides clear advantages with its minimal effects on mitochondrial function and reduced cytotoxicity.
Regardless of the chosen probe, rigorous experimental design incorporating appropriate pharmacological controls, verification of dye behavior, and complementary assessment of mitochondrial parameters remains essential for accurate data interpretation. By aligning probe properties with experimental requirements, researchers can maximize the validity and biological relevance of their mitochondrial assessments across diverse research applications.
The study of mitochondrial membrane potential (ΔΨm) is a cornerstone of cellular bioenergetics, providing critical insights into cell health, stress, and metabolic function. For researchers investigating long-term cellular responses, such as in chronic disease models or extended drug treatments, the choice of fluorescent probe and its correct application is paramount. This guide focuses on the use of Tetramethylrhodamine Methyl Ester (TMRM) in non-quenching mode for assessing ΔΨm in pre-treated samples, positioning it against the alternative probe Rhodamine 123 (Rhod123). The central thesis is that TMRM is the superior probe for chronic study paradigms due to its minimal interference with mitochondrial function and its suitability for prolonged measurements in cells that have undergone prior experimental treatment.
Technical Foundations: Membrane Potential Probes and Measurement Modes
The Principle of ΔΨm Measurement with Cationic Dyes
Lipophilic cationic dyes like TMRM and Rhod123 accumulate within the mitochondrial matrix in a manner dependent on the negative charge of the ΔΨm. This distribution follows the Nernst equation, where a more negative (polarized) ΔΨm leads to greater dye accumulation in the matrix [7] [24]. The total proton motive force (Δp) that drives ATP synthesis is composed of both the ΔΨm (electrical gradient) and the ΔpH (chemical gradient), with ΔΨm typically accounting for approximately 150-180 mV, or about 80%, of the total Δp [7] [16] [24].
Quenching vs. Non-Quenching Mode
A critical distinction in using these dyes is the operational mode, which dictates experimental design and data interpretation.
- Quenching Mode: Cells are loaded with a high concentration of dye (e.g., >50-100 nM for TMRM). The high matrix concentration leads to dye aggregation and consequent fluorescence quenching. A depolarization of ΔΨm causes dye release into the cytosol, leading to de-quenching and an increase in overall fluorescence signal. This mode is often used for acute, rapid measurements [7] [25].
- Non-Quenching Mode: Cells are incubated with a low concentration of dye (e.g., ~1-30 nM for TMRM). The matrix concentration remains low enough to avoid quenching. Here, a depolarization of ΔΨm results in dye release and a decrease in the mitochondrial fluorescence signal. This mode is preferred for chronic studies and pre-treated samples as it is less toxic and allows for more stable, long-term imaging [7] [25].
Comparative Probe Analysis: TMRM vs. Rhodamine 123
The choice between TMRM and Rhod123 is not trivial and has significant implications for data quality and biological relevance, especially in chronic studies.
Direct Performance Comparison
Table 1: Direct comparison of TMRM and Rhodamine 123 for ΔΨm measurement.
| Feature | TMRM | Rhodamine 123 (Rhod123) |
|---|---|---|
| Recommended Use Case | Chronic studies, measuring pre-existing ΔΨm [7] | Fast-resolving acute studies [7] |
| Optimal Mode | Non-quenching [7] [25] | Quenching [7] |
| Mitochondrial Binding | Lowest [7] [26] | Moderate [7] [26] |
| Inhibition of Electron Transport Chain (ETC) | Minimal at low concentrations [7] [26] | Slightly more than TMRM [7] |
| Equilibration Speed | Fast [7] | Slower [7] |
| Key Advantage for Chronic Studies | Minimal disruption to pre-existing mitochondrial physiology in pre-treated samples. | Slower permeation makes quenching/unquenching easier to resolve in acute shifts. |
Experimental Evidence Supporting TMRM for Chronic Studies
The theoretical advantages of TMRM are borne out in experimental data. A 2025 study on pro-inflammatory macrophages demonstrated TMRM's efficacy in a 24-hour LPS stimulation model, a classic chronic paradigm. The researchers used TMRM in non-quenching mode to successfully track a gradual increase in ΔΨm over the 24-hour period, a key finding linking metabolic reprogramming to mitochondrial redox signaling [27]. This study underscores TMRM's reliability for capturing slow, phenotypic changes in ΔΨm.
Furthermore, a 2023 comparative study in primary human skin fibroblasts concluded that "TMRM is better suited for integrated analysis of ΔΨm and mitochondrial morphology than the tested Mitotrackers" under conditions where the membrane potential is not substantially depolarized [12]. This highlights TMRM's value in complex assays where maintaining organelle viability and function over time is crucial.
Detailed Experimental Protocol: TMRM in Non-Quenching Mode for Pre-Treated Cells
The following workflow and protocol are synthesized from best practices detailed across the search results [27] [7] [28].
Step-by-Step Methodology
- Sample Preparation: Culture or treat cells according to the experimental chronic paradigm (e.g., multi-day drug treatment, genetic modification, or differentiation). The key is that the cellular treatment is completed before TMRM staining.
- Dye Solution Preparation: Prepare a working solution of TMRM in the appropriate assay buffer (e.g., phenol-red free culture medium) at a low concentration, typically between 1-30 nM. Using the lowest possible effective concentration is critical to avoid ETC inhibition and artifacts [7] [25].
- Dye Loading: Incubate the pre-treated cells with the TMRM working solution for 20-40 minutes in a cell culture incubator (37°C, 5% CO₂) to allow the dye to reach equilibrium.
- Imaging Setup: For non-quenching mode, the dye must remain in the bath during image acquisition to prevent redistribution driven by concentration shifts [7] [25]. Use a fluorescence microscope with appropriate filters (typical Ex/Em ~548/573 nm).
- Critical Controls: Include parallel control samples to validate the ΔΨm-dependent signal.
- Hyperpolarization Control: Treat cells with oligomycin (1-2.5 µM), an ATP synthase inhibitor, which should increase ΔΨm and thus TMRM fluorescence.
- Depolarization Control: Treat cells with FCCP (0.5-2 µM) or BAM15 (1-5 µM), protonophores that dissipate ΔΨm, leading to a sharp decrease in TMRM fluorescence [27] [24] [12].
Table 2: Key research reagents and resources for TMRM-based chronic ΔΨm studies.
| Item | Function/Description | Example from Literature |
|---|---|---|
| TMRM | Lipophilic cationic dye; primary ΔΨm indicator in non-quenching mode. | Used at low nM concentrations for 24-hour LPS-stimulated macrophage studies [27]. |
| Rhodamine 123 | Alternative cationic dye; more suited for acute, quenching-mode studies. | -- |
| Oligomycin | ATP synthase inhibitor; used as a control to induce mitochondrial hyperpolarization. | Applied to validate hyperpolarization in cortical neurons and fibroblasts [16] [25]. |
| FCCP / BAM15 | Protonophores; uncouplers that dissipate ΔΨm, used as depolarization controls. | FCCP used to collapse ΔΨm in primary human fibroblasts [12]; BAM15 used as an uncoupler in macrophage studies [27]. |
| MitoTracker Deep Red | A fixable, ΔΨm-sensitive dye often used for co-localization or mitochondrial morphology. | Used for co-localization with superoxide probes in macrophages [27]. |
| MitoNeoD / MitoSOX | Mitochondria-targeted fluorescent probes for measuring mitochondrial superoxide. | MitoNeoD used alongside TMRM to correlate ΔΨm and ROS production in macrophages [27]. |
Selecting the correct probe and methodology is fundamental for rigorous mitochondrial bioenergetics research. The evidence consistently shows that TMRM applied in non-quenching mode is the gold standard for chronic studies where the aim is to measure the pre-existing ΔΨm in cells that have been subjected to prior treatment, such as genetic manipulation, long-term drug exposure, or differentiation protocols.
This paradigm leverages TMRM's key strengths: low binding to mitochondrial membranes, negligible inhibition of respiration at low concentrations, and stable signal in equilibrium conditions. In contrast, Rhodamine 123, with its slower equilibration and greater potential for respiratory suppression, is better reserved for fast-resolving acute studies where its quenching properties can be exploited. By adhering to the protocols and comparisons outlined herein, researchers can ensure robust and interpretable data in their investigations of mitochondrial function in chronic disease models and drug development.
The mitochondrial membrane potential (ΔΨm) is a key indicator of mitochondrial function and cellular health, serving as the primary driving force for ATP synthesis and a critical regulator of cell fate decisions, including apoptosis [7] [29]. Among the tools available for monitoring this vital parameter, fluorescent lipophilic cations have become indispensable in biomedical research. Rhodamine 123 (Rhod123) and tetramethylrhodamine methyl ester (TMRM) represent two of the most widely used probes for these measurements, each with distinct properties suited for different experimental timeframes [8] [7]. This guide focuses specifically on the application of Rhod123 in quenching mode for acute, real-time monitoring of dynamic changes in mitochondrial membrane potential, positioning it within the broader methodological comparison with TMRM.
The fundamental principle underlying these probes is their distribution across membranes according to the Nernst equation, where the cationic dyes accumulate within the mitochondrial matrix in proportion to the negative charge maintained across the inner mitochondrial membrane [7] [29]. In quenching mode, which employs higher dye concentrations, the accumulation of Rhod123 leads to aggregation within mitochondria, resulting in fluorescence quenching. Subsequent depolarization events cause dye release and de-quenching, producing a measurable increase in fluorescence intensity that reports on ΔΨm loss [8] [7]. This characteristic makes Rhod123 particularly valuable for capturing rapid mitochondrial membrane potential transients in response to acute cellular perturbations.
Comparative Analysis of Rhod123 and TMRM
Physicochemical and Functional Properties
Table 1: Fundamental Properties of Rhod123 and TMRM
| Property | Rhodamine 123 (Rhod123) | Tetramethylrhodamine Methyl Ester (TMRM) |
|---|---|---|
| Primary Use Case | Acute studies, fast resolving [8] | Chronic studies, slow resolving acute studies [7] |
| Recommended Mode | Quenching mode (~1-10 μM) [7] | Non-quenching mode (~1-30 nM) [7] |
| Equilibration Kinetics | Slow permeation [7] | Fast equilibration [7] |
| Mitochondrial Binding | Moderate (between TMRE and TMRM) [6] [26] | Lowest binding [6] [26] |
| Respiratory Inhibition | Moderate suppression [6] [26] | Minimal to no suppression at low concentrations [6] [26] |
| Key Advantage for Acute Studies | Signal amplification via unquenching upon depolarization [8] [7] | Minimal metabolic interference, stable distribution for chronic imaging [7] |
Performance in Experimental Applications
Table 2: Experimental Performance and Practical Considerations
| Application Parameter | Rhodamine 123 (Rhod123) | Tetramethylrhodamine Methyl Ester (TMRM) |
|---|---|---|
| Optimal Concentration Range | 1-10 μM (quenching mode) [7] | 1-30 nM (non-quenching mode) [7] |
| Fluorescence Response to Depolarization | Increase in fluorescence (unquenching) [8] [7] | Decrease in fluorescence (redistribution) [7] |
| Suitability for Real-Time Kinetics | Excellent for acute changes due to slower equilibration and clear unquenching signal [8] [7] | Less suited for fast kinetics due to rapid redistribution [7] |
| Metabolic Impact | Suppresses mitochondrial respiratory control at higher concentrations [6] [26] | No significant suppression of respiration at recommended low concentrations [6] [26] |
| Artifact Potential | Subject to intracellular modification and sequestration over time; potential for false interpretation [3] [30] | More stable with minimal transformation; lower artifact potential in chronic studies [7] |
| Data Interpretation | Straightforward for acute depolarization (clear unquenching); requires care due to potential dye metabolism [8] [3] | Direct correlation between fluorescence intensity and ΔΨm in non-quenching mode [7] |
Experimental Protocol: Using Rhod123 in Quenching Mode for Acute Studies
Workflow for Real-Time Monitoring in Mammalian Cells
The following workflow outlines a standardized protocol for implementing Rhod123 in quenching mode to monitor acute changes in mitochondrial membrane potential in mammalian cells, such as primary human skin fibroblasts or neuron/astrocyte co-cultures [8].
Critical Protocol Parameters and Optimization
Dye Concentration and Preparation: Prepare a stock solution of Rhod123 in appropriate solvent (e.g., DMSO or 1% methanol in HBSS) and dilute to working concentration of 1-10 μM in experimental buffer [30]. The optimal concentration should be determined empirically for each cell type to ensure adequate signal while minimizing non-specific binding and toxicity.
Loading Conditions: Incubate cells with Rhod123 for 20-30 minutes at 37°C in culture medium or appropriate buffer [8]. Post-loading, wash cells thoroughly with dye-free buffer to remove extracellular dye, which is critical for quenching mode applications where dye redistribution is being measured [7].
Imaging Parameters: For fluorescence microscopy, use excitation at 505 nm and emission detection at 525 nm [30]. Ensure consistent imaging parameters (exposure time, gain, illumination intensity) throughout the experiment to enable quantitative comparison of fluorescence changes.
Validation and Controls: Include parallel samples treated with mitochondrial uncouplers such as CCCP (carbonyl cyanide 3-chlorophenylhydrazone) or FCCP (carbonyl cyanide p-trifluoro-metoxyphenilhydrazone) at 1-10 μM to fully depolarize mitochondria and confirm the specificity of the fluorescence response [8] [23]. A typical positive control would show a rapid increase in Rhod123 fluorescence upon uncoupler addition due to dye release and unquenching [23].
Data Interpretation and Analytical Considerations
Signaling Pathways and Physiological Context
Quantitative Analysis and Normalization Approaches
Proper quantification of Rhod123 fluorescence data requires specific normalization approaches to account for cell-to-cell variability and experimental artifacts:
Baseline Normalization: Normalize fluorescence traces to the initial baseline (F/F₀) where F₀ represents the average fluorescence during the pre-stimulation period. This approach controls for differences in dye loading between cells or samples.
Quenching Amplification Factor: The magnitude of fluorescence increase upon depolarization reflects the degree of quenching that existed before stimulation. Larger increases indicate stronger initial quenching and thus higher initial ΔΨm [11].
Kinetic Parameters: For acute studies, measure the initial rate of fluorescence change following a perturbation, as this provides insight into the kinetics of ΔΨm dynamics. The characteristic response time of mitochondria to substrate changes can be less than 0.1 seconds [11].
Table 3: Key Research Reagents for Rhod123 Quenching Assays
| Reagent/Resource | Function/Application | Example Usage/Notes |
|---|---|---|
| Rhodamine 123 | Fluorescent cationic dye for ΔΨm measurement in quenching mode [8] [7] | Use at 1-10 μM concentration; prepare fresh stock solutions in DMSO or methanol [7] [30] |
| TMRM | Alternative rhodamine dye for non-quenching mode or chronic studies [7] | Use at 1-30 nM for minimal interference; preferred for long-term imaging [7] |
| CCCP | Proton ionophore; positive control for complete mitochondrial depolarization [31] | Apply at 1-10 μM at experiment endpoint to validate dye response [31] |
| Oligomycin | ATP synthase inhibitor; used to test ΔΨm response to inhibited proton flux [23] | Can induce hyperpolarization; useful for testing dye response range [23] |
| FCCP | Potent mitochondrial uncoupler; alternative to CCCP [23] | Used at 1-10 μM to collapse proton gradient; verify activity in specific cell type [23] |
| HBSS Buffer | Physiological buffer for dye loading and live-cell imaging [30] | Supplement with 1% methanol for optimal Rhod123 fluorescence characteristics [30] |
Rhodamine 123 employed in quenching mode represents a robust methodology for monitoring acute changes in mitochondrial membrane potential with high temporal resolution. Its characteristic slow equilibration and pronounced unquenching response upon depolarization make it particularly suited for capturing rapid mitochondrial transients in response to pharmacological treatments, metabolic challenges, or other acute cellular stresses [8] [7]. While TMRM offers advantages for chronic studies due to its minimal metabolic impact and reduced binding characteristics [6] [7], Rhod123 provides distinct benefits for acute experimental paradigms where signal amplification through the quenching-unquenching phenomenon is desirable.
Researchers should select between these probes based on their specific experimental timeframe and objectives, recognizing that each dye occupies a complementary rather than competitive position in the mitochondrial physiologist's toolkit. Proper implementation of the protocols outlined herein, with attention to critical validation controls and potential artifacts, will enable reliable assessment of mitochondrial function in both basic research and drug development applications.
Mitochondrial membrane potential (ΔΨm) is a central indicator of mitochondrial health and cellular viability, reflecting the electrochemical gradient essential for ATP production [7] [32]. Accurate assessment of ΔΨm is crucial in biomedical research, particularly in drug development, where early detection of compound toxicity is paramount [33]. Among the available tools, fluorescent lipophilic cations, specifically tetramethylrhodamine methyl ester (TMRM) and rhodamine 123 (Rhod123), have emerged as premier choices for semi-quantitative analysis in live cells [8] [18].
The strategic selection between TMRM and Rhod123 is often dictated by the experimental timeframe and design. TMRM is exceptionally well-suited for chronic or steady-state studies, such as comparing mitochondrial function between healthy and diseased cell states or during long-term drug treatments [7] [8]. Its key advantage lies in its lower binding to mitochondrial membranes and minimal inhibition of the electron transport chain, which reduces artifacts during prolonged imaging [7] [6] [12]. In contrast, Rhod123, with its faster equilibration and common use in quenching mode, is ideal for resolving acute, dynamic changes in ΔΨm over shorter periods [7] [8]. This protocol focuses on establishing a robust method for TMRM-based steady-state measurements in fibroblasts, providing a direct comparison with Rhod123 to guide researchers in selecting the optimal probe for their specific application.
Theoretical Foundation: Mitochondrial Bioenergetics and Probe Mechanism
The Bioenergetic Basis of the Mitochondrial Membrane Potential
The inner mitochondrial membrane (IMM) hosts the electron transport chain (ETC), which pumps protons (H+) into the intermembrane space, creating an electrochemical gradient known as the proton motive force (Δp) [32]. This force comprises a chemical gradient (ΔpH) and an electrical gradient, the mitochondrial membrane potential (ΔΨm), with the matrix being negatively charged [7]. Typically, ΔΨm contributes approximately 150-180 mV of the total 180-220 mV Δp, serving as the primary driver for ATP synthesis by ATP synthase (Complex V) [7]. ΔΨm is also a key regulator of mitochondrial calcium sequestration, reactive oxygen species (ROS) production, and overall cell fate decisions, making it a vital indicator of cell health [7] [13].
How Cationic Fluorescent Probes Work
TMRM and Rhod123 are lipophilic cations that passively distribute across phospholipid membranes according to the Nernst equation, accumulating within the negatively charged mitochondrial matrix in a ΔΨm-dependent manner [7] [13] [18]. A higher (more negative) ΔΨm leads to greater dye accumulation within mitochondria, and vice versa [7]. A critical operational concept is the distinction between quenching and non-quenching (or redistribution) modes:
- Quenching Mode: High concentrations of dye (e.g., >50-100 nM for TMRM) lead to aggregation in the matrix, causing fluorescence quenching. Mitochondrial depolarization causes dye release into the cytoplasm, decreasing quenching and increasing overall cellular fluorescence [13] [25].
- Non-Quenching/Redistribution Mode: Low dye concentrations (e.g., 1-30 nM for TMRM) prevent quenching. Here, depolarization directly reduces the mitochondrial fluorescence intensity as the dye redistributes to the cytoplasm [7] [13]. This mode is preferred for steady-state measurements and high-resolution imaging of mitochondrial morphology [7] [12].
The following diagram illustrates the fundamental relationship between mitochondrial bioenergetics and the behavior of these probes.
Comparative Probe Analysis: TMRM vs. Rhod123
Key Characteristics and Experimental Selection
The choice between TMRM and Rhod123 involves trade-offs between specificity, temporal resolution, and potential cytotoxicity. The table below summarizes their core characteristics to guide experimental design.
Table 1: Direct Comparison of TMRM and Rhod123 Fluorescent Probes
| Feature | TMRM | Rhodamine 123 (Rhod123) |
|---|---|---|
| Primary Application | Steady-state measurements; chronic studies; pre-existing ΔΨm assessment [7] [8] | Fast-resolution acute studies; dynamic temporal monitoring [7] [8] |
| Recommended Mode | Non-quenching (1-30 nM) or Quenching (>50-100 nM) [7] [13] | Primarily Quenching (~1-10 μM) [7] |
| Equilibration Rate | Fast, but slower permeation than Rhod123 favors steady-state measurements [7] | Fast equilibration, ideal for tracking rapid changes [7] |
| Membrane Binding & ETC Inhibition | Lowest binding and inhibition; preferred for long-term studies [7] [6] [12] | Slightly more ETC inhibition and binding than TMRM [7] |
| Fluorescence Response to Depolarization | Non-quenching mode: Signal decreases in mitochondria [13].Quenching mode: Cytoplasmic signal increases [25]. | Quenching mode: Unquenching causes transient fluorescence increase [7]. |
Supporting Experimental Data
A comparative study on primary human skin fibroblasts demonstrated the superior sensitivity of TMRM to ΔΨm changes. Following treatment with the uncoupler FCCP, which completely depolarizes ΔΨm, the mitochondrial localization of TMRM was significantly more reduced compared to various Mitotracker dyes (e.g., CMH2Xros, CMXros) [12]. This confirms that TMRM signal integrity is strongly dependent on an intact potential, a critical trait for reliable steady-state measurements [12].
Furthermore, investigations into isolated mitochondria revealed that all rhodamine dyes exhibit some degree of membrane binding and can suppress respiratory control. Among them, TMRM showed the least binding and, when used at low concentrations, did not suppress mitochondrial respiration, underscoring its minimal impact on the biological system being measured [6] [10].
Detailed Experimental Protocol: TMRM in Fibroblasts
This protocol is optimized for steady-state ΔΨm measurement in primary human skin fibroblasts (PHSFs) using TMRM in non-quenching mode with epifluorescence microscopy [8] [18].
The Scientist's Toolkit: Essential Reagents and Materials
Table 2: Key Research Reagent Solutions
| Item | Function / Description |
|---|---|
| TMRM (e.g., Thermo Fisher, T668 / I34361) [33] | Cell-permeant cationic dye that accumulates in active mitochondria. Provided as a powder or ready-made solution. |
| Dry DMSO | High-quality solvent for preparing TMRM stock and working solutions. |
| Culture Medium (e.g., M199) | Fibroblast growth medium, preferably without phenol red for fluorescence imaging. |
| Oligomycin (ATP synthase inhibitor) | Control compound to induce mitochondrial hyperpolarization [13] [25]. |
| FCCP (Carbonyl cyanide 4-(trifluoromethoxy)phenylhydrazone) | Protonophore uncoupler; control compound to induce complete mitochondrial depolarization [13] [25]. |
| Verapamil or Cyclosporin H | Inhibitors of multidrug resistance transporters; can be used if poor staining is observed due to dye efflux [18]. |
Step-by-Step Procedure
Probe Preparation:
- Prepare a 1 mM TMRM stock solution in dry DMSO. Aliquot and store protected from light at -20°C.
- Prepare a 30 μM TMRM working solution by diluting the stock in dry DMSO. This solution can be stored at -20°C for up to one year [18].
- Critical: Always protect TMRM from light to prevent photodegradation.
Cell Preparation:
- Seed low-passage-number PHSFs on glass-bottom dishes (e.g., FluoroDishes) and culture to ~70% confluence in complete growth medium [18].
Staining and Image Acquisition:
- Dilute the TMRM working solution in pre-warmed culture medium to a final concentration of 20-30 nM (for non-quenching mode) [7] [18].
- Replace the cell culture medium with the TMRM-containing medium.
- Incubate cells for 30 minutes at 37°C in a humidified, 5% CO₂ incubator.
- Optional: For a more precise measurement, replace the staining medium with dye-free pre-warmed medium after incubation. However, for steady-state comparisons in non-quenching mode, imaging can be performed with the dye present in the bath [7] [18].
- Acquire images using an epifluorescence microscope equipped with a TRITC filter set (Ex ~540 nm / Em ~574 nm) and a 40x or 60x oil-immersion objective [18]. Use consistent exposure times across all experimental conditions.
Experimental Controls:
- Hyperpolarization Control: Treat cells with 1-10 μM oligomycin for 15-30 minutes prior to and during imaging. This increases ΔΨm, leading to brighter TMRM fluorescence [13] [25].
- Depolarization Control: Treat cells with 1-10 μM FCCP for 5-10 minutes at the end of the experiment. This collapses ΔΨm, resulting in a loss of mitochondrial TMRM signal and its diffusion into the cytoplasm [13] [25]. The success of the experiment is confirmed by a robust response to FCCP.
The workflow for the experimental procedure, including critical controls, is summarized below.
Image Processing and Data Analysis
- Background Subtraction: For each image, subtract the background signal. This can be done by subtracting an image of a region without cells or by measuring the mean fluorescence intensity in an extracellular region of interest (ROI) and subtracting this value from every pixel in the image [18].
- Fluorescence Quantification: Using the background-corrected image, quantify the mean fluorescence intensity per cell or within mitochondria-defined ROIs. For population-level comparisons, the average intensity from multiple cells across different fields of view is calculated [18].
- Interpretation: In non-quenching mode, a higher mean fluorescence intensity indicates a more hyperpolarized (more negative) ΔΨm, while a lower intensity indicates depolarization. Data should be normalized to control conditions (e.g., untreated cells) for comparison [8].
Technical Considerations and Best Practices
Troubleshooting Common Issues
- Poor Mitochondrial Staining: This could be due to active export of the dye by multidrug resistance proteins. Co-loading with inhibitors like verapamil or cyclosporin H can mitigate this. Also, verify cell viability [18].
- High Background Signal: Ensure the TMRM concentration is within the recommended range for non-quenching mode (e.g., 20-30 nM). Excessive concentration leads to cytoplasmic signal and quenching artifacts [7] [13].
- Artifactual Responses: Remember that ΔΨm dyes are sensitive to charge gradients, not exclusively proton gradients. Changes in other ions, like Ca²⁺, can independently influence ΔΨm readings without a corresponding change in the proton gradient (ΔpHm) [7]. Using appropriate controls is essential for correct interpretation.
Advancing to High-Throughput Analysis
For large-scale profiling, such as in drug toxicity screening, the TMRM protocol can be adapted for high-content imaging systems. This enables unbiased, high-throughput quantification of ΔΨm kinetics not only in 2D monolayers but also in more complex 3D models like spheroids and co-cultures, facilitating the analysis of hundreds of cells per condition [13] [25].
This guide provides a detailed framework for employing TMRM to assess steady-state mitochondrial membrane potential in fibroblasts. TMRM stands out for its minimal perturbation of mitochondrial function, making it the probe of choice for chronic studies and accurate steady-state comparisons. In contrast, Rhod123 excels in capturing rapid, acute changes in ΔΨm. The provided protocol, supported by optimized experimental parameters and validated controls, empowers researchers in drug development and basic science to robustly integrate mitochondrial health assessment into their workflow, generating reliable and interpretable data.
Mitochondrial membrane potential (ΔΨm) is a key indicator of cellular health and mitochondrial function, serving as the primary driver for ATP synthesis [7]. Fluorescent, lipophilic cationic probes are the cornerstone of ΔΨm assessment in living cells, with Tetramethylrhodamine Methyl/Ethyl Ester (TMRM/TMRE) and Rhodamine 123 (Rhod123) being among the most prominent [7] [18]. The choice between these probes is not trivial and is fundamentally guided by the experimental timeframe and the nature of the biological question. A critical distinction exists between acute, fast-resolving kinetic studies and chronic or steady-state measurements [7] [18]. Within this paradigm, TMRM is often favored for chronic studies or measuring pre-existing ΔΨm due to its low mitochondrial binding and minimal disruption of the electron transport chain (ETC) [7] [13]. In contrast, Rhod123 is best suited for fast-resolving acute studies, as its slower permeation across membranes makes fluorescence changes easier to capture and quantify in real-time [7]. This protocol details the application of Rhod123 specifically for kinetic measurements of ΔΨm in neuronal cultures, providing a robust methodology to monitor dynamic changes in mitochondrial bioenergetics.
Theoretical Foundation and Rationale
Principles of ΔΨm Measurement with Cationic Dyes
Cationic dyes like Rhod123 and TMRM accumulate within the mitochondrial matrix in a Nernstian fashion, governed by the negative charge of the matrix relative to the cytoplasm [7]. The driving force is the proton electrochemical gradient, or proton motive force (Δp), which comprises both the membrane potential (ΔΨm) and the pH gradient (ΔpHm): Δp (mV) = ΔΨm − 60ΔpHm [7]. Typically, ΔΨm accounts for 150-180 mV of the total ~180-220 mV Δp [7]. These dyes are taken up by mitochondria in proportion to ΔΨm; a more negative (hyperpolarized) potential leads to greater dye accumulation, and a less negative (depolarized) potential leads to dye release [7] [13].
Operational Modes: Quenching vs. Non-Quenching
Rhod123 can be used in two primary modes, which dictate the experimental design and interpretation of fluorescence signals:
- Quenching Mode: In this mode, cells are loaded with a high concentration of Rhod123 (~1–10 μM) [7]. The dye accumulates in the mitochondrial matrix to such a high level that its fluorescence becomes quenched (diminished) due to aggregation and self-quenching effects [7] [11]. Upon mitochondrial depolarization, the dye is released into the cytoplasm, leading to a dequenching and a transient increase in overall cellular fluorescence [7]. This mode is highly sensitive to acute changes in ΔΨm.
- Non-Quenching/Redistribution Mode: This mode uses low dye concentrations to avoid quenching artifacts. The fluorescence intensity directly reflects the amount of dye in a given compartment. It is more suited for steady-state comparisons of ΔΨm between different cell populations or conditions [18].
For kinetic measurements of acute changes, the quenching mode is generally recommended [7].
Critical Considerations and Potential Pitfalls
- Dye Modifications: Rhod123 can undergo intracellular and intramitochondrial modifications, potentially leading to its conversion to other forms (e.g., rhodamine 110) that are impermeable and trapped inside the cell, which can confound results [3].
- Non-Protonic Charges: Cationic dyes measure the total electrical gradient (ΔΨm), not specifically the proton gradient (ΔpHm). Changes in other ion fluxes (e.g., Ca²⁺) can directly affect ΔΨm without altering the proton motive force, necessitating careful interpretation [7].
- Efflux Transporters: Multidrug resistance (MDR) proteins can export Rhod123 from the cell, potentially reducing the signal. Co-loading with inhibitors like verapamil or cyclosporin H can mitigate this in some cell types [18] [3].
- Self-Quenching and Inner Filter Effect: The relationship between Rhod123 concentration and fluorescence is non-linear. At high concentrations (>5-20 μM), self-quenching and inner filter effects can significantly attenuate the fluorescence signal, which must be accounted for in quantitative models [11].
Materials and Reagents
Research Reagent Solutions
Table 1: Essential reagents and materials for Rhod123-based ΔΨm assays.
| Item | Function/Description | Example/Catalog Consideration |
|---|---|---|
| Rhodamine 123 | Primary fluorescent probe for ΔΨm. Prepare a 1-10 mM stock solution in Dry DMSO. Aliquot and store at -20°C, protected from light. [18] | Molecular Probes, Cat# R302 |
| FCCP | Protonophore uncoupler. Used to completely collapse ΔΨm for validation of dye response. Prepare a 1-10 mM stock in Dry DMSO. [7] [34] | Sigma-Aldrich, Cat# C2920 |
| Oligomycin | ATP-synthase inhibitor. Used in combination with FCCP to prevent reverse activity of ATP synthase and ensure full depolarization. [13] [34] | Sigma-Aldrich, Cat# 75351 |
| Carbonyl Cyanide m-chlorophenyl hydrazone (CCCP) | Alternative protonophore uncoupler to collapse ΔΨm. [11] [3] | Sigma-Aldrich, Cat# C2759 |
| Verapamil or Cyclosporin H | Inhibitors of multidrug resistance transporters; can be used to improve dye retention if needed. [18] [3] | - |
| Hank's Balanced Salt Solution (HBSS) or Phenol Red-Free Imaging Buffer | Electrolyte-based buffer for live-cell imaging, maintaining physiological pH and ion concentrations. | Thermo Fisher Scientific |
| Dry DMSO | Solvent for preparing stock solutions of hydrophobic reagents. | - |
| Poly-L-Lysine or Poly-L-Ornithine | Coating agents for preparing adherent neuronal cultures on imaging dishes. [13] | - |
| Primary Neuronal Cultures | Biological model system. Isolated from rodent hippocampus or cortex. [34] | - |
| Live-Cell Imaging Dish | Fluorodish or similar glass-bottom dish for high-resolution microscopy. | - |
Step-by-Step Experimental Protocol
Preparation of Cells and Reagents
- Cell Culture: Maintain primary hippocampal or cortical neuronal cultures from neonatal rats according to established protocols [34]. Seed cells on poly-L-lysine-coated glass-bottom FluoroDishes at an appropriate density and allow for full differentiation.
- Solution Preparation:
- Prepare a Rhod123 working solution (e.g., 5 μM) in pre-warmed (37°C) imaging buffer (e.g., HBSS) from the stock solution. Protect from light.
- Prepare stocks of pharmacological modulators: FCCP (e.g., 1-10 mM), Oligomycin (e.g., 1-10 mM) in DMSO.
Staining and Image Acquisition Workflow
The following diagram outlines the core experimental workflow for kinetic measurements.
Step 1: Dye Loading
- Carefully remove the culture medium from the neurons.
- Gently wash the cells once with pre-warmed imaging buffer.
- Incubate the cells with the Rhod123 working solution (e.g., 5 μM in imaging buffer) for 15-30 minutes at 37°C in the dark. This high concentration is selected to establish the quenching mode [7] [34].
Step 2: Wash and Equilibration
- After the loading period, gently remove the Rhod123 solution.
- Wash the cells twice with fresh, pre-warmed imaging buffer to remove all extracellular dye. It is critical to prevent residual extracellular dye from contributing to the background signal.
- Add a final volume of fresh imaging buffer for imaging. For quenching mode assays, the dye is typically not present in the bath during imaging after washout [7].
Step 3: Microscopy Setup and Baseline Acquisition
- Place the dish on a temperature-controlled stage (37°C) of an epifluorescence or confocal microscope.
- Use standard FITC/GFP filter sets (Excitation ~503 nm, Emission ~527 nm) for Rhod123 [11].
- Focus on a field of healthy neurons. To avoid dequenching artifacts from dye released into the cytosol, limit the quantitative analysis to the area above the nucleus, a region typically devoid of mitochondria [34].
- Begin time-lapse acquisition, collecting images every 15-30 seconds for 5-10 minutes to establish a stable fluorescence baseline.
Step 4: Experimental Perturbation and Kinetic Recording
- Without interrupting the acquisition, add the experimental treatment. This could be a neuroactive compound like glutamate (e.g., 100 μM) to study excitotoxicity [34], or pharmacological controls.
- Continue time-lapse acquisition for another 10-30 minutes to monitor the kinetic fluorescence response.
- Validation Controls: At the end of each experiment, apply FCCP (1-4 μM) together with oligomycin (10 μM) to fully depolarize mitochondria. This should cause a sharp increase in fluorescence due to dye dequenching, confirming the ΔΨm-dependence of the Rhod123 signal [34].
Data Analysis and Interpretation
Fluorescence Quantification
- Background Subtraction: For each image, subtract the mean fluorescence intensity of a cell-free region from the entire image or from the cellular regions of interest (ROIs) [18].
- Region of Interest (ROI) Analysis: Define ROIs, preferably over the area above the nucleus as recommended for quenching mode to specifically measure the dye released from mitochondria upon depolarization [34]. Alternatively, ROIs can be drawn around the entire cell body.
- Normalization: Normalize the fluorescence intensity (F) at each time point to the average baseline fluorescence (F₀) calculated from the initial stable recording period. This yields F/F₀.
- Kinetic Traces: Plot normalized fluorescence (F/F₀) over time.
Interpretation of Fluorescence Changes
- Increase in F/F₀: Indicates mitochondrial depolarization. Dye is released from the mitochondria into the cytoplasm, leading to dequenching and an overall increase in fluorescence [7] [34].
- Decrease in F/F₀: Indicates mitochondrial hyperpolarization. More dye is accumulated into the mitochondrial matrix, leading to increased quenching and a decrease in fluorescence [7] [34].
Comparative Performance Data: Rhod123 vs. TMRM
Table 2: Quantitative and qualitative comparison of Rhod123 and TMRM/TMRE for ΔΨm assessment.
| Parameter | Rhodamine 123 (Rhod123) | TMRM / TMRE |
|---|---|---|
| Recommended Application | Fast-resolving acute studies (quenching mode) [7] | Chronic studies, steady-state ΔΨm measurement (non-quenching mode) [7] |
| Equilibration Kinetics | Slower permeation; easier to resolve acute changes [7] | Fast equilibration [7] |
| Typical Working Concentration (Quenching Mode) | ~1 - 10 μM [7] | >50 - 100 nM [7] |
| Typical Working Concentration (Non-Quenching Mode) | - | ~1 - 30 nM [7] |
| Fluorescence Response to Depolarization | Increase (dequenching) [7] [34] | Decrease (dye release from mitochondria) [7] [13] |
| Inhibition of Electron Transport Chain (ETC) | Slightly more than TMRM, slightly less than TMRE [7] | Lowest; TMRM is preferred to minimize ETC inhibition [7] [13] |
| Mitochondrial Binding | Moderate [5] | Low (TMRM), especially compared to TMRE [7] [5] |
| Suitability for Neuronal Cultures | Demonstrated in hippocampal neurons/astrocytes co-cultures for acute challenges (e.g., glutamate) [34] | Excellent for long-term health assessment and pre-existing potential measurement [7] |
Troubleshooting and Optimization
Table 3: Common problems and solutions in Rhod123-based ΔΨm assays.
| Problem | Possible Cause | Solution |
|---|---|---|
| Poor mitochondrial staining / Low signal | Efflux by MDR transporters; non-viable cells [18] | Co-load with verapamil or cyclosporin H; ensure proper cell health and handling. |
| No response to FCCP/Oli | Compromised mitochondrial function; insufficient uncoupler concentration. | Test mitochondrial function with other assays; titrate FCCP/Oli concentration for optimal response. |
| High background fluorescence | Incomplete wash after loading. | Increase number or volume of washes with pre-warmed buffer. |
| Photobleaching | Excessive light exposure during acquisition. | Reduce illumination intensity, use a neutral density filter, or increase camera binning. |
| Heterogeneous response between cells | Natural biological variation; mixed cell types in culture. | Use machine learning or gating strategies to analyze subpopulations separately [13]. Ensure culture purity. |
In the realm of mitochondrial research, particularly when employing fluorescent probes like TMRM (tetramethylrhodamine methyl ester) and Rhodamine 123 (Rhod123) for assessing mitochondrial membrane potential (ΔΨm), the inclusion of robust pharmacologic controls is not merely recommended—it is essential for data validation. These controls verify that observed fluorescent signals genuinely reflect changes in ΔΨm rather than experimental artifacts or probe-related inconsistencies. The dynamic interplay between probe selection (chronic versus acute studies) and control application forms the cornerstone of reliable mitochondrial bioenergetics research. Two compounds, FCCP/CCCP (uncouplers) and oligomycin (ATP synthase inhibitor), serve as the gold standard controls, creating predictable, opposing perturbations in ΔΨm that confirm the system's proper functioning and the probe's accurate response [7] [35]. This guide provides a detailed, experimental data-driven comparison of their use within the specific context of TMRM and Rhod123 applications.
Theoretical Basis of FCCP/CCCP and Oligomycin
Mechanism of Action
FCCP/CCCP (Carbonyl cyanide-p-trifluoromethoxyphenylhydrazone) belongs to a class of compounds known as protonophores, or uncouplers. These small, lipophilic weak acids can shuttle protons across the inner mitochondrial membrane, effectively dissipating the proton gradient that constitutes the mitochondrial membrane potential. FCCP does not inhibit any specific complex of the electron transport chain (ETC); instead, it makes the membrane leaky to protons, short-circuiting the coupling between electron transport and ATP synthesis. This results in a rapid and complete collapse of the ΔΨm [36] [35].
Oligomycin is a macrolide antibiotic that acts as a potent inhibitor of the mitochondrial F1F0-ATP synthase (Complex V). It binds specifically to the Fo subunit, blocking the proton channel and preventing protons from flowing back into the matrix through this complex. Consequently, proton pumping by the ETC continues but is halted by the back-pressure of the undissipated proton gradient, leading to a hyperpolarization of the ΔΨm (a more negative internal potential). However, in scenarios where the ETC is compromised or cytochrome c has been released, oligomycin can induce a depolarization by inhibiting the reverse operation of the ATP synthase, which was consuming ATP to maintain ΔΨm [36] [37] [35].
Table 1: Fundamental Properties of Pharmacologic Controls
| Property | FCCP/CCCP | Oligomycin |
|---|---|---|
| Primary Target | Inner mitochondrial membrane (no specific protein) | F1F0-ATP synthase (Complex V) |
| Molecular Mechanism | Protonophore / Uncoupler | Enzyme inhibitor (binds Fo subunit) |
| Effect on ΔΨm | Rapid Depolarization (Collapse) | Hyperpolarization (Increase) |
| Effect on ATP Synthesis | Halts (Uncoupled from ETC) | Halts (Directly Blocks ATP Synthase) |
| Respiratory Effect | Stimulates maximum O2 consumption | Inhibits respiration |
Visualizing the Mechanisms
The following diagram illustrates the opposing mechanisms of FCCP/CCCP and Oligomycin within the context of the electron transport chain and ATP synthesis.
Experimental Application and Data Interpretation
Expected Fluorescent Responses with TMRM and Rhod123
The direction of fluorescence change upon addition of controls is dependent on the fluorescent probe and the mode of measurement (quenching vs. non-quenching). The table below summarizes the expected responses, which are critical for correct interpretation.
Table 2: Expected Fluorescence Responses to Pharmacologic Controls
| Probe & Mode | FCCP/CCCP Addition | Oligomycin Addition | Key Rationale |
|---|---|---|---|
| TMRM (Non-Quenching) | Decrease in mitochondrial fluorescence | Increase in mitochondrial fluorescence | ΔΨm-dependent redistribution between mitochondria and cytosol/bath. |
| Rhod123 (Quenching Mode) | Increase (Unquenching) in whole-cell fluorescence | Decrease (Increased Quenching) in whole-cell fluorescence | High matrix [dye] causes quenching; depolarization redistributes dye, unquenching fluorescence. |
Quantitative Performance Data
The efficacy of these controls has been quantitatively demonstrated across studies. For instance, in primary human skin fibroblasts, the mitochondrial localization of TMRM was exquisitely sensitive to FCCP-induced depolarization, showing a significantly greater decrease compared to various MitoTracker dyes [12]. Furthermore, quantitative modeling in HepG2 cells has shown that incorporating the pharmacokinetic decay of FCCP is essential for accurately fitting the observed ΔΨm dynamics, underscoring the compound's potent and concentration-dependent effect [36]. In rat cortical neurons, calibrated measurements have shown that FCCP can completely collapse ΔΨm, while oligomycin can hyperpolarize it from a resting state of approximately -139 mV to around -158 mV [16].
Detailed Experimental Protocols
Protocol for TMRM in Non-Quenching/Redistribution Mode
This protocol is ideal for comparing steady-state ΔΨm between different cell populations or chronic treatments, and for observing dynamic responses to acute perturbations [18].
Materials & Reagents:
- TMRM Stock Solution: 1 mM in dry DMSO. Aliquot and store protected from light at -20°C.
- TMRM Working Solution: 30 µM in dry DMSO, prepared from stock.
- Imaging Buffer: e.g., Hanks' Balanced Salt Solution (HBSS) or phenol-red free culture medium.
- Control Stocks: 1-10 mM FCCP/CCCP and 1-10 mg/mL oligomycin in DMSO.
- Cells: Adherent cells (e.g., primary human skin fibroblasts, HepG2) seeded on imaging-compatible dishes.
Procedure:
- Loading: Incubate cells with a low concentration of TMRM (e.g., 10-30 nM) in imaging buffer for 20-40 minutes at 37°C to allow equilibrium distribution. For chronic studies where the treatment precedes staining, the dye can remain in the bath during imaging [7] [18].
- Wash & Imaging: Gently wash cells with pre-warmed imaging buffer to remove non-specific background fluorescence. Add fresh imaging buffer (with or without a low maintenance concentration of TMRM) and acquire baseline images using epifluorescence or confocal microscopy.
- Application of Controls:
- Add FCCP/CCCP (typically 1-5 µM final concentration) and monitor the time-course of fluorescence loss from mitochondria (and concomitant increase in cytosolic fluorescence) for 5-15 minutes.
- In a separate experiment, after acquiring a baseline, add oligomycin (typically 1-5 µM final concentration) and monitor the increase in mitochondrial fluorescence over 10-20 minutes.
- Termination: Add a high concentration of FCCP (e.g., 10 µM) at the end of the experiment to confirm that any residual mitochondrial signal is ΔΨm-dependent.
Data Analysis:
- For steady-state comparisons, measure the mean fluorescence intensity of individual mitochondria or the background-subtracted mean intensity of whole-cell mitochondrial regions after background correction [18].
- For dynamic studies, plot the fluorescence intensity over time and normalize to the baseline (F/F0).
Protocol for Rhod123 in Quenching Mode
This protocol is optimized for fast-resolution acute studies where real-time monitoring of ΔΨm changes is required [7] [18].
Materials & Reagents:
- Rhod123 Stock Solution: 1-10 mM in DMSO.
- Control Stocks: As in Protocol 4.1.
- Imaging Buffer: As above.
Procedure:
- Loading & Washout: Load cells with a higher concentration of Rhod123 (e.g., 1-10 µM) for 15-30 minutes at 37°C. Thoroughly wash the cells with pre-warmed imaging buffer to remove all extracellular dye. The dye should not be present in the bath during imaging [7].
- Baseline Acquisition: Acquire images of the uniformly fluorescent cell(s). The high intramitochondrial concentration at resting ΔΨm leads to aggregation and quenching of fluorescence.
- Application of Controls:
- Add FCCP/CCCP (1-5 µM). The depolarization causes Rhod123 to be released from mitochondria into the cytosol, where it becomes diluted and unquenched, resulting in a transient increase in whole-cell fluorescence.
- Add oligomycin (1-5 µM). The hyperpolarization draws more Rhod123 into the mitochondria, increasing quenching and causing a decrease in whole-cell fluorescence.
- Data Analysis: Quantify the whole-cell fluorescence intensity over time. The changes are best represented as a percentage increase or decrease from the baseline fluorescence.
Workflow for a Controlled ΔΨm Experiment
The following diagram outlines a generalized workflow for conducting a mitochondrial membrane potential experiment incorporating these essential pharmacologic controls.
The Researcher's Toolkit: Essential Reagents & Materials
Table 3: Key Research Reagent Solutions for ΔΨm Studies
| Reagent / Material | Function / Purpose | Example Usage & Notes |
|---|---|---|
| TMRM (Tetramethylrhodamine methyl ester) | Cationic ΔΨm probe for chronic/acute studies. Low toxicity & minimal binding. | Used in non-quenching mode (nM range). Ideal for dynamic redistribution assays [7] [12]. |
| Rhodamine 123 (Rhod123) | Cationic ΔΨm probe for fast acute studies. | Used in quenching mode (µM range) with washout. Excellent for detecting rapid changes [7] [18]. |
| FCCP / CCCP | Protonophore uncoupler; positive control for ΔΨm depolarization. | Used at 1-5 µM final concentration. Verify complete collapse of potential [36] [35]. |
| Oligomycin | ATP synthase inhibitor; positive control for ΔΨm hyperpolarization. | Used at 1-5 µM. Response confirms coupling and functional ETC [36] [35]. |
| Verapamil / Cyclosporin H | Inhibitors of multidrug resistance transporters. | Co-loading (e.g., 10-50 µM) can improve dye retention in problematic cell lines [18]. |
| Hanks' Balanced Salt Solution (HBSS) | Physiological salt solution for live-cell imaging. | Prefer phenol-red-free formulation to minimize background fluorescence during microscopy. |
Troubleshooting and Best Practices
Even with proper controls, researchers may encounter challenges. The table below outlines common issues and their solutions.
Table 4: Troubleshooting Guide for Pharmacologic Controls
| Problem | Potential Cause | Recommended Solution |
|---|---|---|
| Weak or No Response to FCCP | Inadequate concentration; inactive compound; probe efflux. | Titrate FCCP (0.5-10 µM); make fresh DMSO stocks; use multidrug resistance inhibitors like verapamil [18]. |
| Unexpected Depolarization with Oligomycin | Compromised ETC; prior cytochrome c release. | Oligomycin-induced depolarization indicates mitochondria are using ATP synthase reversal to maintain ΔΨm, a sign of pathology [37]. |
| High Background / Poor Mitochondrial Localization | Incorrect probe concentration; insufficient washing; non-specific binding. | Optimize loading concentration and time; ensure thorough washing; use the lowest probe concentration that provides a clear signal [7]. |
| Heterogeneous Response in Cell Population | Genuine biological variability; mixed cell states; varying levels of probe uptake. | Analyze cells individually or by gating subpopulations in flow cytometry. This heterogeneity can be biologically informative [38]. |
In conclusion, the rigorous application of FCCP/CCCP and oligomycin is a non-negotiable practice for validating mitochondrial membrane potential measurements with TMRM and Rhod123. Understanding their distinct mechanisms, the expected fluorescent responses, and integrating them into robust experimental protocols empowers researchers to draw confident conclusions about mitochondrial health and function in both chronic and acute study paradigms.
Navigating Pitfalls: Technical Challenges and Optimization Strategies for ΔΨm Assays
The accurate assessment of mitochondrial membrane potential (ΔΨm) is fundamental to understanding cellular bioenergetics, health, and dysfunction in diseases ranging from neurodegenerative disorders to cancer. Fluorescent lipophilic cations, particularly tetramethylrhodamine methyl ester (TMRM) and rhodamine 123 (Rhod123), have become indispensable tools for estimating ΔΨm in living cells. These probes accumulate in the mitochondrial matrix in a ΔΨm-dependent manner, driven by the highly negative internal environment of polarized mitochondria [8] [7]. However, the very properties that make these probes useful also predispose them to specific artifacts that can compromise data interpretation if not properly addressed. Self-quenching at high concentrations, non-specific binding to cellular components, and active efflux by cellular transport systems represent significant sources of potential error [11] [3]. Understanding these probe-specific artifacts is essential for selecting the appropriate dye—TMRM for chronic studies or Rhod123 for acute investigations—and for implementing controls that ensure accurate assessment of mitochondrial function. This guide provides a systematic comparison of these artifacts, supported by experimental data and methodological recommendations for researchers and drug development professionals.
Fundamental Probe Characteristics and Operational Modes
Basic Properties and Typical Usage
Table 1: Fundamental Characteristics of TMRM and Rhodamine 123
| Characteristic | TMRM/TMRE | Rhodamine 123 |
|---|---|---|
| Primary Application Suitability | Chronic studies, pre-existing ΔΨm measurement [7] | Acute studies, dynamic monitoring of ΔΨm changes [7] |
| Chemical Nature | Lipophilic cationic fluorophore | Lipophilic cationic fluorophore |
| Mitochondrial Binding | Lowest among common dyes [7] | Moderate; more than TMRM, less than TMRE [7] |
| ETC Inhibition | Minimal [7] | Moderate [7] |
| Equilibration Speed | Fast [7] | Slow permeation [7] |
| Standard Working Concentrations | Non-quenching: ~1-30 nM; Quenching: >50-100 nM [7] | Quenching mode: ~1-10 μM [7] |
Operational Modes: Quenching vs. Non-Quenching
Both TMRM and Rhod123 can be used in two distinct operational modes, which fundamentally affect their fluorescence behavior and data interpretation:
Non-Quenching/Redistribution Mode: Employed at low probe concentrations (e.g., TMRM at ~1-30 nM), where fluorescence intensity primarily reflects mitochondrial dye concentration and thus ΔΨm. In this mode, depolarization causes dye redistribution out of mitochondria, decreasing mitochondrial fluorescence and increasing cytosolic fluorescence [8] [7].
Quenching Mode: Used at higher probe concentrations (e.g., TMRM >50-100 nM, Rhod123 at ~1-10 μM), where accumulated dye reaches self-quenching concentrations within mitochondria. In this mode, depolarization causes dye release and dequenching, resulting in a transient increase in overall fluorescence followed by a gradual decline as dye exits the cell [8] [7]. The slow permeation of Rhod123 makes its quenching/unquenching changes particularly pronounced and easier to monitor in acute studies [7].
Figure 1: Decision workflow for selecting between TMRM and Rhodamine 123 based on experimental requirements and operational modes
Quantitative Comparison of Probe Artifacts
Self-Quenching Behavior
Table 2: Self-Quenching Properties of Rhodamine-Based Probes
| Parameter | Rhodamine 123 | TMRM |
|---|---|---|
| Peak Fluorescence Concentration | 11-20 μM (depending on cuvette path length) [11] | Not explicitly quantified but occurs at high nM to low μM range [7] |
| Linear Range | <5 μM concentration [11] | Maintains linearity at low nM concentrations [7] |
| Quenching Mechanism | Concentration-dependent aggregation and inner filter effect [11] | Concentration-dependent aggregation [7] |
| Impact on ΔΨm Assessment | Non-linear calibration curve; fluorescence intensity peaks then decreases with increasing concentration [11] | More predictable response at recommended concentrations [7] |
| Experimental Implications | Requires careful concentration optimization and path length consideration [11] | More forgiving but still requires concentration optimization [7] |
The self-quenching behavior of Rhodamine 123 has been quantitatively characterized. Fluorescence intensity increases approximately linearly with concentration at concentrations lower than 5 μM but peaks at 11 μM (for a 4×10 mm cuvette with 2 mm average incident light path) or 20 μM (for a 10×10 mm cuvette with 5 mm path) [11]. Beyond these peaks, intensity monotonically diminishes toward zero at high concentrations due to a combination of dye self-quenching and inner filter effects—attenuation of fluorescence intensity due to the absorption of the incident and emission light by R123 itself [11]. This non-linear relationship between concentration and fluorescence intensity necessitates careful calibration for quantitative studies.
Cellular Binding and Retention
Table 3: Binding and Retention Artifacts of Mitochondrial Probes
| Artifact Type | TMRM | Rhodamine 123 |
|---|---|---|
| Cellular Binding | Lowest mitochondrial binding among common dyes [7] [12] | Moderate binding; more than TMRM but less than TMRE [7] |
| Intracellular Modification | Can be transformed into impermeable forms retaining fluorescence [3] | Subject to intracellular degradation and modification [3] |
| Tumor Cell Retention | Delayed release from tumor cells even after uncoupler treatment [3] | Significantly increased retention in tumor cells compared to normal cells [3] |
| Impact on Signal Interpretation | Minimal binding improves ΔΨm assessment accuracy [7] [12] | Binding can lead to overestimation of ΔΨm [3] |
| Efflux Mechanisms | Substrate for multidrug resistance proteins [3] | Substrate for ABC transporters and solute carriers [3] |
Cellular binding and retention artifacts present significant challenges for accurate ΔΨm assessment. A critical study revealed that Rhodamine 123 undergoes significant intracellular and intramitochondrial modifications over time, which were prevented by amiodarone—apparently due to blocking the release of xenobiotics from the cell and their transformation with the participation of cytochrome P450 [3]. Furthermore, tumor cells demonstrate dramatically increased retention of rhodamine probes compared to normal cells. While astrocytes released most Rhod123 within 60 minutes of uncoupler (CCCP) treatment, glioma cells maintained substantial fluorescence even after 2 hours [3]. This differential retention cannot be fully explained by ΔΨm differences alone and suggests increased binding or altered processing in tumor cells.
Efflux Artifacts and Transporter Interference
Both TMRM and Rhod123 are substrates for cellular efflux transporters, particularly the ATP-binding cassette (ABC) superfamily proteins including multidrug resistance (MDR) transporters [3]. These energy-dependent efflux mechanisms can expel the dyes against concentration gradients, leading to underestimation of ΔΨm. Protein-mediated transport of xenobiotics (including mitochondrial cationic probes) across membranes is predominantly executed by the solute carrier (SLC) and ATP-binding cassette (ABC) superfamilies of proteins [3]. The activity of these transporters varies by cell type and physiological conditions, with tumor cells frequently exhibiting enhanced efflux capacity that complicates ΔΨm measurement.
Experimental Protocols for Artifact Mitigation
Protocol for TMRM in Non-Quenching Mode (Chronic Studies)
Application: Suitable for long-term monitoring of pre-existing ΔΨm or chronic treatments [7].
Step-by-Step Procedure:
- Dye Preparation: Prepare a stock solution of TMRM in DMSO and dilute in appropriate buffer to working concentration (typically 1-30 nM) [7].
- Cell Loading: Incubate cells with TMRM-containing medium for 30-40 minutes at 37°C, 5% CO₂ to reach equilibrium distribution [8] [7].
- Imaging Setup: For live-cell imaging, maintain TMRM in the bath solution throughout imaging to prevent dye redistribution [7].
- Image Acquisition: Use epifluorescence or confocal microscopy with appropriate settings (excitation ~548 nm, emission ~573 nm) [12].
- Data Interpretation: In non-quenching mode, mitochondrial depolarization causes redistribution of fluorescence from mitochondria to cytosol, decreasing mitochondrial fluorescence intensity [8].
- Controls: Include CCCP (10 μM) or FCCP (1-4 μM) as uncoupler controls to collapse ΔΨm and verify dye response [8] [12].
Protocol for Rhodamine 123 in Quenching Mode (Acute Studies)
Application: Optimal for monitoring rapid ΔΨm changes following acute perturbations [7].
Step-by-Step Procedure:
- Dye Preparation: Prepare Rhod123 stock in DMSO and dilute to working concentration (typically 1-10 μM) in appropriate buffer [7].
- Cell Loading: Load cells with Rhod123 for 20-30 minutes at 37°C, 5% CO₂ [8].
- Dye Washout: Remove extracellular dye by washing with dye-free buffer to establish baseline fluorescence [7].
- Experimental Treatment: Apply pharmacological treatments or interventions while monitoring fluorescence.
- Image Acquisition: Use fluorescence microscopy (excitation ~503 nm, emission ~527 nm) with continuous recording to capture rapid dynamics [11].
- Data Interpretation: In quenching mode, depolarization causes dye release and dequenching, producing a transient increase in fluorescence followed by gradual decline [8] [7].
- Controls: Validate with uncouplers (CCCP/FCCP) and inhibitors (oligomycin) to confirm expected fluorescence responses [11].
Additional Methodological Considerations
- Concentration Calibration: Always perform concentration curves for new cell types or experimental conditions [11].
- Background Correction: Account for inner filter effects, particularly with Rhod123 at higher concentrations [11].
- Multi-Dye Validation: When possible, confirm key findings with an alternative dye having different artifact profiles [12].
- Efflux Inhibition: For cells with high transporter activity, consider limited use of efflux inhibitors like amiodarone, recognizing their potential secondary effects [3].
Table 4: Key Research Reagent Solutions for Mitochondrial Membrane Potential Studies
| Reagent/Category | Specific Examples | Function/Application |
|---|---|---|
| ΔΨm Probes | TMRM, TMRE, Rhodamine 123, JC-1, DiOC₆(3) [7] [31] | Direct assessment of mitochondrial membrane potential |
| Uncouplers (Positive Controls) | CCCP, FCCP (1-10 μM) [11] [12] | Collapse ΔΨm by dissipating proton gradient; validate probe response |
| ATP Synthase Inhibitors | Oligomycin (1-10 μM) [24] | Hyperpolarizes ΔΨm by blocking proton consumption; test ETC function |
| Inhibitor Cocktails | Oligomycin + Antimycin A [39] | Comprehensive mitochondrial stress tests |
| Commercial Kits | MitoProbe JC-1 Assay Kit, BacLight Bacterial Membrane Potential Kit [31] | Optimized reagent systems for specific applications |
| Efflux Modulators | Amiodarone [3] | Inhibits dye efflux and transformation; study binding/retention artifacts |
| Image Analysis Tools | Automated morphology quantification software [12] | Quantitative analysis of mitochondrial morphofunction |
Mechanistic Pathways of Probe Artifacts
Figure 2: Mechanistic pathways of artifact development in mitochondrial membrane potential probes and their impact on data interpretation
The systematic comparison of TMRM and Rhodamine 23 reveals a clear strategic framework for probe selection based on experimental requirements. TMRM demonstrates superior performance for chronic studies and pre-existing ΔΨm assessment due to its minimal mitochondrial binding, low ETC inhibition, and predictable behavior at low concentrations [7] [12]. Conversely, Rhodamine 123 remains valuable for acute dynamic studies where its slow permeation and pronounced quenching/unquenching behavior facilitate monitoring of rapid ΔΨm changes [7]. The implementation of appropriate controls—including uncouplers, efflux inhibitors, and concentration calibration—is essential for mitigating artifacts associated with both probes. Furthermore, researchers should consider cell-type-specific factors such as transporter expression and metabolic activity that significantly influence probe behavior. By aligning probe selection with experimental objectives and implementing rigorous artifact controls, researchers can maximize the reliability and biological relevance of mitochondrial membrane potential assessments in both basic research and drug development applications.
Mitochondrial membrane potential (ΔΨm) is a key indicator of mitochondrial health and cellular viability, driving ATP production and regulating critical processes like calcium buffering and apoptotic signaling. Accurate measurement of ΔΨm is therefore fundamental to research in cell biology, toxicology, and drug development. Fluorescent cationic dyes, particularly tetramethylrhodamine methyl ester (TMRM) and rhodamine 123 (Rhod123), are among the most widely used tools for this purpose. These dyes accumulate within the mitochondrial matrix in a ΔΨm-dependent manner, providing a quantifiable fluorescent signal.
However, a significant challenge in their application is poor or inconsistent staining, which can lead to misinterpretation of data. A primary factor contributing to this problem is the activity of multidrug resistance (MDR) proteins, such as P-glycoprotein, which actively efflux xenobiotics, including these dyes, from the cell. The efficacy of this efflux can vary dramatically between cell types—notably between normal and tumor cells—and can be influenced by the metabolic state and viability of the cells. This guide provides a objective, data-driven comparison of TMRM and Rhod123, focusing on their susceptibility to MDR-mediated efflux and their suitability for different experimental timelines, to help researchers select the optimal dye and achieve reliable staining.
Theoretical Background and Dye Selection Criteria
Fundamental Mechanisms of ΔΨm Probes
Lipophilic cationic dyes like TMRM and Rhod123 are distributed across cellular membranes according to the Nernst equation, accumulating in the negatively charged mitochondrial matrix. The driving force for this accumulation is the electrochemical proton motive force (Δp), which comprises both the membrane potential (ΔΨm) and the pH gradient (ΔpHm). The relationship is defined as Δp (mV) = Δψm − 60ΔpHm [7]. Typically, ΔΨm contributes approximately 150-180 mV to a total Δp of 180-220 mV, making it the dominant component sensed by these cationic probes [7].
It is critical to note that these dyes measure the electrical gradient (ΔΨm), not the proton gradient (ΔpHm). Under certain pathological conditions, these gradients can change independently. For instance, studies have shown that some cellular insults can cause ΔΨm hyperpolarization while simultaneously increasing matrix proton concentration (decreasing ΔpHm), a phenomenon driven by non-protonic charges like calcium ions [7]. This underscores the importance of not equating ΔΨm measurements directly with overall proton motive force or respiratory status.
Operational Modes: Quenching vs. Non-Quenching
Both TMRM and Rhod123 can be used in two distinct operational modes, which dictate the interpretation of fluorescence changes:
- Non-Quenching Mode: In this mode, a low concentration of dye (e.g., 1-30 nM for TMRM) is used, preventing dye-dye interactions. Fluorescence intensity is directly proportional to the dye concentration within the mitochondria. A loss of ΔΨm leads to a redistribution of dye into the cytosol and a decrease in mitochondrial fluorescence [7] [25] [8].
- Quenching Mode: Using higher dye concentrations (e.g., >50-100 nM for TMRM), the dye becomes concentrated in the matrix to a point where its fluorescence is self-quenched due to aggregation. A loss of ΔΨm causes dye release into the cytosol, where it becomes unquenched, leading to an overall increase in total cellular fluorescence [7] [8]. Rhod123 is often preferred for acute, fast-resolution studies in this mode [7].
The following diagram illustrates the fundamental principles of how these dyes operate at the cellular and mitochondrial levels, highlighting the critical differences in their behavior and the challenge posed by MDR efflux.
Direct Comparison of TMRM and Rhod123
Comparative Dye Characteristics and Performance
The choice between TMRM and Rhod123 is not merely one of preference but should be guided by their distinct biochemical properties and performance characteristics, which make each better suited for specific experimental paradigms.
Table 1: Comprehensive Characteristic Comparison of TMRM and Rhod123
| Characteristic | TMRM (Tetramethylrhodamine Methyl Ester) | Rhod123 (Rhodamine 123) |
|---|---|---|
| Primary Recommended Use | Chronic/long-term studies; pre-existing ΔΨm measurement [7] | Acute, fast-resolving studies; monitoring rapid ΔΨm changes [7] |
| Equilibration Rate | Fast equilibration [7] | Slowly permeant, making quenching/unquenching changes easier to observe [7] |
| Mitochondrial Binding & ETC Inhibition | Lowest mitochondrial binding and minimal electron transport chain (ETC) inhibition [7] [5] [26] | Slightly more ETC inhibition and binding than TMRM, but less than TMRE [7] |
| Sensitivity to ΔΨm Depolarization | Highest sensitivity to FCCP-induced depolarization [12] | Sensitive to depolarization, but less directly compared in studies to TMRM |
| Quantitative Morphology Analysis | Well-suited for automated mitochondrial morphology quantification [12] | Not specifically mentioned for morphology analysis in results |
| Artifact Potential | Considered most reliable, less prone to artifacts from membrane binding or ETC inhibition [25] | Potential for intracellular modification (e.g., to Rh110) affecting retention and interpretation [38] |
Quantitative Experimental Data
Head-to-head comparisons in primary human cell models provide robust, quantitative data on how these dyes perform under controlled conditions.
Table 2: Experimental Performance Data in Primary Human Skin Fibroblasts [12]
| Performance Metric | TMRM | Mitotracker Red CMH2Xros | Mitotracker Green FM |
|---|---|---|---|
| Sensitivity to FCCP-induced ΔΨm Loss (Order of decreasing sensitivity) | TMRM ≫ (Much more sensitive) | CMH2Xros = CMXros = MDR (Intermediate sensitivity) | MG (Lowest sensitivity) |
| Suitability for Automated Morphology Quantification | Yes (results not quantitatively identical between probes) | Yes (results not quantitatively identical between probes) | Yes (results not quantitatively identical between probes) |
| Response to Reversible ΔΨm "Flickering" | Shows dynamic release and re-uptake, allowing tracking of transient changes [12] | Not Applicable | Signal remains static during flickering events, missing transient dynamics [12] |
Furthermore, foundational studies on isolated mitochondria reveal critical differences in their interaction with the biological system. The order of temperature-dependent binding to mitochondrial membranes is TMRE > R123 > TMRM, with TMRM exhibiting the least binding [5] [26]. Consequently, the suppression of mitochondrial respiratory control follows the same order: TMRE (greatest) > R123 > TMRM (least, with no suppression at low concentrations) [5] [26]. This lower binding and toxicity profile is a key reason TMRM is often preferred for minimal perturbation of the system under study.
The MDR Efflux Challenge and Cell Viability
Impact of Multidrug Resistance (MDR) Proteins
A major obstacle in achieving consistent mitochondrial staining is the activity of ATP-binding cassette (ABC) transporters, notably MDR proteins, which recognize and actively efflux cationic dyes like TMRM and Rhod123 as xenobiotics [38]. The efficiency of this efflux is a significant source of variable staining quality between cell types.
Research demonstrates that tumor cells, such as C6 glioma, retain Rhod123 dye significantly longer than normal astrocytes after induction of depolarization. This is not necessarily due to a higher ΔΨm, but rather to altered efflux kinetics or dye modification in the tumor cells [38]. This phenomenon can lead to a false interpretation of higher membrane potential in cancer cells. The dye retention difference is stark: while astrocytes almost completely release Rhod123 within 60 minutes of uncoupler treatment, glioma cells retain a high level of fluorescence over the same period [38].
Dye Modification and Altered Retention
Beyond simple efflux, the intracellular fate of these dyes can complicate interpretation. Rhodamine probes can undergo enzymatic modification inside cells. For instance, esterases can convert Rhod123 into a zwitterionic product (rhodamine 110), which has low membrane permeability and becomes trapped inside the cell, independent of ΔΨm [38]. This modification is prevented by drugs like amiodarone, which blocks cellular efflux mechanisms [38]. This underscores that fluorescence intensity is not a pure readout of ΔΨm but is also influenced by dye metabolism and transport, which are highly cell-type dependent.
Interplay with Cell Viability
Cell viability is intrinsically linked to ΔΨm, as the collapse of the potential is a hallmark of apoptosis and other forms of cell death. However, it is crucial to distinguish between a genuine, bioenergetics-related loss of ΔΨm and an apparent signal loss due to MDR-mediated dye efflux. In a population of stressed but viable cells with high MDR activity, the fluorescence signal may be low despite a maintained ΔΨm. Conversely, in dying cells with compromised plasma membrane integrity and efflux pumps, dye may accumulate non-specifically. Therefore, confirming cell viability and understanding the MDR expression profile of the cell model is essential for accurate data interpretation.
Experimental Protocols for Robust Staining
Standardized Staining Protocol for TMRM
The following protocol is adapted from manufacturer instructions and research methodologies for reliable ΔΨm assessment in live cells [40] [8].
- Dye Stock Solution Preparation: Prepare a 10 mM stock solution of TMRM in DMSO. Aliquot and store at -20°C. Avoid repeated freeze-thaw cycles.
- Intermediate and Working Dilutions:
- Intermediate (50 µM): Add 1 µL of 10 mM TMRM stock to 200 µL of complete cell culture medium.
- Working Staining Solution (250 nM): Add 5 µL of the 50 µM intermediate to 1 mL of complete medium. Note: The optimal working concentration (often 5-100 nM) must be empirically determined for each cell type and instrument to operate in the non-quenching mode [7] [40].
- Cell Staining:
- Remove the culture media from live cells (adherent or in suspension).
- Add the prepared TMRM staining solution.
- Incubate for 15-30 minutes at 37°C in a cell culture incubator (protected from light).
- Post-Staining Wash and Imaging:
- Gently wash the cells 2-3 times with clear, pre-warmed buffer (e.g., PBS) to remove excess, non-specific dye.
- For non-quenching mode, imaging can be performed in dye-free buffer. For prolonged time-lapse, a low concentration of dye (e.g., 5-20 nM) may be maintained in the bath to prevent dye loss from the cell [7] [25].
- Image immediately using a TRITC filter set on a fluorescence microscope.
Protocol for Acute ΔΨm Changes with Rhod123 (Quenching Mode)
This protocol is designed for monitoring rapid, transient changes in ΔΨm, such as in response to pharmacological agents [7] [8].
- Dye Loading:
- Load cells with a high concentration of Rhod123 (~1-10 µM) in complete medium for 20-30 minutes at 37°C.
- Dye Washout:
- Thoroughly wash the cells with buffer to remove all extracellular dye. This is critical for establishing a baseline in quenching mode.
- Baseline and Challenge Measurement:
- Place the cells under the microscope in dye-free buffer and establish a baseline fluorescence.
- Apply the experimental treatment (e.g., FCCP, drug candidate) while continuously recording fluorescence.
- Data Interpretation: In this quenching mode, a depolarization of ΔΨm causes dye release and unquenching, resulting in a transient increase in whole-cell fluorescence. A hyperpolarization causes further dye accumulation and quenching, leading to a decrease in fluorescence [7].
The workflow below summarizes the key decision points and steps for selecting and applying these dyes in a live-cell imaging experiment.
The Scientist's Toolkit: Essential Reagents and Controls
To ensure reliable and interpretable results, specific reagents and control experiments are non-negotiable. The following table lists key solutions used in the featured experiments.
Table 3: Essential Research Reagent Solutions for ΔΨm Experiments
| Reagent / Tool | Function / Purpose | Key Consideration |
|---|---|---|
| TMRM | Cationic dye for ΔΨm measurement in chronic studies or baseline potential. | Lowest binding/toxicity; use in low (nM) non-quenching or high (nM-µM) quenching modes [7] [25]. |
| Rhod123 | Cationic dye for acute, fast-resolving ΔΨm studies. | Often used in quenching mode with washout; susceptible to esterase conversion [7] [38]. |
| FCCP | Protonophore uncoupler that collapses ΔΨm. | Used as a validation control for depolarization; should cause TMRM signal loss (non-quench) or Rhod123 unquenching [12] [25]. |
| Oligomycin | ATP synthase inhibitor. | Causes hyperpolarization by blocking proton flow; validates dye response to increased ΔΨm [25]. |
| MDR Inhibitors (e.g., Amiodarone) | Compounds that block multidrug resistance pumps. | Can be used to test if poor staining is due to active efflux; helps retain dye in MDR-positive cells [38]. |
| Viability Assay (e.g., Propidium Iodide) | Assesses plasma membrane integrity. | Critical to confirm that signal loss is not due to cell death and dye leakage. |
Overcoming poor mitochondrial staining requires a strategic approach grounded in an understanding of dye pharmacology and cellular physiology. The comparative data presented in this guide clearly delineates the roles of TMRM and Rhod123:
- TMRM is the superior choice for long-term, chronic studies, and for situations where minimal perturbation of mitochondrial function is critical. Its low binding and low toxicity make it ideal for monitoring pre-existing ΔΨm and for automated morphology analysis.
- Rhod123 is better suited for capturing acute, transient changes in ΔΨm, particularly when used in its quenching mode with rapid kinetics.
The shadow of MDR protein activity looms large over both dyes, potentially compromising staining quality and leading to flawed conclusions, especially in comparative oncology studies. Therefore, the mandatory inclusion of proper controls—FCCP, oligomycin, and viability markers—is the ultimate safeguard. By aligning dye selection with experimental goals and acknowledging the impact of efflux mechanisms and cell viability, researchers can transform poor staining from a frustrating obstacle into a manageable variable, ensuring the integrity and biological relevance of their ΔΨm data.
For researchers investigating mitochondrial health, the choice of fluorescent probe is critical and must be aligned with the experimental timeline and specific biological question. The following table summarizes the core characteristics of TMRM and Rhodamine 123 (Rhod123) to guide this decision.
| Parameter | TMRM (Tetramethylrhodamine Methyl Ester) | Rhodamine 123 (Rhod123) |
|---|---|---|
| Primary Application | Steady-state measurements; chronic/long-term studies; pre-existing Δψm assessment [7] | Dynamic, acute measurements; rapid temporal monitoring of Δψm changes [7] |
| Recommended Mode | Non-quenching (redistribution) mode [8] [7] | Quenching mode [8] [7] |
| Typical Working Concentration | 1-30 nM (non-quenching); >50-100 nM (quenching) [7] | ~1-10 μM (quenching mode) [7] |
| Key Uptake & Fate Characteristics | Lower mitochondrial binding; minimal disruption to electron transport chain (ETC) [7] [10] [5] | Subject to active efflux by multidrug resistance proteins (e.g., MDR1) [41]; can be metabolized to Rhodamine 110 [41] |
| Equilibration Speed | Fast equilibration [7] | Slow permeation, facilitating observation of quenching/unquenching dynamics [7] |
| Influence on Mitochondrial Function | Least suppressive of respiration; preferred when minimal perturbation is critical [7] [5] | Moderate suppression of respiratory control [5] |
Experimental Protocols for Intracellular Fate Assessment
Protocol for TMRM in Non-Quenching Mode (Steady-State/Chronic Studies)
This protocol is designed for comparing pre-existing mitochondrial membrane potential (Δψm) between different cell populations, such as healthy versus diseased states or before and after a long-term treatment [8] [18].
Step 1: Reagent Preparation
- Prepare a 1 mM stock solution of TMRM in dry DMSO. Aliquot and store protected from light at -20°C [18].
- Create a 30 μM working solution by diluting the stock in dry DMSO. This solution is stable at -20°C for up to one year [18].
- Critical: TMRM powder and all solutions must be shielded from light to prevent photodegradation [18].
Step 2: Cell Preparation and Staining
- Seed low-passage-number cells (e.g., Primary Human Skin Fibroblasts, PHSFs) on appropriate imaging dishes and culture until the desired confluency is reached [18].
- Incubate cells with TMRM at a low, non-quenching concentration (e.g., 30 nM) in culture medium for 30-45 minutes in a humidified atmosphere at 37°C and 5% CO₂ [18]. Using the lowest possible concentration that yields a robust signal is crucial to avoid artifacts and ETC inhibition [7].
Step 3: Live-Cell Imaging and Data Acquisition
- Image the cells using a fluorescence microscope equipped with a suitable filter set (e.g., excitation at 540 nm and emission collected using a 565 nm long-pass filter) [18].
- The dye can remain in the bath during imaging to maintain equilibrium. Mitochondria with a higher (more negative) Δψm will accumulate more TMRM, resulting in higher fluorescence intensity [8] [7].
Step 4: Data Analysis and Interpretation
- Background-correct each image by subtracting the fluorescence intensity from a region without cells [18].
- Analyze the background-corrected images by measuring the mean fluorescence intensity of individual mitochondria or the entire mitochondrial network [18].
- A decrease in TMRM fluorescence intensity under these conditions indicates a depolarization (loss) of Δψm.
Protocol for Rhod123 in Quenching Mode (Acute/Dynamic Studies)
This protocol is optimized for monitoring rapid, stimulus-induced changes in Δψm, such as the response to a drug or metabolic inhibitor [8] [7].
Step 1: Cell Loading and Wash
- Load cells with a high, quenching concentration of Rhod123 (e.g., 1-10 μM) in culture medium for 15-30 minutes at 37°C [7].
- Thoroughly wash the cells with dye-free medium to remove all extracellular Rhod123. This step is critical for quenching-mode assays.
Step 2: Baseline Acquisition and Acute Perturbation
Step 3: Data Interpretation of Dynamic Changes
- Mitochondrial Depolarization: A loss of Δψm causes Rhod123 to be released from the mitochondria into the cytosol. The resulting decrease in local concentration leads to dequenching and a transient increase in fluorescence [7].
- Mitochondrial Hyperpolarization: A gain in Δψm causes increased Rhod123 accumulation in the matrix, leading to further quenching and a decrease in fluorescence [7].
Troubleshooting Note: Poor or inconsistent staining with Rhod123 may be due to active efflux by multidrug resistance proteins like MDR1 [7] [41]. Co-loading with inhibitors like verapamil or cyclosporin H can mitigate this issue [18].
Diagrammatic Workflows: From Probe Uptake to Signal Interpretation
TMRM Uptake and Measurement Logic
The following diagram illustrates the pathway of TMRM from application to signal generation, highlighting its Nernstian distribution and the interpretation of fluorescence changes.
Rhod123 Quenching Mechanism Logic
This diagram clarifies the counterintuitive fluorescence response of Rhod123 when used in quenching mode, which is essential for accurate data interpretation in acute studies.
The Scientist's Toolkit: Essential Research Reagents
A successful experiment requires more than just the primary probe. The table below lists key reagents and their functions in assays investigating the intracellular fate of TMRM and Rhod123.
| Reagent / Tool | Function / Rationale | Considerations |
|---|---|---|
| TMRM [7] [42] | Primary probe for Δψm. Ideal for chronic studies and steady-state measurements due to low binding and minimal ETC inhibition. | Use lowest effective concentration; protect from light. |
| Rhodamine 123 [7] [41] | Primary probe for Δψm. Best suited for acute studies in quenching mode due to slower equilibration. | Check for efflux by MDR1 transporters; potential for metabolic conversion to Rhodamine 110. |
| FCCP [18] | Protonophore used as a positive control for complete mitochondrial depolarization. Validates probe response. | Highly toxic; requires careful handling. |
| Oligomycin [18] | ATP synthase inhibitor. Causes hyperpolarization by inhibiting proton flow back into the matrix. Useful for validating hyperpolarization responses. | Highly toxic; requires careful handling. |
| Verapamil / Cyclosporin H [18] [41] | Inhibitors of multidrug resistance proteins. Used to block active export of dyes (especially Rhod123) from cells, improving signal retention. | Optimization of concentration is required to avoid off-target effects. |
| Dimethyl Sulfoxide (DMSO) [18] | Standard solvent for preparing stock solutions of TMRM, Rhod123, and other small molecule reagents. | Can carry toxic impurities; readily absorbed through skin; use with care. |
Mitochondrial membrane potential (ΔΨm) is the electrochemical gradient across the inner mitochondrial membrane and serves as a fundamental indicator of mitochondrial health and function [13]. This potential is generated by the proton pumps of the electron transport chain and is essential for driving ATP synthesis, calcium homeostasis, and reactive oxygen species regulation [43]. Accurate measurement of ΔΨm is therefore critical for assessing mitochondrial function in various research contexts, from basic science to drug development. Among the available techniques, fluorescent cationic dyes represent the most widely applied tool for monitoring ΔΨm in living cells [8]. Tetramethylrhodamine methyl ester (TMRM) and Rhodamine 123 (Rhod123) are two of the most frequently utilized probes for this purpose, yet they possess distinct chemical and functional properties that make them uniquely suited for different experimental applications [5] [6].
A critical challenge in interpreting ΔΨm measurements lies in accounting for confounding variables, particularly changes in mitochondrial mass and morphology that frequently occur in response to physiological stimuli or pathological insults [43] [44]. Mitochondria are highly dynamic organelles that undergo continuous remodeling through processes of fusion, fission, biogenesis, and mitophagy, all of which constitute essential mitochondrial quality control mechanisms [44] [45]. These structural changes can directly influence fluorescence measurements, potentially leading to misinterpretation of ΔΨm data if not properly controlled for. This guide provides a comprehensive comparison of TMRM and Rhod123 methodologies, with particular emphasis on their appropriate application in chronic versus acute studies and the essential control strategies required for accurate data interpretation in the context of dynamic mitochondrial networks.
Technical Comparison: TMRM vs. Rhod123
Fundamental Properties and Operational Characteristics
Table 1: Fundamental Properties of TMRM and Rhod123
| Property | TMRM | Rhodamine 123 |
|---|---|---|
| Chemical Structure | Tetramethylrhodamine methyl ester | Rhodamine derivative with primary amine |
| Charge | Monovalent cation | Monovalent cation |
| Binding Affinity | Lower membrane binding [5] | Higher membrane binding [5] |
| Cellular Toxicity | Lower toxicity; minimal respiratory suppression at low concentrations [5] [6] | Higher toxicity; can suppress mitochondrial respiration [5] |
| Photostability | Moderate to high | Moderate |
| Measurement Modes | Quenching and non-quenching/redistribution modes [13] [8] | Primarily quenching mode [8] |
| Optimal Use Context | Long-term chronic studies, kinetic measurements, sensitive cell types [13] [8] | Acute short-term studies, endpoint measurements [8] |
Experimental Performance and Practical Considerations
Table 2: Experimental Performance Comparison
| Parameter | TMRM | Rhodamine 123 |
|---|---|---|
| Typical Working Concentration | 5-200 nM (non-quenching); >200 nM (quenching) [8] [18] | 100-500 nM [8] |
| Loading Conditions | 30 min, 37°C in serum-free media [18] | 15-30 min, 37°C [8] |
| Signal Stability | Highly stable for prolonged periods (hours) [8] | Gradual signal loss due to toxicity and export [5] |
| Response to ΔΨm Disruption | Rapid redistribution following FCCP application [13] [18] | Rapid redistribution following FCCP application [8] |
| Sensitivity to Mitochondrial Mass | High (requires normalization) [8] | High (requires normalization) [8] |
| Multiplexing Compatibility | High (compatible with GFP, blue fluorophores) [13] | Moderate (spectral overlap with green fluorophores) |
| Cost Considerations | Higher cost | Lower cost |
Methodological Deep Dive: Experimental Protocols
Protocol for TMRM in Non-Quenching/Redistribution Mode
The non-quenching mode (also called redistribution mode) employs low dye concentrations (5-20 nM) where fluorescence intensity directly reflects ΔΨm-dependent dye accumulation without self-quenching effects [13] [8]. This approach is ideal for chronic studies and kinetic assessments of ΔΨm changes.
Reagent Preparation:
- Prepare 1 mM TMRM stock solution in dry DMSO, aliquot, and store at -20°C protected from light [18].
- Create 30 μM working solution by diluting stock in DMSO (stable at -20°C for up to one year) [18].
- Prepare experimental buffer (e.g., Hanks' Balanced Salt Solution with 10 mM HEPES, pH 7.4).
Cell Preparation and Staining:
- Culture cells on appropriate imaging vessels (e.g., glass-bottom dishes or plates).
- On the day of experiment, replace culture medium with pre-warmed buffer containing 20 nM TMRM.
- Incubate for 30 minutes at 37°C in the dark to allow dye loading and equilibration.
- Replace with fresh dye-free buffer for imaging (to remove extracellular dye).
Image Acquisition and Analysis:
- Acquire images using fluorescence microscopy with appropriate filter sets (excitation ~540 nm, emission ~570 nm) [18].
- For kinetic studies, acquire baseline images then add interventions (e.g., 1-2 μM FCCP for depolarization, 1 μM oligomycin for hyperpolarization) [13].
- Perform background subtraction using cell-free regions.
- Quantify fluorescence intensity normalized to baseline or control conditions.
Protocol for Rhodamine 123 in Quenching Mode
The quenching mode utilizes higher dye concentrations (>500 nM) where accumulated dye self-quenches within the mitochondrial matrix, and depolarization leads to dye release and increased fluorescence signal [8].
Reagent Preparation:
- Prepare 1 mM Rhod123 stock solution in DMSO, aliquot, and store at -20°C protected from light.
- Create 100 μM working solution by dilution in DMSO.
- Prepare experimental buffer as described for TMRM.
Cell Staining and Imaging:
- Load cells with 500 nM Rhod123 for 20 minutes at 37°C in the dark.
- Replace with dye-free buffer and allow de-esterification for 10-15 minutes.
- Acquire time-lapse images using standard FITC filter sets (excitation ~488 nm, emission ~525 nm).
- For calibration, record baseline then add 2-4 μM FCCP to induce complete depolarization.
Data Interpretation:
- In quenching mode, decreased fluorescence indicates mitochondrial hyperpolarization (more dye accumulation and quenching).
- Increased fluorescence indicates mitochondrial depolarization (dye release and de-quenching).
Critical Controls and Normalization Strategies
Accounting for Mitochondrial Mass and Morphology
Changes in mitochondrial mass, network architecture, or subcellular distribution represent significant confounders in ΔΨm interpretation, as they directly affect total dye accumulation independent of membrane potential [43] [44]. The following control strategies are essential for rigorous experimentation:
Simultaneous Staining with Mass-Sensitive Probes:
- Utilize Mitotracker Green FM or similar mass-insensitive probes in multiplexed experiments [18].
- Perform ratiometric analysis of potential-sensitive (TMRM/Rhod123) to mass-sensitive signals.
- Confirm absence of spectral bleed-through and dye interactions through control experiments.
Morphometric Analysis of Mitochondrial Networks:
- Acquire high-resolution images for quantification of network architecture.
- Calculate parameters including network branching, mitochondrial length, and interconnectivity.
- Correlate morphological changes with functional measurements.
Pharmacological Validation:
- Establish maximum depolarization values using protonophores (FCCP) for signal normalization.
- Confirm hyperpolarization response with ATP synthase inhibitors (oligomycin).
- Validate specificity with electron transport chain inhibitors (rotenone, antimycin A).
The Researcher's Toolkit: Essential Reagents and Materials
Table 3: Essential Research Reagent Solutions for Mitochondrial Membrane Potential Studies
| Reagent/Category | Specific Examples | Function/Application |
|---|---|---|
| ΔΨm-Sensitive Dyes | TMRM, Rhodamine 123, TMRE | Direct monitoring of membrane potential changes [13] [5] |
| Mass-Sensitive Dyes | Mitotracker Green FM, Nonyl Acridine Orange | Normalization for mitochondrial mass and volume [18] |
| Depolarizing Agents | FCCP, CCCP | Positive controls for complete mitochondrial depolarization [13] [18] |
| Hyperpolarizing Agents | Oligomycin | Inhibition of ATP synthase to induce hyperpolarization [13] |
| Inhibitors | Rotenone (Complex I), Antimycin A (Complex III) | Disruption of electron transport chain function [43] |
| Cell Culture | Primary human skin fibroblasts, neuron/astrocyte co-cultures | Relevant cellular models for mitochondrial function studies [13] [8] |
| Specialized Media | Serum-free imaging media with HEPES buffer | Maintenance of physiological conditions during live-cell imaging [18] |
Application Guidelines: Chronic vs. Acute Studies
TMRM for Chronic and Kinetic Studies
TMRM is particularly well-suited for long-term and kinetic experiments due to its lower phototoxicity, minimal effects on mitochondrial function, and superior signal stability [5] [8]. The following applications benefit particularly from TMRM implementation:
Long-Term Phenotypic Characterization:
- Assessment of mitochondrial dysfunction in genetic disease models.
- Characterization of chronic drug treatments on cellular bioenergetics.
- Aging studies and senescence-associated mitochondrial alterations [43].
Complex Biological Models:
- Three-dimensional culture systems (spheroids, organoids) [13].
- Co-culture systems and specialized primary cells [13].
- Differentiated cell models with polarized mitochondrial networks.
High-Content and Multiplexed Screening:
- Drug discovery platforms requiring prolonged experimental timelines.
- Combination with other fluorescent reporters and biosensors.
- Automated imaging systems with multiple time points.
Rhod123 for Acute and Endpoint Studies
Rhodamine 123 remains a valuable tool for specific applications where cost-effectiveness or rapid screening are primary considerations:
Acute Pharmacological Testing:
- Rapid screening of mitochondrial toxicants.
- Assessment of acute bioenergetic responses to signaling molecules.
- Endpoint measurements in fixed cell preparations.
Resource-Limited Settings:
- Large-scale preliminary screening where reagent cost is prohibitive.
- Educational demonstrations of mitochondrial principles.
- Technical validation in established experimental systems.
Integrated Workflow and Data Interpretation
Experimental Design and Quality Control
The following diagram illustrates a comprehensive workflow for mitochondrial membrane potential studies that incorporates critical normalization and quality control steps:
Experimental Workflow with Critical Controls
Mitochondrial Quality Control Signaling Pathways
Understanding the regulatory networks governing mitochondrial quality control provides essential context for interpreting ΔΨm changes in response to experimental manipulations:
Mitochondrial Quality Control Pathways
The selection between TMRM and Rhodamine 123 for mitochondrial membrane potential assessment represents a critical methodological decision that should be guided by experimental timeline, biological model, and specific research questions. TMRM emerges as the superior choice for chronic studies, complex models, and investigations requiring minimal perturbation of mitochondrial function, while Rhodamine 123 maintains utility for acute applications and resource-conscious settings. Regardless of dye selection, rigorous implementation of controls for mitochondrial mass and morphology remains essential for accurate data interpretation. The integration of pharmacological validation, simultaneous mass assessment, and morphological analysis provides a robust framework for distinguishing genuine changes in membrane potential from confounding structural alterations. As research in mitochondrial physiology advances, these methodological considerations will continue to form the foundation for reliable bioenergetic assessment in both basic and translational contexts.
Optimizing Dye Concentration and Incubation Time to Avoid Toxicity
The accurate measurement of mitochondrial membrane potential (ΔΨm) is fundamental to understanding cellular bioenergetics, health, and dysfunction in disease states. Tetramethylrhodamine methyl ester (TMRM) and Rhodamine 123 (Rhod123) represent two of the most widely employed fluorescent cationic dyes for this purpose, yet their misapplication can yield misleading data and compromised experimental outcomes. These lipophilic cations accumulate in the mitochondrial matrix in a ΔΨm-dependent manner, but each exhibits distinct chemical properties, loading characteristics, and potential cellular toxicities that dictate their optimal use conditions [8] [7]. Proper optimization is not merely a technical detail but a prerequisite for data integrity, particularly given the narrow therapeutic window where these probes report on ΔΨm without perturbing the very systems they are designed to measure.
Toxicity from these dyes primarily arises from two mechanisms: inhibition of the electron transport chain (ETC) and induction of photosensitized oxidative stress. Cationic dyes can bind to and interfere with mitochondrial membranes and protein complexes; for instance, TMRM is noted for having the lowest mitochondrial binding and ETC inhibition among common dyes, making it preferable for many sustained studies [7]. Furthermore, using excessively high concentrations can lead to artifactual fluorescence quenching or aggregation, distorting quantitative interpretations [3] [11]. The choice between TMRM and Rhod123, and the precise parameters for their use, must therefore be guided by the specific experimental context—whether the goal is to monitor acute, rapid changes in ΔΨm or to sustain long-term, chronic observations of mitochondrial functional status.
Comparative Dye Properties and Operational Modes
Fundamental Characteristics of TMRM and Rhod123
TMRM (Tetramethylrhodamine Methyl Ester) TMRM is a cell-permeant, cationic dye that distribuses across cellular membranes according to the Nernst equation, accumulating in the mitochondrial matrix in response to the negative ΔΨm. Its key advantage lies in its low binding to mitochondrial membranes, which allows it to remain in near-ideal Nernstian equilibrium and makes it particularly suitable for dynamic and chronic measurements [7] [12]. This property minimizes its disruptive impact on mitochondrial respiration, a critical factor for long-term imaging. TMRM can be used in two distinct modes: in non-quenching mode (low nM concentrations, ~1-30 nM), where fluorescence intensity directly correlates with ΔΨm, and in quenching mode (>50-100 nM), where dye accumulation leads to aggregation and fluorescence quenching, making the signal inversely related to ΔΨm [7] [46].
Rhodamine 123 (Rhod123) Rhod123, one of the earliest ΔΨm probes, is also a cell-permeant cation that accumulates in active mitochondria. It is slightly more potent at inhibiting the ETC than TMRM and exhibits different kinetics [7]. Its slower equilibration and permeation rate make it especially suited for quenching mode applications (typically at ~1-10 μM concentrations) to monitor acute, fast-resolving changes in ΔΨm [7]. In this mode, a depolarization causes dye release and de-quenching (increased fluorescence), while hyperpolarization causes further quenching (decreased fluorescence). However, studies have revealed that Rhod123 can undergo significant intracellular and intramitochondrial modifications over time, potentially leading to false interpretations of ΔΨm if not properly controlled [3].
Direct Comparison for Experimental Selection
The choice between TMRM and Rhod123 hinges on experimental design, as summarized in the table below.
Table 1: Comparative Characteristics of TMRM and Rhodamine 123
| Feature | TMRM / TMRE | Rhodamine 123 (Rhod123) |
|---|---|---|
| Best Suited For | Slow-resolving acute studies; chronic/steady-state measurement of pre-existing ΔΨm [7] | Fast-resolving acute studies, often in quenching mode [7] |
| Primary Operation Mode | Non-quenching (recommended) or Quenching [7] | Primarily Quenching [7] |
| Typical Working Concentration | Non-quenching: ~1-30 nM; Quenching: >50-100 nM [7] | Quenching: ~1-10 μM [7] |
| Equilibration Kinetics | Fast equilibration [7] | Slowly permeant [7] |
| ETC Inhibition & Mitochondrial Binding | Lowest toxicity; preferred for chronic studies [7] [12] | Slightly more ETC inhibition and binding than TMRM [7] |
| Key Advantage | Low binding allows for stable, long-term measurement with minimal toxicity [7] [12] | Slower permeation makes quenching/unquenching dynamics easier to resolve [7] |
| Reported Cellular Modifications | Less documented | Significant intracellular modification over time, preventable by agents like amiodarone [3] |
Optimizing Experimental Protocols for Accuracy and Minimal Toxicity
General Principles for Dye Loading and Imaging
Regardless of the chosen dye, several overarching principles are critical for minimizing toxicity and ensuring accurate ΔΨm assessment. First, use the lowest possible dye concentration that yields a detectable signal. This minimizes ETC inhibition and reduces the risk of fluorescence quenching artifacts [7] [46]. Second, limit light exposure during imaging by using low laser power, fast acquisition settings, and neutral density filters to prevent phototoxicity and dye photobleaching [46]. Third, always include appropriate controls, such as untreated cells (baseline), cells treated with a depolarizing uncoupler like FCCP (e.g., 1-4 μM) to define the minimum fluorescence, and cells treated with an ATP synthase inhibitor like oligomycin (e.g., 2 μg/mL) to induce hyperpolarization and define the maximum fluorescence [7] [46]. These controls are essential for contextualizing the fluorescence changes observed in experimental conditions.
Specific Protocols for TMRM and Rhod123
Protocol for TMRM in Non-Quenching Mode (Chronic/Long-Term Studies) This protocol is ideal for experiments comparing steady-state ΔΨm across different cell populations or treatments [8] [46].
- Dye Preparation: Prepare a 10 mM stock solution in anhydrous DMSO. Aliquot and store at -20°C, protected from light [46].
- Cell Loading: Wash cells (e.g., primary human skin fibroblasts, cortical neurons) three times with an appropriate buffer (e.g., Tyrode's buffer). Dilute TMRM to a final concentration of 10-50 nM in the pre-warmed buffer. Incubate cells for 30-45 minutes at room temperature or 37°C, protected from light [8] [46]. For chronic studies, the dye can be maintained in the bath during imaging to ensure a constant equilibrium [7].
- Live-Cell Imaging: Use confocal laser scanning microscopy with attenuated laser power (e.g., 1%) and low resolution (e.g., 256 x 256) to minimize photobleaching and phototoxicity. Set excitation to ~514 nm and emission to ~570 nm [46].
- Validation: Apply FCCP (1 μM) at the end of the experiment to confirm mitochondrial depolarization, evidenced by a rapid loss of TMRM fluorescence from the mitochondria [46].
Protocol for Rhod123 in Quenching Mode (Acute/Kinetic Studies) This protocol is optimized for monitoring rapid changes in ΔΨm following an acute perturbation [8] [7].
- Dye Preparation: Prepare a stock solution in DMSO.
- Cell Loading: Load cells with a higher concentration of Rhod123, typically in the 1-10 μM range, for about 20-30 minutes. This ensures sufficient intramitochondrial concentration for the quenching effect [7].
- Washout: After loading, wash the cells thoroughly with dye-free buffer to remove extracellular Rhod123. This step is crucial for quenching mode experiments [7].
- Acute Stimulation & Imaging: Initiate live-cell imaging. The baseline fluorescence will be relatively low due to quenching. Upon an experimental challenge (e.g., drug application), changes in ΔΨm will cause dye redistribution and a corresponding change in fluorescence (depolarization causes an increase, hyperpolarization a decrease) [7].
Table 2: Summary of Optimized Experimental Protocols
| Parameter | TMRM (Non-Quenching, Chronic) | Rhod123 (Quenching, Acute) |
|---|---|---|
| Objective | Steady-state ΔΨm comparison; long-term health | Rapid, transient ΔΨm changes |
| Dye Concentration | Low: 10-50 nM [46] | High: 1-10 μM [7] |
| Incubation Time | 30-45 minutes [46] | 20-30 minutes |
| Dye During Imaging | Often present in bath [7] | Washed out before imaging [7] |
| Key Control | FCCP (depolarization) [46] | FCCP (causes unquenching) [7] |
| Toxicity Mitigation | Low concentration minimizes ETC inhibition [7] | Shorter total exposure time; specific to acute event |
The Scientist's Toolkit: Essential Reagents and Materials
Table 3: Key Research Reagent Solutions for ΔΨm Assays
| Reagent / Material | Function / Purpose | Example Usage & Notes |
|---|---|---|
| TMRM | Potentiometric fluorescent ΔΨm probe | Use at 10-50 nM for non-quenching mode in chronic studies [46]. |
| Rhodamine 123 | Potentiometric fluorescent ΔΨm probe | Use at 1-10 μM for quenching mode in acute kinetic studies [7]. |
| FCCP | Protonophore uncoupler; dissipates ΔΨm | Positive control for depolarization (1-4 μM) [12] [46]. |
| Oligomycin | ATP synthase inhibitor; hyperpolarizes ΔΨm | Positive control for hyperpolarization (2 μg/mL) [46]. |
| Carbonyl cyanide-4-phenylhydrazone | Protonophore uncoupler; dissipates ΔΨm | Used at 1-10 μM to validate dye response, as in [12]. |
| Primary Human Skin Fibroblasts | Common cell model for mitochondrial function | Validated for TMRM and Rhod123 protocols [8] [12]. |
| Neuron/Astrocyte Co-cultures | Relevant model for neurobiology | Used in protocols for assessing ΔΨm [8]. |
| Dimethyl Sulfoxide (DMSO) | Solvent for dye stock solutions | Use anhydrous grade; keep final concentration low (<0.1%) to avoid cytotoxicity. |
| Confocal Laser Scanning Microscope | High-resolution live-cell imaging | Essential for capturing spatial and temporal dynamics of ΔΨm [46]. |
Data Interpretation, Troubleshooting, and Advanced Considerations
Navigating Common Pitfalls in ΔΨm Measurement
A primary challenge in using cationic dyes is the assumption that fluorescence intensity is a direct and exclusive readout of ΔΨm. However, fluorescence can be influenced by factors including changes in mitochondrial mass, morphology, and non-specific binding [12] [3]. Furthermore, as demonstrated in a case study, ΔΨm does not always mirror changes in mitochondrial pH (ΔpHm). Cellular stresses can cause dissociation between these two components of the proton motive force, leading to scenarios where ΔΨm hyperpolarizes while the proton gradient collapses, due to the influence of other ions like Ca²⁺ [7]. This underscores the necessity of complementary assays, such as using pH-sensitive dyes, to fully interpret the bioenergetic status.
Another significant pitfall is the potential for intracellular probe modification. Research has shown that Rhod123 can be chemically modified within cells over time, a process that can be inhibited by amiodarone, potentially through blocking efflux mechanisms or cytochrome P450 activity [3]. This modification can trap the dye within the cell, leading to a falsely elevated fluorescence signal that is misinterpreted as a sustained or high ΔΨm. This phenomenon may be particularly pronounced in tumor cells, which exhibit increased dye retention compared to normal cells [3]. TMRM appears less prone to such modifications, reinforcing its suitability for longer-term experiments.
Logical Workflow for Dye Selection and Application
The following diagram synthesizes the key decision points for selecting and applying TMRM or Rhod123 in an experimental design, integrating the critical steps to mitigate toxicity and ensure accurate data.
Decision Workflow for Dye Use
The judicious selection and application of TMRM and Rhodamine 123, guided by a clear understanding of their respective strengths and limitations, is paramount for generating reliable data on mitochondrial membrane potential. The optimization of dye concentration and incubation time is not a one-size-fits-all formula but a strategic decision rooted in experimental design. TMRM, with its low binding and minimal ETC inhibition, emerges as the superior probe for chronic studies and steady-state assessments where maintaining mitochondrial health over time is critical. Conversely, Rhod123's slower equilibration kinetics make it a powerful tool for resolving fast, acute changes in ΔΨm when used in quenching mode. By adhering to the detailed protocols, controls, and interpretive frameworks outlined in this guide, researchers can effectively avoid the pitfalls of dye-induced toxicity and ensure their fluorescence measurements accurately reflect underlying mitochondrial physiology.
Beyond Fluorescence: Validating Results and a Direct Dye Comparison
Mitochondrial membrane potential (ΔΨm) is a critical parameter of cellular health, serving as a key indicator of mitochondrial function and a central regulator of cell fate decisions in areas ranging from cancer research to neurobiology. The accurate measurement of ΔΨm is therefore essential for researchers and drug development professionals. Among the most widely used tools for this purpose are fluorescent cationic dyes, including TMRM (Tetramethylrhodamine methyl ester), TMRE (Tetramethylrhodamine ethyl ester), Rhodamine 123 (Rhod123), and JC-1. Each probe possesses distinct chemical properties, operational modes, and suitability for specific experimental paradigms. This guide provides an objective, data-driven comparison of these essential tools, with a particular focus on the application of TMRM versus Rhod123 in chronic versus acute studies, to inform appropriate probe selection and ensure valid interpretation of results.
Comparative Properties at a Glance
The table below summarizes the fundamental characteristics and recommended applications of the four fluorescent dyes to facilitate initial probe selection.
Table 1: Key Properties and Applications of Common ΔΨm Probes
| Probe Name | Ex/Em Maxima (nm) | Primary Usage & Best For | Key Strengths | Key Limitations & Considerations |
|---|---|---|---|---|
| TMRM | Ex: 552, Em: 574 [47] | - Non-quenching mode- Chronic studies (Scenario 1)- Slow-resolving acute studies [7] | - Lowest mitochondrial binding & ETC inhibition [7] [5]- Low cytotoxicity [48]- Minimal self-quenching [48] | - Fast equilibration can be a limitation for some quenching studies [7] |
| TMRE | Ex: 552, Em: 574 [48] | - Non-quenching mode [7]- Dynamic measurements in situ [48] | - Reasonable photostability [48] | - More hydrophobic than TMRM [48]- Higher mitochondrial binding and greater respiratory suppression than TMRM [5] [6] |
| Rhodamine 123 (Rhod123) | Information missing | - Quenching mode- Fast-resolving acute studies (Scenario 2) [7] | - Slow permeation makes quenching/unquenching easier to resolve [7]- Less ETC inhibition than TMRE [7] | - Can be modified intracellularly, potentially affecting readings [3] |
| JC-1 | Monomer: Ex515/Em530Aggregate: Ex515/Em590 [48] | - "Yes/No" discrimination of polarization (e.g., apoptosis) [7]- Flow cytometry & microscopy [7] | - Ratiometric (dual-color emission) allows for quantitative assessment [31] [48]- Specific for mitochondria vs. plasma membrane [31] | - Very sensitive to concentration [7]- Aggregate form sensitive to factors beyond ΔΨm (e.g., H2O2) [7]- Slow equilibration of aggregates [7] |
Experimental Protocols and Application
The optimal use of these dyes depends heavily on the experimental design, particularly whether the treatment precedes or follows dye loading.
Chronic Studies (Scenario 1: Treatment Precedes Dye Loading)
In this paradigm, cells or tissues are subjected to a long-term treatment (e.g., drug exposure or genetic modification) before ΔΨm is assessed.
- Recommended Probe: TMRM in Non-Quenching Mode. This is the preferred approach for chronic studies [7]. Cells are loaded with a low concentration of TMRM (typically ~1–30 nM) after the experimental treatment. The low concentration prevents dye aggregation and quenching, so fluorescence intensity directly reflects ΔΨm. The dye is usually maintained in the bath during imaging to sustain equilibrium [7]. TMRM is ideal here due to its low toxicity, ensuring that the measurement itself does not alter the pre-existing physiological state induced by the chronic treatment [7] [12].
Acute Studies (Scenario 2: Real-Time Monitoring During Treatment)
This paradigm involves monitoring dynamic changes in ΔΨm as they happen in response to an acute stimulus.
- Recommended Probe: Rhodamine 123 in Quenching Mode. For fast-resolving acute studies, Rhod123 is often the best choice [7]. Cells are pre-loaded with a higher concentration of dye (~1–10 µM), which is then washed out. The high intra-mitochondrial dye concentration leads to aggregation and quenching of fluorescence. When mitochondria depolarize, the dye is released, causing de-quenching and a transient increase in fluorescence signal, and vice-versa for hyperpolarization [7]. The slower permeation of Rhod123 compared to TMRM/TMRE makes these rapid fluorescence changes easier to track [7].
- Alternative Probe: TMRM/TMRE. These can also be used in non-quenching mode for slower acute changes, or in quenching mode for robust, rapid depolarizations [7].
A Note on JC-1 and DiOC₆(3) Protocols
- JC-1: This dye is typically loaded after experimental treatment, and for imaging, it should ideally remain in the bath to prevent fluorescence changes from probe redistribution [7]. It is critical to use optimized and consistent loading times, as aggregate formation can be slow.
- DiOC₆(3): Primarily used in flow cytometry, this dye requires very low concentrations (<1 nM) to accurately report on ΔΨm rather than plasma membrane potential and to prevent respiratory toxicity [7] [31].
Probe Selection Logic
The following diagram illustrates the decision-making process for selecting the most appropriate ΔΨm probe based on experimental goals.
The Scientist's Toolkit: Essential Reagents and Controls
Valid interpretation of ΔΨm data requires careful experimental design, including the use of specific pharmacological controls and complementary assays [7] [35].
Table 2: Key Reagents for Validating ΔΨm Experiments
| Reagent / Assay | Function in ΔΨm Research | Expected Outcome |
|---|---|---|
| FCCP / CCCP | Protonophore uncoupler. Collapses the proton gradient, depolarizing mitochondria [7] [31]. | Validates depolarization: A strong decrease in TMRM/Rhod123 signal or a decrease in the red/green ratio for JC-1. |
| Oligomycin | ATP synthase inhibitor. Prevents proton re-entry through Complex V, causing hyperpolarization [7]. | Validates hyperpolarization: An increase in TMRM/Rhod123 signal or an increase in the red/green ratio for JC-1. |
| DiBAC₄(3) | Anionic plasma membrane potential (ΔΨp) probe [7]. | Control for ΔΨp: Rules out that changes in mitochondrial dye uptake are not due to alterations in the plasma membrane potential. |
| MitoTracker Dyes (e.g., CMXRos) | Fixable mitochondrial stains, some independent of ΔΨm [12] [48]. | Control for morphology/mass: Confirms that observed fluorescence changes are not due to alterations in mitochondrial mass, volume, or distribution. |
| Mass Spectrometry / Flow Cytometry | Analytical techniques to assess dye modification [3]. | Control for probe integrity: Detects potential intracellular modification of dyes (e.g., Rh123), which can lead to erroneous conclusions [3]. |
Critical Considerations for Data Interpretation
- ΔΨm is Not ΔpHm: Cationic ΔΨm probes measure the electrical gradient, not the pH gradient. A case study showed that an increase in ΔΨm can paradoxically co-occur with a decrease in mitochondrial pH (increased H⁺), highlighting that these two components of the protonmotive force can change independently. Directly equating ΔΨm with the proton gradient can lead to incorrect conclusions about energetic status [7].
- Probe Limitations: Be aware that all dyes have potential pitfalls. JC-1's J-aggregates can be influenced by factors other than ΔΨm, such as mitochondrial volume and oxidative stress [7]. Furthermore, cationic dyes can be substrates for multidrug resistance efflux pumps, and intracellular modification of the probe (as demonstrated for Rhod123) can occur, potentially trapping the dye and confounding results [3].
- Best Practices: Always include relevant pharmacological controls (FCCP, oligomycin) to confirm the direction of signal changes. Use the lowest possible dye concentration that gives a robust signal to minimize effects on mitochondrial respiration and function [7] [5].
The mitochondrial membrane potential (ΔΨm) is a fundamental indicator of cellular health and mitochondrial function, serving as the principal driver for ATP synthesis and a key regulator of cell fate decisions, including apoptosis [7] [24]. Accurate assessment of ΔΨm is therefore paramount in biological and biomedical research. Among the most established tools for this purpose are fluorescent cationic dyes, with Tetramethylrhodamine Methyl Ester (TMRM) and Rhodamine 123 (Rhod123) being two of the most widely employed probes. While both dyes operate on the same basic Nernstian principle—accumulating within the mitochondrial matrix in proportion to the negative charge inside—their distinct chemical and fluorescence properties make them uniquely suited for different experimental applications [7] [6]. A common misconception is that these dyes directly report on the proton gradient or overall oxidative phosphorylation capacity; however, it is crucial to recognize that ΔΨm is the electrical component of the proton motive force and does not always correlate directly with mitochondrial pH (ΔpHm) or respiratory function, as changes in other ions like Ca2+ can significantly influence the signal [7] [24]. This guide provides a structured, evidence-based comparison of TMRM and Rhod123, offering a clear decision matrix and detailed protocols to empower researchers in selecting the optimal dye for their specific experimental scenario, with a particular focus on the dichotomy between acute and chronic studies.
Table 1: Fundamental Properties of TMRM and Rhodamine 123
| Property | TMRM | Rhodamine 123 |
|---|---|---|
| Full Name | Tetramethylrhodamine Methyl Ester | Rhodamine 123 |
| Chemical Class | Lipophilic cation | Lipophilic cation |
| Primary Excitation/Emission | ~540-570 nm / ~570-620 nm [49] | ~505 nm / ~525 nm [50] |
| Mitochondrial Binding | Low [7] [6] | Moderate [7] [6] |
| Inhibition of Respiration (ETC) | Low [7] [6] | Low to Moderate [7] [6] |
| Equilibration Rate | Fast [7] | Slower [7] |
| Spectral Shift upon Accumulation | Red shift in absorption and emission [6] | Red shift in absorption and emission [6] |
Both TMRM and Rhod123 are lipophilic cations that permeate biological membranes and accumulate in the mitochondrial matrix in response to the negative ΔΨm [7]. Upon accumulation, both dyes exhibit a red shift in their absorption and fluorescence emission spectra, a property that can be leveraged for ratiometric measurements in isolated mitochondria [6]. However, key differences exist. TMRM generally exhibits lower binding to mitochondrial membranes and consequently less inhibition of the electron transport chain (ETC) compared to Rhod123 and its ethyl ester analogue TMRE, making it preferable for many sensitive applications [7] [6]. Rhod123 is described as being "slower permeant" than TMRM/TMRE, which influences the choice of dye for monitoring rapid kinetic events [7].
A critical consideration for all cationic dyes is that their fluorescence is a measure of the electrical gradient (ΔΨm), not the proton concentration gradient (ΔpHm). As highlighted in a case study, cellular stressors can sometimes induce opposing changes in ΔΨm and mitochondrial pH, underscoring the importance of not using these dyes to make direct inferences about the proton motive force without complementary assays [7]. Furthermore, researchers must be aware of potential pitfalls, including intracellular metabolism of the dyes, their extrusion by efflux pumps like MDR1 (P-glycoprotein), and binding to cellular components, all of which can distort the relationship between fluorescence and the actual ΔΨm [50] [3] [51].
The Decision Matrix: Selecting the Right Dye for Your Experimental Needs
The core distinction in dye selection often hinges on the timescale and nature of the biological question—specifically, whether the study involves acute, dynamic changes or chronic, steady-state assessments of ΔΨm.
Table 2: Decision Matrix for Dye Selection Based on Experimental Scenario
| Experimental Scenario | Recommended Dye | Rationale and Key Considerations |
|---|---|---|
| Measuring pre-existing ΔΨm (e.g., baseline differences between cell types) | TMRM (non-quenching mode) | Low binding and minimal ETC inhibition provide a more accurate reflection of the steady-state potential. Use low concentrations (~1-30 nM) [7]. |
| Chronic/long-term imaging (e.g., over hours, with dye present) | TMRM (non-quenching mode) | Fast equilibration and low toxicity make it suitable for prolonged monitoring. Dye can remain in bath solution [7]. |
| Rapid, acute kinetic studies (e.g., response to a drug or uncoupler) | Rhodamine 123 (quenching mode) | Its slower permeation makes quenching/unquenching changes easier to resolve and monitor in real-time [7]. |
| Flow Cytometry | TMRM or Rhod123 | Both are applicable. DiOC₆(3) is another common choice, but requires very low concentrations (<1 nM) to avoid toxicity and specificity issues [7]. |
| "Yes/No" discrimination of polarization state (e.g., apoptosis) | JC-1 | This dye forms aggregates at high potentials, enabling ratiometric (red/green) measurement, which is ideal for clear distinction of polarized vs. depolarized states [7]. |
| Experiments requiring subsequent cell fixation | MitoTracker Probes (e.g., CMXRos) | These dyes are fixable and well-retained after aldehyde-based fixation, unlike TMRM and Rhod123, which are typically washed out [52]. |
The following workflow diagram visualizes the key decision-making process for selecting between TMRM and Rhodamine 123 based on your experimental goals.
Experimental Protocols: Detailed Methodologies for Key Applications
Protocol for Acute ΔΨm Changes Using Rhodamine 123 (Quenching Mode)
This protocol is optimized for monitoring rapid, transient changes in membrane potential, such as the response to an uncoupler like FCCP or a metabolic inhibitor.
- Dye Loading Solution: Prepare a solution containing 1–10 µM Rhodamine 123 in your standard cell culture medium or buffer (e.g., HBSS). The optimal concentration should be determined empirically for your cell type [7] [49].
- Loading and Washout: Incubate cells with the loading solution for 15–30 minutes at 37°C in the dark. Following incubation, wash the cells thoroughly at least twice with a dye-free pre-warmed buffer to remove all extracellular Rhodamine 123. Critical Note: The dye must be washed out before imaging to establish the quenching baseline [7].
- Image Acquisition: Place the washed cells under the microscope and establish a stable baseline fluorescence recording. Excitation should be at ~505 nm, and emission collected at ~525 nm [50].
- Experimental Treatment: Apply the compound or stimulus of interest (e.g., 1–10 µM FCCP) while continuously recording fluorescence.
- Data Interpretation: In this quenching mode, a mitochondrial depolarization will cause the dye to be released from the mitochondria into the cytosol, leading to its de-quenching and a transient increase in overall fluorescence intensity. Conversely, hyperpolarization leads to further dye accumulation and quenching, seen as a decrease in fluorescence [7].
Protocol for Chronic/Steady-State ΔΨm Using TMRM (Non-Quenching Mode)
This method is ideal for comparing baseline ΔΨm between cell populations or for long-term imaging where the dye remains present.
- Dye Loading Solution: Prepare a low-concentration TMRM solution (~1–30 nM) in your cell culture medium or imaging buffer. Using the lowest possible effective concentration is critical to avoid artifacts and toxicity, and to ensure operation in non-quenching mode [7].
- Loading and Imaging: Incubate cells with the TMRM solution for 15–30 minutes at 37°C in the dark. For chronic studies, the dye can be maintained in the bath solution throughout the imaging period to allow for continuous equilibration [7].
- Image Acquisition: Image cells using standard tetramethylrhodamine filter sets. In non-quenching mode, the fluorescence intensity is directly proportional to the ΔΨm—a higher signal indicates a more hyperpolarized (more negative) membrane potential [7].
- Validation with Controls: At the end of each experiment, validate the dye response by applying a known uncoupler (e.g., 1–10 µM FCCP) to fully depolarize mitochondria, which should result in a rapid loss of TMRM fluorescence. Conversely, applying the ATP synthase inhibitor oligomycin (~1–10 µM) may cause a slight hyperpolarization, confirming the sensitivity of the dye [7] [12] [24].
Table 3: Key Research Reagent Solutions for Mitochondrial Membrane Potential Assays
| Reagent / Resource | Function / Application | Key Considerations |
|---|---|---|
| TMRM (Tetramethylrhodamine Methyl Ester) | Reversible ΔΨm probe for acute/chronic live-cell imaging. | Preferred for low toxicity and minimal ETC inhibition. Use in non-quenching (low nM) or quenching (high nM/µM) modes [7] [12]. |
| Rhodamine 123 | Reversible ΔΨm probe optimized for acute kinetic studies. | Best used in quenching mode with washout. Slower permeation aids in resolving fast dynamics [7] [50]. |
| JC-1 | Ratiometric ΔΨm probe for flow cytometry and microscopy. | Ideal for apoptosis studies. Shifts from green (monomer) to red (J-aggregate) with polarization. Sensitive to concentration and other factors like H₂O₂ [7]. |
| MitoTracker Probes (e.g., CMXRos, Red FM) | Fixable mitochondrial dyes for studies requiring immunostaining. | Contain a thiol-reactive chloromethyl moiety for retention after aldehyde fixation [52]. |
| FCCP / CCCP | Protonophores that uncouple mitochondria, dissipating ΔΨm. | Used as a validation control for complete depolarization. Titrate concentration for full effect [7] [12]. |
| Oligomycin | ATP synthase inhibitor. | Used as a control to induce hyperpolarization by inhibiting ΔΨm consumption by ATP synthase [7] [24]. |
Selecting between TMRM and Rhodamine 123 is not a matter of one dye being universally superior, but rather of matching the probe's properties to the experimental design. TMRM, with its low binding, minimal respiratory inhibition, and fast equilibration, is the unequivocal choice for assessing pre-existing ΔΨm and for chronic studies where the dye remains present. In contrast, Rhodamine 123, with its slower permeation kinetics, is exceptionally well-suited for resolving rapid, acute changes in membrane potential when used in quenching mode. By applying the decision matrix and protocols outlined in this guide, researchers can make informed, justified choices, thereby ensuring the acquisition of robust and biologically relevant data on mitochondrial function.
Mitochondria, the "powerhouse of the cell," serve as the central site of cellular energy production and are involved in key cellular processes including metabolite metabolism, signal transduction, and programmed cell death [53]. Dysfunction of mitochondria is closely associated with a range of diseases, including neurodegenerative disorders, cardiovascular conditions, metabolic syndromes, and cancer [53] [54]. Consequently, accurate assessment of mitochondrial function has become significant for disease diagnosis, drug development, and health management. Within this landscape, the measurement of mitochondrial membrane potential (ΔΨm) using fluorescent probes such as TMRM and Rhodamine 123 provides crucial insights into mitochondrial health, particularly when contextualized within a broader framework of complementary assays.
The selection between ΔΨm probes is not merely technical but strategic. TMRM (tetramethylrhodamine methyl ester) and Rhodamine 123 represent different generations of lipophilic cationic dyes that accumulate in active mitochondria in proportion to ΔΨm [5] [6]. Current research indicates that TMRM demonstrates superior performance for chronic studies due to its lower phototoxicity and minimal suppression of mitochondrial respiration at low concentrations, whereas Rhodamine 123 may be suitable for acute applications but exhibits greater binding and respiratory suppression [5] [6]. However, ΔΨm measurement alone provides an incomplete picture of mitochondrial function. As noted in a recent methods commentary, "measuring ΔΨm is not sufficient to conclude on changes in OXPHOS in coupled mitochondria or in ATP demand by the cell" [24]. This limitation underscores the necessity for a multi-parameter approach that integrates ΔΨm data with direct measurements of ATP production, reactive oxygen species (ROS) generation, and respiratory function to obtain a comprehensive understanding of mitochondrial status in health and disease.
Key Mitochondrial Functional Assays: A Comparative Analysis
ATP Production Assays
ATP (adenosine triphosphate) represents the fundamental energy currency of the cell, and its measurement provides the most direct indicator of mitochondrial energy output [53]. The cellular ATP content directly reflects the energy synthesis function of mitochondria, with various detection techniques offering distinct advantages for different experimental scenarios.
Table 1: Comparison of Major ATP Detection Methodologies
| Detection Method | Core Principle | Key Characteristics | Applicable Scenarios |
|---|---|---|---|
| Bioluminescence Assay | Luciferase-catalyzed ATP-luciferin reaction; photon intensity ∝ ATP concentration | Fast (5-15 min), high sensitivity (10⁻¹² mol/L), easy operation; prone to fluorescent interference | Lab analysis, on-site rapid detection, high-throughput screening |
| Chemiluminescence Assay | Chemical reaction (e.g., luminol system) with ATP; signal intensity ∝ ATP content | Fast (10-20 min); lower sensitivity than bioluminescence, oxidant interference | Routine lab and emergency detection |
| HPLC | Column-based ATP separation + UV and fluorescence quantification | High accuracy and specificity; slow (30-60 min), costly and requires professional operation | Precise lab analysis (metabolism, drug screening) |
| ELISA | ATP-antibody binding + enzyme-labeled colorimetry | High specificity; tedious (1-2 h), moderate sensitivity | Complex matrices (blood, tissue extracts) |
| Colorimetric Assay | ATP-reagent reaction; absorbance ∝ ATP concentration | Simple, low-cost (only spectrophotometer); susceptible to sample color interference | Primary labs, applications with low-precision requirements |
Among these techniques, the luciferin-luciferase bioluminescence assay has emerged as the predominant method for mitochondrial studies due to its exceptional performance characteristics. This approach offers extremely high detection sensitivity, enabling the measurement of ATP production in trace mitochondrial samples, and possesses high-throughput capability, making it suitable for large-scale research scenarios such as mitochondrial respiratory chain function evaluation and metabolic inhibitor efficacy screening [53].
Reactive Oxygen Species (ROS) Detection
Mitochondria represent a primary source of reactive oxygen species within cells, and ROS levels serve as critical indicators of oxidative stress and mitochondrial health [55] [56]. The fluorescent probe 2',7'-dichlorodihydrofluorescein diacetate (DCHF-DA) has become the most widely utilized methodology for intracellular ROS measurement owing to its distinctive physicochemical characteristics [55]. This probe is inherently non-fluorescent and possesses the ability to freely permeate the cell membrane. Upon entry into cells, DCHF-DA undergoes hydrolysis catalyzed by intracellular esterases, yielding 2',7'-dichlorodihydrofluorescein (DCHF), a membrane-impermeable metabolite that remains trapped within the cellular compartment [55]. In the presence of intracellular ROS, DCHF is rapidly oxidized to form the highly fluorescent compound 2',7'-dichlorofluorescein (DCF), with fluorescence intensity directly proportional to intracellular ROS concentration [55].
Fluorometry has emerged as the most widely used method for ROS assays, likely because it allows simultaneous assessment of several ROS species using different probes, offering economic advantages compared to alternative approaches [56]. When evaluating ROS detection methodologies, researchers should consider that both erythrocytes and spermatozoa samples are highly susceptible to ROS-induced damage due to their high polyunsaturated fatty acid content in cellular membranes, making them particularly relevant biological models for oxidative stress studies [56].
Mitochondrial Respiration Assessment
Mitochondrial respiration rate represents a central indicator of mitochondrial function and cellular energy metabolism status, directly reflecting the activity of oxidative phosphorylation [53]. The key parameter for respiration assessment is the oxygen consumption rate (OCR), with a decreased OCR often suggesting reduced mitochondrial function and impaired ATP energy production, while an increased OCR points to elevated cellular metabolic activity [53].
Detection methods for respiration rate fall into two main categories. Direct OCR measurement traditionally employed oxygen electrode methods, but newer fluorescence-based assays compatible with standard microplate readers now offer a simpler and more affordable alternative for assessing energy metabolism [53]. Activity assays of respiratory chain complexes complement OCR measurements by evaluating the efficiency of electron transfer through the five complexes (I-V) of the respiratory chain, which drives ATP energy synthesis [53]. This approach helps assess electron flow efficiency within the oxidative phosphorylation system.
Recent methodological advances have enabled the assessment of mitochondrial respiration in anatomically defined brain regions using tissue biopsy punches, demonstrating that mild traumatic brain injury causes differential mitochondrial responses within hippocampal subfields [57]. This spatial resolution of mitochondrial function represents a significant advancement over traditional isolation methods that require larger tissue amounts and disrupt the mitochondrial network [57].
Table 2: Mitochondrial Respiration Parameters and Their Interpretation
| Respiratory Parameter | Definition | Physiological Significance | Modulating Compounds |
|---|---|---|---|
| Basal Respiration | OCR in absence of inhibitors | Reflects baseline energy production demands | None |
| ATP-Linked Respiration | Reduction in OCR after oligomycin treatment | Proportion of respiration dedicated to ATP synthesis | Oligomycin (Complex V inhibitor) |
| Proton Leak | OCR remaining after oligomycin treatment | Indicates mitochondrial inefficiency | Oligomycin |
| Maximal Respiration | OCR after FCCP administration | Maximum respiratory capacity of mitochondria | FCCP (Uncoupling agent) |
| Spare Respiratory Capacity | Difference between maximal and basal OCR | Reserve capacity to respond to energy demands | FCCP |
| Non-Mitochondrial Respiration | OCR after rotenone/antimycin A | Oxygen consumption by non-mitochondrial sources | Rotenone (Complex I inhibitor) + Antimycin A (Complex III inhibitor) |
Integrated Experimental Approaches and Methodologies
Synergistic Assay Integration
The true power of mitochondrial assessment emerges when these complementary assays are integrated within a unified experimental framework. Mitochondrial function exists as an interconnected network rather than isolated parameters, and strategic assay combinations provide a multidimensional perspective that captures this complexity. The combination of techniques, including respirometry and mitochondrial membrane potential assessment, is necessary to understand the complexity and biological and clinical relevance of mitochondrial function in human disease [54].
A particularly powerful integration combines OCR measurements with ATP production assays. While OCR reveals the rate of oxygen consumption and electron flow through the respiratory chain, ATP quantification directly measures the energetic output of this process. This combination allows researchers to calculate the coupling efficiency of mitochondria - the proportion of oxygen consumption that is actually dedicated to ATP synthesis versus lost through proton leak and other inefficiencies [53] [24]. Similarly, integrating ROS measurements with respiration parameters provides insights into the relationship between electron transport efficiency and radical species generation, particularly relevant in pathological conditions where oxidative stress contributes to disease progression [54] [56].
When designing an integrated assessment strategy, researchers should consider the technical compatibility of assay protocols. For instance, sequential measurements on the same sample may require careful optimization to avoid interference between detection methods, while parallel measurements on matched samples may provide more reliable data for certain parameter combinations.
Experimental Protocols for Mitochondrial Function Assessment
ATP Detection Using Bioluminescence Assay
The luciferin-luciferase bioluminescence assay represents the gold standard for sensitive ATP quantification [53] [55]. The experimental procedure is as follows:
Prepare Working Solution: Create a solution containing luciferase, luciferin sodium, surfactant, and activator according to manufacturer specifications.
Generate Standard Curve: Prepare ATP solutions of known concentrations (e.g., 1-100 μM) to establish a standard curve for quantification.
Prepare Cell Samples: Centrifuge cell samples to remove culture medium and resuspend pellets in phosphate-buffered saline (PBS, 0.01 M, pH 7.4).
Perform Assay: Add standards or cell suspensions to microplate wells, followed immediately by equal volumes of working solution.
Incubate and Measure: After brief incubation at room temperature, measure chemiluminescence intensity using a microplate reader.
Calculate ATP Content: Determine intracellular ATP content by comparing sample readings to the standard curve [55].
This protocol typically requires 5-15 minutes and offers exceptional sensitivity down to 10⁻¹² mol/L, enabling detection of ATP in trace mitochondrial samples [53].
ROS Detection Using DCFH-DA Fluorescence Assay
The fluorescent probe-based method for ROS detection provides a sensitive approach for quantifying intracellular oxidative stress [55]:
Probe Loading: Add the DCFH-DA probe to the cell culture system. The optimal concentration varies depending on cell density and type, typically ranging from 1-10 μM.
Incubation: Incubate cells at 37°C in a humidified 5% CO₂ incubator for 30-60 minutes. Exact duration depends on cell type, experimental stimulation conditions, and DCFH-DA concentration.
Washing: Following incubation, centrifuge cell samples and wash pellets with phosphate-buffered saline to remove unincorporated probe.
Fluorescence Detection: Evaluate intracellular ROS levels by detecting fluorescence intensity using a fluorescence microplate reader (excitation/emission ~485/535 nm) or fluorescence microscope [55].
This method capitalizes on the oxidation of non-fluorescent DCHF to highly fluorescent DCF by intracellular ROS, providing a quantitative measure of oxidative stress.
Mitochondrial Respiration Assessment in Tissue Biopsy Punches
For spatial resolution of mitochondrial function in complex tissues, the biopsy punch method enables OCR measurement in anatomically defined regions [57]:
Tissue Preparation: Prepare coronal brain sections (220 μm thickness) using a tissue chopper and place sections containing regions of interest in oxygenated artificial cerebrospinal fluid (aCSF) to maintain viability.
Punch Excision: Excise tissue punches from defined anatomical regions using optimized punch diameters (500-750 μm for hippocampal subfields).
Sample Placement: Position tissue punches in the center of each XFe96 Extracellular Flux Assay sensor cartridge well, ensuring consistent placement for reproducible OCR measurements.
OCR Measurement: Monitor basal oxygen consumption rate followed by sequential injection of mitochondrial modulators: oligomycin (1-2 μM) to inhibit ATP synthase, FCCP (0.5-1.5 μM) to uncouple mitochondria, and rotenone/antimycin A (0.5 μM each) to inhibit electron transport chain.
Data Validation: Verify punch position after assay completion and exclude any samples that moved during the procedure [57].
This method maintains tissue viability for up to 2 hours in oxygenated aCSF and enables high-resolution mapping of mitochondrial function with minimal disruption to the native cellular environment.
Advanced Technical Considerations and Data Interpretation
Mitochondrial Membrane Potential Measurement in Context
The interpretation of ΔΨm data requires careful consideration of its relationship to other mitochondrial parameters. As recently emphasized, "ΔΨm has low sensitivity and specificity reporting changes in OXPHOS activity in coupled mitochondria" [24]. The mitochondrial membrane potential represents the electrical component of the proton motive force that drives ATP synthesis, but its relationship to respiratory function is complex and non-linear.
In coupled mitochondria, an increase in ATP demand typically leads to increased respiration with minimal change in ΔΨm, as the electron transport chain responds to maintain the proton gradient. Conversely, conditions that inhibit electron transport or increase membrane permeability cause ΔΨm dissipation. This complex relationship explains why complementary assays are essential for accurate interpretation - a decreased ΔΨm could indicate either increased ATP synthesis (healthy response to energy demand) or mitochondrial dysfunction (pathological impairment), distinctions that can only be resolved with additional ATP and respiration measurements [24].
Technical considerations for ΔΨm probes further complicate interpretation. TMRM, TMRE, and Rhodamine 123 all exhibit potential-dependent accumulation and fluorescence quenching, but differ in their binding characteristics and effects on mitochondrial function. Binding to mitochondria is temperature-dependent and follows the order TMRE > R123 > TMRM, with TMRM demonstrating minimal respiratory suppression at low concentrations, making it preferable for chronic studies [5] [6].
Visualization of Integrated Mitochondrial Assessment
The following diagram illustrates the integrated relationship between key mitochondrial parameters and their assessment methodologies:
Research Reagent Solutions for Mitochondrial Assessment
Table 3: Essential Research Reagents for Mitochondrial Function Assays
| Reagent Category | Specific Examples | Function & Application | Technical Considerations |
|---|---|---|---|
| ΔΨm Probes | TMRM, TMRE, Rhodamine 123, JC-1 | Accumulate in mitochondria in potential-dependent manner; qualitative and quantitative ΔΨm assessment | TMRM: Minimal respiration suppression, preferred for chronic studies; JC-1: Exhibits potential-dependent emission shift (red/green) |
| ROS Detection Probes | DCFH-DA, Dihydroethidium, MitoSOX | Detect intracellular or mitochondrial-specific ROS through oxidation to fluorescent products | DCFH-DA: General oxidative stress; MitoSOX: Mitochondrial superoxide specific |
| ATP Detection Reagents | Luciferin-luciferase, ATP bioluminescence assay kits | Enzymatic conversion of ATP to light signal for sensitive quantification | Extreme sensitivity (femtromole range); susceptible to interference from fluorescent compounds |
| Respiratory Chain Modulators | Oligomycin, FCCP, Rotenone, Antimycin A | Specific inhibition/uncoupling of respiratory complexes to dissect ETC function | Sequential injection enables determination of basal, ATP-linked, maximal, and non-mitochondrial respiration |
| Mitochondrial Stains | Mitotracker Red CMXRos, Mitotracker Green FM | Label mitochondria regardless of membrane potential for morphology assessment | Mitotracker Red: Potential-sensitive; Mitotracker Green: Potential-insensitive |
| Sample Preparation Reagents | Artificial CSF, mitochondrial isolation kits, cell permeabilization agents | Maintain tissue viability or enable substrate access for functional assays | Optimization required for specific tissue types and experimental objectives |
The comprehensive evaluation of mitochondrial function requires an integrated approach that combines multiple complementary assays. No single parameter provides a complete picture of mitochondrial health, and the complex interrelationships between membrane potential, respiration, ATP production, and ROS generation necessitate multidimensional assessment strategies. The strategic selection between TMRM and Rhodamine 123 for ΔΨm measurement represents just one component of this integrated framework, with probe choice influencing data interpretation in the context of other mitochondrial parameters.
As mitochondrial research continues to evolve, emerging technologies including novel radiotracers with PET imaging capabilities promise to extend these assessments to in vivo contexts [54]. However, the fundamental principle of corroborative evidence through complementary assays will remain essential for accurate interpretation of mitochondrial function in both basic research and clinical applications. By implementing the methodologies and integrative approaches outlined in this guide, researchers can advance our understanding of mitochondrial biology and its crucial role in health and disease.
The mitochondrial membrane potential (ΔΨM) is a fundamental parameter in cellular bioenergetics, serving as the principal component of the proton motive force that drives ATP synthesis [58] [16]. Widely recognized as a key indicator of mitochondrial health and function, ΔΨM influences a host of biological processes including calcium homeostasis, reactive oxygen species production, and apoptotic signaling [13] [59]. While fluorescent cationic dyes such as tetramethylrhodamine methyl ester (TMRM) and rhodamine 123 (Rhod123) have become indispensable tools for estimating ΔΨM in living cells, conventional semi-quantitative fluorescence measurements are prone to significant artifacts and misinterpretation [58] [3]. Factors including cell size, mitochondrial density, plasma membrane potential (ΔΨP), probe binding characteristics, and nonspecific background fluorescence collectively distort the relationship between observed fluorescence intensity and the actual biological parameter of interest [60] [16].
The limitations of semi-quantitative approaches become particularly evident when comparing different cell types or assessing ΔΨM under conditions where ΔΨP fluctuates, such as during neuronal stimulation or metabolic challenge [58] [16]. Consequently, there has been growing emphasis within the field on developing absolute quantitative methods that can convert fluorescence measurements into reliable millivolt values, thereby enabling direct comparison between experimental conditions and across different laboratories [58] [60] [16]. This review comprehensively compares advanced quantitative approaches for ΔΨM determination, with particular focus on the performance characteristics of TMRM and Rhod123 in chronic versus acute studies of mitochondrial function. By providing researchers with a critical analysis of methodological considerations, experimental protocols, and interpretive frameworks, we aim to facilitate the adoption of more rigorous and physiologically relevant assessment of mitochondrial membrane potential.
Fundamental Principles of ΔΨM Measurement with Fluorescent Probes
Biophysical Basis of Potential-Sensitive Probe Accumulation
The theoretical foundation for using lipophilic cations as ΔΨM probes rests upon the Nernst equation, which describes the equilibrium distribution of permeable charged molecules across a membrane in response to an electrochemical potential gradient [58] [16]. For a monovalent cation such as TMRM or Rhod123, the Nernst equation predicts a tenfold accumulation in the mitochondrial matrix for every 59 mV (at 37°C) of negative-inside membrane potential [3]. In practice, these probes distribute across both the plasma membrane and mitochondrial inner membrane, resulting in complex accumulation kinetics influenced by multiple cellular parameters [58] [60].
The behavior of these potentiometric probes is governed by the electrostatic barrier model of ion transport through membranes, which accounts for the voltage-dependent translocation of charged molecules through the lipid bilayer [60]. This model provides the calibration rate equations necessary to back-calculate ΔΨP and ΔΨM from fluorescence time courses, effectively deconvoluting the contributions of various confounding factors [58] [16]. A critical advancement in the field has been the recognition that accurate determination of ΔΨM requires parallel assessment of ΔΨP, as changes in plasma membrane potential can significantly influence mitochondrial probe accumulation independently of actual changes in ΔΨM [58] [16].
Operational Modes: Quenching Versus Non-Quenching Configurations
Both TMRM and Rhod123 can be utilized in two distinct operational modes, each with characteristic advantages and limitations for different experimental scenarios:
Non-quenching (redistribution) mode: Employed at low probe concentrations (typically 5-20 nM for TMRM), this configuration avoids fluorescence quenching due to probe aggregation in the mitochondrial matrix [13] [18]. In this mode, depolarization events result in probe redistribution from mitochondria to cytosol, manifesting as decreased mitochondrial fluorescence intensity and increased cytoplasmic signal [18]. This approach is particularly suitable for detecting subtle, real-time changes in ΔΨM and for spatial mapping of potential within individual mitochondria [13].
Quenching mode: Implemented at higher probe concentrations (often 100-500 nM), this approach leverages the fluorescence quenching that occurs when dyes accumulate at high density in the mitochondrial matrix [5] [18]. Mitochondrial depolarization produces an increase in total cellular fluorescence as probes redistribute to the cytosol where quenching is relieved. While this mode offers enhanced signal amplitude for detecting large ΔΨM changes, its non-linear response characteristics and sensitivity to mitochondrial volume fractions limit its utility for quantitative applications [60].
Table 1: Key Characteristics of Fluorescent ΔΨM Probes
| Parameter | TMRM | Rhod123 | JC-1 |
|---|---|---|---|
| Quantitative Capability | Excellent (with proper calibration) | Moderate (with limitations) | Poor (semi-quantitative only) |
| Primary Applications | Absolute ΔΨM quantification; kinetic studies | Relative ΔΨM changes; population screening | Qualitative assessment; high-throughput screening |
| Binding Characteristics | Lower binding, more free dye available | Moderate binding affinity | Extensive binding and aggregation |
| Cellular Toxicity | Lower at nanomolar concentrations | Moderate, concentration-dependent | Significant, especially with prolonged exposure |
| Photostability | High | Moderate | Variable (J-aggregates sensitive to oxidation) |
| Sensitivity to ΔΨP | Yes (but can be calibrated) | Yes (difficult to calibrate) | Highly sensitive (confounds interpretation) |
| Recommended Use | Absolute quantification in acute and chronic studies | Relative comparisons in acute studies | Qualitative screening only |
Comparative Analysis of TMRM and Rhod123 as Quantitative ΔΨM Probes
Photophysical Properties and Biological Interactions
The molecular characteristics of TMRM and Rhod123 confer distinct performance profiles that directly influence their suitability for quantitative applications. TMRM demonstrates superior membrane potential responsiveness due to its more ideal Nernstian behavior and reduced binding to intracellular components compared to Rhod123 [5] [12]. This property is particularly valuable in quantitative applications where the relationship between probe concentration and fluorescence intensity must remain linear and predictable. Experimental evidence indicates that TMRM exhibits the lowest degree of binding to mitochondrial membranes among rhodamine derivatives, followed by Rhod123 and TMRE (tetramethylrhodamine ethyl ester), with binding affinity showing temperature dependence [5].
Rhod123 demonstrates significant limitations for quantitative work, including intracellular modification through deesterification to rhodamine 110, a zwitterion with markedly different membrane permeability and retention characteristics [3]. This transformation, mediated by cellular esterases, effectively traps the probe within compartments and fundamentally alters its voltage-responsive properties. Additionally, Rhod123 is more susceptible to active extrusion from cells via multidrug resistance transporters, creating potential artifacts when comparing different cell types, particularly between normal and cancer cells [3]. These characteristics collectively undermine the quantitative reliability of Rhod123 in extended or comparative studies.
Artifact Potential and Limitations in Quantitative Applications
A critical concern in quantitative ΔΨM assessment is the potential for probes to perturb the very system they are designed to measure. Rhod123 and TMRM can both inhibit mitochondrial respiration at elevated concentrations, with the degree of suppression following the order TMRE > Rhod123 > TMRM [5]. This respiratory inhibition presents a particular challenge for chronic studies where prolonged probe exposure is necessary. When utilized at low concentrations (typically 10-50 nM), TMRM has been shown to minimally impact respiratory control, making it preferable for extended temporal observations [5].
The signal stability of these probes differs substantially in long-term experiments. Rhod123 undergoes significant intracellular modification over time, including cytochrome P450-mediated degradation and transformation into multiple fluorescent metabolites that confound interpretation [3]. These modifications are particularly pronounced in tumor cells, which exhibit enhanced retention of rhodamine derivatives compared to normal counterparts [3]. Such differential handling of probes between cell types introduces substantial artifacts when making comparative assessments of ΔΨM, limiting the utility of Rhod123 for cross-comparative studies.
Table 2: Performance Comparison in Experimental Applications
| Application Context | TMRM Performance | Rhod123 Performance | Recommended Choice |
|---|---|---|---|
| Acute Kinetic Studies (seconds to minutes) | Excellent temporal resolution; suitable for monitoring rapid ΔΨM fluctuations | Good initial response; signal stability concerns over time | TMRM for quantitative work; Rhod123 for qualitative assessment |
| Chronic Studies (hours to days) | Stable signal with minimal transformation; suitable for extended observation | Significant signal drift due to metabolic modification; limited reliability | TMRM exclusively for chronic applications |
| Absolute Quantification (millivolt values) | Established calibration protocols; validated in multiple cell types | No reliable absolute calibration method available | TMRM is the only appropriate choice |
| Single-Cell Analysis | Suitable for subcellular heterogeneity assessment; minimal partitioning artifacts | Moderate performance; binding characteristics limit spatial resolution | TMRM for precise single-cell quantification |
| High-Throughput Screening | Compatible with automated systems; requires careful calibration | Historically popular but prone to misinterpretation | TMRM with proper controls preferred |
| Multiparameter Imaging | Minimal spectral interference with common biosensors | Potential spectral overlap with GFP-based probes | TMRM with appropriate filter sets |
Absolute Calibration Methodologies: Converting Fluorescence to Millivolts
The Gerencser Algorithm for Absolute ΔΨM Determination
The most significant advancement in quantitative ΔΨM assessment comes from the methodology developed by Gerencser and colleagues, which enables calculation of both ΔΨM and ΔΨP in absolute millivolts in individual cells or populations of adherent cultured cells [58] [16]. This approach utilizes fluorescence microscopy time courses with internal calibration points that are subsequently computationally converted to millivolt values on an absolute scale. The technique employs a pair of potentiometric probes: the cationic TMRM for assessing mitochondrial and plasma membrane potentials, and an anionic bis-oxonol derivative (commercially available as FLIPR Membrane Potential Assay Explorer Kit) specifically for ΔΨP determination [58] [60].
The mathematical foundation of this method accounts for key parameters that distort simple fluorescence-potential relationships, including matrix:cell volume ratio, high- and low-affinity binding, activity coefficients, background fluorescence, and optical dilution effects [16]. By incorporating these factors into a biophysical model of probe behavior, the algorithm effectively back-calculates the potentials that drive observed fluorescence changes. Validation studies in cultured rat cortical neurons have established a resting ΔΨM of -139 mV, with physiological regulation between -108 mV and -158 mV during metabolic challenges [16]. The sensitivity analysis indicates a standard error of less than 11 mV for absolute calibrated values, with comparative errors between samples of approximately 5 mV [16].
Experimental Protocol for Absolute ΔΨM Calibration
The absolute calibration method requires specific instrumentation and a carefully controlled experimental workflow:
Instrumentation Requirements: An inverted fluorescence microscope with 10× or 20× high-NA objectives, high-sensitivity cooled CCD or sCMOS camera, LED light source with fast electronic shutter, real-time autofocus capability, motorized stage with microplate adapter, and heated environmental chamber are essential [58]. Filter sets should include excitation at 509/22 nm and 586/20 nm, dichroic 459/526/596 triple edge, and emission at 542/27 nm and 641/73 nm for optimal separation of the two probes [58].
Probe Loading and Experimental Protocol: Cells are loaded with both TMRM (typically 5-50 nM) and the bis-oxonol ΔΨP probe in an appropriate potentiometric medium [58] [60]. Following baseline acquisition, sequential additions of pharmacological agents provide critical calibration points: high K+ medium to depolarize ΔΨP, oligomycin to hyperpolarize ΔΨM by inhibiting ATP synthase, and finally FCCP to completely collapse ΔΨM [58] [16]. Each treatment addition must be carefully timed and documented for subsequent computational analysis.
Computational Analysis: The Image Analyst MKII software package provides specialized algorithms for converting fluorescence time courses to millivolt potentials [58] [60]. The Membrane Potential Calibration Wizard guides users through the stepwise analysis, incorporating auxiliary measurements of mitochondrial volume fraction and TMRM binding affinity when available [60]. For most applications, a default TMRM binding affinity value of 0.36 can be used with acceptable error [60].
Diagram 1: Absolute ΔΨM Calibration Workflow. This flowchart illustrates the sequential steps required for absolute millivolt calibration of mitochondrial membrane potential using the Gerencser algorithm.
Experimental Design Considerations for Acute Versus Chronic Studies
Methodological Optimization for Acute Kinetic Measurements
Acute studies of ΔΨM dynamics, typically spanning seconds to minutes, require particular attention to temporal resolution and rapid solution exchange. Such investigations might include assessment of mitochondrial responses to metabolic substrates, calcium pulses, or acute pharmacological challenges [59] [16]. For these applications, TMRM in non-quenching mode provides superior performance due to its linear response characteristics and minimal binding artifacts [13] [12]. Experimental configurations should prioritize rapid imaging capabilities (often 0.5-2 second intervals) while minimizing photodamage through careful optimization of illumination intensity and exposure duration [18].
The selection of appropriate controls and calibration paradigms is essential for valid interpretation of acute ΔΨM changes. Inclusion of FCCP or other protonophores at the conclusion of each experiment verifies that observed fluorescence changes genuinely reflect ΔΨM rather than confounding factors such as mitochondrial movement or changes in autofluorescence [18] [12]. When investigating cell types with dynamic plasma membrane potential, simultaneous monitoring of ΔΨP is strongly recommended to disambiguate contributions from plasma membrane versus mitochondrial polarization changes [58] [16].
Strategic Approaches for Chronic Longitudinal Investigations
Chronic studies of ΔΨM, extending from hours to days, present distinct methodological challenges including probe toxicity, photobleaching, and signal stability [3]. For such applications, TMRM again emerges as the preferred probe due to its minimal impact on cellular viability and greater resistance to metabolic modification compared to Rhod123 [5] [3]. Experimental design should incorporate strategies for sustained maintenance of probe concentration, potentially including continuous presence of low dye concentrations or periodic re-staining protocols [3].
A significant consideration in chronic studies is the potential for compensatory adaptations in mitochondrial networks in response to prolonged probe exposure. Appropriate control experiments should verify that key mitochondrial parameters (respiration, morphology, proliferation rates) remain unaffected by the extended imaging paradigm [12] [3]. For investigations requiring particularly prolonged observation, intermittent imaging approaches may be preferable to continuous monitoring to minimize cumulative phototoxicity while still capturing relevant temporal dynamics.
Diagram 2: Probe Selection Guide for Acute vs. Chronic Studies. This diagram illustrates the suitability characteristics of TMRM and Rhod123 for different experimental timeframes, with dashed lines indicating potential limitations.
The Scientist's Toolkit: Essential Reagents and Methodologies
Table 3: Essential Research Reagents and Methodologies for Quantitative ΔΨM Assessment
| Category | Specific Reagent/Kit | Function/Purpose | Application Context |
|---|---|---|---|
| Primary ΔΨM Probes | Tetramethylrhodamine methyl ester (TMRM) | Primary quantitative ΔΨM indicator; cationic dye that distributes according to Nernst equation | Absolute quantification; acute and chronic studies |
| Rhodamine 123 (Rhod123) | Alternative ΔΨM indicator; more prone to artifacts and metabolic modification | Relative comparisons in acute studies only | |
| ΔΨP Indicator | FLIPR Membrane Potential Assay Explorer Kit (PMPI) | Anionic bis-oxonol dye for simultaneous ΔΨP measurement | Essential for absolute calibration when ΔΨP fluctuates |
| Pharmacological Modulators | FCCP (Carbonyl cyanide 4-trifluoromethoxyphenylhydrazone) | Protonophore that completely collapses ΔΨM; used for validation and calibration | Essential control for all quantitative studies |
| Oligomycin | ATP synthase inhibitor that induces ΔΨM hyperpolarization | Calibration paradigm component | |
| High K+ Medium | Solution for plasma membrane depolarization | ΔΨP calibration component | |
| Software Solutions | Image Analyst MKII | Computational platform for fluorescence to millivolt conversion | Required for absolute calibration methodology |
| Additional Resources | MitoTracker Red CMXRos | Alternative mitochondrial dye for morphology assessment | Comparative studies; not recommended for quantitative ΔΨM |
| Calcein AM | Cell viability and volume indicator | Control experiments |
The advancing sophistication of mitochondrial research demands corresponding evolution in analytical methodologies, particularly for fundamental parameters such as membrane potential. This comparative analysis demonstrates that TMRM emerges as the superior probe for quantitative ΔΨM assessment across both acute and chronic experimental paradigms, while Rhod123 exhibits significant limitations for rigorous quantification. The development of absolute calibration methodologies represents a critical advancement that enables genuine cross-comparison between experimental conditions and cell types, effectively overcoming the confounding factors that have historically plagued semi-quantitative fluorescence measurements.
Researchers should carefully align their probe selection and methodological approach with specific experimental objectives. For investigations requiring precise kinetic resolution of ΔΨM dynamics or absolute millivolt determination, TMRM with proper calibration provides unparalleled capability. The availability of established protocols and computational tools now makes these advanced quantitative approaches accessible to a broad range of investigators. As mitochondrial dysfunction continues to be implicated in diverse pathological conditions including neurodegenerative diseases, metabolic disorders, and cancer [59] [61], the implementation of robust, quantitative assessment methodologies will be essential for both basic mechanistic investigations and therapeutic development.
The mitochondrial membrane potential (ΔΨm) is a critical component of the proton electrochemical gradient that drives ATP synthesis. Fluorescent cationic probes, such as TMRM and Rhodamine 123 (Rhod123), are indispensable tools for measuring ΔΨm in living cells. However, the assumption that ΔΨm always accurately reflects the proton gradient (ΔpHm) can lead to misinterpretation of mitochondrial bioenergetics. This case study examines how non-protonic charges, particularly calcium ions, can decouple ΔΨm from ΔpHm, creating a critical pitfall in mitochondrial function assessment. We compare the performance of TMRM and Rhod123 in detecting this phenomenon, providing experimental data and protocols to guide probe selection for specific research applications.
The mitochondrial membrane potential (ΔΨm) is the electrical component of the transmembrane potential of hydrogen ions generated by proton pumps, which is utilized by ATP synthase for oxidative phosphorylation [1]. Typically ranging from 150-180 mV (negative inside the matrix), ΔΨm constitutes the major portion of the proton motive force (Δp), with the pH gradient (ΔpHm) contributing the remaining 30-60 mV [7]. The total proton driving force can be represented by the equation: Δp (mV) = ΔΨm − 60ΔpHm at 37°C [7].
Fluorescent lipophilic cations, including tetramethylrhodamine methyl ester (TMRM) and Rhodamine 123 (Rhod123), have become fundamental tools for monitoring ΔΨm in living cells [8]. These probes distribute across membranes according to the Nernst equation, accumulating in the mitochondrial matrix in proportion to ΔΨm [5] [7]. While theoretically straightforward, practical interpretation of dye behavior requires careful consideration of multiple factors including dye binding characteristics, concentration-dependent effects, and potential chemical modifications within cells [7] [3].
A critical and often overlooked limitation is that these cationic dyes measure only the electrical gradient (ΔΨm) and cannot directly assess the proton concentration gradient (ΔpHm) [7]. This distinction becomes particularly important when non-protonic charges, such as calcium ions, influence the electrical potential independently of proton movements, potentially creating a discordance between what the dyes report and the actual proton motive force available for ATP synthesis.
Technical Comparison of TMRM and Rhodamine 123
Fundamental Photophysical and Accumulation Properties
Table 1: Fundamental Properties of TMRM and Rhodamine 123
| Property | TMRM/TMRE | Rhodamine 123 |
|---|---|---|
| Chemical Structure | Tetramethylrhodamine methyl/ethyl ester | Rhodamine with hydroxyl group |
| Charge | Lipophilic cation | Lipophilic cation |
| Accumulation Mechanism | Nernstian distribution plus membrane binding [5] | Nernstian distribution plus membrane binding [5] |
| Spectral Shift upon Accumulation | Red shift in absorption and emission spectra [5] | Red shift in absorption and emission spectra [5] |
| Fluorescence Quenching | Yes, when concentrated in mitochondria [5] | Yes, when concentrated in mitochondria [5] |
| Binding to Mitochondrial Membranes | Moderate (TMRM < R123 < TMRE) [5] | Significant (TMRM < R123 < TMRE) [5] |
| Temperature Dependence of Binding | Yes [5] | Yes [5] |
Both TMRM and Rhod123 are lipophilic cations that accumulate in mitochondria in response to the negative internal potential, exhibiting fluorescence quenching and red spectral shifts upon accumulation [5]. However, they differ significantly in their binding properties to mitochondrial membranes, with the degree of binding following the order TMRE > Rhod123 > TMRM [5]. This binding is temperature-dependent and results in dye accumulation that exceeds predictions based solely on the Nernst equation, requiring correction factors for accurate ΔΨm calculation [5].
Functional Comparison for Research Applications
Table 2: Performance Comparison for Research Applications
| Application Parameter | TMRM/TMRE | Rhodamine 123 |
|---|---|---|
| Recommended Use Case | Chronic studies, pre-existing ΔΨm measurement (non-quenching mode) [7] | Acute changes, fast-resolution studies (quenching mode) [7] |
| Mitochondrial Toxicity | Lowest inhibition of electron transport chain [5] [7] | Moderate inhibition of electron transport chain [5] |
| Equilibration Kinetics | Fast equilibration [7] | Slow equilibration, advantageous for quenching studies [7] |
| Effective Concentration Range | Non-quenching: ~1-30 nM; Quenching: >50-100 nM [7] | Quenching mode: ~1-10 μM [7] |
| Multidrug Resistance Pump Substrate | Less affected [7] | Strong substrate for P-glycoprotein and MRP [62] |
| Retention in Tumor Cells | Moderate [3] | High, with potential for intracellular modification [3] |
| Suitability for Intact Tissue | Limited in perfused heart due to cytosolic spectral shifts [5] | Similar limitations in intact tissues [5] |
TMRM exhibits the lowest mitochondrial binding and minimal suppression of mitochondrial respiratory control, making it preferable for prolonged studies and quantitative measurements [5] [7]. Its fast equilibration is ideal for dynamic measurements but less suited for quenching studies compared to Rhod123 [7]. Rhod123's slower membrane permeation makes it superior for quenching applications where acute changes are monitored, though it shows greater inhibition of mitochondrial function [7]. Critically, Rhod123 is a strong substrate for multidrug resistance transporters (P-glycoprotein and MRP), which can significantly affect its accumulation and retention independent of ΔΨm [62].
The Decoupling Phenomenon: Non-Protonic Charges and ΔΨm
Theoretical Framework for Decoupling
The proton motive force (Δp) comprises both electrical (ΔΨm) and chemical (ΔpHm) components. Cationic fluorescent dyes directly measure only ΔΨm, creating a potential interpretive gap where the electrical potential may not accurately reflect the proton gradient. This decoupling occurs when non-protonic charges, particularly calcium ions (Ca²⁺), significantly contribute to the electrical potential across the inner mitochondrial membrane.
The fundamental relationship can be understood through the following diagram illustrating how distinct factors influence the two components of the proton motive force:
This diagram illustrates the central problem: cationic dyes directly measure only ΔΨm, which can be influenced by both protonic and non-protonic charges, while the crucial parameter for ATP synthesis is the complete proton motive force (Δp).
Experimental Evidence from Neuronal Studies
Research in rodent cortical neurons provides compelling evidence for this decoupling phenomenon. Studies examining the effects of the HIV transactivator of transcription (Tat) gene product revealed a paradoxical increase in ΔΨm (hyperpolarization) measured using both TMRM and Rhod123 [7]. Validation experiments confirmed this was not due to changes in mitochondrial morphology, mass, or plasma membrane potential [7].
However, when mitochondrial pH was measured simultaneously using a pH-sensitive dye (SNARF-1), researchers discovered that mitochondrial pH was actually decreased (increased [H⁺]mito), indicating a loss of the proton gradient [7]. This created a conundrum: typically, increased [H⁺]mito is accompanied by decreased ΔΨm, yet the measurements showed increased ΔΨm.
Further investigation using ratiometric FRET constructs revealed that Tat induced calcium (Ca²⁺) release from both mitochondrial and endoplasmic reticulum stores [7]. Only by preventing this Tat-induced dumping of Ca²⁺ into the cytoplasm could researchers detect the mitochondrial depolarization that would be predicted based on the observed increase in [H⁺]mito alone [7]. This provided direct evidence that increased cytosolic [Ca²⁺], rather than protonic charges, was responsible for the Tat-induced hyperpolarization of ΔΨm.
The experimental workflow and key findings from this pivotal study are summarized below:
This case study demonstrates that measuring ΔΨm alone with cationic dyes cannot reliably indicate changes in mitochondrial pH or respiratory status, as non-protonic charges like calcium can dramatically influence the electrical potential independently of the proton gradient.
Experimental Protocols for Investigating Decoupling
Parallel Measurement of ΔΨm and Mitochondrial Calcium
Objective: To simultaneously monitor changes in mitochondrial membrane potential and mitochondrial calcium levels to identify decoupling events.
Materials:
- Cell Line: Primary rodent cortical neurons or appropriate cell model
- ΔΨm Indicator: TMRM (25 nM for non-quenching mode) or Rhod123 (1-2 μM for quenching mode)
- Mitochondrial Calcium Indicator: Rhod-2 AM or CEPIA-mt
- Imaging Setup: Confocal microscope with temperature and CO₂ control
- Pharmacological Agents: FCCP (2-4 μM) for depolarization control, Ca²⁺ ionophores for calibration
Procedure:
- Culture cells on glass-bottom dishes and maintain under standard conditions until 70-80% confluent.
- Load cells with TMRM (25 nM) or Rhod123 (2 μM) and Rhod-2 AM (2-5 μM) in imaging buffer for 30 minutes at 37°C.
- Wash cells twice with dye-free buffer and maintain in fresh buffer during imaging.
- For TMRM, use non-quenching mode with continuous dye presence in bath.
- For Rhod123, use quenching mode after dye loading and washout.
- Acquire time-lapse images every 30-60 seconds using appropriate excitation/emission filters.
- Apply experimental treatments (e.g., Tat protein for HIV studies) after establishing baseline.
- Include control experiments with FCCP to confirm mitochondrial specificity.
- Analyze fluorescence intensity changes in mitochondrial regions over time.
Interpretation: Concurrent increases in both ΔΨm and mitochondrial calcium suggest non-protonic charge contribution to hyperpolarization. Discrepancies between ΔΨm measurements and expected bioenergetic status should trigger investigation of ionic influences.
Validation Protocol Using Calcium Chelation
Objective: To confirm the role of calcium fluxes in observed ΔΨm and ΔpHm decoupling.
Materials:
- Calcium Chelators: BAPTA-AM (intracellular), EGTA (extracellular)
- ΔpHm Indicator: SNARF-1 AM
- Additional Reagents: Ionomycin, Thapsigargin
Procedure:
- Pre-treat cells with BAPTA-AM (10-20 μM) for 30 minutes to buffer intracellular calcium.
- Load with TMRM (25 nM) and SNARF-1 AM (5-10 μM) for simultaneous ΔΨm and ΔpHm assessment.
- Expose to experimental treatment (e.g., Tat protein) while monitoring both parameters.
- Compare responses with and without calcium chelation.
- Validate methodology using calcium ionophores as positive controls.
- Quantify the relative contributions of protonic and non-protonic charges to ΔΨm.
The Scientist's Toolkit: Essential Research Reagents
Table 3: Key Research Reagents for Investigating ΔΨm Decoupling
| Reagent Category | Specific Examples | Function and Application |
|---|---|---|
| ΔΨm Indicators | TMRM, TMRE, Rhodamine 123 | Monitor mitochondrial membrane potential through potential-dependent accumulation [7] |
| ΔpHm Indicators | SNARF-1, BCECF | Measure mitochondrial matrix pH to assess proton gradient component [7] |
| Calcium Indicators | Rhod-2 AM, CEPIA-mt, YC3.1mito | Monitor mitochondrial calcium levels to identify non-protonic charge effects [7] |
| Uncouplers | FCCP, CCCP | Collapse proton gradient to validate mitochondrial specificity of dyes [7] [3] |
| ATP Synthase Inhibitors | Oligomycin, IF1 manipulation | Inhibit ATP synthase forward operation; IF1 KO models chronic hyperpolarization [4] |
| Calcium Modulators | BAPTA-AM, EGTA, Ionomycin | Chelate or manipulate calcium to test specific contribution to ΔΨm [7] |
| Multidrug Resistance Inhibitors | Cyclosporin A, Amiodarone | Block dye efflux transporters to improve signal interpretation [3] [62] |
Implications for Research and Drug Development
The decoupling of ΔΨm from ΔpHm has significant implications for interpreting mitochondrial function in both basic research and drug development. In disease states, sustained mitochondrial hyperpolarization has been reported in multiple pathologies, including pulmonary hypertension, glioblastoma, and ovarian cancer [4]. Chronic hyperpolarization in IF1-knockout models produces widespread transcriptional changes, including downregulation of oxidative phosphorylation genes and upregulation of glycolytic and lipid metabolic pathways [4]. These adaptations involve phospholipid remodeling rather than redox or metabolic alterations, suggesting a novel mechanism linking ΔΨm to epigenetic regulation [4].
In toxicology, mitochondrial dysfunction is increasingly recognized as a key factor in drug-induced organ damage. For example, aristolochic acid I (AAI) induces nephrotoxicity through mitochondrial DNA depletion, loss of ΔΨm, and decreased ATP production [63]. Understanding whether these effects involve pure depolarization or more complex decoupling phenomena could inform therapeutic strategies, such as antioxidant interventions with vitamin C or catalpol [63].
For drug development professionals, these findings highlight the importance of:
- Using multiple complementary assays to assess mitochondrial function
- Considering cell-type-specific differences in dye retention and metabolism
- Accounting for potential multidrug resistance transporter activity that may affect probe distribution
- Interpreting ΔΨm data within the broader context of cellular bioenergetics
TMRM and Rhodamine 123 remain valuable tools for assessing mitochondrial membrane potential, but their limitations must be recognized. TMRM's minimal toxicity and binding characteristics make it preferable for chronic studies and quantitative measurements, while Rhod123's slower equilibration favors acute measurements in quenching mode. The critical consideration for researchers is that these cationic dyes report only on the electrical component of the proton motive force, creating vulnerability to misinterpretation when non-protonic charges influence ΔΨm.
The case study of Tat-induced neuronal toxicity demonstrates how calcium fluxes can hyperpolarize ΔΨm despite a collapsing proton gradient, creating a potentially misleading picture of mitochondrial fitness. This decoupling phenomenon underscores the necessity of multimodal assessment in mitochondrial research, combining ΔΨm measurements with direct pH assessment, calcium monitoring, and functional assays of ATP production. Only through such comprehensive approaches can researchers accurately interpret bioenergetic status and avoid the pitfalls of relying solely on cationic dye fluorescence as a measure of mitochondrial function.
Conclusion
Selecting between TMRM and Rhodamine 123 is not merely a technical choice but a strategic one, fundamentally shaping the reliability and interpretation of mitochondrial membrane potential data. For chronic studies and pre-existing ΔΨm assessment, TMRM in non-quenching mode offers lower binding and minimal interference. For resolving rapid, acute changes, Rhodamine 123 in quenching mode provides superior temporal resolution. Rigorous validation with pharmacological controls and complementary assays is non-negotiable, as fluorescence changes can be influenced by factors beyond ΔΨm, including probe modification and ion flux. Mastering these protocols and their limitations will empower more accurate assessments of mitochondrial function, directly advancing research in neurodegeneration, cancer bioenergetics, and drug discovery.
References
- 1. Mitochondrial membrane potential - PMC [https://pmc.ncbi.nlm.nih.gov/articles/PMC5792320/]
- 2. Genetically encoded tool for manipulation of ΔΨm ... [https://www.sciencedirect.com/science/article/abs/pii/S2451945625000972]
- 3. Is the Mitochondrial Membrane Potential (∆Ψ) Correctly ... [https://www.mdpi.com/1422-0067/23/1/482]
- 4. Mitochondrial membrane hyperpolarization modulates ... [https://www.nature.com/articles/s41467-025-59427-5]
- 5. Measurement of mitochondrial membrane potential using ... [https://pmc.ncbi.nlm.nih.gov/articles/PMC1302536/]
- 6. Measurement of Mitochondrial Membrane Potential Using ... [https://www.sciencedirect.com/science/article/pii/S0006349599772140]
- 7. Mitochondrial membrane potential probes and the proton ... [https://pmc.ncbi.nlm.nih.gov/articles/PMC3115691/]
- 8. Visualization of mitochondrial membrane potential in ... [https://pubmed.ncbi.nlm.nih.gov/32183960/]
- 9. Quantitative analysis of mitochondrial membrane potential ... [https://pmc.ncbi.nlm.nih.gov/articles/PMC7871195/]
- 10. Measurement of mitochondrial membrane potential ... - PubMed [https://pubmed.ncbi.nlm.nih.gov/9876159/]
- 11. Mitochondrial Inner Membrane Electrophysiology Assessed ... [https://pmc.ncbi.nlm.nih.gov/articles/PMC3508792/]
- 12. Performance of TMRM and Mitotrackers in mitochondrial ... [https://www.sciencedirect.com/science/article/pii/S0005272823000737]
- 13. High-Throughput Microscopy Analysis of Mitochondrial ... [https://pmc.ncbi.nlm.nih.gov/articles/PMC10093082/]
- 14. Rhodamine 123, 25 mg 25 mg | Buy Online | Invitrogen™ [https://www.thermofisher.com/order/catalog/product/R302]
- 15. Spectrum [Rhodamine 123] [https://www.aatbio.com/fluorescence-excitation-emission-spectrum-graph-viewer/rhodamine_123]
- 16. Quantitative measurement of mitochondrial membrane ... [https://pmc.ncbi.nlm.nih.gov/articles/PMC3448152/]
- 17. Stable Differences in Intrinsic Mitochondrial Membrane ... [https://pmc.ncbi.nlm.nih.gov/articles/PMC3132547/]
- 18. Visualization of mitochondrial membrane potential in ... [https://www.sciencedirect.com/science/article/abs/pii/S0091679X19301207]
- 19. - Chemistry LibreTexts Nernst Equation [https://chem.libretexts.org/Bookshelves/Analytical_Chemistry/Supplemental_Modules_(Analytical_Chemistry)/Electrochemistry/Nernst_Equation]
- 20. Equilibrium Potential - Resting Membrane... - PhysiologyWeb Nernst [https://physiologyweb.com/lecture_notes/resting_membrane_potential/resting_membrane_potential_nernst_equilibrium_potential.html]
- 21. The nernst equation [https://www.bristol.ac.uk/phys-pharm-neuro/media/plangton/ugteach/ugindex/m1_index/med_memb/file/Nernst1.htm]
- 22. Implications of mitochondrial membrane potential gradients ... [https://www.nature.com/articles/s41598-024-65595-z]
- 23. evaluation of proton flux through F0 during ATP synthesis [https://www.sciencedirect.com/science/article/pii/S0005272803001105]
- 24. Measuring mitochondrial membrane potential | The EMBO ... [https://link.springer.com/article/10.1038/s44318-025-00632-9]
- 25. High-Throughput Microscopy Analysis of Mitochondrial ... [https://www.mdpi.com/2073-4409/12/7/1089]
- 26. Measurement of mitochondrial membrane potential using ... [https://pure.psu.edu/en/publications/measurement-of-mitochondrial-membrane-potential-using-fluorescent/]
- 27. Pro-inflammatory macrophages produce mitochondria ... [https://pmc.ncbi.nlm.nih.gov/articles/PMC11946910/]
- 28. Guidelines on experimental methods to assess ... [https://www.nature.com/articles/s41418-017-0020-4]
- 29. Mitochondrial Membrane Potential - an overview [https://www.sciencedirect.com/topics/medicine-and-dentistry/mitochondrial-membrane-potential]
- 30. Characterization of Rhodamine-123 as a Tracer Dye for Use ... [https://journals.plos.org/plosone/article?id=10.1371/journal.pone.0033253]
- 31. Slow-Response Probes—Section 22.3 [https://www.thermofisher.com/ng/en/home/references/molecular-probes-the-handbook/probes-for-membrane-potential/slow-response-probes.html]
- 32. Fluorescence microscopy imaging of mitochondrial ... [https://pmc.ncbi.nlm.nih.gov/articles/PMC10326048/]
- 33. Assays for Mitochondria Function | Thermo Fisher Scientific - UK [https://www.thermofisher.com/uk/en/home/life-science/cell-analysis/cell-viability-and-regulation/apoptosis/mitochondria-function.html]
- 34. Detection of de- and hyperpolarization of mitochondria of ... [https://www.sciencedirect.com/science/article/abs/pii/S0165027008001155]
- 35. Mitochondrial membrane potential probes and the proton ... [https://www.bohrium.com/paper-details/mitochondrial-membrane-potential-probes-and-the-proton-gradient-a-practical-usage-guide/811679850480795648-4675]
- 36. Dynamic Modeling of Mitochondrial Membrane Potential ... [https://pmc.ncbi.nlm.nih.gov/articles/PMC8416757/]
- 37. The mechanism of mitochondrial membrane potential ... [https://www.nature.com/articles/4400916]
- 38. Is the Mitochondrial Membrane Potential (∆Ψ) Correctly ... [https://pmc.ncbi.nlm.nih.gov/articles/PMC8745654/]
- 39. Comprehensive Guide to Mitochondrial Function Assays [https://www.elabscience.com/resources/cell-metabolism-technical-topics/1954?srsltid=AfmBOoqVOkSzkkZ958n5QAnu_F6GS66Wrj1QpJIBM3g3PD5sdFu4660A]
- 40. Functional Mitochondrial Staining Protocol [https://www.thermofisher.com/us/en/home/life-science/cell-analysis/cell-analysis-learning-center/molecular-probes-school-of-fluorescence/imaging-basics/protocols-troubleshooting/protocols/functional-mitochondrial-staining.html]
- 41. Characterization of rhodamine-123 as a tracer dye for use ... [https://www.sigmaaldrich.com/ST/en/tech-docs/paper/282009?srsltid=AfmBOoocHox2BQspRXMhKSE5gVSmG9dEPZ5hoFf7TyMoHFQoS_dtKVay]
- 42. TMRM (TetraMethylRhodamine Methyl Ester) [https://www.potentiometricprobes.com/store/p/tmrm?srsltid=AfmBOooK9UyTsMsGjFnfJ_UduiJxzy44F8xiHHLe3VUCzkrIl8TthDxV]
- 43. Mitochondrial quality control mechanisms as molecular targets ... [https://pmc.ncbi.nlm.nih.gov/articles/PMC6283278/]
- 44. Mitochondrial quality control in human health and disease [https://mmrjournal.biomedcentral.com/articles/10.1186/s40779-024-00536-5]
- 45. Mitochondrial Quality Control and Cell Death [https://www.mdpi.com/1422-0067/26/22/11084]
- 46. Determination of Mitochondrial Membrane Potential and ... [https://pmc.ncbi.nlm.nih.gov/articles/PMC3143685/]
- 47. Spectrum [TMRM (Tetramethylrhodamine methyl ester)] [https://www.aatbio.com/fluorescence-excitation-emission-spectrum-graph-viewer/tmrm_tetramethylrhodamine_methyl_ester]
- 48. Mitochondria [https://www.stratech.co.uk/aat-bioquest/mitochondria/]
- 49. Rhodamine Staining Tips for Reliable Cell Imaging [https://probes.bocsci.com/resources/rhodamine-staining-protocols-tips-for-high-quality-and-reproducible-results.html]
- 50. Characterization of Rhodamine-123 as a Tracer Dye for ... [https://pmc.ncbi.nlm.nih.gov/articles/PMC3314654/]
- 51. In vivo multiphoton imaging of mitochondrial structure and ... [https://pmc.ncbi.nlm.nih.gov/articles/PMC4136483/]
- 52. Probes for Mitochondria—Section 12.2 [https://www.thermofisher.com/us/en/home/references/molecular-probes-the-handbook/probes-for-organelles/probes-for-mitochondria.html]
- 53. Comprehensive Guide to Mitochondrial Function Assays [https://www.elabscience.com/resources/cell-metabolism-technical-topics/1954?srsltid=AfmBOopjcF-ZaFPB-n_XEG6iEedNf_i5mwu_YIKLcntgjEsy48uD3jyM]
- 54. Overview of methods that determine mitochondrial function ... [https://www.sciencedirect.com/science/article/pii/S0026049525001696]
- 55. Fluorescence-Based Mitochondrial Function Assays [https://www.elabscience.com/resources/cell-metabolism/1958?srsltid=AfmBOorNWZebmrHMYkhO9i8M-xvHCYGiki-wpHAgitn2tbf9Kg9PJE16]
- 56. An Overview on Assay Methods to Quantify ROS and ... [https://www.mdpi.com/2076-2615/13/14/2300]
- 57. A method for assessing tissue respiration in anatomically ... [https://www.nature.com/articles/s41598-020-69867-2]
- 58. Unbiased millivolts assay of mitochondrial membrane ... [https://pmc.ncbi.nlm.nih.gov/articles/PMC9377305/]
- 59. Mitochondrial dysfunction mediated by ER-calcium ... [https://pmc.ncbi.nlm.nih.gov/articles/PMC12305934/]
- 60. Calculation of millivolt potentials from TMRM fluorescence [https://www.imageanalyst.net/millivolts-from-tmrm-and-flipr.html]
- 61. Comprehensive Guide to Mitochondrial Function Assays [https://www.elabscience.com/resources/cell-metabolism-technical-topics/1954?srsltid=AfmBOoqN85MnnYh3zt_DmaWwPwwaHasUSLN7V4vmWbC1ibrrpFb4oKOv]
- 62. A comparison of rhodamine 123 accumulation and efflux in ... [https://pubmed.ncbi.nlm.nih.gov/7999426/]
- 63. Mitochondrial Dysfunction in Aristolochic Acid I-Induced ... [https://www.mdpi.com/2076-3417/14/17/7961]