Western Blot Analysis of Apoptosis in Cancer Research: A Comprehensive Guide from Mechanisms to Clinical Translation
This article provides a comprehensive resource for researchers and drug development professionals on applying Western blotting to analyze apoptotic pathways in cancer.
Western Blot Analysis of Apoptosis in Cancer Research: A Comprehensive Guide from Mechanisms to Clinical Translation
Abstract
This article provides a comprehensive resource for researchers and drug development professionals on applying Western blotting to analyze apoptotic pathways in cancer. It covers the foundational biology of key apoptotic proteins, detailed methodological protocols for detection and quantification, advanced troubleshooting for common pitfalls, and strategies for validation within preclinical and biomarker development contexts. By integrating current market trends, which project the North American apoptosis assay market to reach USD 6.1 billion by 2034, with cutting-edge research and technical optimization, this guide supports the critical role of Western blotting in advancing targeted cancer therapies and personalized medicine.
The Role of Apoptosis in Cancer and Core Protein Targets for Western Blotting
Apoptosis, or programmed cell death, is a fundamental biological process essential for maintaining cellular balance by eliminating damaged, unnecessary, or potentially harmful cells in a controlled and organized manner [1]. Unlike necrosis, which is an uncontrolled, inflammatory form of cell death, apoptosis occurs without causing harm to surrounding tissue [1]. The dying cell is neatly packaged into small, membrane-bound fragments called apoptotic bodies, which are subsequently removed by immune cells [1]. In oncology, apoptosis represents a critical frontier because cancer development often involves the evasion of this natural cell death program, allowing damaged cells to survive and proliferate [1] [2]. Understanding and targeting apoptotic pathways has therefore become a central strategy in cancer drug development, with the goal of restoring the natural elimination of malignant cells.
Molecular Mechanisms of Apoptosis
Apoptosis proceeds through two primary signaling pathways: the extrinsic (death receptor) pathway and the intrinsic (mitochondrial) pathway [1]. Both pathways converge on the activation of a family of cysteine proteases known as caspases, which execute the cell death process through a proteolytic cascade [1] [2].
Key Apoptotic Markers and Their Significance
The molecular players in apoptosis serve as crucial detection markers for research and diagnostic purposes.
Table 1: Key Apoptosis Markers for Western Blot Analysis
| Marker Category | Specific Examples | Role in Apoptosis | Detection Significance |
|---|---|---|---|
| Caspases | Caspase-3, Caspase-7 (Executioners); Caspase-8 (Extrinsic); Caspase-9 (Intrinsic) | Executors of apoptotic cascade; cleave cellular substrates [1] | Presence of cleaved, active fragments indicates apoptotic commitment [1] |
| PARP | Cleaved PARP-1 | DNA repair enzyme; cleavage inactivates it and facilitates cell death [1] | Cleaved form is a reliable marker of ongoing apoptosis [1] |
| Bcl-2 Family | Bcl-2 (anti-apoptotic), Bax, Bak (pro-apoptotic) | Regulates mitochondrial membrane permeability [1] | Shift in balance toward pro-apoptotic proteins indicates activation of intrinsic pathway [1] |
| Plasma Membrane Markers | Phosphatidylserine (PS) externalization | Loss of membrane asymmetry is an early event [2] | Detected by Annexin V binding; used in flow cytometry [2] |
| Nuclear Markers | DNA fragmentation | Caspase-activated DNase (CAD) cleaves DNA [2] | Detected by DNA laddering or TUNEL assay [2] |
Visualizing Apoptotic Pathways
The following diagram illustrates the major signaling pathways that initiate and execute apoptosis, highlighting key markers detectable via western blot.
Diagram 1: Core Apoptosis Signaling Pathways. Key markers for western blot are highlighted in red (caspases) and green (downstream hallmarks).
Western Blot Analysis for Apoptosis Detection
Western blotting is a powerful, widely used technique for detecting apoptosis in cancer research due to its high specificity and ability to quantify protein levels and modifications across different experimental conditions [1]. It is appropriate for detecting the early, middle, and late stages of apoptosis by assessing changes in the expression and cleavage status of key apoptotic proteins [1].
Detailed Western Blot Protocol for Apoptosis
The following protocol provides a standardized methodology for detecting apoptotic markers via western blot.
Table 2: Key Research Reagent Solutions for Apoptosis Western Blot
| Reagent / Material | Function / Application | Example / Note |
|---|---|---|
| Primary Antibodies | Target-specific binding to apoptotic markers [1] | Anti-Cleaved Caspase-3, Anti-Cleaved PARP, Anti-Bax, Anti-Bcl-2 |
| Secondary Antibodies | Conjugated for detection; bind to primary antibodies [1] | HRP-conjugated for chemiluminescence |
| Apoptosis Antibody Cocktails | Pre-mixed antibodies for multiple markers [1] | Pro/p17-caspase-3, cleaved PARP1, muscle actin (e.g., ab136812) |
| Cell Lysis Buffer | Extract proteins from samples of interest [1] | Contains inhibitors to prevent protein degradation |
| Loading Control Antibodies | Normalize for protein loading variation [1] | β-actin, GAPDH |
Protocol Steps:
- Sample Preparation: Prepare cell lysates from treated and control samples. For apoptosis induction, common treatments include doxorubicin (0.1 µM) or staurosporine (0.5 µM) for 24 hours [3]. Perform protein quantification to ensure equal loading across all samples [1].
- SDS-PAGE: Separate the extracted proteins by size using SDS-polyacrylamide gel electrophoresis (SDS-PAGE) [1].
- Protein Transfer: Transfer the separated proteins from the gel onto a western blot membrane (typically PVDF or nitrocellulose) [1].
- Blocking: Incubate the membrane with a blocking solution (e.g., 5% non-fat milk or BSA in TBST) to prevent non-specific antibody binding [1].
- Primary Antibody Incubation: Probe the membrane with primary antibodies targeting the apoptotic markers of interest (e.g., cleaved caspases, PARP, Bcl-2 family proteins). Incubate overnight at 4°C with gentle agitation [1] [4].
- Washing and Secondary Antibody Incubation: Wash the membrane to remove unbound primary antibody, then incubate with an appropriate horseradish peroxidase (HRP)-conjugated secondary antibody [1].
- Detection and Visualization: Detect the protein bands using enhanced chemiluminescence (ECL) or fluorescent methods. Capture the signal using a digital imager [1].
- Data Analysis: Use densitometry software (e.g., ImageJ) to quantify band intensities [1] [4]. Normalize the signal of the target protein (e.g., cleaved caspase-3) to a housekeeping protein (e.g., β-actin or GAPDH) to account for loading differences [1].
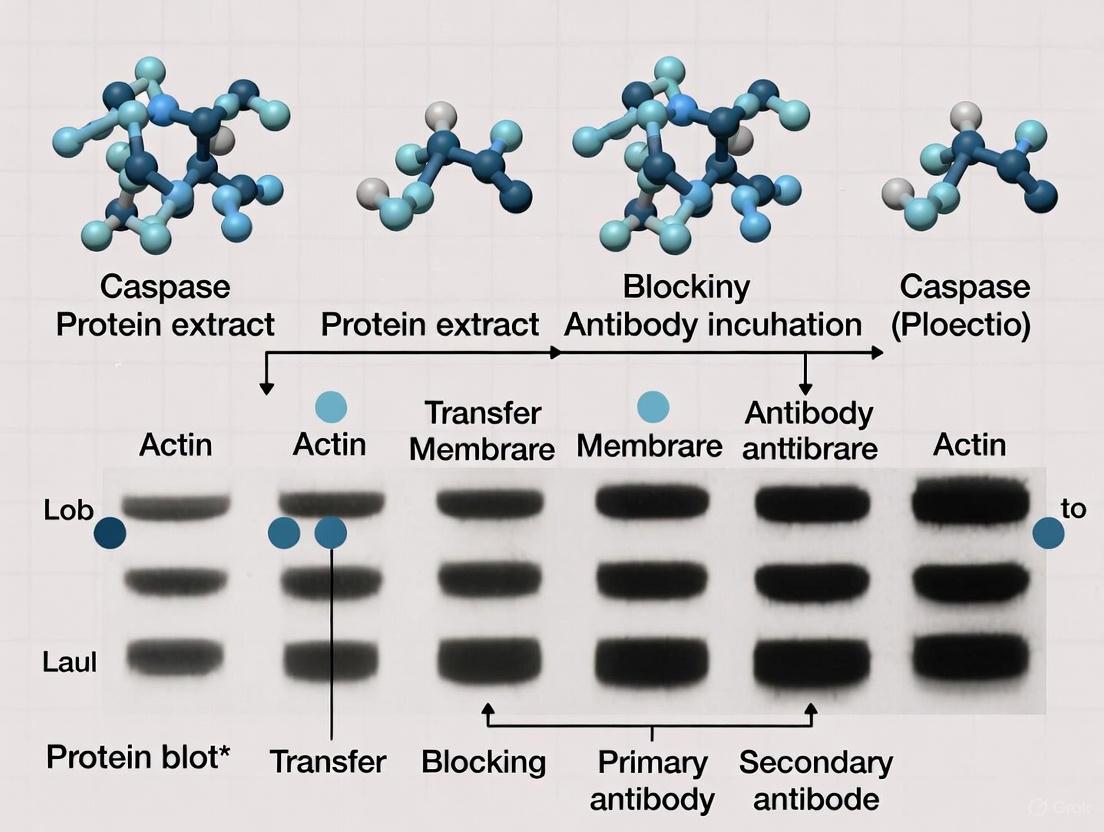
Workflow for Apoptosis Detection via Western Blot
The experimental process for analyzing apoptosis using western blot is outlined below.
Diagram 2: Western Blot Workflow for Apoptosis Detection.
Complementary Apoptosis Detection Methods
While western blotting is highly effective for confirming the presence and activation of specific apoptotic proteins, it is often used in conjunction with other techniques that provide complementary data, such as single-cell analysis or real-time kinetics.
Flow Cytometry-Based Apoptosis Assays
Flow cytometry is a high-throughput method for multiparameter analysis of apoptosis at the single-cell level [5]. Key applications include:
- Annexin V/Propidium Iodide (PI) Staining: Detects the externalization of phosphatidylserine (PS) on the outer leaflet of the plasma membrane, an early event in apoptosis. Annexin V binds to PS, while PI stains cells with compromised membrane integrity (a feature of late apoptosis and necrosis) [2] [5].
- Caspase Activity Assays: Uses fluorochrome-labeled inhibitors of caspases (FLICA) that covalently bind to active caspase enzymes, allowing for their detection by flow cytometry [5].
- Mitochondrial Membrane Potential (ΔΨm) Assessment: Uses potentiometric dyes like TMRM to detect the loss of mitochondrial membrane potential, an early event in the intrinsic apoptotic pathway [5].
- DNA Fragmentation Analysis (Sub-G1): Identifies apoptotic cells with fractional DNA content due to DNA cleavage, which appear as a distinct "sub-G1" population following cell cycle analysis [2] [5].
Advanced and Emerging Detection Technologies
Recent technological advances have provided new tools for more dynamic and label-free analysis of cell death.
- Quantitative Phase Imaging (QPI): A label-free technique that enables time-lapse observation of subtle changes in cell mass distribution, morphology, and density during apoptosis. It can distinguish between apoptosis (characterized by cell shrinkage and membrane blebbing) and lytic cell death (characterized by swelling and membrane rupture) [3].
- FRET-Based Live-Cell Imaging: Utilizes cells stably expressing genetically encoded FRET-based caspase sensors. Apoptosis is visualized by a loss of FRET upon caspase cleavage, while necrosis is identified by the loss of the fluorescent probe without FRET change [6].
Applications in Cancer Research and Drug Development
The detection and analysis of apoptosis, particularly through western blotting, play an indispensable role in several key areas of oncology research.
- Mechanistic Studies of Carcinogenesis: Analyzing apoptosis markers helps researchers understand the molecular alterations that allow cancer cells to survive and proliferate uncontrollably [1]. By identifying how specific apoptotic pathways are suppressed in different cancers, scientists can develop targeted therapies aimed at restoring these natural cell death processes [1].
- Therapeutic Drug Screening: In drug development, apoptosis western blotting is frequently used to evaluate the efficacy of pro-apoptotic compounds [1]. Assessing whether a novel therapeutic agent induces cleavage of caspases and PARP in target cancer cells is a fundamental step in determining its potential as a chemotherapeutic agent [1].
- Evaluation of Treatment Resistance: Many cancers develop resistance to treatment by upregulating anti-apoptotic proteins (e.g., Bcl-2) or downregulating pro-apoptotic factors. Western blot analysis of tumor samples before, during, and after treatment can provide insights into the mechanisms of drug resistance and guide combination therapies [1].
The meticulous analysis of pro-apoptotic proteins via Western blotting remains a cornerstone of molecular cancer research, providing critical insights into drug mechanisms, resistance pathways, and cellular fate. This application note details optimized protocols for the reliable detection of key apoptotic regulators—Bax, caspases, and p53—within the context of cancer biology. The guidance presented herein addresses common technical pitfalls and validation requirements to ensure data integrity, with a particular emphasis on antibody specificity and appropriate controls given recent findings questioning the reliability of widely used reagents [7]. The protocols are framed within the broader scope of apoptosis signaling, wherein Bax initiates mitochondrial outer membrane permeabilization (MOMP), leading to caspase activation and execution of cell death, while p53 acts as a critical upstream regulator of this pathway in response to cellular stress [8] [9] [10].
The Apoptotic Signaling Pathway: A Workflow for Detection
The core intrinsic apoptosis pathway involves sequential protein activation and modification, dictating a logical workflow for detection. The diagram below outlines these key steps and their interrelationships.
Protein-Specific Detection Protocols
Bax Detection: Emphasizing Specificity and Validation
Bax detection requires stringent controls due to documented issues with antibody specificity. A 2024 study demonstrated that the commonly used Santa Cruz Biotechnology (B-9) antibody produces false-positive signals in Bax/Bak-deficient cells, while the Cell Signaling Technology (CST) #2772 antibody accurately reflects Bax status [7]. Researchers must validate their antibodies using genetic knockout controls.
Optimized Western Blot Protocol for Bax:
- Antibody: CST Bax Antibody #2772 (Rabbit monoclonal) [8]
- Reactivity: Human, Mouse, Rat, Monkey [8]
- Dilution: 1:1000 in 5% BSA/TBST [8]
- Incubation: Overnight at 4°C with gentle agitation
- Expected Molecular Weight: ~20 kDa [8]
- Sample Preparation: Harvest cells in RIPA lysis buffer supplemented with protease inhibitors. Keep samples on ice throughout preparation. For mitochondrial fractionation, use digitonin-based extraction prior to lysis.
- Critical Validation Controls: Include Bax-knockout cell lines (e.g., HCT 116 Bax/Bak DKO) to confirm antibody specificity [7].
Caspase-3 Detection: Apoptotic and Non-Apoptotic Functions
Caspase-3 serves as a key executioner caspase, cleaving numerous substrates including CAD, which leads to DNA fragmentation during apoptosis [9]. Recent research also reveals non-apoptotic roles for caspase-3 in melanoma cell motility, indicating its complex regulation in cancer [11].
Optimized Western Blot Protocol for Caspase-3:
- Targets: Pro-caspase-3 (~35 kDa) and cleaved, active fragments (~17 kDa and ~12 kDa)
- Activation Stimulus: Treat cells with apoptotic inducers (e.g., 5-FU, oxaliplatin) for 4-24 hours [9]
- Key Substrate: Monitor CAD cleavage at Asp1371 as confirmation of caspase-3 activity [9]
- Sample Preparation: Use standard RIPA lysis buffer. Avoid over-confluent cultures to minimize baseline activation.
- Technical Note: For non-apoptotic function studies, subcellular fractionation may be necessary to detect cytoskeleton-associated caspase-3 [11].
p53 Detection: Understanding Expression Dynamics in Cancer
p53 expression analysis requires careful interpretation, as its levels and mutational status vary significantly with cancer stage and type. In breast cancer, p53 expression is minimal in stage 1 but significantly upregulated in advanced stages (stages 2-4) [10]. Mutant p53 often accumulates to high levels, losing its tumor-suppressive function while potentially gaining oncogenic properties [10] [12].
Optimized Western Blot Protocol for p53:
- Expected Molecular Weight: ~53 kDa
- Stabilization: p53 protein stability can be modulated by sodium butyrate (NaB) treatment, which induces acetylation [12]
- Sample Preparation: Include phosphatase and HDAC inhibitors (e.g., sodium butyrate) in lysis buffer to preserve post-translational modifications
- Interpretation Note: Correlate p53 levels with known mutational status, as mutant forms often show stabilized expression without functional activity
Research Reagent Solutions
The table below summarizes essential reagents and their applications for apoptosis protein detection.
Table 1: Key Research Reagents for Apoptosis Protein Detection
| Reagent | Specific Product / Example | Application & Function |
|---|---|---|
| Bax Antibody | Cell Signaling Technology #2772 [8] | Specific detection of total Bax protein by Western blot; does not cross-react with other Bcl-2 family members |
| p53-Deficient Cell Line | HCT 116 p53−/− [12] | Essential control for p53-specific signaling and antibody validation |
| Bax/Bak-Deficient Cell Line | HCT 116 Bax/Bak DKO [7] | Critical negative control for validating Bax antibody specificity |
| Caspase Substrate | Recombinant CAD protein [9] | Functional assay for caspase-3 activity via cleavage at Asp1371 |
| HDAC Inhibitor | Sodium Butyrate (NaB) [12] | Stabilizes p53 protein through acetylation, enhancing detection |
| Apoptosis Inducer | 5-Fluorouracil (5-FU) [9] | Positive control stimulus for activating Bax, caspases, and p53 |
Quantitative Data in Apoptosis Protein Analysis
The table below compiles key quantitative findings from recent literature to inform experimental design and interpretation.
Table 2: Quantitative Data on Apoptosis Protein Expression and Function
| Protein | Experimental Context | Key Quantitative Finding | Significance |
|---|---|---|---|
| p53 | Breast cancer stages [10] | Expression: Stage 1 (undetectable), Stages 2-3 (high), Stage 4 (highest) (P < 0.001) | Correlates with tumor aggressiveness |
| p53 | Patient age in breast cancer [10] | Patients ≥40 years had higher expression than those <40 years (P < 0.001) | Indicates age-related expression differences |
| CAD | Caspase-3 cleavage site [9] | Cleavage at Asp1371 required for CAD degradation and apoptosis execution | Identifies specific caspase-3 substrate site |
| Bax | Antibody comparison [7] | CST #2772 showed specific detection; Santa Cruz B-9 showed false positives in KO cells | Highlights critical reagent validation need |
| Caspase-3 | Melanoma expression [11] | High expression in metastatic vs. primary tumors; only 2% mutation rate in COSMIC database | Suggests non-apoptotic functions in metastasis |
Troubleshooting and Technical Considerations
Antibody Validation and Specificity Controls
The critical importance of antibody validation cannot be overstated. Research indicates that a widely used Bax antibody (Santa Cruz B-9) produces false-positive signals, potentially compromising data from over 1,400 publications [7]. Essential validation strategies include:
- Genetic Knockout Controls: Utilize isogenic Bax/Bak-deficient cell lines (e.g., HCT 116 DKO) to confirm signal specificity [7]
- Multiple Antibody Comparison: Compare signals across different antibody clones and vendors
- siRNA Knockdown: Confirm reduced signal with targeted gene silencing [7]
Optimizing Protein Extraction and Stability
Different apoptotic proteins require specific handling conditions:
- Bax: This protein is aggregation-prone; use fresh samples and avoid repeated freeze-thaw cycles. For functional studies, follow optimized purification protocols to maintain monomeric state [13]
- p53: Include HDAC inhibitors (e.g., sodium butyrate) in lysis buffer to stabilize p53 through acetylation [12]
- Caspases: Process samples quickly after apoptosis induction to capture transient activation states
Interpreting Complex Expression Patterns
Protein expression must be interpreted within biological context:
- p53: High expression may indicate mutation and loss of function, not necessarily activation [10]
- Caspase-3: High expression in certain cancers (e.g., melanoma) may reflect non-apoptotic functions in cell motility [11]
- Bax: Monitor oligomerization status and subcellular localization in addition to total expression
Reliable detection of Bax, caspases, and p53 by Western blot requires meticulous protocol optimization and rigorous validation controls. The methods outlined in this application note provide a framework for generating reproducible, high-quality data in apoptosis research. Particular attention should be paid to antibody selection and validation, as improperly validated reagents can compromise experimental conclusions. As research continues to reveal novel non-apoptotic functions for traditional cell death regulators and context-dependent expression patterns, these optimized protocols will support researchers in accurately interrogating the complex roles of these proteins in cancer biology and therapeutic response.
A fundamental hallmark of cancer is the ability of malignant cells to evade programmed cell death, or apoptosis. The B-cell lymphoma 2 (Bcl-2) protein serves as the founding and most characterized anti-apoptotic regulator within this family, first discovered in 1984 as the gene involved in the t(14;18) chromosomal translocation found in follicular lymphoma [14]. This translocation results in overexpression of Bcl-2, which promotes tumorigenesis not by enhancing cellular proliferation but by inappropriately extending cellular survival—representing the first example of an oncogene that functions by inhibiting cell death [14] [15]. The Bcl-2 protein family encompasses over 20 proteins that share Bcl-2 homology (BH) domains, structurally classified into three functional subgroups: multi-domain anti-apoptotic proteins (including Bcl-2, Bcl-xL, MCL-1, Bcl-w, BFL-1, and Bcl-B), multi-domain pro-apoptotic effector proteins (BAK, BAX, and BOK), and BH3-only pro-apoptotic proteins (BID, BIM, BAD, PUMA, NOXA, and others) [16] [14]. The critical balance between these pro- and anti-apoptotic members determines cellular fate, with tumor cells frequently "addicted" to high levels of anti-apoptotic proteins for their survival [15]. This dependency makes anti-apoptotic Bcl-2 family proteins, particularly Bcl-2 itself, attractive therapeutic targets in oncology [16] [14] [15].
The Molecular Framework of Bcl-2 Family Regulation
Structural Characteristics and Functional Domains
Bcl-2 family proteins are characterized by their globular α-helical structure and the presence of up to four conserved BCL-2 homology (BH) domains [14]. Anti-apoptotic proteins like Bcl-2 typically contain four BH domains (BH1-BH4), which form a hydrophobic surface groove that serves as the primary binding site for the BH3 domains of pro-apoptotic family members [16] [14]. The BH4 domain is particularly crucial for the anti-apoptotic function of Bcl-2, as its deletion results in complete loss of survival function and can even produce a pro-apoptotic mutant [16]. The BH3 domain serves as the essential structural motif for protein-protein interactions within the family, enabling the formation of both heterodimers and homodimers that regulate apoptotic signaling [16] [15]. Additionally, most Bcl-2 family proteins contain a C-terminal transmembrane domain that anchors them to the outer mitochondrial membrane (OMM), as well as the endoplasmic reticulum (ER) and nuclear envelope, positioning them strategically to regulate apoptotic signaling [14].
Mechanisms of Apoptotic Regulation
The canonical function of anti-apoptotic Bcl-2 proteins centers on maintaining mitochondrial outer membrane integrity and preventing mitochondrial outer membrane permeabilization (MOMP) [14]. During MOMP, pro-apoptotic proteins like BAX and BAK form oligomeric pores in the OMM, facilitating the release of cytochrome c and other apoptotic factors from the mitochondrial intermembrane space into the cytosol [17]. Once cytosolic, cytochrome c initiates formation of the apoptosome complex with Apaf-1 and procaspase-9, triggering activation of the caspase cascade and executing cell death [17] [14]. Anti-apoptotic Bcl-2 proteins prevent this process by directly binding and sequestering activated BH3-only proteins and pro-apoptotic effectors like BAX and BAK, thereby preserving mitochondrial integrity [16] [14]. Beyond this mitochondrial function, Bcl-2 also localizes to the ER where it modulates calcium homeostasis and communicates with mitochondrial signaling pathways through mitochondria-associated membranes (MAMs) [14] [18].
Table 1: Core Anti-Apoptotic Bcl-2 Family Proteins
| Protein Name | Molecular Weight | Structural Domains | Primary Functions |
|---|---|---|---|
| Bcl-2 | 26 kDa | BH1, BH2, BH3, BH4 | Inhibits cytochrome c release; regulates Ca2+ signaling; non-canonical roles in cancer progression |
| Bcl-xL | 30 kDa | BH1, BH2, BH3, BH4 | Promotes cell survival; maintains mitochondrial integrity; implicated in therapy resistance |
| MCL-1 | 37 kDa | BH1, BH2, BH3 | Short half-life; rapid response to apoptotic stimuli; essential for embryonic development |
| Bcl-w | 18 kDa | BH1, BH2, BH3, BH4 | Supports neuronal and testicular cell survival; contributes to chemoresistance |
| BFL-1 | 21 kDa | BH1, BH3 | Regulated by NF-κB; important in hematopoietic cells and melanoma |
| Bcl-B | 21 kDa | BH1, BH2, BH3, BH4 | Unique binding profile; weak anti-apoptotic activity; tissue-specific expression |
Western Blot Analysis of Bcl-2: Technical Approaches
Sample Preparation and Optimization
Successful detection of Bcl-2 via western blot requires careful attention to protein sample preparation to preserve protein integrity, maintain abundance, and fully expose antigenic epitopes [19]. Before experimentation, researchers should verify target protein expression in their model systems using databases like BioGPS or Protein Atlas, noting that Bcl-2 demonstrates highly variable expression across different cell lines [19]. For samples with low endogenous Bcl-2 expression, overexpression systems or chemical induction may be necessary to achieve detectable levels [19]. Protein extraction should utilize appropriate lysis buffers containing protease and phosphatase inhibitors to prevent degradation of sensitive epitopes and maintain post-translational modifications that may regulate Bcl-2 function [1]. Following extraction, accurate protein quantification using colorimetric assays (e.g., BCA assay) ensures equal loading across samples, a critical prerequisite for quantitative comparisons [20] [1].
Electrophoresis and Transfer Conditions
For optimal separation of the 26 kDa Bcl-2 protein, standard SDS-PAGE protocols with appropriate percentage gels (typically 12-15%) are recommended [19] [1]. Following electrophoresis, proteins must be efficiently transferred to membranes for immunodetection. For Bcl-2 analysis, wet transfer systems maintained at 4°C are preferred, with transfer conditions of constant voltage (70V) for 30 minutes to 3 hours depending on protein size and gel thickness [19]. Due to its relatively low molecular weight, transfer duration for Bcl-2 can be kept toward the shorter end of this spectrum [19]. The transfer buffer may be modified by adding 0.1% SDS and reducing methanol concentration to 5-10% to enhance efficiency, particularly for hydrophobic membrane proteins like Bcl-2 that contains a transmembrane domain [19].
Immunodetection and Antibody Selection
Following transfer, membranes should be blocked with 5% skimmed milk in TBST for 1 hour at room temperature to prevent non-specific antibody binding [19]. Critical to successful Bcl-2 detection is the selection of appropriately validated antibodies. Researchers should prioritize antibodies specifically verified for western blot application and preferably supported by citation in the literature [19] [21]. Key validation parameters include confirmation of target specificity through knockout/knockdown controls and recognition of the correct molecular weight (26 kDa for Bcl-2) [19] [21]. For Bcl-2 detection, monoclonal antibody #15071 (Cell Signaling Technology) has demonstrated reliability, with recommended dilutions of 1:1000 for western blot [21]. This antibody is raised against a synthetic peptide corresponding to residues surrounding Gly47 of human Bcl-2 protein and detects endogenous levels of total Bcl-2 [21]. Following primary antibody incubation, membranes should be washed thoroughly with TBST (3 × 5 minutes) before application of species-matched HRP-conjugated secondary antibodies, typically diluted in 5% skimmed milk or TBST [19].
Diagram 1: Western Blot Workflow for Bcl-2 Detection. This diagram outlines the key procedural stages for successful Bcl-2 analysis, highlighting critical optimization points at each phase.
Troubleshooting and Quantitative Analysis
Common challenges in Bcl-2 detection include weak or absent signals, high background, and non-specific bands. For low abundance targets, enhancing sensitivity may require increased protein loading, extended primary antibody incubation (overnight at 4°C), or higher affinity detection systems [19] [1]. Conversely, excessive background can be addressed by optimizing blocking conditions, increasing wash stringency (e.g., extended wash times or mild detergent concentrations), and titrating antibody concentrations [1]. For quantitative analysis, researchers should implement ratiometric normalization strategies comparing Bcl-2 signal intensity to housekeeping proteins such as β-actin, GAPDH, or α-tubulin to account for potential loading and transfer variations [20] [1]. Densitometry analysis using software such as ImageJ enables quantification of band intensities, with results expressed as relative intensity ratios (Bcl-2:loading control) to facilitate comparisons across experimental conditions [1]. True quantitative western blotting requires validation of the combined linear range for both target and reference proteins to ensure measurements fall within the dynamic range of detection [20].
The Scientist's Toolkit: Essential Reagents for Bcl-2 Analysis
Table 2: Key Research Reagents for Bcl-2 Western Blot Analysis
| Reagent Category | Specific Product Examples | Application Purpose | Technical Notes |
|---|---|---|---|
| Bcl-2 Primary Antibodies | Bcl-2 (124) Mouse mAb #15071 (CST); FNab00840 (Monoclonal) [21] [19] | Specific detection of endogenous Bcl-2 protein | Validate for WB; check species reactivity; confirm 26kDa band |
| Positive Control Lysates | Bcl-2 overexpression cell lysates; follicular lymphoma samples [19] [21] | Assay validation and troubleshooting | Ensure high endogenous Bcl-2 expression |
| Loading Controls | β-actin, GAPDH, α-tubulin antibodies [1] | Normalization of protein loading and transfer | Select based on expression stability in model system |
| Secondary Antibodies | HRP-conjugated anti-mouse/anti-rabbit IgG [19] | Signal amplification and detection | Optimize dilution to minimize background |
| Detection Systems | Enhanced chemiluminescent substrates [1] | Visualization of target proteins | Linear range determination critical for quantification |
| Apoptosis Inducers/Inhibitors | Venetoclax (BCL-2 inhibitor); Staurosporine [14] [15] | Experimental controls for functional assays | Verify apoptosis induction via PARP cleavage/caspase activation |
Bcl-2 as a Therapeutic Target in Oncology
BH3-Mimetics: Mechanism and Clinical Application
The development of BH3-mimetic compounds represents a paradigm shift in targeting anti-apoptotic proteins for cancer therapy. These small molecules structurally mimic the BH3 domain of pro-apoptotic proteins, competitively binding to the hydrophobic groove of anti-apoptotic Bcl-2 family members and displacing sequestered pro-apoptotic partners to initiate mitochondrial apoptosis [14] [15]. Venetoclax (ABT-199), the first FDA-approved selective BCL-2 inhibitor, has demonstrated remarkable efficacy in hematologic malignancies including chronic lymphocytic leukemia (CLL) and acute myeloid leukemia (AML) [16] [14]. The clinical success of venetoclax has prompted development of next-generation BH3-mimetics such as sonrotoclax and lisaftoclax, currently under clinical evaluation both as monotherapies and in combination regimens [14]. However, targeting other anti-apoptotic family members like BCL-XL and MCL-1 has proven more challenging due to on-target toxicities, including thrombocytopenia for BCL-XL inhibitors and cardiac toxicities for MCL-1 inhibitors [14]. Innovative approaches such as PROTACs (proteolysis targeting chimeras) and antibody-drug conjugates (ADCs) are being explored to achieve tumor-specific inhibition while minimizing systemic toxicity [14].
Resistance Mechanisms and Combination Strategies
Despite initial efficacy, resistance to BH3-mimetic therapy emerges through various mechanisms. Specific point mutations in BCL-2 (e.g., F104L and F104C) reduce drug binding affinity without altering interactions with pro-apoptotic partners, enabling the mutant protein to maintain pro-survival function [16]. Additional resistance mechanisms include upregulation of alternative anti-apoptotic proteins (particularly MCL-1 or BCL-XL), metabolic adaptations, and failure to execute apoptotic programs downstream of BCL-2 inhibition [14] [15]. To overcome resistance, rational combination strategies have been developed, including venetoclax with hypomethylating agents in AML, anti-CD20 monoclonal antibodies in CLL, and novel targeted therapies [14]. In the context of cellular therapies, BH3-mimetics are being explored to sensitize tumor cells to CAR-T-cell-mediated apoptosis by lowering the threshold for mitochondrial apoptosis activation [17]. Western blot analysis provides a critical pharmacodynamic tool in these therapeutic contexts, enabling monitoring of Bcl-2 expression, confirmation of target engagement, and detection of compensatory resistance mechanisms.
Diagram 2: Bcl-2 Signaling Pathway and BH3-Mimetic Mechanism. This diagram illustrates the intrinsic apoptotic pathway regulated by Bcl-2 family proteins and the targeted inhibition by BH3-mimetic therapeutics that promote apoptosis initiation.
Advanced Research Applications and Future Directions
Non-Canonical Functions of Bcl-2 in Cancer Biology
Beyond its established role in apoptosis inhibition, emerging research has revealed non-canonical functions of Bcl-2 that contribute to tumor progression. Recent studies demonstrate that Bcl-2 regulates the Hippo signaling pathway in cancer cells, influencing YAP/TAZ transcriptional activity and promoting cell migration, adaptation to high stiffness culture conditions, and fibroblast activation in the tumor microenvironment [22]. This non-canonical pathway operates independently of Bcl-2's anti-apoptotic function and suggests broader roles in cancer biology [22]. Additionally, Bcl-2 interacts with mitochondrial protein SLIRP to regulate mitochondrial transcript levels and influences cellular metabolism through modulation of calcium signaling at endoplasmic reticulum-mitochondria contact sites [14] [22]. These novel functions expand the therapeutic implications of Bcl-2 targeting beyond apoptosis restoration and may explain some off-target effects observed with BH3-mimetic therapies.
Novel Targeting Approaches and Research Tools
Future directions in Bcl-2 research include the development of degradation-based strategies such as PROTACs (proteolysis targeting chimeras) that catalytically remove target proteins rather than merely inhibiting them, potentially overcoming resistance mechanisms associated with point mutations [14] [15]. Additionally, advanced research tools including BH3 profiling assays that measure mitochondrial priming to determine apoptotic susceptibility provide functional readouts beyond simple protein expression levels [14]. For comprehensive apoptosis analysis, researchers are increasingly utilizing multiplexed western blot approaches with antibody cocktails that simultaneously detect multiple Bcl-2 family members and apoptotic markers (e.g., caspases, PARP cleavage) to obtain a more complete picture of apoptotic signaling networks [1]. These technological advances, combined with more sophisticated disease models, will continue to refine our understanding of Bcl-2 biology and therapeutic targeting in cancer.
The global apoptosis assay market is experiencing significant growth, a trend profoundly interlinked with the escalating demands of modern cancer research. This expansion is primarily driven by the rising global incidence of cancer, the pivot towards personalized medicine, and critical advancements in therapeutic development that target apoptotic pathways to overcome drug resistance [23] [24] [25]. Within this context, western blotting remains a cornerstone technique, providing researchers and drug development professionals with a specific and quantitative method to validate apoptosis induction and dissect its intricate molecular mechanisms in response to novel anti-cancer therapies [1].
This application note details the quantitative market forces fueling this growth and provides a detailed western blot protocol for detecting key apoptotic markers in cancer cells, enabling researchers to directly engage with this evolving landscape.
Quantitative Analysis of Market Drivers
The consistent growth of the apoptosis assay market is supported by powerful, quantifiable drivers rooted in the needs of oncology research and development. The table below summarizes the primary market forces and their impact.
Table 1: Key Drivers of the Apoptosis Assay Market in Cancer Research
| Market Driver | Quantitative Impact | Direct Link to Cancer Research Needs |
|---|---|---|
| Rising Global Cancer Burden | Nearly 10 million cancer-related deaths globally in 2020; projected to reach 29.9 million new cases by 2040 [24]. | Creates an urgent need to understand cell death mechanisms for therapeutic development. |
| Shift to Personalized Medicine | Apoptosis assays are critical for profiling patient-specific cell death signatures to guide therapy [25]. | Requires tools to determine if a patient's tumor cells undergo apoptosis in response to a specific drug. |
| Advancements in Apoptosis-Targeted Therapeutics | Clinical pipelines actively target BCL-2, IAP, and MDM2-p53 regulators [26] [25]. | Drives demand for precise analytics to measure drug efficacy and pathway engagement in clinical trials. |
| Growing Funding for R&D | NIH grants such as the USD 4.9 million "RNA Modifications Driving Oncogenesis" initiative prioritize apoptosis pathway mapping [25]. | Increases laboratory adoption of multiplex apoptosis assays in basic and translational research. |
| Need to Overcome Therapy Resistance | Evasion of apoptosis is a hallmark of cancer and a leading cause of chemoresistance [26] [24]. | Makes apoptosis detection essential for screening compounds that can re-sensitize resistant tumors. |
Western Blot Analysis of Apoptosis in Cancer Cells
Western blotting is a fundamental method for detecting apoptosis in cancer research, offering high specificity and the ability to monitor multiple markers within the cell death cascade [1]. The following protocol is designed to analyze key apoptotic proteins in cell lysates.
Key Apoptotic Markers and Their Significance
Table 2: Essential Apoptosis Markers for Western Blot Analysis in Cancer Research
| Target Protein | Role in Apoptosis | Significance in Cancer Research | Expected Band Pattern |
|---|---|---|---|
| Caspase-3 | Executioner caspase; cleaves multiple cellular substrates [1]. | A primary indicator of apoptotic commitment; activated by both intrinsic and extrinsic pathways [1]. | Cleavage: Pro-form (~35 kDa) to active fragments (~17, ~19 kDa). |
| PARP | DNA repair enzyme; cleaved by executioner caspases [1]. | A classic marker of apoptosis; cleavage inactivates DNA repair, promoting cell death [1]. | Cleavage: Full-length (~116 kDa) to cleaved fragment (~89 kDa). |
| Caspase-9 | Initiator caspase for the intrinsic (mitochondrial) pathway [1] [24]. | Indicates apoptosis triggered by cellular stress, DNA damage, or chemotherapeutic agents [24]. | Cleavage: Pro-form (~46 kDa) to active fragment (~37 kDa). |
| Caspase-8 | Initiator caspase for the extrinsic (death receptor) pathway [1]. | Signals apoptosis initiated by immune cells or therapeutic death receptor agonists [26]. | Cleavage: Pro-form (~55 kDa) to active fragments (~43, ~18 kDa). |
| Bcl-2 Family | Regulators of mitochondrial outer membrane permeabilization (MOMP) [1] [24]. | Imbalance (e.g., high Bcl-2, low Bax) confers resistance; targeted by BH3 mimetics [26] [24]. | Shift: Changes in expression levels of anti-apoptotic (e.g., Bcl-2) and pro-apoptotic (e.g., Bax) proteins. |
Detailed Western Blot Protocol for Apoptosis Detection
I. Sample Preparation
- Cell Lysis: Harvest cancer cells after treatment with the agent of interest (e.g., chemotherapeutic compound). Lyse cells using a RIPA buffer supplemented with protease and phosphatase inhibitors. Keep samples on ice throughout [1] [27].
- Protein Quantification: Determine protein concentration of each lysate using a colorimetric assay (e.g., BCA assay). Normalize all samples to the same concentration with lysis buffer [1].
- Sample Preparation: Mix normalized lysates with 4X Laemmli sample buffer. Denature samples at 95-100°C for 5 minutes [1].
II. Gel Electrophoresis and Transfer
- SDS-PAGE: Load 20-40 µg of protein per well on a 4-20% gradient polyacrylamide gel. Include a pre-stained protein molecular weight marker. Run gel at constant voltage until the dye front reaches the bottom [1].
- Protein Transfer: Transfer proteins from the gel to a PVDF or nitrocellulose membrane using a wet or semi-dry transfer system [1].
III. Immunoblotting
- Blocking: Incubate the membrane in 5% non-fat milk or BSA in TBST for 1 hour at room temperature to block non-specific binding [1].
- Primary Antibody Incubation: Dilute primary antibodies in blocking solution according to the manufacturer's datasheet. Incubate the membrane with the antibody solution overnight at 4°C with gentle agitation. See Table 3 for key reagents [1] [27].
- Washing: Wash membrane 3 times for 5 minutes each with TBST.
- Secondary Antibody Incubation: Incubate membrane with an HRP-conjugated secondary antibody (e.g., anti-rabbit IgG) diluted in blocking solution for 1 hour at room temperature [1].
- Washing: Repeat washing step as above.
IV. Detection and Analysis
- Detection: Develop the blot using a chemiluminescent substrate and image with a digital imager or X-ray film [1] [28].
- Analysis: Use quantification software (e.g., ImageJ, iBright Analysis Software, Phoretix 1D) to measure band intensity [1] [29] [28]. Normalize the intensity of the target protein band (e.g., cleaved caspase-3) to a housekeeping protein (e.g., β-actin or GAPDH) from the same sample [1].
The Scientist's Toolkit: Key Research Reagent Solutions
Table 3: Essential Materials for Apoptosis Western Blotting
| Item | Function / Utility | Example / Note |
|---|---|---|
| Control Cell Extracts | Pre-treated lysates providing positive (induced) and negative (untreated) controls for apoptotic markers [27]. | Jurkat Apoptosis Cell Extracts (etoposide); validates antibody performance and sample preparation [27]. |
| Antibody Cocktails | Pre-mixed solutions of multiple antibodies targeting key apoptosis proteins [1]. | Pro/p17-caspase-3, cleaved PARP1 cocktails; streamline workflow and enhance detection across markers [1]. |
| Phospho-Specific & Cleavage-Specific Antibodies | Antibodies that specifically recognize the activated (phosphorylated or cleaved) form of a protein [1] [27]. | Essential for detecting Cleaved Caspase-3 (Asp175) and Cleaved PARP (Asp214) to confirm active apoptosis [1]. |
| Chemiluminescent Substrate | Enzyme substrate that produces light upon reaction with HRP, enabling band visualization [1]. | Critical for sensitive detection of low-abundance proteins; choice influences signal-to-noise ratio. |
| Image Quantification Software | Software for objective, quantitative analysis of band intensity and molecular weight [1] [29] [28]. | Tools like Phoretix 1D or iBright Analysis Software enable densitometry and normalization [29] [28]. |
Apoptosis Signaling Pathways
The core apoptotic pathways in cancer cells are frequently dysregulated, making them a major focus of therapeutic intervention. Western blotting allows researchers to determine which pathway is activated by a given treatment.
Experimental Workflow for Apoptosis Detection
A standardized workflow is critical for generating reliable and reproducible data when investigating apoptosis in cancer models.
The expanding apoptosis assay market is a direct reflection of the critical need to understand and quantify cell death in cancer research. The integration of robust techniques like western blotting, which allows for the specific detection of key apoptotic markers, is fundamental to advancing our understanding of drug mechanisms, overcoming therapy resistance, and ultimately contributing to the development of more effective, personalized cancer treatments.
Apoptosis, or programmed cell death, is a fundamental process essential for maintaining tissue homeostasis by eliminating damaged, infected, or unnecessary cells in a controlled manner [1]. Its dysregulation is a recognized hallmark of cancer, enabling tumor cells to survive beyond their normal lifespan, resist death signals, and ultimately compromise the effectiveness of anti-cancer therapies [30] [31]. In the physiological state, apoptosis occurs through two primary signaling pathways: the extrinsic (death receptor-mediated) pathway and the intrinsic (mitochondrial) pathway [1] [30]. The extrinsic pathway is triggered by the binding of specific ligands (e.g., TNFα, FasL, TRAIL) to cell surface death receptors, leading to the activation of initiator caspase-8. The intrinsic pathway is activated by cellular stressors—such as DNA damage, oxidative stress, or cytotoxic drugs—and is regulated by the B-cell lymphoma 2 (Bcl-2) family of proteins, leading to mitochondrial outer membrane permeabilization and activation of initiator caspase-9 [30] [32]. Both pathways converge on the activation of executioner caspases (e.g., caspase-3 and -7), which dismantle the cell through the cleavage of key structural and functional proteins [1] [33].
In many cancers, including squamous cell carcinoma of the head and neck (SCCHN) and breast cancer, apoptotic pathways are abnormally restrained, providing a critical survival advantage to malignant cells [34] [31]. Key resistance mechanisms include the overexpression of anti-apoptotic proteins (such as Bcl-2 family members and Inhibitor of Apoptosis Proteins/IAPs) and the downregulation or mutation of pro-apoptotic proteins (like Bax, caspase-8, or p53) [30] [33] [31]. This evasion of cell death is a major limiting factor for the success of conventional chemotherapy and radiotherapy, as the primary goal of many anti-cancer treatments is to induce tumor cell death [30] [31]. Consequently, a deep understanding of apoptotic protein expression and its connection to therapy resistance is paramount for developing more effective cancer treatments and overcoming the challenge of chemoresistance.
Key Apoptotic Proteins and Their Dysregulation in Cancer
Western blot analysis serves as a powerful tool for detecting specific protein markers of apoptosis, providing insights into the expression levels and functional status of key players in cell death pathways. The table below summarizes the primary apoptotic proteins, their normal functions, and how their dysregulation contributes to cancer pathogenesis and therapy resistance.
Table 1: Key Apoptotic Proteins, Their Functions, and Roles in Cancer
| Protein / Marker | Primary Role in Apoptosis | Normal Function | Dysregulation in Cancer | Association with Therapy Resistance |
|---|---|---|---|---|
| Caspase-3 | Executioner Caspase | Cleaves cellular substrates (e.g., PARP), leading to cell dismantling. Inactive pro-form is cleaved to active fragments during apoptosis [1]. | Reduced activation (cleavage) despite death signals [33]. | Failure to execute the final stages of cell death upon chemo-/radiotherapy [31]. |
| PARP | DNA Repair Enzyme | Involved in DNA repair. Cleaved by executioner caspases (e.g., caspase-3) during apoptosis, inactivating it [1]. | Loss of cleaved PARP fragment, indicating blocked caspase activity [1]. | Tumor cells avoid DNA fragmentation and cell death, leading to treatment failure [1]. |
| Bcl-2 Family | Regulators of Intrinsic Pathway | Includes anti-apoptotic (e.g., Bcl-2, Bcl-xL) and pro-apoptotic (e.g., Bax, Bak) members. Balance determines cell fate [30]. | Overexpression of anti-apoptotic members (Bcl-2) and/or downregulation of pro-apoptotic members (Bax) [30] [34]. | Shifts balance towards survival, preventing mitochondrial apoptosis initiation by therapy [30] [31]. |
| Inhibitors of Apoptosis (IAPs) | Caspase Inhibitors | Regulate apoptosis and immune signaling by inhibiting caspase activity [31]. | Overexpression (e.g., survivin, XIAP) [33] [31]. | Directly block caspase activation, rendering chemo- and radiotherapy ineffective [31]. |
| p53 | Tumor Suppressor | DNA damage sensor; can induce cell cycle arrest or apoptosis by transcriptionally activating pro-apoptotic proteins like PUMA [35]. | Frequent mutation or functional inactivation [33]. | Eliminates a key pathway for stress-induced apoptosis, a common resistance mechanism [35]. |
The quantitative measurement of these proteins via western blot can reveal critical shifts in the apoptotic balance. For instance, a study investigating the synergistic effects of Thymoquinone (TQ) and Methotrexate (MTX) in MCF-7 breast cancer cells demonstrated that the combination therapy significantly increased the pro-apoptotic to anti-apoptotic protein ratio (Bax/Bcl-2) and enhanced caspase-3 activation, correlating with a drastic reduction in cell viability [34]. Similarly, research on nanoparticles showed that treatments with CuO, ZnO, and CdSe/ZnS quantum dots induced considerable phosphorylation of p53 at the serine 15 residue in HeLa cells, indicating activation of the DNA damage response and the intrinsic apoptotic pathway [35]. These findings underscore how western blot analysis can directly connect changes in protein expression to therapeutic efficacy and mechanistic understanding.
Advanced Western Blot Protocol for Apoptosis Detection
This protocol provides a detailed methodology for detecting key apoptotic proteins in cancer cell lines using western blotting, optimized for sensitivity and quantitative accuracy.
Sample Preparation and Protein Quantification
- Cell Lysis: Harvest and lyse cells using an appropriate ice-cold lysis buffer, such as RIPA buffer, supplemented with protease and phosphatase inhibitors. For proteins located in membrane-bound compartments (e.g., mitochondrial Bcl-2 family members), a harsher, SDS-containing buffer may be necessary for effective solubilization [36].
- Protein Denaturation: Mix cell lysates with a Laemmli sample buffer containing SDS and a reducing agent (e.g., DTT or β-mercaptoethanol). Heat samples at 95°C for 5 minutes to fully denature proteins, unless specific proteins are known to aggregate at this temperature, in which case a lower heating temperature (e.g., 70°C) should be tested [36].
- Protein Quantification: Prior to adding denaturing buffers, determine protein concentration using an assay compatible with your lysis buffer, such as a BCA assay. This is a critical step for ensuring equal loading across gels, which is a prerequisite for accurate quantification [1] [36].
Gel Electrophoresis and Protein Transfer
- Gel Selection: Based on the molecular weights of your target apoptotic proteins, select an appropriate polyacrylamide gel. For analyzing multiple proteins of varying sizes (e.g., full-length PARP ~116 kDa, cleaved PARP ~89 kDa, caspases ~30-50 kDa), a 4-20% gradient gel is recommended for optimal separation [36].
- Electrophoresis: Load an equal amount of total protein (e.g., 20-30 µg) per well alongside a pre-stained protein ladder. Run the gel using a suitable buffer system (e.g., Tris-glycine) under constant voltage (100-150V) until the dye front reaches the bottom of the gel [1] [36].
- Protein Transfer: Transfer proteins from the gel to a methanol-pre-wetted PVDF membrane using the wet tank transfer method. PVDF is preferred for its high protein retention and durability, which is beneficial for subsequent stripping and reprobing steps [36].
Immunoblotting and Detection
- Blocking: Incubate the membrane in a blocking buffer (e.g., 5% non-fat dry milk or BSA in TBST) for 1 hour at room temperature to prevent non-specific antibody binding [1].
- Primary Antibody Incubation: Probe the membrane with validated primary antibodies against your apoptotic targets (e.g., cleaved caspase-3, PARP, Bcl-2, Bax) diluted in blocking buffer or a commercial antibody diluent. Incubation is typically performed overnight at 4°C with gentle agitation [1] [36].
- Secondary Antibody Incubation: Wash the membrane and incubate with an HRP- or fluorochrome-conjugated secondary antibody for 1-2 hours at room temperature [1] [36].
- Detection and Normalization:
- Detection: Visualize protein bands using enhanced chemiluminescence (ECL) for HRP or by scanning on a fluorescence-compatible imager.
- Normalization: For accurate quantification, normalize the signal of your target apoptotic proteins to a total protein load. Total Protein Normalization (TPN) is now considered the gold standard over housekeeping proteins (HKPs) like GAPDH or β-actin, as HKP expression can vary significantly with experimental conditions, cell type, and pathology [37]. TPN can be achieved by staining the membrane with a total protein stain (e.g., No-Stain Protein Labeling Reagent) before or after immunodetection [37].
Data Analysis and Quantification
Capture the blot image using a digital imaging system. Use densitometry software (e.g., ImageJ) to quantify the band intensities. Calculate the ratio of the target protein signal (e.g., cleaved caspase-3) to the total protein signal for each lane. Present results as relative intensity levels or ratios to demonstrate changes in protein expression, cleavage, or post-translational modification across different experimental conditions [1] [37].
Visualizing Apoptotic Signaling and Experimental Workflow
Apoptotic Signaling Pathways
Western Blot Workflow for Apoptosis
Successful apoptosis analysis by western blot relies on a suite of well-validated reagents and tools. The following table details key research solutions for detecting core apoptotic proteins.
Table 2: Research Reagent Solutions for Apoptosis Western Blotting
| Reagent / Resource | Specific Example Targets | Function in Experiment | Key Considerations |
|---|---|---|---|
| Primary Antibodies | Cleaved Caspase-3, PARP, Bcl-2, Bax, p53, PUMA [1] [35] | Specifically bind to the protein of interest or its cleaved/activated form. | Critical to use antibodies validated for western blotting. Monoclonal antibodies offer high specificity; recombinant antibodies provide superior lot-to-lot consistency [36]. |
| Antibody Cocktails | Pro/p17-caspase-3, cleaved PARP1, actin (ab136812) [1] | Pre-mixed solutions of multiple antibodies to detect several apoptosis markers simultaneously in a single assay. | Increase efficiency, enhance detection across markers, and improve reproducibility. Ideal for complex pathway studies or limited sample quantities [1]. |
| Total Protein Normalization Kits | No-Stain Protein Labeling Reagent [37] | Fluorescently label total protein on the membrane for accurate loading control. | Superior to housekeeping protein (HKP) normalization, as it is not affected by experimental manipulations that may alter HKP expression [37]. |
| Enhanced Chemiluminescence (ECL) Reagents | HRP substrate kits | Generate light signal upon reaction with HRP enzyme on the secondary antibody for band detection. | Common and sensitive. Ensure the reagent provides a strong, linear signal within the dynamic range of your protein abundance. |
| Fluorescent Western Blotting Systems | iBright Imaging System [37] | Directly detect fluorophore-conjugated antibodies without a substrate reaction. | Allows for multiplexing and offers a wider dynamic range. Requires a compatible imaging system [37]. |
Quantitative Data Analysis and Interpretation in Apoptosis Research
Robust quantification and careful interpretation are critical for drawing meaningful conclusions from apoptosis western blot data. The field is increasingly moving towards Total Protein Normalization (TPN) as the gold standard, as housekeeping proteins (HKPs) like GAPDH and β-actin can exhibit significant expression variability under different experimental conditions, pathophysiological states, and across cell types, leading to inaccurate quantification [37]. When analyzing results, researchers should focus on specific band patterns that indicate apoptotic activity:
- Caspase Activation: A shift from the pro-caspase band (e.g., ~35 kDa for caspase-3) to the cleaved, active fragments (e.g., ~17/19 kDa for caspase-3) is a definitive marker of apoptosis execution [1].
- PARP Cleavage: The appearance of an ~89 kDa cleaved PARP band, concurrent with a decrease in the full-length ~116 kDa band, serves as a robust confirmation of caspase-mediated apoptosis [1] [33].
- Protein Ratios: Calculating the ratio of pro-apoptotic to anti-apoptotic proteins (e.g., Bax/Bcl-2 ratio) provides a quantitative measure of the cellular commitment to apoptosis. An increased Bax/Bcl-2 ratio, as demonstrated in studies combining thymoquinone and methotrexate, is a strong indicator of enhanced apoptotic susceptibility [34].
Quantitative data from western blots should be analyzed using densitometry software (e.g., ImageJ) and presented as ratios (e.g., cleaved/total protein, or target protein/total protein) to account for loading variations. For instance, a study on nanoparticle-induced apoptosis quantified the expression of phosphorylated p53 (Ser15) and demonstrated that CdSe/ZnS quantum dots were the most potent activator among the tested nanoparticles, providing a clear, quantitative ranking of their efficacy [35]. Adherence to journal-specific guidelines for blot presentation, including the avoidance of over-cropping and the clear indication of spliced lanes, is essential for data integrity and publication [37].
Connecting Protein Expression to Therapeutic Outcomes
The direct measurement of apoptotic protein expression provides a mechanistic bridge for understanding therapy resistance and developing novel treatment strategies. For example, in locally advanced SCCHN, resistance to chemoradiotherapy is frequently linked to the overexpression of Inhibitor of Apoptosis Proteins (IAPs), which directly block caspase activity and prevent cell death execution [31]. In this context, IAP inhibitors are being developed to re-sensitize tumors to conventional therapies, with encouraging early-phase clinical trial data [31]. Furthermore, the paradoxical finding that apoptotic cells in circulation can potentiate metastasis by promoting the survival of circulating tumor cells (CTCs) through the recruitment of platelets underscores the complex role of apoptosis in cancer progression [38]. This highlights that simply inducing apoptosis may not be sufficient; understanding the downstream consequences and the tumor microenvironment is crucial.
The synergy between natural compounds and chemotherapeutic drugs offers another promising avenue. Research on thymoquinone (TQ) and methotrexate (MTX) in MCF-7 breast cancer cells showed that the combination therapy synergistically increased apoptosis (up to 83.6%) by modulating the expression of key regulators: it upregulated the pro-apoptotic Bax, downregulated the anti-apoptotic Bcl-2, and enhanced caspase-3 activation [34]. These molecular findings, readily detectable by western blot, provide a protein-level explanation for the observed therapeutic enhancement and highlight how targeting dysregulated apoptotic pathways can overcome resistance. By systematically connecting protein expression data to functional hallmarks of cancer—such as evading cell death and enabling metastasis—researchers can validate new drug targets and optimize combination therapies to improve patient outcomes.
Optimized Western Blot Protocols for Detecting Apoptotic Markers in Cancer Models
In cancer research, a hallmark of malignant cells is the evasion of programmed cell death, making the analysis of apoptotic pathways a cornerstone of oncological studies and drug development [39] [40]. Western blot analysis serves as a critical technique for detecting key apoptotic markers, such as the activation of caspases and the cleavage of their substrates. The reliability of this analysis is fundamentally dependent on the initial step: sample preparation. The use of appropriate lysis buffers and protease inhibitors is paramount to preserving the native state of proteins, capturing transient phosphorylation events, and preventing the post-lysis degradation that can obscure critical analytical results. This application note provides detailed protocols for the preparation of high-quality protein lysates tailored for the analysis of apoptosis via western blot, framed within a broader thesis on cancer research.
The Scientist's Toolkit: Research Reagent Solutions
The following table catalogues essential reagents required for effective protein extraction and analysis in apoptosis studies.
Table 1: Key Research Reagents for Apoptosis-Related Protein Analysis
| Reagent | Function & Application in Apoptosis Studies |
|---|---|
| RIPA Buffer | A versatile lysis buffer effective for extracting a wide range of proteins, including those from the Bcl-2 family, caspases, and IAPs, while solubilizing membrane-associated proteins. |
| Protease Inhibitor Cocktail | Prevents the proteolytic degradation of apoptosis-related proteins (e.g., caspases, PARP) by cellular proteases released during lysis, ensuring accurate detection of full-length and cleaved forms. |
| Phosphatase Inhibitor Cocktail | Preserves phosphorylation states of signaling proteins critical in apoptosis regulation, such as components of the PI3K/Akt and MAPK/ERK pathways [41]. |
| Caspase Activity Kits | Enable direct measurement of caspase-3/7 or caspase-8 activity using colorimetric or luminescent substrates, providing functional data on apoptosis initiation and execution [41] [42]. |
| PMSF | A serine protease inhibitor that provides broad-spectrum protection against proteases, often used in conjunction with other inhibitors. |
| Primary Antibodies | Specific antibodies for detecting apoptotic markers (e.g., cleaved Caspase-3, PARP, Bax, Bcl-2, Survivin) and loading controls (e.g., GAPDH, α-tubulin, β-actin) [43] [39]. |
| HRP-conjugated Secondary Antibodies | Used in conjunction with chemiluminescent substrates for the detection of target proteins on western blot membranes. |
Lysis Buffer Composition and Rationale for Apoptosis Studies
The choice of lysis buffer is determined by the subcellular localization of the target protein and the downstream application. For apoptosis studies, which often involve membrane-bound receptors, cytosolic effectors, and mitochondrial proteins, a robust buffer is required.
Table 2: Quantitative Comparison of Common Lysis Buffers for Apoptosis Research
| Lysis Buffer Type | Typical Composition | Compatible Downstream Assays | Advantages | Limitations |
|---|---|---|---|---|
| RIPA Buffer | 50 mM Tris-HCl (pH 8.0), 150 mM NaCl, 1% NP-40, 0.5% Sodium Deoxycholate, 0.1% SDS | Western Blot, IP | Strong denaturing capability; effective for nuclear, cytoplasmic, and membrane proteins; reduces protein-protein interactions. | May disrupt weak protein complexes; can interfere with some enzymatic activity assays. |
| Modified RIPA Buffer | Standard RIPA with added 1 mM EDTA, 1 mM EGTA | Western Blot, IP, Caspase Activity Assay [42] | Chelating agents (EDTA/EGTA) inhibit metalloproteases and regulate calcium-dependent signaling, improving stability of caspases and other proteases. | - |
| Non-denaturing Lysis Buffer | 20 mM Tris-HCl (pH 8.0), 137 mM NaCl, 1% NP-40, 10% Glycerol | Co-Immunoprecipitation (Co-IP), Kinase Assays | Maintains protein complexes and native enzymatic activity; ideal for studying protein interactions (e.g., IAP-Smac/DIABLO). | Weaker extraction efficiency for nuclear and cytoskeletal proteins. |
Protocol 1: Preparation of Modified RIPA Lysis Buffer for Apoptosis Studies
This protocol is optimized for the extraction of proteins for western blot analysis of apoptotic signaling pathways.
Materials:
- Tris-HCl (pH 8.0)
- NaCl
- NP-40 Alternative
- Sodium Deoxycholate
- SDS
- EDTA (0.5 M, pH 8.0)
- Glycerol
- Protease Inhibitor Cocktail Tablets
- Phosphatase Inhibitor Cocktail
- PMSF (100 mM stock in isopropanol)
- Nuclease-free Water
Procedure:
- Prepare a 500 mL stock of RIPA base buffer without inhibitors:
- 25 mL of 1 M Tris-HCl (pH 8.0) to a final concentration of 50 mM
- 15 mL of 5 M NaCl to a final concentration of 150 mM
- 5 mL of 10% NP-40 to a final concentration of 1%
- 2.5 mL of 10% Sodium Deoxycholate to a final concentration of 0.5%
- 0.5 mL of 10% SDS to a final concentration of 0.1%
- 2 mL of 0.5 M EDTA to a final concentration of 2 mM
- 50 mL of Glycerol to a final concentration of 10%
- Add nuclease-free water to a total volume of 500 mL. Mix thoroughly and store at 4°C.
- On the day of the experiment, prepare a sufficient volume of complete, ice-cold lysis buffer:
- Add one tablet of protease inhibitor cocktail per 50 mL of RIPA base buffer OR 1 mL of liquid cocktail per 100 mL.
- Add phosphatase inhibitor cocktail as per manufacturer's instructions (typically 1:100 dilution).
- Add PMSF to a final concentration of 1 mM.
- Cell Lysis:
- Culture and treat cells according to your experimental design (e.g., with chemotherapeutic agents like doxorubicin to induce apoptosis [41]).
- Place culture dishes on ice and aspirate the medium. Wash cells gently with ice-cold 1X PBS.
- Add an appropriate volume of complete lysis buffer directly to the plate (e.g., 100-200 µL for a 35-mm dish).
- Scrape the cells thoroughly and transfer the lysate to a pre-chilled microcentrifuge tube.
- Incubate on a rotator at 4°C for 30 minutes to ensure complete lysis.
- Centrifuge the lysates at 14,000-16,000 × g for 15 minutes at 4°C.
- Carefully transfer the supernatant (the protein lysate) to a new pre-chilled tube.
- Protein Quantification: Determine the protein concentration of each sample using a BCA or Bradford protein assay kit, following the manufacturer's instructions. Adjust concentrations as needed for downstream applications.
Experimental Workflow for Analyzing Apoptosis via Western Blot
The following diagram outlines the complete workflow from cell culture to data analysis, highlighting critical steps where sample preparation is crucial.
Figure 1: Experimental workflow for apoptosis analysis, from sample preparation to western blot.
Complementary Assays for Apoptosis Validation
Protocol 2: Measuring Caspase Activity
Functional caspase activity assays provide complementary data to western blot analysis by confirming the enzymatic activity of the caspases.
Materials:
- Caspase-Glo 3/7 or Caspase-3/8 Activity Kit (colorimetric) [41] [42]
- White or clear-bottom 96-well plates
- Microplate reader (luminescence or absorbance at 405 nm)
Procedure:
- Prepare protein lysates from treated and control cells using a nondenaturing lysis buffer or the modified RIPA buffer described in Protocol 1. Avoid SDS in the buffer for colorimetric assays.
- Quantify protein concentration. Aliquot 3-5 µg of total protein per well in a 96-well plate. Adjust the volume to 50 µL with lysis buffer.
- For a colorimetric assay, add 50 µL of reaction buffer containing the caspase-specific substrate (e.g., Ac-DEVD-pNA for caspase-3/7) to each well.
- Incubate the plate at 37°C for 1-4 hours, protected from light.
- Measure the absorbance at 405 nm using a microplate reader. Increased absorbance indicates caspase activation and apoptosis induction [42].
Apoptosis Signaling Pathways
The following diagram illustrates the core apoptotic signaling pathways and indicates key proteins that are common targets for western blot analysis.
Figure 2: Core apoptosis signaling pathways and key regulatory proteins.
Meticulous sample preparation is the foundation of reliable and reproducible apoptosis data. The strategic selection and formulation of lysis buffers, combined with comprehensive protease and phosphatase inhibition, are critical for capturing the dynamic and proteolytically sensitive events that define apoptotic cell death. The protocols and reagents detailed in this application note provide a robust framework for researchers to accurately analyze the complex protein interactions and cleavage events that underlie apoptosis in cancer models, thereby supporting the development of novel therapeutic strategies.
In western blot analysis of apoptosis in cancer research, the steps of gel electrophoresis and protein transfer are foundational to obtaining meaningful data. These processes directly influence the ability to resolve and detect key apoptotic markers, such as caspases, cleaved PARP, and Bcl-2 family proteins, which are essential for understanding the mechanistic response of cancer cells to therapeutic agents [1]. Inefficient separation or transfer can lead to the loss of critical information, particularly for low-abundance proteins or closely sized cleaved fragments, ultimately compromising the interpretation of a treatment's efficacy. This application note provides detailed methodologies and optimization strategies to ensure clear separation and efficient transfer of target proteins, with a specific focus on applications within cancer and apoptosis research.
Principles of Protein Electrophoresis and Transfer
Discontinuous Gel Electrophoresis for Optimal Separation
The standard technique for separating proteins prior to immunoblotting is discontinuous polyacrylamide gel electrophoresis (PAGE) [44]. This system utilizes a stacking gel and a resolving gel with different pore sizes and pH levels to concentrate the protein sample into a sharp line before separation by molecular weight. This process is crucial for resolving proteins of similar sizes, such as the full-length and cleaved forms of apoptotic proteins like caspase-3 and PARP.
Mechanisms of Electrophoretic Transfer
Following separation, proteins are transferred from the gel onto a solid-support membrane via electrophoresis [45]. The gel and membrane are sandwiched between electrodes and submerged in a conductive buffer. When voltage is applied, the negatively charged proteins migrate out of the gel and onto the membrane, where they are immobilized, creating a replica of the gel's protein pattern for subsequent antibody probing [45].
Experimental Protocols
Protocol 1: SDS-PAGE for Apoptotic Protein Separation
This protocol is optimized for resolving key apoptotic proteins, including large anti-apoptotic proteins like Bcl-2 (~26 kDa) and smaller cleaved fragments like caspase-3 (~17 kDa) [1].
Step 1: Gel Preparation
- Prepare a hand-cast polyacrylamide gel with a concentration appropriate for your target proteins. For resolving a broad range of apoptotic markers (e.g., from 120 kDa PARP to 17 kDa caspase-3), a 4-20% gradient gel is recommended. For a more focused range, use a 12% gel.
- Add 0.1% SDS to both the stacking and resolving gels to ensure proteins remain denatured and carry a uniform negative charge.
Step 2: Sample Preparation
- Prepare cell lysates from treated and control cancer cells using RIPA buffer supplemented with protease and phosphatase inhibitors (e.g., 1 mM PMSF, 1 mM sodium orthovanadate) to prevent degradation of apoptotic markers [44].
- Determine protein concentration using a compatible assay (e.g., BCA assay).
- Dilute protein samples in 2X Laemmli buffer containing a reducing agent like β-mercaptoethanol or DTT [44].
- Heat samples at 95°C for 5 minutes to fully denature proteins.
- Centrifuge samples briefly to collect condensation.
Step 3: Gel Electrophoresis
- Load an equal amount of total protein (e.g., 20-50 µg) per lane, alongside a pre-stained protein molecular weight marker.
- Fill the electrophoresis tank with 1X Tris-Glycine-SDS running buffer.
- Run the gel initially at a constant voltage of 80 V until the dye front enters the resolving gel.
- Increase the voltage to 120 V until the dye front reaches the bottom of the gel.
Protocol 2: Wet Tank Transfer for Quantitative Blotting
Wet transfer is the recommended method for quantitative western blotting as it allows for extensive customization and is effective across a broad molecular weight range [46] [47].
Step 1: Membrane and Filter Paper Preparation
- Cut a PVDF or nitrocellulose membrane and filter paper to the exact size of the gel.
- Pre-wet PVDF membrane in 100% methanol for 30 seconds, then equilibrate in transfer buffer. Nitrocellulose can be placed directly into buffer [45].
- Soak the filter papers and sponges in transfer buffer.
Step 2: Assembling the Transfer Stack
- On the cassette, assemble the "transfer sandwich" in the following order, ensuring no air bubbles are trapped:
- Cassette (cathode/- side)
- Sponge
- Filter Paper
- Polyacrylamide Gel
- Membrane
- Filter Paper
- Sponge
- Cassette (anode/+ side)
- Close the cassette and place it into the transfer tank, ensuring the correct polarity (gel facing the cathode, membrane facing the anode).
- On the cassette, assemble the "transfer sandwich" in the following order, ensuring no air bubbles are trapped:
Step 3: Electrophoretic Transfer
- Fill the tank with Towbin transfer buffer (25 mM Tris, 192 mM glycine, 20% methanol, pH 8.3) [45].
- For comprehensive transfer of apoptotic proteins, run at a constant 100 V for 60-90 minutes at 4°C with stirring, or at a constant 30 V overnight at 4°C [46] [47].
- To aid the transfer of high molecular weight proteins (>120 kDa), SDS can be added to the transfer buffer to a final concentration of 0.02-0.1% [45].
Verification of Transfer Efficiency
- Post-Transfer Gel Staining: After transfer, stain the polyacrylamide gel with Coomassie Brilliant Blue to visualize any proteins that failed to transfer out of the gel [46].
- Membrane Staining: Temporarily stain the membrane with Ponceau S stain (0.1% w/v in 5% acetic acid) to visualize the transferred protein bands and assess uniformity. The stain can be washed off with deionized water before proceeding to blocking [45].
Optimization Strategies for Apoptosis-Specific Targets
Transfer Method Selection
The choice of transfer method significantly impacts the efficiency of protein transfer, especially for the diverse range of protein sizes encountered in apoptosis studies.
Table 1: Comparison of Western Blot Transfer Methods
| Method | Principle | Advantages | Disadvantages | Ideal for Apoptosis Targets |
|---|---|---|---|---|
| Wet Transfer [46] [47] | Gel/membrane sandwich submerged in buffer tank. | Highly customizable; effective for a broad molecular weight range; gold standard for quantitative work. | Requires large buffer volumes; generates heat; slower (1 hour to overnight). | All markers, especially high MW proteins and quantitative studies. |
| Semi-Dry Transfer [46] [47] | Gel/membrane sandwiched between buffer-soaked filter papers. | Faster (5-60 min); uses less buffer. | Buffer depletion can occur; less effective for very high or very low MW proteins; not ideal for quantitative blots. | Routine analysis of mid-sized proteins when speed is a priority. |
| Dry Transfer [47] | Gel placed between pre-assembled stacks with proprietary buffer matrices. | Fastest (7-10 min); no buffer preparation. | Little room for optimization; pre-assembled stacks add cost; may not be quantitative. | Rapid, qualitative checks when customization is not needed. |
Membrane Selection and Buffer Optimization
The choice of membrane and buffer composition is critical for retaining proteins, particularly small cleaved fragments.
- Membrane Selection:
- Nitrocellulose: Offers high binding capacity for proteins and is suitable for most applications. It becomes brittle upon drying [45].
- PVDF: Provides superior mechanical strength, making it ideal for stripping and reprobing blots. It requires pre-wetting in methanol and can have higher background [46] [45]. For fluorescent detection, use low-fluorescence PVDF to minimize background [45].
- Buffer Composition:
- Methanol: Enhances protein binding to the membrane, particularly to PVDF, by removing SDS from proteins. However, it can cause gel shrinkage and hinder the transfer of large proteins (>100 kDa) [46] [45]. If transferring very large proteins, consider a methanol-free buffer.
- SDS: Adding SDS (0.02-0.1%) to the transfer buffer can improve the elution of large hydrophobic proteins from the gel but can reduce protein retention on the membrane [45].
The following diagram illustrates the key decision-making workflow for selecting and optimizing a transfer method for apoptosis research.
The Scientist's Toolkit: Research Reagent Solutions
Table 2: Essential Materials for Electrophoresis and Transfer
| Item | Function | Example & Notes |
|---|---|---|
| Protease/Phosphatase Inhibitors [44] | Prevents degradation of proteins and post-translational modifications (e.g., cleaved caspases, phosphorylated Bcl-2) during lysis. | Cocktails containing PMSF, Aprotinin, Sodium Orthovanadate. |
| RIPA Lysis Buffer [44] | Effective for preparing whole cell extracts, including membrane-bound and nuclear apoptotic proteins. | Contains ionic and non-ionic detergents for efficient lysis. |
| Pre-cast Gels | Provide consistency and convenience for protein separation. | 4-20% gradient gels are ideal for resolving a wide range of apoptotic markers. |
| PVDF Membrane [46] [45] | Robust membrane with high protein binding capacity; ideal for stripping and reprobing. | Must be pre-wetted in methanol. Use low-fluorescence versions for fluorescence detection. |
| Nitrocellulose Membrane [46] [45] | Traditional membrane with high binding affinity for proteins. | Does not require methanol pre-wetting but becomes brittle. |
| Towbin Transfer Buffer [45] | Standard buffer for wet transfer systems. Maintains pH above protein pI for negative charge. | 25 mM Tris, 192 mM Glycine, 20% Methanol. |
| Ponceau S Stain [45] | Reversible stain for quick verification of protein transfer and membrane uniformity. | 0.1% (w/v) in 5% acetic acid. |
Data Presentation: Quantitative Transfer Comparisons
Table 3: Optimized Transfer Conditions for Common Apoptosis Markers
| Target Protein | Approx. Molecular Weight | Recommended Transfer Method | Key Optimization Tips |
|---|---|---|---|
| PARP (Full length & Cleaved) [1] | 116 kDa & 89 kDa | Wet Transfer | Ensure sufficient transfer time (e.g., 90 min) for complete elution of the 116 kDa fragment. |
| Caspase-9 [1] | ~46 kDa (Inactive) | Wet or Semi-Dry | Standard conditions typically suffice. |
| Caspase-3 (Full length & Cleaved) [1] | 35 kDa & 17/19 kDa | Wet Transfer | Use a membrane with small pore size (e.g., 0.2 µm) to retain the small 17 kDa fragment. |
| Bax [48] | 21 kDa | Wet Transfer | Avoid excessive transfer time or voltage to prevent the small protein from passing through the membrane. |
| Bcl-2 [48] | 26 kDa | Wet or Semi-Dry | Standard conditions typically suffice. |
Mastering the techniques of gel electrophoresis and protein transfer is non-negotiable for generating reliable and publication-quality data in apoptosis research. The careful selection and optimization of the transfer method, membrane, and buffer system, as detailed in these protocols, ensure the efficient transfer of a wide spectrum of apoptotic proteins—from large precursors to small cleaved effectors. By adhering to these standardized methodologies, researchers in cancer biology and drug development can significantly enhance the reproducibility and quantitative accuracy of their western blot data, thereby strengthening conclusions about the mechanisms of cell death in response to novel therapeutics.
Apoptosis, or programmed cell death, is a fundamental biological process for maintaining cellular balance, eliminating damaged, unnecessary, or potentially harmful cells in a controlled manner. In cancer research, dysregulation of apoptotic pathways allows damaged cells to survive and proliferate, making the analysis of key apoptotic proteins essential for understanding disease mechanisms and treatment efficacy. Western blotting serves as a powerful tool for detecting changes in the expression and activation of proteins central to the intrinsic (mitochondrial) and extrinsic apoptosis pathways.
This application note provides detailed protocols and validation strategies for antibodies targeting four pivotal proteins in apoptosis research: the tumor suppressor p53; the anti-apoptotic regulator Bcl-2; the pro-apoptotic executor Bax; and the key protease Caspase-3. The reliability of western blot data is critically dependent on the rigorous validation of primary antibodies, ensuring that results are specific, selective, and reproducible within the context of your experimental system.
Foundational Principles of Antibody Validation
Defining Validation in Western Blotting
For western blotting, "validation" is the experimental proof and documentation that a particular antibody is suitable for this specific assay. It must demonstrate:
- Specificity: The antibody's ability to recognize and bind to its intended target epitope.
- Selectivity: The antibody's preference to bind its target antigen in the presence of a complex heterogeneous mixture of competing proteins, such as a cell or tissue lysate [49].
An antibody validated for one application (e.g., immunohistochemistry) may not perform reliably in western blotting due to differences in antigen presentation, highlighting the necessity for application-specific validation [49].
Critical Validation Strategies
A combination of strategies is recommended to conclusively validate an antibody. No single method is sufficient.
- Genetic Controls (Knockout/Knockdown Validation): This is often considered the "gold standard." It involves running the antibody on lysates from cell lines or tissues where the gene encoding the target protein has been deleted or silenced. The absence of a band in the knockout (KO) sample confirms the antibody's specificity for that target. Figure 1 illustrates how genetic and other controls are integrated into a validation workflow.
- Independent Epitope Recognition: Using two different antibodies that recognize distinct, non-overlapping epitopes on the same target protein to confirm the identity of the detected band.
- Orthogonal or Complementary Methods: Verifying western blot results with an alternative technique, such as mass spectrometry or immunoprecipitation, to confirm the identity of the protein.
- Use of Positive and Negative Controls: Including lysates from cell lines known to express or lack the target protein is essential for every blot. Positive controls confirm the protocol worked, while negative controls help identify non-specific binding [49].
- Molecular Weight Verification: Confirming that the detected band aligns with the expected molecular weight of the target protein, while remaining vigilant for splice variants, post-translational modifications (PTMs), or protein degradation that can cause size shifts.
- Assessment of Batch-to-Batch Variation: Requesting validation data for the specific antibody lot from the supplier and performing in-house validation, especially when a new batch is received. Recombinant antibodies are preferred for minimizing batch variation [49].
Protein-Specific Validation Criteria and Data Interpretation
Expected Band Sizes and Cleavage States
The following table summarizes key characteristics for the apoptotic proteins discussed in this guide, serving as a reference for band identification.
Table 1: Key Apoptotic Protein Characteristics for Western Blot Analysis
| Protein | Primary Function | Full-Length / Pro-form (kDa) | Active/Cleaved Form (kDa) | Validation Tips |
|---|---|---|---|---|
| p53 | Tumor suppressor; transcription factor induces Bax expression and directly interacts with Bcl-2 [50] [51]. | ~53 | Not applicable | Look for potential upregulation in response to DNA damage. Bands at ~90 kDa may indicate ubiquitinated forms. |
| Bcl-2 | Anti-apoptotic; binds and inhibits pro-apoptotic proteins like Bax [50]. | ~26 (α-isoform) | Not applicable | Confirm absence of band in Bcl-2 KO lysates. Assess expression changes relative to pro-apoptotic proteins. |
| Bax | Pro-apoptotic; permeabilizes mitochondrial membrane [51]. | ~21 | Not applicable | A conformational change, not a cleavage, indicates activation. Confirm specificity with Bax KO lysates. |
| Caspase-3 | Executioner caspase; cleaves cellular substrates [51] [1]. | ~32-35 (Pro-caspase-3) | ~17 & ~12 (Cleaved caspase-3) | The appearance of the 17/12 kDa fragments is a definitive marker of apoptosis. |
Validating Antibodies for Multiplex Apoptosis Analysis
When analyzing multiple apoptotic regulators, it is crucial to understand their functional relationships. p53 can transcriptionally upregulate Bax and directly inhibit Bcl-2 by binding to its BH3-binding pocket, thereby promoting apoptosis [50] [51]. The following diagram illustrates these key interactions within the intrinsic apoptosis pathway and the role of western blotting in its analysis.
Diagram 1: Key Intrinsic Apoptosis Pathway and Western Blot Detection Points. Dashed lines indicate where western blot analysis measures protein expression or activation.
Detailed Experimental Protocol for Apoptosis Western Blotting
Sample Preparation and Gel Electrophoresis
Proper sample preparation is the foundation of a successful western blot.
- Lysis Buffer Selection: Use RIPA buffer (25 mM Tris-HCl pH 7.6, 150 mM NaCl, 1% NP-40, 1% sodium deoxycholate, 0.1% SDS) for efficient extraction of whole cell, mitochondrial, and nuclear proteins. Always supplement with a protease inhibitor cocktail immediately before use [52].
- Tissue Homogenization: For tissue samples, manually macerate with scissors or a scalpel, then homogenize using a dounce or electric homogenizer in extraction buffer at a 1:10 (w/v) ratio until a smooth homogenate is achieved. For precious samples, a 1:5 ratio can be effective [52].
- Clarification: Centrifuge homogenates at 20,000 x g for 20 minutes at 4°C. Collect the supernatant (solubilized proteins) and store at -80°C [52].
- Protein Quantification: Determine protein concentration using a BCA or Bradford assay. Ensure the standard curve has an R-squared value ≥ 0.99 for accuracy. All samples for comparison must be assayed against the same standard curve [52].
- Sample Preparation: Dilute samples to the desired concentration. A standard load for cell lysates is 10-30 μg total protein per lane. Add 5X Laemmli sample buffer, vortex, and heat at 98°C for 2-5 minutes to denature proteins [1].
- Gel Electrophoresis: Load samples and a pre-stained protein ladder onto a 4-12% Bis-Tris gradient gel for optimal separation across a broad molecular weight range. Run using MES buffer for proteins between 3.5-160 kDa at 180V for approximately 50 minutes [52].
Protein Transfer, Blocking, and Immunoblotting
- Transfer: Use a standard wet or semi-dry transfer system to transfer proteins from the gel to a PVDF or nitrocellulose membrane. The specific conditions (voltage, time) will depend on the transfer apparatus and protein sizes.
- Total Protein Stain (Loading Control Gel): For the most accurate normalization, stain one identical gel with a total protein stain (e.g., Coomassie-based fluorescent stains) immediately after electrophoresis. This gel serves as the loading control, bypassing potential variability of traditional housekeeping proteins [52].
- Blocking: Block the membrane with 5% non-fat dry milk or BSA in TBST for 1 hour at room temperature to prevent non-specific antibody binding.
- Primary Antibody Incubation: Dilute the validated primary antibody in the recommended buffer (often 5% BSA in TBST). Incubate the membrane with the primary antibody with gentle agitation overnight at 4°C. See Table 2 for key reagent details.
- Washing: Wash the membrane 3-5 times for 5 minutes each with TBST to remove unbound primary antibody.
- Secondary Antibody Incubation: Incubate with a fluorophore-conjugated secondary antibody (e.g., IRDye 680LT or 800CW) diluted in blocking buffer for 1 hour at room temperature, protected from light.
- Final Wash: Perform a final series of washes with TBST (3-5 times for 5 minutes each) to remove any unbound secondary antibody.
Table 2: Research Reagent Solutions for Apoptosis Western Blotting
| Reagent / Material | Function / Purpose | Examples / Specifications |
|---|---|---|
| RIPA Lysis Buffer | Efficiently extracts proteins from various cellular compartments for apoptosis analysis. | 25 mM Tris-HCl, 150 mM NaCl, 1% NP-40, 1% Na-deoxycholate, 0.1% SDS [52]. |
| Protease Inhibitor Cocktail | Preserves protein integrity by inhibiting enzymatic degradation during lysis. | Added fresh to lysis buffer to prevent cleavage of caspases and other labile targets. |
| Fluorophore-conjugated Secondary Antibodies | Enable highly sensitive, quantitative detection with a wide linear dynamic range. | IRDye 680LT, IRDye 800CW; used with LI-COR Odyssey or similar imaging systems [52]. |
| Validated Primary Antibodies | Specifically bind to target apoptotic proteins (e.g., Bax, Bcl-2). | Select antibodies with validation data for Western blotting (e.g., KO lysate data). |
| Pre-cast Gradient Gels | Provide optimal resolution of proteins across a wide molecular weight range. | 4-12% Bis-Tris gels; MES buffer for proteins 3.5-160 kDa [52]. |
| Apoptosis Antibody Cocktails | Pre-mixed antibodies for simultaneous detection of multiple apoptosis markers. | Contains antibodies for caspases, Bcl-2 family, PARP; improves efficiency and reproducibility [1]. |
| LI-COR Odyssey Imaging System | A dedicated system for quantitative fluorescence-based western blot detection. | Allows multiplex detection and provides a linear quantitation range superior to ECL [52]. |
Visualization and Quantitative Analysis
- Image Acquisition: Use a fluorescent imager, such as the LI-COR Odyssey, to scan the membrane at the appropriate channels (700 nm and 800 nm). Ensure the image is not overexposed; signals should be within the linear range of the detector [53] [52].
- Band Quantification and Normalization:
- Use analysis software (e.g., Image Studio Lite, ImageJ) to draw rectangles around each band of interest and measure the signal intensity.
- Apply background correction. The default method in Image Studio Lite uses a narrow border outside the selection shape to calculate and subtract background noise [53].
- Normalize the signal of the target protein. For the membrane, use a housekeeping protein like β-actin or GAPDH. For the most accurate loading control, use the total protein stain from the dedicated loading control gel [1] [52].
- For cleaved proteins like Caspase-3, calculate the ratio of the cleaved form to the total protein (cleaved + pro-form) to assess the level of activation [1].
- Data Presentation: Express results as relative intensity levels or ratios (e.g., "Bax/β-actin" or "Cleaved Caspase-3 / Total Caspase-3") to demonstrate expression patterns and apoptotic activation across different experimental conditions.
Visualizing the Experimental Workflow
The entire process, from experimental design to data analysis, is summarized in the following workflow diagram.
Diagram 2: Comprehensive Western Blot Workflow for Apoptosis Protein Detection. Critical considerations for each major step are highlighted in red notes.
The reliable detection of Bax, Bcl-2, Caspase-3, and p53 via western blotting is a cornerstone of apoptosis research in cancer biology. The generation of publication-quality data hinges on the rigorous, application-specific validation of primary antibodies, employing a combination of genetic controls, appropriate biological controls, and careful assessment of banding patterns. By adhering to the detailed protocols and validation frameworks outlined in this document, researchers can ensure the specificity, selectivity, and reproducibility of their findings, thereby contributing robust and meaningful insights into the molecular mechanisms of cell death and survival.
Within the broader scope of a thesis on apoptosis analysis in cancer research, this document presents a detailed application note for using Western blotting to validate the pro-apoptotic effects of natural compounds in liver cancer models. Hepatocellular carcinoma (HCC) is a leading cause of cancer-related mortality globally, with a poor prognosis for advanced-stage patients, necessitating the development of novel therapeutic strategies [54] [55]. Natural compounds, with their multi-target profiles and desirable safety features, have emerged as promising sources for new anti-cancer agents [54] [56]. This case study synthesizes recent findings on several potent natural compounds—Kanglexin (KLX), Diosmetin, Curcumin, Coumestrol, and Apigenin—and provides a standardized Western blot protocol to reliably detect the apoptosis they induce via the mitochondrial pathway, a common mechanism of action for many such compounds [57] [58] [59].
Key Apoptotic Mechanisms of Selected Natural Compounds
The table below summarizes the effects of five natural compounds on key apoptosis-related proteins in liver cancer, as demonstrated in recent studies. This provides a reference for expected outcomes in Western blot experiments.
Table 1: Effects of Natural Compounds on Apoptotic Proteins in Liver Cancer Models
| Natural Compound | Cell Line / Model | Pro-Apoptotic Markers (Increased) | Anti-Apoptotic Markers (Decreased) | Key Signaling Pathways Involved | Source |
|---|---|---|---|---|---|
| Kanglexin (KLX) | HepG2, Hep3B, xenograft | ZBP1, Cleaved Caspase-3 | Bcl-2 | ZBP1/PANoptosis, HOXD10 | [60] |
| Diosmetin (from Mentha) | HepG2, HuH-7 | p53, Bax, Cleaved Caspase-3, p-p38 | Bcl-2 | p38/MAPK | [54] |
| Curcumin | Various in vitro & in vivo | Bax, Cleaved Caspase-3 | Bcl-2 | NF-κB, STAT3, MAPK | [55] |
| Coumestrol | HepG2 | Bax, Cleaved Caspase-3, Cleaved Caspase-9 | Bcl-2, NF-Kβ | Caspase-dependent Apoptosis | [58] |
| Apigenin | Huh7, in vivo model | Bax, Cleaved Caspase-3, Cleaved Caspase-9 | Mitochondrial Apoptosis, NF-κB | [59] | |
| Silymarin + Doxorubicin | H22 | Bax, Caspase-8 | Bcl-2 | Apoptosis, Autophagy, Wnt | [57] |
Detailed Western Blot Protocol for Apoptosis Detection
The following protocol is optimized for detecting changes in the core apoptosis regulators listed in Table 1 and is adaptable for use with various liver cancer cell lines (e.g., HepG2, Hep3B, Huh-7) treated with natural compounds.
Sample Preparation
- Cell Treatment and Lysis: Seed liver cancer cells in a 6-well plate at a density of 2-5 × 10^5 cells per well. After 24 hours, treat the cells with the natural compound at its predetermined IC₅₀ or other effective concentration (e.g., KLX at dose-dependent concentrations [60], Coumestrol as per its cytotoxic activity [58]). Include a vehicle control (e.g., DMSO). Following the treatment period (e.g., 24-48 hours), harvest the cells. Wash the cell monolayer with ice-cold PBS and lyse the cells directly in the culture dish using 100-200 µL of RIPA lysis buffer supplemented with protease and phosphatase inhibitors [61] [62].
- Protein Quantification: Clarify the lysate by centrifugation at 12,000 × g for 15 minutes at 4°C. Transfer the supernatant to a new tube and determine the protein concentration using a BCA protein assay kit, following the manufacturer's instructions [60] [61] [62].
Gel Electrophoresis and Transfer
- SDS-PAGE: Prepare samples for loading by mixing 20-30 µg of total protein with Laemmli sample buffer and boiling for 5 minutes. Load the samples and a pre-stained protein ladder onto a 10-15% SDS-polyacrylamide gel [61]. Run the gel at a constant voltage (e.g., 80-120 V) until the dye front reaches the bottom of the gel.
- Membrane Transfer: For immunoblotting of apoptosis-related proteins, transfer the separated proteins from the gel onto a nitrocellulose membrane using a wet or semi-dry transfer system [61]. The efficiency of transfer can be confirmed by the presence of the pre-stained protein ladder on the membrane.
Immunoblotting
- Blocking and Antibody Incubation: Block the membrane with 5% non-fat milk or BSA in TBST (Tris-Buffered Saline with 0.1% Tween-20) for 1 hour at room temperature to prevent non-specific antibody binding. Incubate the membrane with a specific primary antibody diluted in blocking buffer overnight at 4°C with gentle agitation.
- Primary Antibodies: The selection should be based on the compound being tested (see Table 1). Common choices include:
- Pro-apoptotic: Anti-Bax (e.g., #50599-2-Ig, Proteintech [54]), Anti-Cleaved Caspase-3 (e.g., #19677-1-AP, Proteintech [54]), Anti-Cleaved Caspase-9 [58] [59].
- Anti-apoptotic: Anti-Bcl-2 (e.g., #26593-1-AP, Proteintech [54]).
- Loading Control: Anti-GAPDH (e.g., #60004-1-Ig, Proteintech [54]) or Anti-Tubulin (e.g., #66200-1-Ig, Proteintech [54]).
- Primary Antibodies: The selection should be based on the compound being tested (see Table 1). Common choices include:
- Detection: The next day, wash the membrane three times with TBST for 5 minutes each. Incubate with an appropriate horseradish peroxidase (HRP)-conjugated secondary antibody (e.g., goat anti-rabbit or goat anti-mouse) for 1-2 hours at room temperature. After another series of washes, detect the signal using a chemiluminescence substrate and image the membrane with a chemiluminescence imager [61].
Data Analysis
Normalize the band intensity of the target protein (e.g., Bax) to the corresponding loading control (e.g., GAPDH) for each sample. Compare the normalized density values between treated and control groups to determine the fold-change in protein expression. Statistical analysis (e.g., Student's t-test) should be performed on data from at least three independent experiments.
Visualizing the Apoptotic Signaling Pathways
The following diagram illustrates the interconnected mitochondrial and external pathways through which the featured natural compounds induce apoptosis, highlighting their primary molecular targets as identified in recent research.
Diagram 1: Apoptotic Pathways Targeted by Natural Compounds in Liver Cancer. The diagram shows how Kanglexin (ZBP1/PANoptosis), Diosmetin (p38/p53), and other compounds (Apigenin, Coumestrol, Curcumin) converge on the mitochondrial pathway by upregulating Bax and/or downregulating Bcl-2, leading to caspase activation and apoptosis.
The Scientist's Toolkit: Key Research Reagents
The table below lists essential reagents and their functions for successfully executing the Western blot experiments described in this protocol.
Table 2: Essential Reagents for Apoptosis Analysis by Western Blot
| Reagent / Material | Function / Application | Example Citations |
|---|---|---|
| RIPA Lysis Buffer | Efficient extraction of total cellular proteins for downstream analysis. | [60] [62] |
| BCA Protein Assay Kit | Accurate colorimetric quantification of protein concentration in lysates to ensure equal loading. | [60] [61] [62] |
| SDS-PAGE Gel (10-15%) | Separation of denatured proteins based on molecular weight. | [61] |
| Nitrocellulose Membrane | Solid support for immobilizing separated proteins after transfer for antibody probing. | [61] |
| Anti-Bax Antibody | Detects the upregulated pro-apoptotic protein Bax, a key indicator of mitochondrial pathway activation. | [54] [57] [58] |
| Anti-Bcl-2 Antibody | Detects the downregulated anti-apoptotic protein Bcl-2, indicating a shift in the cell's balance towards death. | [54] [57] |
| Anti-Cleaved Caspase-3 Antibody | Detects the active, cleaved form of caspase-3, a central executioner of apoptosis and a definitive marker of cell death. | [54] [58] [59] |
| Anti-GAPDH / Tubulin | Serves as a loading control to normalize for potential variations in total protein loaded across lanes. | [54] |
| HRP-conjugated Secondary Antibody | Binds to the primary antibody and, with a chemiluminescent substrate, enables signal detection. | [61] |
| Chemiluminescent Substrate | Generates a light signal upon reaction with HRP, allowing visualization of the target protein bands. | [61] |
This application note provides a validated framework for using Western blotting to investigate the pro-apoptotic mechanisms of natural compounds in liver cancer. The synthesized data and detailed methodology offer researchers a robust tool to generate reliable, reproducible results, thereby contributing to the critical pre-clinical evaluation of novel therapeutic agents. The consistent observation that compounds like KLX, Diosmetin, and Apigenin promote mitochondrial apoptosis across diverse models underscores the relevance of this pathway and the utility of Western blot analysis in the ongoing search for effective liver cancer treatments.
Post-translational modifications (PTMs) are reversible, covalent modifications that serve as a critical regulatory mechanism, allowing cells to precisely control protein function by altering protein folding, protein-protein interactions, subcellular localization, and protein stability [63]. In the context of apoptotic signaling, PTMs such as phosphorylation directly regulate the activity, stability, and interactions of core apoptotic proteins, thereby controlling the balance between cell survival and death—a balance often dysregulated in cancer [63] [64]. For instance, phosphorylation of p53 at Ser15 disrupts its interaction with MDM2, leading to p53 accumulation and activation in response to DNA damage [63]. Western blotting, with its ability to use highly specific antibodies, provides a powerful tool to monitor these critical PTM states on apoptotic proteins, offering insights into cancer cell survival mechanisms and potential therapeutic vulnerabilities [63].
Key Apoptotic Signaling Pathways and Regulatory PTMs
Apoptosis proceeds primarily via two core pathways: the extrinsic (death receptor) pathway and the intrinsic (mitochondrial) pathway [64] [65]. Both pathways are heavily modulated by PTMs, which can either promote or inhibit the apoptotic signal. The following diagram illustrates these pathways and key regulatory PTMs.
The intrinsic pathway is activated by internal cellular stresses like DNA damage or growth factor deprivation, leading to Mitochondrial Outer Membrane Permeabilization (MOMP) and the release of cytochrome c, which activates caspase-9 via the apoptosome [64] [65]. The extrinsic pathway is triggered by the binding of extracellular death ligands (e.g., TRAIL) to their cognate cell surface receptors, resulting in the formation of the Death-Inducing Signaling Complex (DISC) and activation of caspase-8 [65]. A key point of crosstalk is the caspase-8-mediated cleavage of BID to tBID, which amplifies the death signal by engaging the intrinsic pathway [65]. These pathways converge on the activation of executioner caspases (e.g., caspase-3, -6, -7), which dismantle the cell through the cleavage of key structural and functional proteins [64].
Key Regulatory PTMs in Apoptosis
The following table summarizes critical PTMs and their functional consequences on key apoptotic regulators.
Table 1: Key PTMs and Their Functional Impact on Apoptotic Proteins
| Protein | PTM Type | Modification Site(s) | Functional Consequence |
|---|---|---|---|
| p53 | Phosphorylation | Ser15, Ser20 [63] | Blocks MDM2 interaction, promoting stabilization and activation in response to DNA damage [63]. |
| p53 | Phosphorylation | Ser46 [63] | Promotes apoptosis induction [63]. |
| p53 | Acetylation | Lys164 [63] | Induces cell cycle arrest [63]. |
| Histone H3 | Phosphorylation | Ser10, Ser28 [63] | Correlated with chromosome condensation during mitosis/meiosis [63]. |
| Caspase-8 | Cleavage | Multiple | Initiates activation cascade at the DISC, triggering extrinsic apoptosis [65]. |
| BID | Cleavage | Multiple | Generates tBID, linking the extrinsic and intrinsic pathways [65]. |
Experimental Protocol: Detecting Phospho-Histone H3 (Ser10) as a Mitotic and Apoptotic Marker
This protocol details a method for detecting phosphorylation of Histone H3 at Serine 10, a modification associated with chromosome condensation during mitosis and often examined in the context of apoptotic cells [63]. The workflow below outlines the entire process.
Stage 1: Sample Preparation (Cell Culture)
Proper sample preparation is critical for preserving labile PTMs such as phosphorylation [66].
Materials Required:
- Lysis Buffer (e.g., RIPA buffer) [66]
- Protease Inhibitor Cocktail [66]
- Phosphatase Inhibitor Cocktail (Essential for phosphorylated proteins) [66]
- PBS [66]
- Dithiothreitol (DTT) [66]
- Concentrated Loading Buffer [66]
- BCA or Bradford Assay Kit [66]
Steps:
- Prepare Lysis Buffer: Add protease and phosphatase inhibitors to ice-cold lysis buffer immediately before use [66].
- Harvest Cells: Wash adherent or suspension cells with ice-cold PBS. Centrifuge at 100–500 x g for 5 minutes at 4°C and aspirate the supernatant [66].
- Lyse Cells: Resuspend the cell pellet in lysis buffer (~1 mL per 1x10⁷ cells). Incubate for 10 minutes at 4°C with constant rocking [66].
- Clarify Lysate: Centrifuge the suspension at 14,000–17,000 x g for 5–10 minutes at 4°C. Transfer the supernatant (the lysate) to a fresh tube kept on ice. Discard the insoluble pellet [66].
- Determine Protein Concentration: Use a BCA or Bradford assay to determine the protein concentration of the lysate [66] [67].
- Prepare Samples: Dilute lysate aliquots in loading buffer containing DTT to a final concentration of 1–2 mg/mL. Denature samples by heating at 100°C for 10 minutes [66].
Stage 2: Gel Electrophoresis and Protein Transfer
Materials Required:
- SDS-PAGE Gel (e.g., 4-12% Bis-Tris gradient gel for Histone H3) [66]
- Molecular Weight Marker [66]
- Gel Running Apparatus [66]
- Appropriate Running Buffer (e.g., MES or MOPS) [66]
- Nitrocellulose or PVDF Membrane [66] [67]
- Transfer Buffer [66]
Steps:
- Load and Run Gel: Load an equal amount of protein (10–40 µg for lysates) into the gel wells alongside a molecular weight marker [66]. Run the gel according to the manufacturer's instructions. For a 4-12% Bis-Tris gel, use MES or MOPS buffer and run at 200V for approximately 20 minutes [68].
- Transfer Proteins: Transfer proteins from the gel to a nitrocellulose or PVDF membrane using a wet/tank, semi-dry, or dry transfer system. Efficient transfer is crucial for detection [67]. For wet transfer, typical conditions are 100V for 60-90 minutes on ice [66].
Stage 3: Immunodetection of Phospho-Histone H3 (Ser10)
Materials Required:
- Blocking Buffer (e.g., 5% BSA or non-fat dry milk in TBST)
- Primary Antibody: Phospho-specific (e.g., Phospho-Histone H3 (Ser10)) [63]
- Primary Antibody: Pan-specific (e.g., Total Histone H3) [63]
- HRP-conjugated Secondary Antibody [66]
- Chemiluminescent Substrate (e.g., SuperSignal West Dura) [68]
Steps:
- Block Membrane: Incubate the membrane in an appropriate blocking buffer for 1 hour at room temperature to prevent non-specific antibody binding [66].
- Incubate with Primary Antibodies: Probe the membrane with phospho-specific and pan-specific primary antibodies diluted in blocking buffer. This can be done simultaneously if host species differ, or sequentially. Incubate overnight at 4°C with gentle agitation [63] [66].
- Wash Membrane: Wash the membrane several times with TBST to remove unbound antibody [66].
- Incubate with Secondary Antibody: Incubate with an HRP-conjugated secondary antibody, diluted optimally (e.g., 1:50,000 to 1:250,000) in blocking buffer, for 1 hour at room temperature [68].
- Wash Membrane: Perform multiple washes with TBST to remove unbound secondary antibody [66].
Stage 4: Detection, Imaging, and Quantification
Steps:
- Detect Signal: Incubate the membrane with a stable, high-sensitivity chemiluminescent substrate such as SuperSignal West Dura, which is ideal for quantitative applications due to its wide dynamic range and linearity [68].
- Capture Image: Image the blot using a digital imaging system. It is critical to avoid overexposure, which leads to signal saturation and prevents accurate quantification [68] [67]. Capture multiple exposures if necessary.
- Quantify Band Intensity:
- Normalize Data:
- For PTM analysis, normalize the signal from the phospho-specific antibody (e.g., Phospho-Histone H3 (Ser10)) to the signal from the pan-specific antibody (e.g., Total Histone H3) for the same sample [63].
- This generates a normalized phospho-protein level for each sample, correcting for total protein abundance and loading variations [63] [67].
Quantitative Analysis and Normalization Strategies
Accurate quantification of western blots is essential for comparing PTM states across experimental conditions. Key parameters must be optimized to ensure data are within a linear range.
Optimization for Quantitative Western Blotting
Table 2: Key Parameters for Quantitative Western Blot Optimization
| Parameter | Consideration | Recommendation |
|---|---|---|
| Protein Load | Signal saturation occurs with excess protein [68]. | Load 1-10 µg per well. Optimize load based on target abundance; high-abundance proteins require less material [68]. |
| Antibody Dilution | High antibody concentration causes saturation, high background, and short signal duration [68]. | Titrate both primary and secondary antibodies. Excessive dilution can reduce sensitivity for low-abundance targets [68]. |
| Detection Substrate | Standard ECL may lack sensitivity; ultra-sensitive substrates can easily saturate [68]. | Use a substrate with a wide dynamic range (e.g., SuperSignal West Dura) for quantitative applications [68]. |
| Image Acquisition | Overexposure saturates pixels, making quantification impossible [67]. | Capture images at multiple exposure times to ensure bands are not saturated. Use the non-saturated image for analysis [67]. |
Normalization Methods for Accurate PTM Quantification
Normalization corrects for technical variations and is fundamental for reliable results [68] [67]. The choice of normalization method depends on the experimental context.
- PTM-Specific Normalization: The most robust method for PTM analysis is to normalize the signal from the modification-specific antibody to the signal from the total protein antibody in the same sample lane [63]. This calculates the proportion of the protein that is modified, independent of the total protein expression level.
- Total Protein Normalization (TPN): This method normalizes the target signal to the total protein loaded in each lane, using a fluorescent total protein stain (e.g., No-Stain Protein Labeling Reagent) applied to the membrane before immunodetection [68] [67]. TPN is highly reliable as it is not subject to changes in housekeeping protein expression and offers a wide linear dynamic range [68].
- Housekeeping Protein (HKP) Normalization: This traditional method uses antibodies against constitutively expressed proteins (e.g., β-Actin, GAPDH, α-Tubulin) as loading controls [68] [67]. A significant limitation is that the expression of many common HKPs can vary under experimental conditions or between tissue types, leading to inaccurate normalization [68]. Furthermore, HKP signals can easily saturate at common loading amounts [68].
Calculating Relative Expression:
- Obtain background-subtracted density values for the target phospho-band and its corresponding total protein band (or HKP/TPN signal) [67].
- For each sample, calculate the normalized density: Normalized Density = (Target Band Density) / (Normalization Control Band Density).
- Calculate the fold change relative to the control sample: Fold Change = (Normalized Density of Sample) / (Normalized Density of Control) [67].
Table 3: Key Research Reagent Solutions for PTM Analysis in Apoptosis
| Item | Function/Application |
|---|---|
| Phosphatase Inhibitor Cocktail | Added to lysis buffer to preserve protein phosphorylation by inhibiting endogenous phosphatases during sample preparation [66]. |
| Phospho-Specific Antibody Pairs | Matched antibodies: one specific for the PTM (e.g., phosphorylation) and one for the total protein regardless of modification state. Allows for normalization and assessment of activation state [63]. |
| Validated Primary Antibodies | Antibodies specific for apoptotic proteins (e.g., caspases, BCL-2 family) and their PTMs (e.g., Phospho-p53 (Ser15)), which are validated for high specificity and sensitivity in western blotting [63]. |
| Chemiluminescent Substrate (Extended Duration) | A substrate for HRP that provides a strong, stable signal with a wide dynamic range, enabling accurate quantification of both high- and low-abundance proteins [68]. |
| Total Protein Stain | A fluorescent reagent used to label and quantify the total amount of protein in each lane, serving as a superior normalization control compared to traditional housekeeping proteins [68]. |
Solving Common Challenges in Apoptosis Western Blotting: From Weak Signals to Specificity
Within the context of cancer research, the accurate detection of apoptotic proteins via western blotting is crucial for understanding drug mechanisms, resistance, and cellular fate. However, researchers frequently encounter the challenge of weak or non-detectable signals when studying key low-abundance regulators of apoptosis, such as Bcl-2 family proteins, caspases, and other initiators of cell death. The inherent low expression levels of these proteins, coupled with rapid turnover and transient activation states, often place them below the detection limit of standard western blot protocols [69] [19]. This application note provides a detailed, optimized framework for enhancing the sensitivity and reliability of western blot detection for low-abundance apoptotic proteins, with specific methodologies framed within cancer research applications.
Key Challenges and a Strategic Framework
Detecting low-abundance apoptotic proteins presents unique hurdles. Proteins like Bcl-2 may be highly expressed only in specific cancer cell lines, and their detection can be confounded by post-translational modifications, cleavage, or localization within specific subcellular compartments such as the mitochondria [19]. Furthermore, the rapid degradation of activated caspases or the transient nature of pro-apoptotic signals necessitates protocols that maximize sensitivity and minimize degradation.
A successful detection strategy requires a holistic, multi-faceted approach that optimizes every stage of the western blotting process. The table below summarizes the core strategic pillars for addressing weak signals from low-abundance apoptotic targets.
Table 1: Strategic Framework for Detecting Low-Abundance Apoptotic Proteins
| Strategic Pillar | Key Optimization Approaches | Primary Application in Apoptosis Research |
|---|---|---|
| Sample Preparation & Enrichment | Protein stabilization via inhibitors; subcellular fractionation; sample concentration; use of 5X loading buffer [69] [44]. | Prevents degradation of caspases and Bcl-2 family proteins; enriches mitochondrial fractions for intrinsic pathway components. |
| Electrophoresis & Transfer | Use of gradient gels (e.g., 4-20% Tris-Glycine); optimized transfer for high or low MW proteins; PVDF membranes [69] [70]. | Improved resolution of protein complexes and cleaved fragments (e.g., Caspase-3 vs. cleaved Caspase-3). |
| Antibody & Detection | High-affinity, validated antibodies; increased antibody concentration; sensitive chemiluminescent substrates; optimized blocking [69] [71] [72]. | Critical for detecting low-level proteins and specific post-translational modifications (e.g., phosphorylated Bcl-2). |
Detailed Experimental Protocols
Optimized Sample Preparation for Apoptotic Proteins
Effective sample preparation is the foundation for detecting low-abundance proteins, designed to stabilize targets and maximize yield [69].
- Inhibitor Cocktails: To prevent rapid degradation of apoptotic proteins, add a broad-spectrum protease inhibitor cocktail and a phosphatase inhibitor cocktail (e.g., 1 mM PMSF, 1-10 µg/ml Leupeptin, 1 mM Sodium Orthovanadate) directly to the ice-cold lysis buffer [44]. This is especially critical for proteins like caspases that are activated and cleaved during apoptosis.
- Lysis Buffer Selection: The choice of lysis buffer should be informed by the subcellular location of the target apoptotic protein.
- Mechanical Disruption: For robust lysis, particularly for nuclear or membrane-associated proteins, utilize ultrasonication (e.g., 3s pulse, 10s interval, 5-15 cycles at 40 kW) or Dounce homogenization to ensure complete protein release [69] [44].
- Sample Denaturation: After determining protein concentration via Bradford or BCA assay, use a 5X Laemmli sample buffer to avoid excessive dilution of the lysate. For most apoptotic proteins, denature at 100°C for 10 minutes. However, for multi-transmembrane domain proteins, avoid boiling and instead incubate at 70°C for 10-20 minutes or at room temperature to prevent aggregation [69].
Gel Electrophoresis and Membrane Transfer
Optimal separation and transfer are vital for resolution and sensitivity.
- Gel Selection: For most apoptotic proteins (e.g., Bcl-2 ~26 kDa, Bax ~21 kDa, Cleaved Caspase-3 ~17/19 kDa), a 4-20% Tris-Glycine gradient gel is recommended for superior resolution across a broad molecular weight range [70]. For high molecular weight proteins (>200 kDa), such as some initiator caspases or their complexes, 3-8% Tris-Acetate gels are more appropriate [70].
- Sample Loading: Increase the total protein load to 50-100 µg per lane to enhance the target protein signal. Using a 1.5 mm comb allows for a larger loading volume [69].
- Membrane Transfer: Use PVDF membranes due to their higher protein-binding capacity compared to nitrocellulose, which is beneficial for low-abundance targets [69]. Ensure pre-wetting in 100% methanol before use. For transfer, a semi-dry or wet transfer system at 4°C is suitable. Incorporate 0.1% SDS into the transfer buffer and consider reducing methanol to 5-10% to improve the elution and binding of larger proteins [19].
Antibody Incubation and Signal Detection
This stage requires precise optimization to maximize the signal-to-noise ratio for faint bands.
- Blocking: Block the membrane for 1 hour at room temperature with 5% non-fat milk or BSA in TBST. In some cases, 5% non-fat milk powder can provide superior blocking compared to BSA [19]. If the signal remains weak, reducing the blocking concentration or duration may help prevent epitope masking [69].
- Primary Antibody Incubation: Use a higher concentration of the primary antibody than the manufacturer's standard recommendation. A good starting point is to reduce the dilution ratio by 50%. Incubate overnight at 4°C with gentle shaking [69]. Always use freshly diluted antibodies for maximum activity [69].
- Secondary Antibody and Detection: Use a higher concentration of an HRP-conjugated secondary antibody and incubate for 1 hour at room temperature. Ensure that no sodium azide is present in any buffers, as it inhibits HRP activity [69]. For the final detection, use an enhanced chemiluminescent (ECL) substrate that offers high sensitivity and a strong, stable signal. Optimize exposure times to capture faint bands without saturating the background [72].
Visualization of the Optimization Workflow
The following diagram illustrates the critical decision points and optimization steps in the western blot workflow for detecting low-abundance apoptotic proteins.
The Scientist's Toolkit: Research Reagent Solutions
Selecting the appropriate reagents is critical for the success of these sensitive assays. The following table details essential materials and their specific functions in the context of apoptosis protein detection.
Table 2: Essential Research Reagents for Apoptosis Western Blotting
| Reagent / Material | Function & Application Note |
|---|---|
| Protease/Phosphatase Inhibitor Cocktail | Prevents degradation and dephosphorylation of labile apoptotic targets (e.g., cleaved caspases, phospho-Bad) during lysis [69] [44]. |
| RIPA Lysis Buffer | Effective for solubilizing a wide range of proteins, including membrane-bound apoptotic regulators like Bcl-2 from whole cell, membrane, and nuclear extracts [44]. |
| PVDF Membrane | Preferred over nitrocellulose for its superior protein-binding capacity, thereby enhancing the signal for low-abundance proteins [69]. |
| Validated Primary Antibodies | High-affinity antibodies validated for western blotting are essential. Check databases for confirmed expression in your model system [71] [19]. |
| HRP-conjugated Secondary Antibodies | Used with enhanced chemiluminescent substrates for high-sensitivity detection. Ensure host species matches the primary antibody [70]. |
| Enhanced Chemiluminescent (ECL) Substrate | Provides high sensitivity and a strong light signal for detection of faint bands on film or digital imaging systems [72]. |
| Tris-Glycine Gradient Gels (4-20%) | Ideal for resolving a broad size range of proteins, from small cleaved fragments (e.g., tBid) to larger initiator proteins, on a single gel [70]. |
The detection of low-abundance apoptotic proteins in cancer research demands a meticulously optimized western blot protocol that goes beyond standard procedures. By implementing the strategies outlined here—from rigorous sample preparation with specific inhibitors to the use of high-binding-capacity PVDF membranes and sensitive detection systems—researchers can significantly enhance their ability to visualize and quantify critical, yet elusive, components of the apoptotic machinery. This systematic approach to increasing sensitivity and reliability provides a powerful tool for advancing our understanding of cell death pathways in cancer biology and therapeutic development.
Troubleshooting High Background and Non-Specific Bands in Complex Lysates
In cancer research, the accurate analysis of apoptosis via western blot is paramount for evaluating therapeutic efficacy and understanding drug mechanisms. However, this analysis is frequently compromised when working with complex protein lysates derived from tumor samples or cultured cancer cells, which often result in high background and non-specific bands [73] [74]. These artifacts can obscure critical data on key apoptotic regulators like caspases and Bcl-2 family proteins, leading to misinterpretation of experimental outcomes. The intricate nature of these lysates, rich in diverse cellular components, increases the potential for non-specific antibody interactions and high background noise, posing a significant challenge for researchers and drug development professionals aiming to generate quantitative, publication-quality data [37] [20]. This application note provides a systematic, evidence-based framework to diagnose and rectify these common issues, with a specific focus on applications in oncological protein analysis.
Troubleshooting Guide: Diagnosis and Solutions
High Background
High background appears as a uniform haze or dark stormy sky, obscuring specific bands and making quantitation difficult [73].
Table 1: Troubleshooting High Background
| Cause | Specific Examples in Apoptosis Research | Recommended Solutions |
|---|---|---|
| Insufficient Blocking [73] [75] | Failure to block nonspecific sites on membrane, especially critical for detecting low-abundance apoptotic signals (e.g., cleaved caspases). | Increase blocking time to at least 1 hour at room temperature or overnight at 4°C [75]. Use a sufficient volume of blocking buffer to fully cover the membrane. |
| Excessive Antibody Concentration [73] [75] | Too much primary or secondary antibody floods the blot, causing widespread nonspecific binding. | Titrate both primary and secondary antibodies. Reduce concentration by 2X to 5X and test. Use a secondary-only control to identify the source [73]. |
| Suboptimal Blocking Agent [73] [75] | Milk contains casein (a phosphoprotein) and biotin, which can cross-react with phospho-specific antibodies (e.g., p53 phospho-specific antibodies) or avidin-biotin detection systems. | Switch from milk to BSA for phosphorylated apoptosis markers (e.g., phospho-Bcl-2) [73] [75]. Consider engineered, protein-free blocking buffers for difficult antibodies [74]. |
| Inadequate Washing [73] [75] | Unbound antibodies are not thoroughly removed, contributing to overall background. | Increase wash frequency and duration (e.g., 5-6 washes for 5-10 minutes each) with fresh TBST under gentle agitation [73]. Ensure Tween-20 is at a 0.05% concentration in wash buffers [75]. |
| Contaminated Buffers or Equipment [73] | Bacterial or algal growth in old TBS/Tween solutions, or dirty incubation trays. | Prepare fresh, filtered buffers before each use. Clean all trays and containers thoroughly [73]. |
| Membrane Handling [75] | PVDF membrane dried out during the procedure, causing proteins to permanently stick and create blotchy staining. | Keep the membrane fully wet and covered with liquid at all times. Use gloves and forceps to handle. Use agitation during all incubations [75]. |
Non-Specific Bands
Non-specific bands are extra, unexpected bands at incorrect molecular weights, which can be mistaken for specific protein isoforms or cleavage products, a common pitfall in apoptosis studies where protein cleavage is a hallmark of the process [73] [74].
Table 2: Troubleshooting Non-Specific Bands
| Cause | Specific Examples in Apoptosis Research | Recommended Solutions |
|---|---|---|
| Low Antibody Specificity [73] [74] | Polyclonal antibodies may recognize multiple epitopes on related proteins (e.g., cross-reactivity between different caspase family members). | Use antibodies validated for western blotting in denaturing conditions [75]. Increase antibody dilution and extend incubation time at 4°C to favor specific binding [74]. |
| Protein Degradation [75] | Apoptotic samples are rich in proteases, leading to protein cleavage and smearing or multiple lower molecular weight bands. | Always use fresh, complete protease inhibitor cocktails during cell lysis. Keep samples on ice and avoid repeated freeze-thaw cycles. |
| Post-Translational Modifications (PTMs) or Isoforms [73] | The target protein may exist in phosphorylated, glycosylated, or ubiquitinated states (e.g., multiple phosphorylated forms of BAD), which can cause shifted or multiple bands. | Consult literature on known PTMs for your protein. Treat samples with phosphatases (for phosphorylation) or use specific antibodies to distinguish forms. |
| Excessive Protein Load [75] [76] | Overloading lanes with complex lysate increases the number of potential off-target antigens. | Load less protein per lane (e.g., 10-20 µg for abundant proteins, up to 50 µg for low-abundance targets) [73] [75]. |
| Incomplete Blocking [74] | Antibodies bind nonspecifically to the membrane or to non-target proteins in the lysate. | Ensure complete blocking. Consider switching to an engineered blocking buffer designed to minimize non-specific interactions [74]. |
Detailed Experimental Protocols
Protocol 1: Optimized Blocking and Antibody Incubation for Apoptosis Markers
This protocol is designed to minimize background and non-specificity when probing for key apoptotic regulators.
Reagents:
- TBST (Tris-Buffered Saline with 0.1% Tween-20)
- Blocking Buffer: 5% BSA in TBST for phosphorylated proteins (e.g., phospho-p53); otherwise, 5% non-fat milk in TBST can be tested.
- Primary Antibody Diluent: 1-5% BSA in TBST.
- Secondary Antibody Diluent: 5% non-fat milk or 1% BSA in TBST.
Procedure:
- Electrophoresis and Transfer: Separate 20-50 µg of total protein lysate via SDS-PAGE and transfer to a PVDF or nitrocellulose membrane using standard wet or semi-dry transfer methods [77].
- Blocking: Immediately after transfer, incubate the membrane in a sufficient volume of blocking buffer (e.g., 10 mL for a mini-gel) for 1 hour at room temperature with gentle agitation. For challenging antibodies, extend blocking overnight at 4°C [75].
- Primary Antibody Incubation:
- Prepare the primary antibody in the appropriate antibody diluent (BSA is preferred for phospho-proteins).
- Incubate the membrane with the primary antibody solution for 1 hour at room temperature or overnight at 4°C on a shaker. Overnight incubation at 4°C often enhances specificity [73] [74].
- Titration is critical: If experiencing high background or non-specific bands, test a series of antibody dilutions (e.g., 1:500, 1:1000, 1:2000) to find the optimal signal-to-noise ratio [73].
- Washing: Wash the membrane three times with TBST for 5-10 minutes each under vigorous agitation. For persistent background, increase to 5-6 washes [73].
- Secondary Antibody Incubation:
- Dilute the HRP-conjugated or fluorescent-conjugated secondary antibody in its diluent.
- Incubate the membrane for 1 hour at room temperature with gentle agitation. Avoid prolonged incubation.
- Perform another series of three 5-10 minute washes with TBST.
- Detection: Proceed with chemiluminescent or fluorescent detection according to your system's specifications.
Protocol 2: Dot Blot for Rapid Antibody and Blocking Buffer Validation
Before committing to a full western blot, use this quick dot blot protocol to validate antibody specificity and blocking efficiency, saving time and reagents.
Procedure:
- Prepare Membrane: Cut a small strip of PVDF membrane. Activate it in 100% methanol for 15 seconds, rinse in distilled water, and equilibrate in TBST.
- Apply Dots: Using a pipette, apply 1-2 µL of your positive control lysate (e.g., a known apoptotic cell lysate), negative control lysate, and if possible, a purified antigen sample at known concentrations onto the membrane. Let the spots air dry completely.
- Blocking Test: Divide the membrane into sections. Block each section with a different blocking buffer you wish to test (e.g., 5% Milk, 5% BSA, Commercial Blocking Buffer).
- Incubate with Antibodies: Follow the same antibody incubation and washing steps as in a standard western blot. You can test different primary antibody concentrations on different sections.
- Detection and Analysis: Develop the membrane. A good antibody/blocking buffer combination will show a strong, clean dot for the positive control and no signal for the negative control. High background across the entire membrane section indicates an unsuitable blocking buffer or antibody concentration [73].
Visual Workflows and Signaling Pathways
Experimental Workflow for Troubleshooting Immunoblots
The diagram below outlines a systematic, decision-tree-based workflow for diagnosing and resolving high background and non-specific bands.
Apoptotic Signaling Pathway in Cancer
Understanding the key proteins in apoptosis provides context for interpreting western blot results in cancer research. Non-specific bands can be misinterpreted as cleavage products or isoforms of these critical regulators.
The Scientist's Toolkit: Essential Reagents for Quality Apoptosis Blots
Table 3: Key Research Reagent Solutions
| Reagent | Function & Rationale | Application Notes for Apoptosis Research |
|---|---|---|
| BSA Blocking Buffer [73] [75] | Reduces background by blocking nonspecific sites on the membrane. Unlike milk, it lacks phosphoproteins and biotin. | Essential for detecting phosphorylated apoptosis markers (e.g., phospho-p53, phospho-Bcl-2). Prevents cross-reactivity. |
| Protease Inhibitor Cocktail [77] | Prevents proteolytic degradation of proteins during sample preparation by inhibiting a broad spectrum of proteases. | Critical in apoptotic samples where caspases and other proteases are highly active, preventing artifactual bands and smearing. |
| Phosphatase Inhibitors | Prevents dephosphorylation of proteins during sample preparation, preserving post-translational modification states. | Required in addition to protease inhibitors when analyzing phosphorylation status in signaling studies. |
| HRP-Conjugated Secondary Antibodies | Enables detection of the primary antibody bound to the target protein via chemiluminescence. | Ensure host species matches the primary antibody. Avoid sodium azide in storage buffers, as it inhibits HRP activity [73] [75]. |
| Ponceau S Stain [73] | Reversible stain for total protein on the membrane after transfer. | Provides a quick check of transfer efficiency and equal loading before proceeding with costly antibody steps. |
| No-Stain Protein Labeling Reagent [37] | Fluorescent label for total protein on the membrane. | Enables Total Protein Normalization (TPN), the gold standard for quantitation, overcoming variability of housekeeping proteins (e.g., GAPDH, Actin) in cancer cells [37]. |
| Engineered Blocking Buffers [74] | Specialty buffers designed to maximize signal-to-noise ratio by effectively reducing non-specific binding. | A solution for stubborn antibodies that produce high background even with BSA or milk blockers. |
In the western blot analysis of apoptosis in cancer research, accurate interpretation of protein data is foundational. A common challenge faced by researchers is the discrepancy between a protein's calculated molecular weight and its observed migration on a blot. The tumor suppressor p53 serves as a quintessential example; while its amino acid sequence predicts a mass of approximately 44 kDa, it consistently migrates at 53 kDa on SDS-PAGE gels [78]. This apparent anomaly is not an error but a critical feature of its biology, influenced by its high concentration of proline residues and extensive post-translational modifications (PTMs) that alter its electrophoretic mobility [78]. Misinterpretation of these discrepancies can lead to false conclusions about protein identity, expression levels, or the presence of isoforms and mutants, ultimately compromising research validity. This application note provides a detailed framework for understanding, investigating, and validating such molecular weight differences, with a specific focus on proteins central to apoptosis and cancer research.
Core Concepts: Why Observed and Predicted Molecular Weights Diverge
The migration of a protein in an SDS-PAGE gel is influenced by multiple factors beyond its simple amino acid count. Understanding these factors is the first step in accurate data validation.
Key Factors Causing Molecular Weight Discrepancies
- Post-Translational Modifications (PTMs): Proteins can be modified with chemical groups that add mass and alter charge. p53 is a notable example, undergoing phosphorylation, acetylation, and ubiquitination, which collectively contribute to its observed higher molecular weight [79]. For instance, phosphorylation at multiple sites (Ser15, Ser20, Ser37, etc.) in response to DNA damage is a well-documented characteristic of p53 [79].
- Amino Acid Composition: SDS binding is proportional to protein mass, but the resulting charge-to-mass ratio can be skewed by an atypical amino acid composition. p53 has a relatively high proline content, which can cause the protein to migrate more slowly than expected [78].
- Protein Isoforms: Many genes, including TP53, encode for multiple isoforms through alternative splicing or the use of alternative promoters. Research has identified a Δp53 isoform of 45 kDa and another isoform of approximately 29 kDa in breast cancer samples, which can appear as additional bands on a blot [80].
- Mutant Proteins: In cancer cell lines, p53 is frequently mutated. These mutations can lead to truncations, deletions, or aggregations that result in bands at "slightly different sizes" [78].
The following diagram illustrates the decision-making process for investigating an unexpected band on a western blot.
Essential Protocols for Validation
Robust validation is critical to confirm the identity of a protein and the specificity of its detection. The protocols below outline a systematic approach.
Protocol 1: Validating Antibody Specificity with Genetic Knockout
This is the gold standard for confirming that an antibody signal is specific to the target protein.
- Primary Antibody: Anti-p53 antibody (e.g., ab131442, 10442-1-AP, or #9282) [81] [78] [79].
- Cell Lysates:
- Procedure:
- SDS-PAGE: Load 20 µg of each lysate onto a polyacrylamide gel and perform electrophoresis [81].
- Transfer: Transfer proteins to a nitrocellulose or PVDF membrane.
- Blocking: Block membrane with 5% BSA or non-fat dry milk in TBST for 1 hour at room temperature.
- Primary Antibody Incubation: Incubate with anti-p53 antibody at the recommended dilution (e.g., 1:1000 for ab131442 [81]) overnight at 4°C with gentle agitation.
- Washing: Wash membrane 3 times for 5 minutes each with TBST.
- Secondary Antibody Incubation: Incubate with an appropriate HRP-conjugated or fluorescently-labeled secondary antibody (e.g., 1:20000 dilution [81]) for 1 hour at room temperature.
- Detection: Develop using chemiluminescent or fluorescent substrate and image.
- Expected Result: A band at ~53 kDa should be present in the positive control and test lysate but absent in the TP53 knockout lysate [81].
Protocol 2: Distinguishing p53 Isoforms and Mutants
This protocol helps characterize the various forms of p53 that may be expressed in cancer samples.
- Key Reagents:
- Antibodies: Use a combination of antibodies that recognize different p53 epitopes or states.
- Procedure:
- Prepare nuclear extracts from tumor tissues or cancer cell lines using differential centrifugation [80].
- Resuspend the nuclear pellet in buffer containing PMSF and Triton X-100 [80].
- Follow standard western blot procedure as in Protocol 1.
- Analyze the blot for bands at the canonical 53 kDa size, as well as other common isoforms, such as ~45 kDa and ~29 kDa [80].
- Interpretation: The presence of the 45 kDa or 29 kDa isoforms has been correlated with more aggressive disease and lymph node metastasis in breast cancer [80].
Quantitative Western Blot Analysis and Normalization
For accurate quantification of protein expression, proper normalization is essential. The field is moving away from traditional housekeeping proteins (HKPs) like GAPDH and β-actin due to their variable expression under different experimental conditions [37].
- Gold Standard Normalization: Total Protein Normalization (TPN) is now recommended by leading journals. TPN normalizes the target protein signal to the total amount of protein present in each lane, which is not affected by experimental manipulations and provides a larger dynamic range [37] [82].
- Implementation: TPN can be achieved using a total protein stain (e.g., No-Stain Protein Labeling Reagent) on the blot membrane or the gel itself, followed by high-resolution imaging [37].
- Validation for Quantitation: Ensure your western blot is operating within the linear range of detection for both your target antibody and the normalization method. This requires determining the range where signal intensity is directly proportional to the amount of protein loaded [82] [83].
Research Reagent Solutions
The following table details essential reagents and their applications for the study of p53 and apoptosis via western blot.
| Reagent Type | Specific Examples | Function & Application Notes |
|---|---|---|
| p53 Antibodies | • P53 Antibody (10442-1-AP) [78]• p53 Antibody #9282 [79]• Anti-p53 antibody (ab131442) [81] | • Detect total p53 in WB, IHC, IP.• Antibody #9282 binding mapped to the amino terminus and DNA binding domain.• ab131442 is KO-validated for confirmed specificity. |
| Mutant p53 Antibody | • Pab240 (sc-99) [80] | Preferentially detects mutant, conformationally-changed p53. |
| Control Cell Extracts | • Jurkat Apoptosis Cell Extracts (etoposide) #2043 [27]• Caspase-3 Control Cell Extracts #9663 [27] | • Positive controls for apoptosis markers (e.g., cleaved caspases, PARP).• Essential for confirming experimental induction of cell death pathways. |
| Normalization Reagents | • No-Stain Protein Labeling Reagent [37]• Anti-GAPDH (loading control) [81] | • For Total Protein Normalization (TPN), the new gold standard.• Traditional HKP; validate for consistent expression under your experimental conditions. |
| Validation Lysates | • TP53 knockout HAP1 cell lysate [81]• Saos-2 (p53 null) cell lysate [81] | Critical negative controls for confirming antibody specificity via genetic knockout. |
Data Presentation and Publication Standards
Adherence to journal guidelines is critical for publication. Here are key requirements for western blot data:
- Image Integrity: Avoid high-contrast images that may mask additional bands. Minimal image processing is allowed; adjustments must be applied to the entire image and never obscure the original data [37].
- Lane Presentation: If lanes are rearranged from different parts of the same gel, this must be clearly indicated by black lines between the lanes. Over-cropping of images is prohibited; important bands and at least one molecular weight marker must be visible [37].
- Normalization: Be prepared to use and report Total Protein Normalization (TPN), as it is increasingly required by top-tier journals [37].
- Data Reporting: Provide detailed descriptions of antibodies (e.g., catalog number, host species, dilution) and methods. Quantitative comparisons should only be made between samples on the same gel/blot [37].
The consistent migration of p53 at 53 kDa, despite a lower predicted mass, is a powerful reminder that western blot analysis requires more than a simple comparison to a molecular weight ladder. A deep understanding of protein biology, rigorous validation of reagents, and the application of modern quantitative techniques are all indispensable. By employing the protocols and guidelines outlined here—from genetic knockout validation to the adoption of total protein normalization—researchers can confidently navigate molecular weight discrepancies. This rigorous approach ensures the generation of reliable, high-quality data that advances our understanding of apoptosis and cancer biology, and meets the stringent standards of contemporary scientific publication.
Within the field of cancer research, particularly in the study of apoptosis, a significant challenge is the reliable detection of low-abundance protein targets. These proteins, often critical signaling molecules or regulators of cell death, are frequently expressed at levels that push the boundaries of conventional Western blotting methodology. The lessons learned from optimizing detection for tissue factor (TF), a key initiator of coagulation expressed at low levels in various cells, provide a valuable framework for overcoming similar challenges in apoptosis research. This article details specific, actionable protocols and strategies, derived from rigorous TF studies, to empower researchers in their pursuit of robust and reproducible data for low-expressing targets in cancer pathways.
Key Optimization Strategies from Tissue Factor Research
Recent methodological research on detecting tissue factor highlights that success relies on a holistic optimization of the entire Western blot workflow. A study systematically testing three anti-human TF antibodies found that sensitivity was significantly affected by various factors, including blocking conditions, the detection method, and the choice of primary and secondary antibodies [84]. Among the tested antibodies, the rabbit monoclonal antibody (clone EPR22548-240) demonstrated superior performance in evaluating TF in low-expressing cell lines, underscoring the critical importance of antibody selection [84] [71].
The general principles for detecting low-abundance targets are well-established. The entire process, from protein extraction to final detection, must be fine-tuned to maximize signal-to-noise ratio [85]. Key areas for optimization include using efficient protein extraction methods to prevent protein loss, selecting gel chemistries that offer optimal resolution for the target protein's size, ensuring complete transfer to a membrane with high binding capacity, and employing high-sensitivity detection substrates [85]. The following table summarizes the core strategies adopted from TF research and their application to apoptotic target detection.
Table 1: Key Optimization Strategies for Low-Abundance Protein Detection
| Optimization Area | Key Strategy | Application to Apoptosis Targets |
|---|---|---|
| Antibody Selection | Use of highly specific, validated monoclonal antibodies [84]. | Critical for detecting specific cleaved forms (e.g., cleaved caspase-3) versus full-length proteins (e.g., pro-caspase-3) [1]. |
| Sample Preparation | Enrichment of target protein; use of protease inhibitors; optimized lysis buffers [69]. | Prevents degradation of labile apoptotic regulators like Bcl-2 family proteins or cleaved PARP [1] [69]. |
| Gel Electrophoresis | Use of neutral-pH Bis-Tris gels for better protein integrity and resolution [85]. | Improves separation of closely migrating cleaved and uncleaved protein forms. |
| Membrane Transfer | Use of PVDF membranes for higher protein binding capacity [69]. | Increases retention of low-abundance targets like phosphorylated Bcl-2. |
| Detection | Employing high-sensitivity chemiluminescent substrates [85]. | Enables visualization of faint bands from executioner caspases or other low-level markers. |
Experimental Protocols
Optimized Western Blot Protocol for Low-Abundance Targets
The following protocol synthesizes the critical steps from TF optimization and general low-abundance protein detection methods into a robust workflow suitable for apoptotic proteins [84] [69].
Stage 1: Sample Preparation
- Cell Lysis: Use an optimized lysis buffer (e.g., RIPA) supplemented with a broad-spectrum protease inhibitor cocktail to prevent protein degradation. For phosphorylated apoptotic markers (e.g., phospho-Bcl-2), also include a phosphatase inhibitor cocktail [69].
- Protein Release: Utilize a brief ultrasonication protocol (e.g., 3s pulse, 10s interval, repeated 5-15 times) to ensure complete disruption of cells and nuclei, facilitating the release of nuclear and membrane-associated proteins [69].
- Sample Concentration: Determine protein concentration using a Bradford or BCA assay. For low-abundance targets, increase the sample load to 50-100 µg per lane instead of the typical 20-30 µg [69].
- Sample Denaturation: After adding 5X loading buffer, for most proteins, boil samples at 100°C for 10 minutes. Note: For multi-transmembrane proteins, avoid boiling to prevent aggregation; instead, incubate at room temperature or 70°C [69].
Stage 2: Gel Electrophoresis and Transfer
- Gel Selection: For optimal resolution, use Bis-Tris gels with a neutral pH, which preserve protein integrity and provide sharper bands compared to traditional Tris-glycine gels [85]. For low molecular weight targets (e.g., cleaved caspases ~17 kDa), Tricine gels are superior [85].
- Protein Transfer: Transfer proteins to a PVDF membrane using a wet or semi-dry transfer system. PVDF has a higher protein-binding capacity than nitrocellulose, which is beneficial for retaining scarce targets. Remember to pre-wet the PVDF membrane in methanol before use [69].
Stage 3: Immunodetection
- Blocking: Block the membrane for 1 hour at room temperature in 5% blocking buffer (e.g., BSA or non-fat dry milk). To prevent masking of the target antigen, avoid over-blocking [69].
- Primary Antibody Incubation: Incubate with the primary antibody at a higher concentration than the manufacturer's standard recommendation. Dilute the antibody in a low-concentration (0-5%) blocking buffer and incubate overnight at 4°C with gentle shaking [69].
- Secondary Antibody Incubation: Incubate with an HRP-conjugated secondary antibody at a higher concentration for 1 hour at room temperature. Ensure no sodium azide is present in any buffers, as it inhibits HRP activity [69].
- Detection: Use a high-sensitivity chemiluminescent substrate (e.g., SuperSignal West Atto). These substrates can provide over 3 times more sensitivity than conventional ECL, enabling detection down to the attogram level [85].
Antibody Validation Experiment
A cornerstone of reproducible data, especially for low-abundance proteins, is rigorous antibody validation. The following workflow, essential for any study of apoptotic markers, should be performed prior to target analysis experiments [86].
Diagram 1: A workflow for validating antibodies for Western blotting, a critical step for ensuring reliable detection of low-abundance proteins.
Procedure:
- Test Specificity: Run the antibody on a panel of cell lines, including those known to express the target protein (positive control) and those that do not (e.g., CRISPR-Cas9 knockout cells, which serve as the gold standard negative control) [49].
- Verify Band Pattern: Confirm that the antibody detects a single band at the expected molecular weight. For apoptotic proteins like caspases, expect to see both the pro-form and the cleaved active form [1].
- Optimize Conditions: Use the validation experiment to determine the optimal antibody dilution and blocking conditions for your specific sample context.
The Scientist's Toolkit: Research Reagent Solutions
The following table details essential reagents and materials, as identified in the TF study and supporting literature, that are crucial for successful detection of low-expressing targets.
Table 2: Essential Research Reagents for Optimized Low-Abundance Protein Detection
| Reagent / Material | Function and Importance | Specific Recommendations |
|---|---|---|
| Validated Primary Antibodies | Binds specifically to the target protein. Monoclonal antibodies often offer higher specificity, as demonstrated in the TF study [84]. | Select antibodies validated for Western blotting. For apoptosis, use antibodies specific for cleaved forms (e.g., Cleaved Caspase-3, Cleaved PARP) [49] [1]. |
| High-Sensitivity Chemiluminescent Substrate | Generates light signal upon reaction with HRP-conjugated secondary antibody. High-sensitivity substrates greatly enhance detection limits [85]. | Use substrates like SuperSignal West Atto, reported to provide over 3x more sensitivity than conventional ECL [85]. |
| Protease & Phosphatase Inhibitors | Prevents proteolytic degradation and dephosphorylation of target proteins during sample preparation, preserving the protein of interest [69]. | Use broad-spectrum cocktails added fresh to the lysis buffer. |
| PVDF Membrane | Binds proteins after transfer. PVDF has a higher binding capacity than nitrocellulose, aiding in the retention of low-abundance proteins [69]. | Pre-wet in 100% methanol before use. |
| Neutral-pH Precast Gels (Bis-Tris) | Provides superior protein separation and sharper bands by minimizing protein modification and degradation during electrophoresis [85]. | Preferred over traditional Tris-glycine gels for better resolution and sensitivity. |
Apoptosis Signaling Pathways and Detection Logic
In cancer research, detecting apoptosis often involves monitoring key signaling pathways. The intrinsic pathway is frequently deregulated in cancer, making proteins like Bcl-2 family members and caspase-9 critical, though sometimes low-abundance, targets. The following diagram outlines the core intrinsic apoptosis pathway and the key markers detectable by Western blot.
Diagram 2: The intrinsic apoptosis pathway and key protein targets for Western blot analysis. Green nodes indicate proteins whose presence or cleavage status serves as direct markers on a blot.
Interpreting Western Blot Results for Apoptosis: When analyzing blots for apoptosis, focus on the characteristic band shifts that indicate protein activation [1]:
- Caspase Activation: Look for the disappearance of the pro-caspase band (e.g., ~35 kDa for caspase-9, ~32 kDa for caspase-3) and the appearance of a cleaved, active fragment (e.g., ~17/19 kDa for caspase-3) [1].
- PARP Cleavage: A hallmark of apoptosis is the cleavage of full-length PARP (116 kDa) into an 89 kDa fragment. A increasing ratio of cleaved to full-length PARP indicates active apoptosis [1].
- Quantification: Use densitometry software to quantify band intensities. Normalize the intensity of the cleaved protein (e.g., cleaved caspase-3) to a housekeeping protein (e.g., β-actin, GAPDH) or to the total protein (pro-form) to assess the level of activation [1].
The detection of low-expressing targets in apoptosis and cancer research is a demanding but surmountable challenge. By applying the lessons from tissue factor research—meticulous antibody validation, optimized sample preparation, and enhanced detection methodologies—researchers can significantly improve the sensitivity and reliability of their Western blot data. The protocols and strategies detailed herein provide a concrete pathway to uncover critical biological insights that would otherwise remain hidden in faint, non-reproducible bands. Embracing this rigorous, holistic approach to assay optimization is fundamental to advancing our understanding of complex apoptotic pathways and their roles in cancer biology and therapeutic response.
Western blot analysis remains an indispensable technique for detecting apoptosis in cancer research, providing critical insights into protein expression changes during programmed cell death. However, the inherent complexity of apoptotic signaling pathways and technical variability in immunoblotting necessitates rigorous control strategies to ensure data accuracy and biological relevance. Proper implementation of knockout/knockdown lysates and appropriate positive controls represents a fundamental requirement for distinguishing specific signals from non-specific background, validating antibody specificity, and enabling accurate quantification of apoptosis-related proteins. This application note details comprehensive methodologies and strategic frameworks for integrating these essential controls into apoptosis research workflows, with specific applications in cancer models including ovarian cancer, hepatocellular carcinoma, and lung cancer.
The Critical Role of Controls in Apoptosis Western Blotting
Challenges in Apoptotic Protein Detection
Apoptosis detection by western blot presents unique challenges that necessitate robust control strategies. The process involves multiple interconnected pathways with rapidly changing protein expression patterns, post-translational modifications, and protein cleavage events. Key apoptotic markers including caspases, Bcl-2 family proteins, and PARP undergo proteolytic processing or phosphorylation that alters their molecular weights and antibody recognition epitopes [1]. Without appropriate controls, researchers risk misinterpreting non-specific bands as specific signals or failing to detect subtle but biologically significant changes in apoptotic regulation.
Technical variability in sample preparation, protein loading, transfer efficiency, and antibody binding further complicates data interpretation. These challenges are particularly pronounced in cancer research, where apoptotic pathways are frequently dysregulated, and experimental interventions including gene knockout/knockdown can trigger complex compensatory mechanisms [87] [88].
Defining Control Types and Their Applications
Table 1: Categories of Experimental Controls for Apoptosis Western Blotting
| Control Type | Primary Function | Key Applications | Interpretation Guidelines |
|---|---|---|---|
| Knockout Lysates | Verify antibody specificity by demonstrating signal loss in genetically modified cells | Confirm target protein detection specificity; validate antibodies for new applications | Complete signal abolition confirms specificity; residual signal indicates non-specific binding |
| Knockdown Lysates | Establish partial reduction controls for RNAi experiments; monitor compensatory mechanisms | Validate siRNA/shRNA efficiency; assess partial pathway inhibition | Quantified reduction (typically 70-90%) confirms target engagement and tool validity |
| Positive Controls | Confirm technical success of detection system; establish expected band patterns | Validate experimental protocols; troubleshoot failed experiments | Presence of expected bands confirms system functionality; absence indicates technical issues |
| Induction Controls | Provide known apoptotic triggers to establish expected protein cleavage patterns | Validate detection of cleavage events (caspases, PARP); establish assay sensitivity | Appearance of characteristic cleavage fragments confirms apoptotic induction and detection capability |
Practical Implementation of Knockout/Knockdown Strategies
Validation of Knockout Cell Lysates for Antibody Specificity
Genetic knockout lysates serve as the gold standard for confirming antibody specificity in western blot applications. Commercial apoptosis pathway knockout panels provide well-characterized resources for this purpose, featuring lysates from HeLa cells with specific gene knockouts including BRE, PGAM5, and FAS [89]. The validation workflow involves parallel analysis of wild-type and knockout lysates under identical experimental conditions.
Protocol: Specificity Validation Using Knockout Lysates
- Sample Preparation: Prepare 20 μg of both wild-type and knockout cell lysates in appropriate loading buffer [89].
- Gel Electrophoresis: Perform SDS-PAGE separation using 10-12% gels suitable for the target protein's molecular weight.
- Membrane Transfer: Transfer proteins to PVDF or nitrocellulose membranes using standard protocols.
- Antibody Incubation: Incubate membranes with primary antibody targeting the protein of interest (e.g., 1:1000 dilution for anti-BRE antibody ab177960) and appropriate loading control (e.g., 1:20,000 dilution for α-tubulin) overnight at 4°C [89].
- Detection: Develop blots using fluorescently labeled secondary antibodies (e.g., 1:20,000 dilution) and image using appropriate detection systems.
The critical validation criterion is complete abolition of the target band in the knockout lane while maintaining expression of loading controls. For example, in BRE knockout HeLa lysates (ab257861), specific reactivity with anti-BRE antibody (ab177960) is lost while α-tubulin signal remains constant, confirming antibody specificity for the intended target [89].
Application of Knockdown Models in Cancer Research
Gene knockdown approaches using siRNA or shRNA provide valuable partial reduction controls that more closely mimic pharmacological inhibition and allow assessment of biological consequences in cancer models. In ovarian cancer research, FAM111B knockdown experiments demonstrated the functional role of this gene in tumorigenesis through comprehensive western blot analysis [87].
Case Study: FAM111B Knockdown in Ovarian Cancer
The FAM111B knockdown protocol illustrates the integration of controls within a cancer-relevant biological context:
- Lentiviral Transduction: Transfect ES-2 and A2780 ovarian cancer cell lines with FAM111B-targeting shRNA (sense: 5'-GCCTGCCTAGTGATTCTCATT-3', antisense: 5'-AATGAGAATCACTAGGCAGGC-3') or non-targeting control shRNA using lentiviral vectors at 10 TU/cell [87].
- Validation of Knockdown Efficiency: Confirm reduced FAM111B expression using western blot with primary antibody NBP1-86645 (Novus Biologicals) [87].
- Functional Assessment: Analyze downstream apoptotic markers and pathway components to establish biological consequences.
This approach demonstrated that FAM111B silencing constrained MYC expression, resulting in suppressed proliferation, migration, and invasion in ovarian cancer models [87]. The inclusion of non-targeting shRNA controls ensured that observed phenotypes were specifically attributable to FAM111B reduction rather than non-specific effects.
Technical Considerations for Control Implementation
Sample Preparation Consistency Maintain identical protein extraction protocols, buffer compositions, and handling procedures across all control and experimental samples. Use RIPA lysis buffer supplemented with PMSF and protease inhibitors to preserve protein integrity and prevent degradation during processing [87] [88].
Protein Quantification and Loading Employ precise protein quantification methods such as BCA assay to ensure equal loading across lanes [87] [43]. Consistent total protein loading (typically 20-30 μg per lane) is essential for valid comparisons between control and experimental samples.
Linear Detection Range Establish the linear dynamic range for both target proteins and loading controls to prevent signal saturation that can distort quantitative comparisons. For housekeeping proteins like GAPDH and β-actin, saturation can occur at relatively low loads (≥30 μg), necessitating careful optimization [37].
Advanced Normalization Strategies for Quantitative Apoptosis Analysis
Moving Beyond Traditional Housekeeping Proteins
While traditional normalization to housekeeping proteins (GAPDH, β-actin, α-tubulin) remains common, significant limitations have prompted development of superior alternatives. Housekeeping protein expression varies considerably with cell type, experimental conditions, and pathological states, potentially introducing normalization artifacts [37]. This is particularly problematic in apoptosis research, where cellular stress and death pathways directly impact expression of common loading controls.
Table 2: Comparison of Normalization Methods for Apoptosis Western Blotting
| Normalization Method | Principles | Advantages | Limitations | Suitability for Apoptosis Research |
|---|---|---|---|---|
| Housekeeping Proteins (HKP) | Normalization to constitutively expressed proteins | Widely used; established protocols | Expression variability during apoptosis; narrow linear range; potential co-migration with target proteins | Low to moderate - HKP expression often changes during cell death |
| Total Protein Normalization (TPN) | Normalization to total protein in each lane | Not affected by experimental manipulations; larger dynamic range; provides quality control for electrophoresis and transfer | Requires specific staining or labeling steps; additional optimization | High - Unaffected by apoptotic changes in individual proteins |
| Reference Dyes | Fluorescent labeling of total protein prior to detection | Fast; sensitive; minimal background; compatible with multiplex detection | Requires fluorescent imaging capability; additional reagent cost | High - Provides consistent normalization regardless of apoptotic state |
Implementation of Total Protein Normalization
Total protein normalization (TPN) represents the emerging gold standard for quantitative western blotting, particularly in apoptosis research where traditional housekeeping proteins may be proteolyzed or dysregulated. TPN accounts for technical variations in sample loading, transfer efficiency, and protein integrity by normalizing target signal to the total protein content in each lane [37].
Protocol: Fluorescence-Based Total Protein Normalization
- Post-Transfer Processing: Following protein transfer, incubate membrane with No-Stain Protein Labeling Reagent or similar fluorescent total protein stain according to manufacturer protocols.
- Total Protein Imaging: Image the total protein signal using appropriate fluorescence detection systems (e.g., iBright Imaging System) before antibody probing.
- Target Protein Detection: Proceed with standard antibody incubation and detection protocols.
- Normalization Analysis: Quantify target protein signals and normalize to total protein signal in corresponding lanes using densitometry software.
This approach provides superior accuracy for quantifying apoptotic protein changes, as demonstrated in studies of TNS1-ZEB1 feedback loops in lung cancer EMT and ONECUT2 regulation of apoptosis in hepatocellular carcinoma [90] [88].
Research Reagent Solutions for Apoptosis Studies
Table 3: Essential Reagents for Apoptosis Western Blot Control Strategies
| Reagent Category | Specific Examples | Research Applications | Technical Considerations |
|---|---|---|---|
| Validated Knockout Lysates | Apoptosis pathway knockout panel (ab275045); BRE knockout HeLa lysate (ab257861); PGAM5 knockout HeLa lysate (ab257581) | Antibody validation; specificity controls; establishing background signals | Confirm complete knockout efficiency; ensure genetic background matching; verify protein absence through multiple detection methods |
| Apoptosis Antibody Cocktails | Pro/p17-caspase-3, cleaved PARP1, muscle actin (ab136812) | Multiplex apoptosis detection; comprehensive pathway analysis; efficient screening | Verify individual antibody specificity; optimize concentration ratios; confirm minimal cross-reactivity between targets |
| Specialized Detection Reagents | No-Stain Protein Labeling Reagents; fluorescent secondary antibodies (e.g., IRDye 800CW, 680RD); chemiluminescent substrates (WesternBright Quantum) | Total protein normalization; multiplex detection; enhanced sensitivity | Match detection method to instrumentation; establish linear detection range; optimize signal-to-noise ratio |
| Pathway Modulators | TGF-β (EMT induction); recombinant IFN-γ (STAT1 activation); SB525334 (TGFβR inhibitor); Fludarabine (STAT1 inhibitor) | Positive controls for pathway activation; mechanistic studies; rescue experiments | Determine optimal concentrations and treatment durations; include vehicle controls; confirm pathway modulation through downstream effectors |
Signaling Pathway Diagrams and Workflows
Apoptosis Signaling Pathways and Control Strategies
Experimental Workflow for Control Implementation
Cancer Research Applications and Case Studies
Integration with Functional Assays in Cancer Models
The strategic implementation of knockout/knockdown controls enables rigorous mechanistic studies in cancer research, as demonstrated in recent investigations of apoptotic regulation:
ONECUT2 in Hepatocellular Carcinoma CRISPR/Cas9-mediated OC2 knockout in HCC cells promoted apoptosis through regulation of the SKP2/p53/p21 axis, with apoptosis rates reaching 30.514% in knockout cells [88]. Western blot analysis demonstrated that OC2 knockout enhanced p53 acetylation and increased expression of p21 and p27, confirming the functional role of this transcription factor in apoptosis regulation.
TNS1-ZEB1 Feedback Loop in Lung Cancer Knockdown approaches established a positive feedback loop between TNS1 and ZEB1 that amplifies TGFβ-induced epithelial-mesenchymal transition in lung cancer [90]. TNS1 depletion attenuated both TGFβ- and hypoxia-induced EMT across multiple cancer cell lines, demonstrating the utility of knockdown controls in elucidating complex regulatory networks.
BATF in Cervical Carcinoma BATF knockdown in cervical cancer models suppressed tumor growth and metastasis while enhancing antitumor immunity through regulation of the STAT1/PD-L1 pathway [91]. This comprehensive approach combined knockdown validation with functional assessment of downstream apoptotic and immune markers.
Technical Protocols for Cancer-Relevant Apoptosis Induction
Protocol: TGFβ-Induced Apoptosis/EMT Model
- Cell Treatment: Treat A549 lung cancer cells with 5-20 ng/mL TGFβ for 24-72 hours to induce EMT/apoptosis signaling [90].
- Pathway Inhibition: For mechanistic studies, co-treat with TGFβR inhibitor SB525334 to confirm pathway specificity.
- Protein Extraction: Harvest cells using RIPA lysis buffer supplemented with protease and phosphatase inhibitors.
- Western Analysis: Probe for apoptotic markers (cleaved caspases, PARP) and EMT markers (E-cadherin, N-cadherin, vimentin).
- Control Inclusion: Include untreated controls and pathway inhibition controls to establish specific TGFβ-dependent effects.
This approach successfully identified TNS1 as a critical mediator of TGFβ-induced EMT, demonstrating how appropriate controls enable discovery of novel regulatory mechanisms [90].
Implementing robust control strategies using knockout/knockdown lysates and appropriate positive controls is fundamental to rigorous apoptosis research in cancer biology. These approaches enable researchers to distinguish specific signals from non-specific background, validate antibody specificity, account for technical variability, and generate quantitatively accurate data. The integration of total protein normalization methods addresses significant limitations of traditional housekeeping protein approaches, particularly in apoptotic systems where conventional loading controls may be compromised. As cancer research continues to elucidate the complex regulation of apoptotic pathways in tumor development, progression, and therapeutic response, these control strategies will remain essential for generating reliable, reproducible, and biologically meaningful data that advances both basic understanding and clinical translation.
Integrating Western Blot Data with Other Apoptosis Assays and Preclinical Validation
Correlating Western Blot with Functional Apoptosis Assays (e.g., TUNEL, AO/EB Staining)
In cancer research, accurately detecting and quantifying apoptosis is fundamental for understanding disease mechanisms and evaluating the efficacy of potential therapies. While techniques such as TUNEL (Terminal deoxynucleotidyl transferase dUTP Nick-End Labeling) and AO/EB (Acridine Orange/Ethidium Bromide) staining provide direct functional evidence of cell death, Western blotting offers specific insight into the protein-level activation of apoptotic pathways. Correlating data from these complementary methods provides a more robust and comprehensive analysis of apoptotic events, strengthening research conclusions on cancer cell response to therapeutic agents. This protocol details the integrated application of Western blot and functional assays for apoptosis analysis within the context of cancer research.
A comprehensive apoptosis analysis investigates key proteins and cellular events through complementary techniques. The table below summarizes the primary targets and the essential information provided by each method.
Table 1: Key Apoptosis Analysis Methods and Targets
| Analysis Method | Key Targets / Readouts | Type of Information Provided |
|---|---|---|
| Western Blot | Cleaved Caspases (e.g., Caspase-3, -8, -9), Cleaved PARP, Bcl-2 Family Proteins, p53 [1] [92] | Specific protein expression, cleavage, and post-translational modifications; identifies signaling pathways involved. |
| AO/EB Staining | Nuclear Morphology (Chromatin Condensation, Nuclear Fragmentation), Membrane Integrity [93] [94] | Direct visualization and quantification of live, apoptotic, and necrotic cells based on nuclear morphology and membrane integrity. |
| TUNEL Assay | DNA Fragmentation | Labels DNA strand breaks, a hallmark of late-stage apoptosis. |
| Annexin V Staining | Phosphatidylserine Externalization [1] | Detection of early apoptotic cells via flow cytometry or microscopy. |
| Mitochondrial Potential Assay | Mitochondrial Membrane Potential (using dyes like Rhodamine 123) [93] | Assesses the integrity of the mitochondrial membrane, an early event in the intrinsic apoptotic pathway. |
Experimental Workflow for Correlative Analysis
The power of this approach lies in parallel experimentation using the same cell line and treatment conditions. The following integrated workflow ensures sample and temporal consistency.
Detailed Methodologies
Western Blot Protocol for Apoptosis Detection
This protocol is adapted from established methods for detecting key apoptotic proteins [1] [92].
Sample Preparation
- Cell Lysis: Lyse control and treated cancer cells (e.g., A549 lung cancer cells, MDA-MB-231 breast cancer cells) using RIPA buffer supplemented with protease and phosphatase inhibitors [92].
- Protein Quantification: Determine protein concentration of lysates using a BCA assay kit to ensure equal loading across all samples [95].
Gel Electrophoresis and Transfer
- Load an equal amount of protein (e.g., 10-30 µg) per lane on an SDS-polyacrylamide gel (e.g., 10-12%) for separation [92].
- Transfer proteins from the gel to a PVDF or nitrocellulose membrane using standard wet or semi-dry transfer systems.
Antibody Probing
- Blocking: Incubate the membrane in 5% skim milk or BSA in TBST for 1 hour at room temperature to prevent non-specific antibody binding.
- Primary Antibody Incubation: Probe the membrane with specific primary antibodies overnight at 4°C. Key antibodies for apoptosis include:
- Cleaved Caspase-3: Executioner caspase, definitive marker of apoptosis commitment.
- Cleaved PARP: Substrate of activated caspases; its cleavage is a hallmark of apoptosis.
- Bax / Bcl-2: Pro- and anti-apoptotic proteins, indicating mitochondrial pathway involvement.
- β-actin or GAPDH: Used as loading controls for normalization.
- Secondary Antibody Incubation: Wash the membrane and incubate with an appropriate HRP-conjugated secondary antibody for 1-2 hours at room temperature [92].
Detection and Analysis
- Visualize protein bands using an enhanced chemiluminescence (ECL) kit and a digital imaging system [92].
- Perform densitometric analysis of band intensities using software such as ImageJ.
- Normalize the intensity of the target protein band (e.g., cleaved caspase-3) to the loading control (e.g., β-actin) for quantitative comparisons [1].
Functional Apoptosis Assay Protocols
AO/EB Staining for Microscopic Analysis
This dual-fluorescence staining method distinguishes viable and non-viable cells based on plasma membrane integrity and nuclear morphology [93] [94].
- Cell Staining: After treatment, seed cells on chamber slides (e.g., 1.2 × 10^5 cells per well). Remove the medium and replace it with a solution containing AO (100 µg mL⁻¹) and EB (100 µg mL⁻¹). Incubate for 15 minutes at 37°C in the dark [94].
- Visualization and Scoring: Observe and image the cells using a fluorescence microscope with appropriate filters.
- Viable Cells: Uniformly green nuclei with organized structure. Acridine orange (AO) permeates all cells.
- Early Apoptotic Cells: Bright green nuclei, but with condensed or fragmented chromatin.
- Late Apoptotic Cells: Orange-to-red nuclei with condensed or fragmented chromatin. Ethidium bromide (EB) enters cells after loss of membrane integrity.
- Necrotic Cells: Uniformly orange-to-red nuclei with normal structure.
- Count at least 200 cells per sample across random fields to calculate the percentage of cells in each category.
Annexin V/PI Staining for Flow Cytometry
This method quantitatively measures early apoptosis (Annexin V-positive) and late apoptosis/necrosis (Annexin V and PI-positive).
- Cell Staining: Harvest treated cells and wash with ice-cold PBS. Resuspend the cell pellet (approximately 1 × 10^5 cells) in 195 µL of Annexin V binding buffer. Add 5 µL of Annexin V-FITC and 10 µL of Propidium Iodide (PI) solution. Incubate for 20 minutes in the dark at room temperature [94].
- Flow Cytometry Analysis: Analyze the stained cells using a flow cytometer within 1 hour. The population is categorized as follows:
- Annexin V-FITC negative / PI negative: Viable cells.
- Annexin V-FITC positive / PI negative: Early apoptotic cells.
- Annexin V-FITC positive / PI positive: Late apoptotic or necrotic cells.
Data Correlation and Interpretation
Correlation is achieved by analyzing samples from the same treatment conditions using both Western blot and functional assays. The expected correlative outcomes are mapped in the pathway below.
A strong correlation is observed when, for example, a dose-dependent increase in cleaved caspase-3 and cleaved PARP on the Western blot aligns with a corresponding dose-dependent increase in the percentage of Annexin V-positive or AO/EB-stained apoptotic cells. This multi-faceted confirmation provides powerful evidence that a therapeutic agent is inducing cell death via apoptotic mechanisms, a key finding in cancer drug development [95].
The Scientist's Toolkit: Research Reagent Solutions
Table 2: Essential Reagents for Apoptosis Analysis
| Reagent / Kit | Function / Application | Examples / Key Components |
|---|---|---|
| Apoptosis Antibody Cocktails | Simultaneous detection of multiple apoptotic markers (e.g., Caspase-3, PARP) in a single Western blot, saving time and sample [1]. | Pre-mixed antibodies for pro/p17-caspase-3, cleaved PARP, and muscle actin. |
| Caspase-Specific Antibodies | Detect activation of initiator and executioner caspases via Western blot. | Antibodies against Cleaved Caspase-3, -8, -9; Pro-Caspase-3 [1] [92]. |
| PARP Antibodies | Detect the cleavage of PARP, a definitive marker of caspase-mediated apoptosis. | Antibodies specific for full-length and cleaved PARP fragments [1]. |
| AO/EB Staining Solution | Direct microscopic identification and quantification of live, apoptotic, and necrotic cells based on nuclear morphology. | Acridine Orange (100 µg mL⁻¹), Ethidium Bromide (100 µg mL⁻¹) [94]. |
| Annexin V Apoptosis Detection Kit | Flow cytometric quantification of early and late apoptotic cells by detecting phosphatidylserine externalization and membrane integrity. | Annexin V-FITC, Propidium Iodide (PI), Binding Buffer [94]. |
| Enhanced Chemiluminescence (ECL) Kit | Sensitive detection of horseradish peroxidase (HRP) on Western blot membranes for protein visualization. | Luminol-based substrate and peroxide solution. |
| Rhodamine 123 Dye | Assess mitochondrial membrane potential, an early event in the intrinsic apoptotic pathway. | Fluorescent dye that accumulates in active mitochondria [93]. |
Application in Cancer Research & Troubleshooting
Applications in Cancer Therapy Development
This integrated approach is pivotal in:
- Drug Screening: Evaluating whether novel compounds, such as the natural product Evodiamine in breast cancer cells, induce apoptosis by analyzing caspase activation and PARP cleavage alongside AO/EB staining [95].
- Mechanistic Studies: Elucidating the specific apoptotic pathway (intrinsic vs. extrinsic) activated by a therapeutic agent by correlating Western blot data for markers like Bax/Bcl-2 with functional readouts [93] [26].
- Biomarker Discovery: Identifying reliable protein signatures of treatment response that can be detected via Western blot and validated functionally.
Common Challenges and Solutions
- Weak or No Signal in Western Blot: Optimize antibody concentration and incubation time; use fresh ECL reagent; confirm protein transfer efficiency with Ponceau S staining.
- High Background in Western Blot: Increase the number and duration of washes after antibody incubations; ensure adequate blocking.
- Discrepancy Between Western Blot and Functional Assays: Consider temporal differences—protein cleavage events may precede or follow morphological changes. Analyze multiple time points to capture the dynamic process of cell death.
- Low Apoptotic Index in Functional Assays: Verify the efficacy and concentration of the apoptotic inducer; optimize the timing of the assay to capture the peak of apoptotic activity.
Proteogenomics represents a paradigm shift in preclinical cancer research by integrating genomics, transcriptomics, and proteomics to provide a multidimensional understanding of tumor biology [96]. This integrative approach uncovers functional consequences of genetic alterations that are not evident at the DNA or RNA level alone, enabling a more accurate interpretation of how mutations translate into biological behavior [97] [96]. Within this framework, Western blot analysis serves as a critical bridge, validating genomic findings with functional protein-level data and providing insights into protein expression, modification, and activation status that are essential for understanding cancer biology and therapeutic response.
The integration of data from various omics fields, including genomics, transcriptomics, proteomics, metabolomics, and lipidomics, offers a holistic view of the molecular landscape of cancer [97]. Western blot analysis provides specific advantages in this integrative approach, including the ability to detect post-translational modifications, confirm antibody specificity, and quantify protein expression levels with high sensitivity and specificity [43]. When framed within a broader thesis on apoptosis analysis in cancer research, Western blot enables researchers to connect genomic alterations to functional apoptotic pathways through measurement of key markers such as cleaved caspases, Bcl-2 family proteins, and DNA damage response elements [98].
Proteogenomic Integration: Strategic Frameworks and Workflows
The effective integration of Western blot within proteogenomic workflows requires systematic approaches that leverage the complementary strengths of multiple analytical techniques. The power of proteogenomics lies in its ability to refine cancer subtypes, characterize the immune landscape, identify novel therapeutic targets, and reveal intratumoral heterogeneity through single-cell and pan-cancer analyses [96]. Western blot contributes critical protein-level validation to these applications, confirming predictions generated from genomic and transcriptomic data.
Table 1: Multi-Omics Components in Cancer Research Integration with Western Blot
| Omics Component | Key Insights Provided | Western Blot Integration Points | Applications in Oncology |
|---|---|---|---|
| Genomics | Identifies mutations, SNPs, CNVs, and structural variations | Validates functional impact of genetic variants on protein expression and function | Disease risk assessment, identification of genetic disorders, pharmacogenomics [97] |
| Transcriptomics | Analyzes gene expression, provides pathway activity snapshot | Confirms correlation between mRNA levels and protein abundance, identifies post-transcriptional regulation | Gene expression profiling, biomarker discovery, drug response studies [97] |
| Proteomics | Investigates functional state via proteins, PTMs, interactions | Provides orthogonal validation of mass spectrometry findings, especially for low-abundance targets | Biomarker discovery, drug target identification, functional studies [97] |
| Epigenomics | Studies heritable changes in gene expression without DNA sequence changes | Detects corresponding protein expression changes resulting from epigenetic modifications | Cancer research, developmental biology, environmental impact studies [97] |
The workflow for integrating Western blot into proteogenomic analyses typically follows a sequential validation pathway, beginning with genomic and transcriptomic profiling to identify potential targets of interest, followed by proteomic screening via high-throughput methods like mass spectrometry, and culminating in targeted protein validation using Western blot. This workflow is particularly valuable in apoptosis research, where it can connect genetic alterations in apoptotic pathways to actual protein expression and activation changes in cancer models.
Diagram 1: Proteogenomic workflow with Western blot validation. Western blot provides critical validation of proteomic findings before functional assays.
Experimental Protocols: Western Blot Methodologies for Apoptosis Analysis in Multi-Omic Context
Standard Western Blot Protocol for Apoptosis Marker Detection
Sample Preparation:
- Harvest cells during logarithmic growth phase. For apoptosis induction, treat cells with appropriate agents (e.g., 200-400 μM abietic acid for lung cancer cells) for 24-48 hours [98].
- Lyse cells using RIPA buffer (Thermo Fisher Scientific, 89900) supplemented with protease and phosphatase inhibitors.
- Determine protein concentration using BCA assay kit (23225) and adjust final concentration to 1-2 mg/mL [43].
- Prepare samples by adding PAGE loading buffer (e.g., PAGEST, GeneAll, 751-001) and heat at 95°C for 5 minutes.
Gel Electrophoresis and Protein Transfer:
- Prepare acrylamide gels (8-12%) using 30% acrylamide/bis solution (Bio-Rad, 1610156).
- Load 10-30 μg protein per well alongside pre-stained protein markers (e.g., ExcelBand, SMOBIO, PM2700 or Chameleon Duo pre-stained markers) [43].
- Perform electrophoresis at constant voltage (100-120V) until dye front reaches bottom using PowerPac HC High-Current Power Supply (Bio-Rad, 1645052).
- Transfer proteins to 0.2 μm nitrocellulose membrane (Amersham Protran, Cytiva, 1060001) using wet or semi-dry transfer systems.
Antibody Incubation and Detection:
- Block membrane with 5% skim milk in TBST for 1 hour at room temperature with gentle agitation.
- Incubate with primary antibodies diluted in 5% skim milk overnight at 4°C with agitation. For apoptosis markers: cleaved caspase-3 (1:1000; Cell Signaling Technology, 9664), cleaved PARP (1:1000; Cell Signaling Technology, 5625), Bax (1:1000; ABclonal, A19684), Bcl-2 (1:1000; Cell Signaling Technology, 15071), γH2A.X (1:1000; Cell Signaling Technology, 80312 for DNA damage) [98].
- Wash membrane 3 times with TBST for 5 minutes each.
- Incubate with HRP-conjugated secondary antibodies (e.g., GenDEPOT, SA001 and SA002) at 1:2000 dilution for 1 hour at room temperature.
- Detect signals using enhanced chemiluminescence substrate (e.g., WesternBright Quantum, Advansta, K-12045-D50) and imaging system (e.g., ImageQuant LAS-4000 mini).
Sheet Protector Method for Antibody Conservation
For rare or expensive antibodies, the sheet protector (SP) strategy offers significant antibody savings [43]:
- After blocking, briefly immerse membrane in TBST and blot residual moisture with paper towel.
- Place semi-dried membrane on a cropped sheet protector leaflet.
- Apply minimal antibody volume (20-150 μL for mini-gels) directly to membrane.
- Gently place upper leaflet over membrane, allowing antibody solution to spread as a thin layer by surface tension.
- Incubate SP unit at room temperature for 15 minutes to several hours without agitation.
- For extended incubations, place SP unit on wet paper towel in sealed bag to prevent evaporation.
Apoptosis Signaling Pathway Analysis via Western Blot
In the context of multi-omics research on natural compounds like abietic acid, Western blot can trace apoptosis pathway activation through sequential analysis of key markers [98]:
DNA Damage Pathway:
- Analyze DNA damage response via γH2A.X, p-ATM (1:1000; HUABIO, ET1705-50), p-ATR (1:1000; HUABIO, HA721190), p-Chk1 (1:1000; HUABIO, ET1611-76), and p-Chk2 (1:2000; HUABIO, HA721633).
- For TOP2A-targeting compounds like abietic acid, include TOP2A (1:1000; HUABIO, ET1607-59) to confirm target engagement.
Mitochondrial Apoptosis Pathway:
- Assess mitochondrial membrane potential disruption through changes in Bax/Bcl-2 ratio.
- Detect caspase activation via cleaved caspase-3 and PARP cleavage.
Validation of Multi-Omic Predictions:
- When genomic analyses identify mutations in apoptotic genes (e.g., TP53) or transcriptomic analyses show expression changes, Western blot provides protein-level validation.
- For example, in breast cancer research, proteins with diminished expression like KAI1, Apoptin, BIF-1, and DFF-40 can be validated via Western blot [99].
Diagram 2: Apoptosis mechanism of TOP2A-targeting compounds. Western blot detects key markers (red) in this pathway.
Data Analysis and Normalization Strategies for Reliable Quantification
Accurate quantification of Western blot data is essential for meaningful integration with multi-omics datasets. Several normalization approaches can minimize analytical variations:
Multiple Normalization Methods:
- Total lane protein: Normalize target protein signal to total protein in lane stained with Coomassie or Ponceau S.
- Housekeeping proteins: Use GAPDH (1:50,000; ABclonal, A19056), β-actin, or α-tubulin as loading controls.
- Percentage control: Express values as percentage of control group mean.
- Phospho/total protein ratio: For modified proteins, calculate ratio of phosphorylated to total protein.
- Sum of target method: Normalize using the sum of all target protein values combined with analytical replication [100].
Table 2: Western Blot Normalization Methods and Performance Characteristics
| Normalization Method | Procedure | Best Applications | Performance Metrics (CV%) | Limitations |
|---|---|---|---|---|
| Total Lane Protein | Stain membrane with total protein stain before immunodetection | Complex experiments with multiple targets across different gels | 5-10% with replication [100] | May not account for transfer variations |
| Housekeeping Proteins | Detect constitutive proteins (GAPDH, actin, tubulin) | Single-gel experiments with stable reference proteins | 10-15% [43] | Reference protein expression may vary with treatments |
| Percentage Control | Express all values as % of control group mean | Screening experiments with clear control groups | 8-12% | Depends on control group consistency |
| Phospho/Total Ratio | Detect both phosphorylated and total forms of target protein | Signaling studies with phosphorylation changes | 7-11% | Requires double probing or stripping |
| Sum of Target Method | Normalize using sum of all target protein values | Multi-target experiments with replication | 5-10% [100] | Requires multiple target measurements |
Optimizing Reduction of Analytical Variations:
- Include replicate test samples of pooled cell lysates in multiple lanes and gels to assess technical variation.
- Use the coefficient of variation (CV) and maximal to minimal ratio (Max/Min) to evaluate performance. Ideal CV approaches 0% and Max/Min approaches 1 with identical replicates [100].
- Implement experimental designs that place control samples on each gel to enable cross-gel normalization.
- For multi-omics integration, ensure Western blot data quality matches the standards of genomic and proteomic datasets.
The Scientist's Toolkit: Essential Research Reagents and Materials
Table 3: Key Research Reagent Solutions for Western Blot in Proteogenomics
| Reagent/Material | Supplier Examples | Function | Application Notes |
|---|---|---|---|
| RIPA Buffer | Thermo Fisher Scientific (89900) | Cell lysis and protein extraction | Effective for most nuclear and cytoplasmic proteins; contains detergents for membrane protein solubilization |
| BCA Protein Assay Kit | Various (23225) | Protein quantification | More compatible with detergents than Bradford assay; essential for equal loading |
| Pre-stained Protein Markers | SMOBIO (PM2700), LI-COR Biosciences | Molecular weight estimation | Chameleon Duo markers enable tracking in different channels; essential for size determination |
| Nitrocellulose Membrane | Cytiva (1060001) | Protein immobilization | 0.2 μm pore size optimal for most proteins; better protein retention than PVDF for lower molecular weights |
| Primary Antibodies | Cell Signaling Technology, ABclonal, HUABIO | Target protein detection | Validate specificity with knockout controls; optimize dilution for each application |
| HRP-conjugated Secondary Antibodies | GenDEPOT (SA001, SA002) | Signal generation | Species-specific; critical for low background and high sensitivity |
| Chemiluminescent Substrate | Advansta (K-12045-D50) | Signal detection | WesternBright Quantum offers high sensitivity and extended signal duration |
| Sheet Protectors | Stationery suppliers | Antibody conservation | Enables 20-150 μL antibody volumes vs. conventional 10 mL; reduces antibody consumption 50-100 fold [43] |
Case Study: Validating Multi-Omic Predictions of Abietic Acid Mechanism in Lung Cancer
A recent study on abietic acid demonstrates the powerful synergy between multi-omics approaches and Western blot validation [98]. Network pharmacology and GO enrichment analysis predicted that the DNA damage response was a key biological process affected by abietic acid in lung cancer. This prediction was validated through Western blot analysis showing:
- Dose-dependent increase in γH2A.X, a sensitive marker of DNA double-strand breaks
- Downregulation of TOP2A protein expression, identifying the direct target
- Activation of DNA damage response proteins including p-ATM, p-ATR, p-Chk1, and p-Chk2
- Induction of mitochondrial apoptosis pathway shown by increased Bax/Bcl-2 ratio, caspase-3 cleavage, and PARP cleavage
This sequential approach—beginning with computational predictions from multiple databases (CHEMBL, NetInfer, SwissTargetPrediction, Disgenet) and progressing to experimental validation via Western blot—exemplifies the proteogenomic framework in action. The Western blot data provided critical protein-level confirmation of the predicted mechanism, bridging the gap between computational predictions and biological reality.
Western blot analysis remains an indispensable component in the proteogenomics toolbox, providing critical protein-level validation that connects genomic alterations to functional consequences in cancer biology. When strategically integrated into multi-omics workflows, particularly in apoptosis research, Western blot delivers essential data on protein expression, modification, and signaling pathway activation that complements and validates findings from genomic, transcriptomic, and proteomic platforms. By adopting optimized protocols, rigorous normalization methods, and antibody conservation strategies, researchers can enhance the reliability and efficiency of Western blot analysis, maximizing its contribution to comprehensive proteogenomic studies in preclinical oncology.
In the field of cancer research, the discovery of prognostic and predictive protein signatures represents a critical step toward personalized medicine. These signatures, often identified through high-throughput bioinformatics analyses, provide insights into disease progression, treatment response, and patient outcomes. Western blot analysis serves as an essential orthogonal method to validate these computational findings at the protein level, offering specific, quantitative data that confirms both the presence and functional significance of candidate biomarkers [101] [102]. Within the context of apoptosis research in cancer, Western blotting provides direct evidence of protein expression changes in key regulatory pathways, bridging the gap between genomic discoveries and clinically applicable biomarkers.
The transition from bioinformatics predictions to validated biomarkers requires rigorous experimental confirmation. Recent studies highlight this pipeline, where bioinformatics mining identifies potential signatures, followed by Western blot validation to confirm differential protein expression and functional significance in cancer progression and treatment response [101] [103] [102]. This approach ensures that identified signatures have genuine biological relevance and potential clinical utility.
Key Biomarker Validation Studies Using Western Blot Analysis
Validation of TIMP1 in Colorectal Cancer
A 2025 study integrated bioinformatics mining with experimental validation to identify and confirm TIMP1 as a significant prognostic biomarker in colorectal cancer (CRC). Researchers first identified a five-gene prognostic signature (TIMP1, PCOLCE2, MEIS2, HDC, CXCL13) through analysis of GEO and TCGA databases. Bioinformatics analysis linked TIMP1 to critical CRC pathways including type I interferon receptor binding, oxidative phosphorylation, and Notch signaling. High expression of TIMP1 was associated with poor prognosis in CRC patients [101].
Experimental validation using siRNA-mediated TIMP1 knockdown in CRC cell lines (HCT116 and HT29) demonstrated that reduced TIMP1 expression significantly inhibited cell proliferation, metastasis, and promoted apoptosis. Western blot analysis provided protein-level confirmation of these findings, consistent with the bioinformatics conclusions. This comprehensive approach established TIMP1 as both a potential biomarker and therapeutic target for colorectal cancer [101].
Validation of DAP3 in Hepatocellular Carcinoma
In hepatocellular carcinoma (HCC) research, Death-associated protein 3 (DAP3) was identified as a candidate prognostic marker through analysis of TCGA, GEO, and ICGC databases. Bioinformatic analyses revealed that DAP3 expression was linked to HCC subtypes, with high expression associated with poor prognosis. Researchers then performed quantitative real-time PCR (qRT-PCR), Western blot, and immunohistochemical (IHC) staining to examine DAP3 expression in HCC clinical samples and cell lines [103].
The study confirmed that DAP3 expression was significantly increased in both HCC tissue samples and cell lines. Elevated DAP3 levels correlated with larger tumor size and higher alpha-fetoprotein (AFP) levels. Cox analysis confirmed DAP3 as a clinically independent prognostic marker. Functional assays showed that DAP3 knockdown significantly impeded cell proliferation, metabolic activity, and induced apoptosis, while DAP3 overexpression had opposite effects. Western blot analysis was crucial in confirming the protein-level expression changes suggested by transcriptomic data [103].
Validation of USP39 in Pancreatic Cancer
A 2025 pan-cancer analysis investigated Ubiquitin-Specific Protease 39 (USP39) as a prognostic and predictive biomarker across multiple cancer types, with particular focus on pancreatic adenocarcinoma (PAAD). Bioinformatics analysis revealed that USP39 expression was significantly correlated with advanced tumor stage and unfavorable clinical outcomes in multiple cancer types, most notably in PAAD. The study then employed Western blotting to confirm efficient suppression of USP39 protein expression in stable knockdown cell models of MIAPaCa-2 and PANC-1 pancreatic cancer cell lines [102].
Functional assays following Western blot confirmation demonstrated that USP39 depletion inhibited migration and proliferation of pancreatic cancer cells while inducing apoptosis. The association between USP39 expression and immune checkpoint molecules suggested potential for predicting immunotherapeutic responses. Western blot analysis served as a key validation step in confirming the functional role of USP39 in pancreatic cancer progression [102].
Table 1: Key Cancer Biomarkers Validated by Western Blot Analysis
| Biomarker | Cancer Type | Biological Function | Validation Findings | Reference |
|---|---|---|---|---|
| TIMP1 | Colorectal Cancer | Extracellular matrix remodeling, apoptosis regulation | Knockdown inhibited proliferation, metastasis, promoted apoptosis | [101] |
| DAP3 | Hepatocellular Carcinoma | Mitochondrial ribosomal protein, apoptosis regulation | High expression correlated with poor prognosis, larger tumor size | [103] |
| USP39 | Pancreatic Adenocarcinoma | Deubiquitinating enzyme, splicing regulation | Depletion inhibited migration, proliferation, induced apoptosis | [102] |
Western Blot Protocols for Biomarker Validation
Standard Western Blot Protocol
The fundamental Western blot protocol involves several critical stages executed over two days. On day one, protein separation begins with gel preparation and sample loading. Using a pre-cast 10% PAGE gel, samples are loaded in duplicate or triplicate alongside molecular weight markers and positive controls. Electrophoresis is typically performed at 95V for 1-1.5 hours until the dye front reaches the gel bottom [104].
Protein transfer follows using a wet transfer system with transfer buffer (50ml 10X Tris/Glycine buffer + 750ml ddH2O + 200ml methanol). The transfer sandwich is assembled in the sequence: negative plate, two sponges, filter paper, gel, membrane, filter paper, two sponges, and positive plate. Careful attention is paid to removing bubbles between layers. Transfer typically runs at 30V for 1 hour [104].
Post-transfer, the membrane is blocked with 5% non-fat milk in TBST for 1 hour with shaking. Primary antibody incubation follows, with typical dilutions of 1:1000 in blocking buffer, incubated overnight at 4°C with shaking. On day two, membranes undergo extensive washing with TBST (quick washes followed by 10-minute washes twice, then 5-minute washes twice). Secondary antibody incubation uses HRP-conjugated antibodies at 1:10,000 dilution in TBST for 30 minutes. After repeated washing, detection is performed using enhanced chemiluminescence reagents with exposure times ranging from 5 seconds to 20 minutes depending on signal strength [104].
Quantitative Western Blot with Total Protein Normalization
For quantitative biomarker validation, total protein normalization (TPN) has emerged as the gold standard, increasingly required by major scientific journals. Unlike traditional housekeeping protein (HKP) approaches, TPN normalizes target protein signal to the total protein in each lane, providing superior accuracy and reliability [86] [37].
The TPN protocol involves labeling total protein either in the gel or on the membrane using fluorescent labels like the Invitrogen No-Stain Protein Labeling Reagent. After electrophoresis, the gel is incubated with labeling reagent according to manufacturer specifications, then imaged to capture total protein signal before proceeding with transfer and immunodetection. Alternatively, membranes can be stained with fluorescent total protein stains after transfer [86] [37].
For analysis, the target protein signal is normalized to the total protein signal in each lane, which accounts for variations in protein loading, transfer efficiency, and other technical variables. This method provides a larger dynamic range for detection and is not affected by changes in housekeeping protein expression that often occur under different experimental conditions or disease states [37].
Protocol for Detecting Low-Abundance Proteins
Detection of low-abundance proteins, such as tissue factor in human cells, requires optimized Western blot protocols. Sensitivity is affected by various factors including blocking conditions, detection method, and primary and secondary antibody selection. For low-abundance targets, researchers should [71]:
- Test multiple antibodies for specificity and sensitivity
- Optimize blocking conditions to reduce background without diminishing signal
- Use high-sensitivity detection methods such as fluorescent Western blotting or enhanced chemiluminescence with extended exposure times
- Increase protein loading within the linear range of detection
- Validate antibody specificity using appropriate controls
In the case of tissue factor detection, comparison of three different antibodies (rabbit polyclonal anti-human TF antibody NBP2-15139 from Novus Biologicals, goat polyclonal anti-human TF antibody AF2339 from R&D Systems, and rabbit monoclonal anti-human TF antibody ab252918 from Abcam) revealed significant differences in specificity and sensitivity, with the Abcam antibody performing best for low-expressing cell lines [71].
Table 2: Comparison of Western Blot Normalization Methods
| Parameter | Housekeeping Protein (HKP) | Total Protein Normalization (TPN) |
|---|---|---|
| Principle | Normalization to constitutively expressed protein | Normalization to total protein in lane |
| Common Targets | GAPDH, β-actin, β-tubulin | Total protein stain or label |
| Advantages | Familiar methodology, widely used | Not affected by experimental manipulations, larger dynamic range |
| Disadvantages | HKP expression varies with conditions, potential saturation, narrow linear range | Requires additional staining/labeling step, specialized imaging |
| Journal Preference | Falling out of favor | Increasingly required as gold standard |
| Validation Requirements | Linear range determination for both HKP and target | Linear range determination for target with TPN |
Experimental Design & Workflow for Biomarker Validation
The following diagram illustrates the complete workflow for biomarker validation, from bioinformatics discovery through experimental confirmation:
Diagram 1: Biomarker Validation Workflow. This diagram outlines the comprehensive process from bioinformatics discovery to experimental validation of protein biomarkers using Western blot analysis.
Signaling Pathways in Apoptosis-Related Biomarkers
Understanding the signaling pathways involved in apoptosis regulation is crucial for interpreting Western blot results in cancer biomarker validation. The following diagram illustrates key apoptotic pathways relevant to cancer biomarker research:
Diagram 2: Apoptosis Signaling Pathways. This diagram shows key apoptotic pathways with validated biomarkers (TIMP1, DAP3, USP39) and their potential points of regulation in the cell death cascade.
The Scientist's Toolkit: Essential Research Reagents
Table 3: Essential Research Reagents for Biomarker Validation by Western Blot
| Reagent Category | Specific Examples | Function & Application |
|---|---|---|
| Cell Lines | HCT116, HT29 (Colorectal Cancer); MIAPaCa-2, PANC-1 (Pancreatic Cancer); PLC/PRF/5, HCCLM3 (Hepatocellular Carcinoma) | Disease-relevant models for biomarker validation [101] [103] [102] |
| Gene Modulation Tools | siRNA, shRNA, Lentiviral Vectors | Knockdown or overexpression of target biomarkers for functional validation [101] [102] |
| Primary Antibodies | Anti-TIMP1, Anti-DAP3, Anti-USP39, Cell Signaling Antibodies | Target protein detection with validated specificity [101] [103] [102] |
| Detection Systems | HRP-conjugated Secondary Antibodies, ECL Reagents, Fluorescent Labels | Signal generation and detection for protein visualization [86] [104] |
| Normalization Reagents | No-Stain Protein Labeling Reagent, Total Protein Stains, Housekeeping Protein Antibodies (GAPDH, β-actin) | Loading controls for quantitative accuracy [86] [37] |
| Apoptosis Assay Kits | Caspase Activity Assays, Annexin V Staining, Cell Death Detection Kits | Functional validation of biomarker role in cell death pathways [101] [102] |
Western blot analysis remains an indispensable tool in the validation of prognostic and predictive protein signatures in cancer research, particularly in the context of apoptosis regulation. The integration of bioinformatics discovery with rigorous Western blot validation, as demonstrated in recent studies of TIMP1, DAP3, and USP39, provides a robust framework for translating computational findings into biologically and clinically relevant biomarkers. The adoption of quantitative approaches, particularly total protein normalization, enhances the reliability and reproducibility of these validation studies. As biomarker development continues to evolve, Western blotting maintains its critical role in bridging the gap between high-throughput omics discoveries and functionally validated targets for cancer diagnosis, prognosis, and treatment.
Breast cancer remains the most prevalent malignancy among women globally, with triple-negative breast cancer (TNBC) posing significant therapeutic challenges due to its aggressive nature and lack of targeted treatment options [105] [106]. A critical hallmark of cancer is the dysregulation of apoptotic pathways, which allows malignant cells to survive and proliferate uncontrollably [106]. Western blot analysis serves as an indispensable tool in cancer research for detecting and quantifying key apoptotic proteins, providing mechanistic insights into novel therapeutic strategies [1].
This application note presents a detailed case study investigating the synergistic pro-apoptotic effects of natural compounds - Prunus armeniaca (apricot) extract and bee venom - on breast cancer cells. We provide comprehensive experimental protocols, data analysis methodologies, and technical guidance for validating apoptotic responses in breast cancer research models, with particular emphasis on rigorous western blot techniques suitable for thesis research and drug development applications.
Key Experimental Findings: Synergistic Pro-Apoptotic Effects
Cytotoxicity and Anti-Proliferative Activity
The combination of Prunus armeniaca (PA) and bee venom (BV) demonstrated significant synergistic effects against breast cancer cell lines. Quantitative assessment revealed substantially enhanced cytotoxicity compared to individual compound treatments [105] [106].
Table 1: Cytotoxic Effects of PA and BV Combination on Breast Cancer Cells
| Cell Line | Breast Cancer Subtype | IC50 (Individual Compounds) | IC50 (PA-BV Combination) | Reduction in Colony Formation |
|---|---|---|---|---|
| MCF-7 | Estrogen receptor-positive (ER+) | Not reported | 35.148 µg/mL | 83% at highest dose (70.3 µg/mL) |
| MDA-MB-231 | Triple-negative (TNBC) | Not reported | 73.80 µg/mL | Data not reported |
Apoptosis Induction and Molecular Mechanisms
Western blot analysis confirmed that the PA-BV combination significantly modulates the expression of key Bcl-2 family proteins, shifting the cellular balance toward apoptosis execution [105] [106].
Table 2: Apoptotic Markers Modulated by PA-BV Combination Treatment
| Apoptotic Parameter | Experimental Method | Key Findings | Statistical Significance |
|---|---|---|---|
| Bax Pro-apoptotic Protein | Western Blot | Significant upregulation | p < 0.05 |
| Bcl-2 Anti-apoptotic Protein | Western Blot | Significant downregulation | p < 0.05 |
| Early/Late Apoptotic Cells | AO/EB Staining | Increase from 3.2% (control) to 65.3% (70.3 µg/mL) | p < 0.001 |
| Cell Invasion Capacity | Transwell Assay | 59% reduction at treatment concentration | p < 0.05 |
Experimental Protocols
Cell Culture and Treatment
Materials:
- MCF-7 (ATCC HTB22) and MDA-MB-231 breast cancer cell lines
- RPMI-1640 medium supplemented with 10% FBS and antibiotics
- Prunus armeniaca extract (Sigma-Aldrich)
- Bee venom (Sigma-Aldrich)
Procedure:
- Culture cells in RPMI-1640 medium with 10% FBS at 37°C in a 5% CO₂ humidified atmosphere
- Seed cells at appropriate densities: 4×10³ cells/well (96-well plate) for MTT assay; 500 cells/well (6-well plate) for colony formation
- Prepare stock solutions of PA and BV in appropriate solvents (e.g., DMSO, saline)
- Treat cells with concentration ranges (0-500 µg/mL) of individual compounds or their combination for 24-72 hours
- Include vehicle controls in all experiments [105] [106]
Assessment of Cytotoxicity and Cell Viability
MTT Assay Protocol:
- After 72 hours of treatment, add MTT reagent (0.25 mg/mL final concentration) to each well
- Incubate for 3 hours at 37°C to allow formazan crystal formation
- Carefully remove medium and dissolve formazan crystals in 150 µL DMSO
- Measure absorbance at 570 nm using a microplate reader (e.g., BMGLABTECH FLUOstar Omega)
- Calculate cell viability percentage: (Absorbance of treated cells / Absorbance of control cells) × 100
- Determine IC₅₀ values using GraphPad Prism software [105] [106]
Western Blot Analysis of Apoptotic Markers
Sample Preparation:
- After 24 hours of treatment with PA-BV combination (0, 17.57, 35.15, and 70.3 µg/mL), lyse cells using RIPA buffer with protease inhibitors
- Centrifuge lysates at 13,000 rpm for 20 minutes at 4°C
- Collect supernatant and quantify protein concentration using Bradford assay
- Adjust samples to equal protein concentrations with lysis buffer [105] [106]
Electrophoresis and Transfer:
- Load 40 µg of protein per well on 10% SDS-PAGE gel
- Separate proteins by electrophoresis at 100-120 V for 1-2 hours
- Transfer proteins to nitrocellulose membrane using wet or semi-dry transfer systems
- Confirm transfer efficiency with Ponceau S staining if necessary [1]
Antibody Incubation and Detection:
- Block membrane with 5% skim milk in TBST for 1 hour at room temperature
- Incubate with primary antibodies (anti-Bax, anti-Bcl-2, anti-β-actin) overnight at 4°C with gentle shaking
- Wash membrane 3× with TBST for 5 minutes each
- Incubate with appropriate HRP-conjugated secondary antibodies for 1 hour at room temperature
- Wash membrane 3× with TBST for 5 minutes each
- Detect protein bands using ECL detection system (e.g., Bio-Rad)
- Perform densitometric analysis using ImageJ software [105] [1]
Western Blot Analysis Workflow
Apoptosis Assessment via Morphological Analysis
Acridine Orange/Ethidium Bromide (AO/EB) Staining:
- After treatment, wash cells with PBS and stain with AO/EB solution (1:1 ratio, 10 µg/mL)
- Incubate for 5-10 minutes at room temperature protected from light
- Visualize using fluorescence microscope (e.g., Olympus BX51) with appropriate filters
- Count at least 200 cells per sample and categorize as:
- Viable cells: uniform green fluorescence
- Early apoptotic: bright green chromatin condensation
- Late apoptotic: orange/red chromatin condensation with nuclear fragmentation [105]
Apoptotic Signaling Pathways in Breast Cancer
The intrinsic apoptotic pathway represents a critical regulatory mechanism in breast cancer cell survival and treatment response. Key proteins in this pathway serve as essential markers for evaluating novel therapeutic approaches.
Apoptotic Signaling Pathway Activation
The Scientist's Toolkit: Research Reagent Solutions
Table 3: Essential Reagents and Materials for Apoptosis Research
| Reagent/Material | Specification | Application | Example Vendor |
|---|---|---|---|
| Primary Antibodies | Anti-Bax, Anti-Bcl-2, Anti-Cleaved Caspase-3, Anti-PARP | Detection of apoptotic proteins by western blot | Multiple suppliers |
| Secondary Antibodies | HRP-conjugated anti-rabbit/mouse IgG | Signal amplification in western blot | Multiple suppliers |
| Cell Culture Media | RPMI-1640 with 10% FBS | Maintenance of breast cancer cell lines | Gibco/Thermo Fisher |
| Apoptosis Detection Kits | AO/EB staining, Annexin V | Morphological assessment of apoptosis | Sigma-Aldrich |
| Protein Extraction | RIPA buffer with protease inhibitors | Cell lysis and protein extraction | Multiple suppliers |
| ECL Detection | Enhanced chemiluminescence substrate | Western blot protein detection | Bio-Rad |
| Electrophoresis | SDS-PAGE gels, nitrocellulose membranes | Protein separation and transfer | Bio-Rad |
| Detection Instrument | iBright Imaging System | Fluorescent and chemiluminescent detection | Thermo Fisher |
Technical Considerations for Publication-Quality Western Blots
Normalization Strategies
For quantitative western blot analysis required in thesis research and drug development applications, proper normalization is essential for accurate data interpretation:
- Total Protein Normalization (TPN): Emerging as the gold standard, TPN normalizes target protein expression to the total protein in each lane, providing superior accuracy over traditional housekeeping proteins [37]
- Housekeeping Protein Limitations: GAPDH, β-actin, and β-tubulin expression can vary significantly with experimental conditions, potentially leading to misinterpretation [37]
- Validation of Linear Range: Ensure detection system operates within linear dynamic range where band intensity directly correlates with protein amount [37]
Data Integrity and Publication Standards
Leading journals increasingly enforce stringent guidelines for western blot data presentation:
- Maintain original, uncropped images for review purposes
- Avoid excessive image manipulation and brightness/contrast adjustments that may obscure data
- Include molecular weight markers in all gel images
- Clearly indicate lane splicing or rearrangements when necessary [37]
This application note demonstrates a comprehensive methodology for validating pro-apoptotic effects in breast cancer research, using the synergistic combination of Prunus armeniaca and bee venom as a case study. The integrated experimental approaches - spanning cytotoxicity assays, morphological analysis, and western blot quantification - provide a robust framework for evaluating novel therapeutic candidates in both academic and drug development settings.
The detailed protocols emphasize critical technical considerations for generating publication-quality data, particularly regarding western blot normalization and validation. These methodologies can be readily adapted to investigate other pro-apoptotic compounds or combination therapies, contributing to the ongoing development of effective treatment strategies for challenging breast cancer subtypes, including triple-negative breast cancer.
Further investigation in in vivo models and expanded molecular profiling would build upon these foundational techniques to advance promising therapeutic candidates toward clinical application.
In the field of cancer research, the accurate detection of apoptosis is fundamental to understanding disease mechanisms and evaluating the efficacy of novel therapeutics. While western blotting provides valuable protein-level information, it is essential to contextualize its performance against other widely used technologies, namely flow cytometry and high-throughput screening assays. This application note provides a systematic comparison of these core apoptosis detection platforms, highlighting their respective strengths, limitations, and optimal applications to guide researchers in selecting the most appropriate methodology for their specific experimental needs. The integration of these complementary techniques provides a more comprehensive understanding of apoptotic processes in cancer biology and drug discovery.
Technology Comparison and Capabilities
Table 1: Comparative Analysis of Key Apoptosis Detection Technologies
| Feature | Western Blotting | Flow Cytometry | High-Throughput Screening Assays |
|---|---|---|---|
| Key Measured Parameters | Protein expression and cleavage events (e.g., caspases, PARP); post-translational modifications [1] | Cell surface changes (PS externalization), caspase activity, mitochondrial membrane potential, DNA content; single-cell analysis [107] [108] | Metabolic activity, caspase activity, viability, redox status; often multiplexed [109] [110] |
| Throughput | Low to medium | Medium to High | Very High (96, 384-well formats) [110] |
| Quantification | Semi-quantitative (densitometry) | Highly Quantitative | Highly Quantitative [109] |
| Information Depth | Pathway-specific protein-level data | Multi-parametric single-cell data | Population-averaged phenotypic data |
| Sample Requirements | Lysates (loses cellular context) | Intact cells (requires single-cell suspension) | Intact cells or lysates |
| Key Advantages | Specificity for protein markers and modifications; ability to detect cleavage fragments [1] | Ability to quantify rare cell populations; distinguishes apoptotic from necrotic cells [107] | Excellent for rapid screening of compound libraries; low reagent volumes [108] |
| Primary Limitations | No single-cell data; requires large cell numbers; semi-quantitative | Limited multiplexing for protein size; complex data analysis | Less specific to apoptosis mechanism; can yield confounding results [109] |
Market Context and Adoption Trends
The apoptosis assay market is experiencing significant growth, valued at USD 2.7 billion in 2024 in North America and projected to reach USD 6.1 billion by 2034, reflecting a compound annual growth rate (CAGR) of 8.4% [111]. This growth is driven by the increasing prevalence of cancer and the demand for personalized medicine. Flow cytometry, a cornerstone technology in this field, held a market size of USD 4.9 billion in 2022 and is widely adopted for its precision and single-cell analysis capabilities [111]. Consumables, including reagents and assay kits, dominate the product segment, valued at USD 1.5 billion in 2024, indicating the extensive routine use of these technologies in pharmaceutical and academic settings [111].
Experimental Protocols for Key Assays
Flow Cytometry-Based Apoptosis Detection (Annexin V/Propidium Iodide)
This protocol details a standard method for distinguishing between live, early apoptotic, late apoptotic, and necrotic cells.
Principle: Annexin V binds to phosphatidylserine (PS), which is externalized to the outer leaflet of the plasma membrane during early apoptosis. Propidium Iodide (PI) is a DNA dye that is excluded from live and early apoptotic cells with intact membranes but stains cells in late apoptosis or necrosis [107].
Reagents:
- Annexin V binding buffer (10 mM HEPES, 140 mM NaCl, 2.5 mM CaCl₂, pH 7.4)
- Fluorescently conjugated Annexin V (e.g., FITC)
- Propidium Iodide (PI) stock solution
Procedure:
- Cell Preparation: Harvest cells (including floating cells) and wash twice with cold PBS.
- Staining: Resuspend ~1x10⁵ cells in 100 µL of Annexin V Binding Buffer.
- Add Annexin V-FITC and PI according to manufacturer's recommendations. Typically, 5 µL of each is sufficient.
- Incubate for 15 minutes at room temperature in the dark.
- Analysis: Add 400 µL of Annexin V Binding Buffer to the tubes and analyze immediately by flow cytometry.
- Use quadrants to distinguish populations: Annexin V-/PI- (live), Annexin V+/PI- (early apoptotic), Annexin V+/PI+ (late apoptotic), and Annexin V-/PI+ (necrotic) [107].
High-Throughput Viability and Apoptosis Assay (Cell Titer Blue)
This protocol uses a metabolic assay to measure cell viability, often coupled with other assays for a more specific apoptosis readout.
Principle: The Cell Titer Blue reagent contains resazurin, a blue compound that is reduced to fluorescent, pink resorufin by metabolically active cells. A reduction in fluorescence signal indicates a loss of viability, which can be a consequence of apoptosis [109].
Reagents:
- Cell Titer Blue Reagent (Promega)
- Cell culture medium without phenol red
Procedure:
- Plating: Plate cells in a 96-well or 384-well plate and treat with compounds for the desired duration.
- Assay: Add Cell Titer Blue Reagent directly to each well (20 µL per 100 µL of medium).
- Incubation: Incubate the plate for 1-4 hours at 37°C, protected from light.
- Detection: Measure fluorescence at 560/590 nm (Ex/Em) using a plate reader.
- Analysis: Normalize fluorescence values to untreated controls to calculate the percentage of viable cells [109].
A Novel Flow Cytometry Assay Using Bodipy-L-Cystine (BFC)
This protocol describes a method to detect early apoptosis by measuring the uptake of a cystine analog, reflecting cellular oxidative stress.
Principle: Under apoptotic stress, cells import more L-cystine via the xCT antiporter to sustain glutathione synthesis for antioxidant defense. BFC, a fluorescent cystine analog, is taken up but not metabolized, allowing quantification of this early stress response by flow cytometry [109].
Reagents:
- Bodipy.FL.L-cystine (BFC)
- Sulfasalazine (xCT antiporter inhibitor, for control experiments)
Procedure:
- Treatment: Induce apoptosis in cells (e.g., with 0.5 µg/mL staurosporine for 6 hours).
- Staining: Harvest cells and stain with 1 nM BFC for 30 minutes at 37°C in the dark [109].
- Inhibition Control (Optional): Co-incubate cells with BFC and 0.15 mM sulfasalazine to confirm xCT-specific uptake.
- Analysis: Wash cells and analyze by flow cytometry. An increase in BFC fluorescence indicates early apoptosis.
Integrated Experimental Workflow and Technology Selection
The following diagram illustrates a logical workflow for selecting and integrating different apoptosis detection technologies based on research goals.
Figure 1. A strategic workflow for selecting apoptosis detection technologies. This diagram guides researchers in choosing the most appropriate initial methodology based on their primary experimental question. The integrated strategy combines the strengths of each technology for a comprehensive analysis.
The Scientist's Toolkit: Key Research Reagent Solutions
Table 2: Essential Reagents and Kits for Apoptosis Detection
| Reagent/Kits | Function/Principle | Primary Application |
|---|---|---|
| Annexin V-FITC/PI Kit | Detects PS externalization (Annexin V) and membrane integrity (PI) to stage cell death [107]. | Flow Cytometry |
| Caspase-3 Control Cell Extracts | Provides positive control (cytochrome c-treated) showing cleaved caspase-3 for assay validation [27]. | Western Blotting |
| Cell Titer Blue | Measures metabolic capacity via resazurin reduction as a indicator of cell viability [109]. | High-Throughput Screening |
| Bodipy.FL.L-cystine (BFC) | Tracks cystine uptake via xCT antiporter as a marker of early oxidative stress in apoptosis [109]. | Flow Cytometry |
| Antibody Cocktails (e.g., ab136812) | Pre-mixed antibodies against multiple apoptosis targets (e.g., caspase-3, PARP) for multiplexed detection [1]. | Western Blotting |
| Jurkat Apoptosis Cell Extracts (Etoposide) | Provides positive control (etoposide-treated) for key apoptotic markers like cleaved PARP and caspases [27]. | Western Blotting |
Western blotting remains an indispensable tool for confirming specific protein modifications within apoptotic pathways, such as caspase activation and PARP cleavage. However, a complete apoptotic profile often requires complementary data from flow cytometry for quantitative, single-cell analysis and from high-throughput assays for rapid screening. The strategic integration of these technologies, as outlined in this application note, empowers cancer researchers and drug development professionals to obtain robust, multi-faceted data on cell death mechanisms, thereby accelerating the discovery and validation of novel anticancer therapies.
Conclusion
Western blot analysis remains an indispensable, robust, and accessible technique for dissecting the complex protein networks that govern apoptosis in cancer research. Its power is magnified when foundational knowledge of key markers is combined with optimized, trouble-shooted protocols and rigorous validation within a broader experimental context. As the field moves towards more personalized medicine and combination therapies, the ability to precisely quantify apoptotic proteins will be crucial for understanding therapeutic mechanisms, discovering novel biomarkers, and ultimately developing more effective and less toxic cancer treatments. Future directions will see Western blotting further integrated with proteogenomic approaches and advanced computational analysis to provide deeper, systems-level insights into cell death signaling.
References
- 1. Apoptosis western blot guide [https://www.abcam.com/en-us/knowledge-center/western-blot/western-blot-analysis-of-apoptosis]
- 2. Apoptosis [https://www.abcam.com/en-us/technical-resources/guides/cell-health-guide/apoptosis]
- 3. The Quantitative-Phase Dynamics of Apoptosis and Lytic ... [https://www.nature.com/articles/s41598-020-58474-w]
- 4. Apoptosis assay and western blot analysis [https://bio-protocol.org/exchange/minidetail?id=370050&type=30]
- 5. Flow cytometry-based apoptosis detection - PMC [https://pmc.ncbi.nlm.nih.gov/articles/PMC3863590/]
- 6. A quantitative real-time approach for discriminating ... [https://pmc.ncbi.nlm.nih.gov/articles/PMC5253725/]
- 7. Why Bax detection in >1400 publications might be flawed [https://pmc.ncbi.nlm.nih.gov/articles/PMC11621539/]
- 8. Bax Antibody #2772 [https://www.cellsignal.com/products/primary-antibodies/bax-antibody/2772?srsltid=AfmBOorlYKDMqlG_f2dxkDVuCNK3y5ZSTkUOE-uhZojTiCO3faoD2n_o]
- 9. Cleavage of CAD by caspase-3 determines the cancer cell ... [https://www.nature.com/articles/s41467-025-60144-2]
- 10. Analysis of tumor protein p53 expression levels in different ... [https://www.nature.com/articles/s41598-025-23713-5]
- 11. Atypical contribution of caspase-3 to melanoma cancer cell ... [https://pmc.ncbi.nlm.nih.gov/articles/PMC12500911/]
- 12. p53 Protein Stability Plays a Crucial Role in NaB-Mediated ... [https://pmc.ncbi.nlm.nih.gov/articles/PMC12384440/]
- 13. An optimized protocol for expression and purification of ... [https://www.frontiersin.org/journals/cell-and-developmental-biology/articles/10.3389/fcell.2023.1322816/full]
- 14. The BCL2 family: from apoptosis mechanisms to new ... [https://www.nature.com/articles/s41392-025-02176-0]
- 15. Inhibiting the inhibitors: Targeting anti-apoptotic proteins in ... [https://www.sciencedirect.com/science/article/abs/pii/S1368764620300418]
- 16. The role of BCL-2 family proteins in regulating apoptosis and ... [https://pmc.ncbi.nlm.nih.gov/articles/PMC9597512/]
- 17. Overcoming Tumor Resistance in CAR‐T‐Cell Therapy - PMC [https://pmc.ncbi.nlm.nih.gov/articles/PMC11459502/]
- 18. The BCL-2 family protein BCL-RAMBO interacts and ... [https://www.nature.com/articles/s41598-023-41196-0]
- 19. Bcl-2 Detection in Western Blotting [https://www.fn-test.com/news/product-news/bcl-2-detection-in-western-blotting/]
- 20. A systematic approach to quantitative Western blot analysis [https://www.sciencedirect.com/science/article/pii/S000326971930750X]
- 21. Bcl-2 (124) Mouse Monoclonal Antibody #15071 [https://www.cellsignal.com/products/primary-antibodies/bcl-2-124-mouse-monoclonal-antibody/15071?srsltid=AfmBOoovQvrsxlzgF7UB7EwVANoyjSo0gW7s2X8L1h6tLOuJoAE6NHcT]
- 22. Bcl-2 dependent modulation of Hippo pathway in cancer cells [https://biosignaling.biomedcentral.com/articles/10.1186/s12964-024-01647-1]
- 23. Apoptosis Assay Market Size Report, 2025 – 2034 [https://www.gminsights.com/industry-analysis/apoptosis-assay-market]
- 24. Overcoming cancer drug resistance: insights into Apoptotic ... [https://pmc.ncbi.nlm.nih.gov/articles/PMC12583045/]
- 25. Apoptosis Assay Market Size, Growth Trends ... [https://www.mordorintelligence.com/industry-reports/apoptosis-assay-market]
- 26. Reactivating apoptotic pathways in cancer: A review of ... [https://www.sciencedirect.com/science/article/abs/pii/S0014299925007198]
- 27. How to Control Your Apoptosis, Autophagy & Mitophagy ... [https://blog.cellsignal.com/control-extracts-for-western-blot]
- 28. iBright Analysis Software | Thermo Fisher Scientific - US [https://www.thermofisher.com/us/en/home/life-science/protein-biology/protein-assays-analysis/western-blotting/detect-proteins-western-blot/western-blot-imaging-analysis/ibright-systems/software.html]
- 29. Automated 1D Gel & Western Blot Analysis Software - TotalLab [https://totallab.com/software/1d-gel-western-blot-analysis-software/]
- 30. Targeting Apoptosis to Overcome Chemotherapy Resistance [https://www.ncbi.nlm.nih.gov/books/NBK580869/]
- 31. Evasion of apoptosis and treatment resistance in ... [https://www.sciencedirect.com/science/article/pii/S0305737224001014]
- 32. Apoptosis Detection: Methods, Assays & Analysis ... [https://www.revvity.com/ask/apoptosis]
- 33. Biomarkers of apoptosis | British Journal of Cancer [https://www.nature.com/articles/6604519]
- 34. Apoptosis, Oxidative Stress, and Pathway Modulation - PMC [https://pmc.ncbi.nlm.nih.gov/articles/PMC12566667/]
- 35. Apoptotic pathway protein expression variance in metal ... [https://pmc.ncbi.nlm.nih.gov/articles/PMC10435268/]
- 36. Technical Design of a Western Blot [https://blog.addgene.org/technical-design-of-a-western-blot]
- 37. 2024 Guide to Quantitative Western Blot Publication [https://www.thermofisher.com/blog/life-in-the-lab/2023-guide-to-quantitative-western-blot-publication/]
- 38. Apoptotic cells promote circulating tumor cell survival and ... [https://www.nature.com/articles/s42003-025-08541-7]
- 39. Restoring apoptosis in breast cancer via peptide mediated ... [https://www.nature.com/articles/s41598-025-24772-4]
- 40. Programmed cell death detection methods: a systematic ... [https://link.springer.com/article/10.1007/s10495-022-01735-y]
- 41. Protease-activated receptor 2 attenuates doxorubicin ... [https://pmc.ncbi.nlm.nih.gov/articles/PMC10713943/]
- 42. Western blot analysis and caspase-3/8 activity assay [https://bio-protocol.org/exchange/minidetail?id=3207437&type=30]
- 43. Sheet Protector Strategy for Western Blot to Reduce ... [https://pmc.ncbi.nlm.nih.gov/articles/PMC12462392/]
- 44. Western Blot: The Complete Guide [https://www.antibodies.com/applications/western-blotting]
- 45. Western blotting guide: Part 3, Electroblotting – Protein ... [https://www.jacksonimmuno.com/secondary-antibody-resource/technical-tips/western-blotting-guide-part-3/]
- 46. Optimizing Protein Transfer and Detection in Western Blotting [https://www.labx.com/resources/optimizing-protein-transfer-and-detection-in-western-blotting/5568]
- 47. When to use Wet, Semi-Dry and Dry Transfers for Western ... [https://azurebiosystems.com/blog/western-blot-transfer-methods/]
- 48. How to Use Western Blot for Apoptosis and Cell Death ... [https://www.linkedin.com/pulse/how-use-western-blot-apoptosis-cell-death-studies-huang-md-phd-y59ye]
- 49. for Antibody : By the user, for the user - PMC validation Western blot [https://pmc.ncbi.nlm.nih.gov/articles/PMC6983856/]
- 50. Structures of p53/BCL-2 complex suggest a mechanism for ... [https://www.nature.com/articles/s41467-023-40087-2]
- 51. Bax-Dependent Caspase-3 Activation Is a Key Determinant ... [https://pmc.ncbi.nlm.nih.gov/articles/PMC6782440/]
- 52. A Guide to Modern Quantitative Fluorescent Western ... [https://pmc.ncbi.nlm.nih.gov/articles/PMC4354265/]
- 53. Analyzing western blots with Image Studio Lite - lukemiller.org [https://lukemiller.org/index.php/2013/02/analyzing-western-blots-with-image-studio-lite/]
- 54. Targeting the p38/MAPK pathway to induce apoptosis [https://www.nature.com/articles/s41598-025-23009-8]
- 55. Curcumin as a therapeutic agent in liver cancer [https://eurjmedres.biomedcentral.com/articles/10.1186/s40001-025-02922-8]
- 56. Therapeutic potential of natural compounds in targeting ... [https://link.springer.com/article/10.1007/s12672-025-03190-y]
- 57. Silymarin plus doxorubicin exerts the anti-hepatocellular ... [https://www.sciencedirect.com/science/article/pii/S0890850825000155]
- 58. Coumestrol induces apoptosis and inhibits invasion in ... [https://www.sciencedirect.com/science/article/pii/S2214750025002094]
- 59. Apigenin inhibits liver cancer via mitochondrial apoptosis ... [https://pubmed.ncbi.nlm.nih.gov/41234482/]
- 60. KLX ameliorates liver cancer progression by mediating ... [https://pmc.ncbi.nlm.nih.gov/articles/PMC12274451/]
- 61. Western Blot Analysis of Apoptosis-Related Proteins [https://bio-protocol.org/exchange/minidetail?id=727246&type=30]
- 62. LARP3 inhibits the apoptosis of hepatocellular carcinoma via ... [https://journals.plos.org/plosone/article?id=10.1371/journal.pone.0317454]
- 63. Analyzing PTM Activation State Using Western Blotting [https://blog.cellsignal.com/tools-for-determining-protein-state]
- 64. Apoptotic cell signaling in cancer progression and therapy [https://pmc.ncbi.nlm.nih.gov/articles/PMC3130501/]
- 65. How to target apoptosis signaling pathways for the ... [https://www.frontiersin.org/journals/oncology/articles/10.3389/fonc.2013.00022/full]
- 66. Western blot protocol [https://www.abcam.com/en-us/technical-resources/protocols/western-blot]
- 67. Guide to western blot quantification [https://www.abcam.com/en-us/knowledge-center/western-blot/western-blot-quantification]
- 68. Quantitative Western Blot Analysis [https://www.thermofisher.com/us/en/home/life-science/protein-biology/protein-biology-learning-center/protein-biology-resource-library/pierce-protein-methods/quantitative-western-blot-analysis.html]
- 69. Western blot protocol for low abundance proteins [https://www.abcam.com/en-us/technical-resources/protocols/western-blot-protocol-for-low-abundance-proteins]
- 70. Western Blot Experimental Design Tips [https://www.cellsignal.com/applications/western-blot-immunoblot/wb-experimental-design-tips?srsltid=AfmBOoqEPdMUkQMl5f65U-FS5bzNgRv7C5SjNcVxcci8B6hXnN1PoKH6]
- 71. Optimization of a Western blot protocol for the detection of ... [https://pubmed.ncbi.nlm.nih.gov/40994889/]
- 72. Increasing Western Blot Sensitivity: 5 Expert Tips [https://synapse.patsnap.com/article/increasing-western-blot-sensitivity-5-expert-tips]
- 73. The 8 Western Blot Failures and How to Prevent Them (2025 ... [https://wildtypeone.substack.com/p/the-8-western-blot-failures-and-how?utm_campaign=post&triedRedirect=true]
- 74. Western Blot Troubleshooting: Non-specific bands [https://azurebiosystems.com/blog/western-blot-troubleshooting-what-to-do-about-non-specific-bands/]
- 75. Western Blot Troubleshooting [https://www.thermofisher.com/us/en/home/life-science/protein-biology/protein-biology-learning-center/protein-gel-electrophoresis-information/western-blot-troubleshooting.html]
- 76. What are the possible causes for nonspecific or diffuse ... [https://www.aatbio.com/resources/faq-frequently-asked-questions/what-are-the-possible-causes-for-nonspecific-or-diffuse-bands-for-my-western-blot-experiment]
- 77. Western Blot: Technique, Theory, and Trouble Shooting [https://pmc.ncbi.nlm.nih.gov/articles/PMC3456489/]
- 78. P53 antibody (10442-1-AP) [https://www.ptglab.com/products/P53-Antibody-10442-1-AP.htm?srsltid=AfmBOopyaAuzWdemjeNxDTPgZE41Agxiejn8u9BkepXpj6F8ZLZkDZMe]
- 79. p53 Antibody #9282 [https://www.cellsignal.com/products/primary-antibodies/p53-antibody/9282?srsltid=AfmBOoqpQn8uTjAh9OgMhPHkT9NCdICGrCVmjW35m7Q4Pkq1oDtE9mub]
- 80. Mutant p53 protein expression and antioxidant status ... [https://pmc.ncbi.nlm.nih.gov/articles/PMC4464499/]
- 81. Anti-p53 antibody. Rabbit Polyclonal. KO tested (ab131442) [https://www.abcam.com/en-us/products/primary-antibodies/p53-antibody-ab131442]
- 82. How to Achieve Quantitative Western Blot Data: a Step-by- ... [https://www.licorbio.com/blog/step-by-step-guide-to-achieving-quantitative-western-blot-data]
- 83. Validating Antibodies for Quantitative Western Blot ... [https://www.nature.com/articles/s41598-018-29436-0]
- 84. Optimization of a Western blot protocol for the detection ... [https://www.sciencedirect.com/science/article/pii/S2475037925003401]
- 85. Detecting Low Abundance Proteins in Western Blotting [https://www.thermofisher.com/us/en/home/life-science/protein-biology/protein-biology-learning-center/protein-biology-resource-library/pierce-protein-methods/detecting-low-abundance-proteins-in-western-blotting.html]
- 86. Quantitative Western Blot Overview [https://bio.licor.com/bio/help/empiria_studio/software/empiria_studio/quantitative-blots/quantitative-blot-overview.html]
- 87. FAM111B knockdown attenuates tumorigenesis of ovarian ... [https://pmc.ncbi.nlm.nih.gov/articles/PMC12335066/]
- 88. Knockout of onecut2 inhibits proliferation and promotes ... [https://pmc.ncbi.nlm.nih.gov/articles/PMC11604872/]
- 89. Apoptosis pathway knockout cell lysates panel (ab275045) [https://www.abcam.com/en-us/products/cell-lysates/apoptosis-pathway-knockout-cell-lysates-panel-ab275045]
- 90. A positive feedback loop between TNS1 and ZEB1 ... [https://www.nature.com/articles/s42003-025-09079-4]
- 91. Enhancing anti-tumor immunity by targeting BATF and the ... [https://link.springer.com/article/10.1007/s00018-025-05792-9]
- 92. 2.7. Western Blot and Apoptosis Analysis [https://bio-protocol.org/exchange/minidetail?id=7570785&type=30]
- 93. In vitro study of effects of hesperetin on human oral cancer ... [https://pmc.ncbi.nlm.nih.gov/articles/PMC11930666/]
- 94. 2.11. Apoptosis Assays by AO/EB Staining and Flow ... [https://bio-protocol.org/exchange/minidetail?id=12336546&type=30]
- 95. Enhancing apoptosis-mediated anticancer activity of ... [https://www.nature.com/articles/s41598-024-51970-3]
- 96. Advancements in proteogenomics for preclinical targeted ... [https://www.eurekalert.org/news-releases/1104164]
- 97. Navigating Cancer Complexity: Integrative Multi-Omics ... [https://pmc.ncbi.nlm.nih.gov/articles/PMC12553891/]
- 98. Abietic Acid Induces DNA Damage and Cell Apoptosis ... [https://pmc.ncbi.nlm.nih.gov/articles/PMC12650274/]
- 99. Apoptosis-inducing proteins with reduced expression in ... [https://www.sciencedirect.com/science/article/pii/S2405580825000184]
- 100. Optimizing reduction of western blotting analytical variations [https://www.sciencedirect.com/science/article/pii/S000326972300163X]
- 101. Bioinformatics mining and experimental validation of ... [https://pmc.ncbi.nlm.nih.gov/articles/PMC12373585/]
- 102. Identification of USP39 as a prognostic and predictive ... [https://bmccancer.biomedcentral.com/articles/10.1186/s12885-025-14096-x]
- 103. Identification of DAP3 as candidate prognosis marker and ... [https://www.frontiersin.org/journals/immunology/articles/10.3389/fimmu.2025.1528853/full]
- 104. Western blotting - Chen Lab [https://uhcancercenter.org/chen-lab-protocols/western-blotting]
- 105. Synergistic antiproliferative and pro-apoptotic effects of ... [https://pubmed.ncbi.nlm.nih.gov/40951357/]
- 106. Synergistic antiproliferative and pro-apoptotic effects of ... [https://www.frontiersin.org/journals/oncology/articles/10.3389/fonc.2025.1647710/full]
- 107. Guidelines for Regulated Cell Death Assays - PubMed Central [https://pmc.ncbi.nlm.nih.gov/articles/PMC7970050/]
- 108. Apoptosis assays for quantifying the bioactivity of ... [https://www.sciencedirect.com/science/article/abs/pii/S1368764610000397]
- 109. Comparison of cell-based assays to quantify treatment ... [https://www.nature.com/articles/s41598-018-34696-x]
- 110. Apoptosis Testing Market Size, Demand & Forecast 2025- ... [https://www.futuremarketinsights.com/reports/apoptosis-testing-market]
- 111. North America Apoptosis Assay Market Trends 2025–2034 [https://www.gminsights.com/industry-analysis/north-america-apoptosis-assay-market]